Watching Videos from Everywhere: a Study of the PPTV Mobile VoD System Zhenyu Li † , Jiali Lin † , Marc-Ismael Akodjenou † , Gaogang Xie † , Mohamed Ali Kaafar ? ‡ , Yun Jin ] , Gang Peng ] † ICT, CAS, China, ‡ INRIA France, ? National ICT Australia, ] PPlive, China {zyli, linjiali, akodjenou, xie}@ict.ac.cn, [email protected], {yunjin, gangpeng}@pptv.com ABSTRACT In this paper, we examine mobile users’ behavior and their corresponding video viewing patterns from logs extracted from the servers of a large scale VoD system. We focus on the analysis of the main discrepancies that might exist when users access the VoD system catalog from WiFi or 3G con- nections. We also study factors that might impact mobile users’ interests and video popularity. The users’ behavior ex- hibits strong daily and weekly patterns, with mobile users’ interests being surprisingly spread across almost all cate- gories and video lengths, independently of the connection type. However, by examining the activity of users individ- ually, we observed a concentration of interests and peculiar access patterns, which allows to classify the users and thus better predict their behavior. We also find the skewed video popularity distribution and demonstrate that the popularity of a video can be predicted using its very early popularity level. We then analyzed the sources of video viewing and found that even if search engines are the dominant sources for a majority of videos, they represent less than 10% (resp. 20%) of the sources for the highly popular videos in 3G (resp. WiFi) network. We also report that both the type of con- nection and the type of mobile device used have an impact on the viewing time and the source of viewing. Using our findings, we provide insights and recommendations that can be used to design intelligent mobile VoD systems and help in improving personalized services on these platforms. Categories and Subject Descriptors C.2.4 [Computer Applications]: Distributed applications; C.4 [Performance of Systems]: Measurement techniques General Terms Measurement, Performance, Human Factors Permission to make digital or hard copies of all or part of this work for personal or classroom use is granted without fee provided that copies are not made or distributed for profit or commercial advantage and that copies bear this notice and the full citation on the first page. To copy otherwise, to republish, to post on servers or to redistribute to lists, requires prior specific permission and/or a fee. IMC’12, November 14–16, 2012, Boston, Massachusetts, USA. Copyright 2012 ACM 978-1-4503-XXXX-X/12/11 ...$15.00. Keywords Mobile VoD, user behavior, video popularity, view source 1. INTRODUCTION The advanced wireless technologies (e.g. WiFi, 3G and 4G) and smart mobile devices (e.g. iPad, iPhone, Android systems) enable users to watch Internet videos from almost everywhere. Today video content providers often, if not al- ways, offer client applications that can be installed on mobile users’ tablets and smart phones, making the video viewing ubiquitous and contributing to the growing popularity of mobile video services. A recent report [1] indicated an increase of 50% of the global mobile video traffic in 2011 compared to the previous year, and expected that the volume of video traffic will reach 25 times its current volume by 2016. Video providers natu- rally strive to meet such a huge demand through the design of better system architectures. Understanding the current system’s artifacts, e.g. users’ behavior, viewing patterns and trends of video popularity is of tremendous importance to design and optimize the efficiency of the systems, from the consumption of network resources to the economic models. User- and video-related trends are two key factors combin- ing to influence the day-to-day performance of the VoD dis- tribution network. Analyzing and predicting these factors is highly valuable to build scalable and robust distribution networks and caching systems. There have been several measurement studies on landline based video systems, e.g. [15][14][5] for VoD systems, [10] for P2P VoD systems, [9] for P2P live streaming, [3] and [7] for IPTV systems. However, the observations reported so far may not be applicable to mobile video systems because of mobility-related constraints, limited bandwidth and small screen size of mobile devices. For example, Li et al. [12] found that viewing patterns in mobile TV systems are dif- ferent from those observed in landline-based TV broadcast and VoD systems. In this paper, we analyze mobile users’ viewing behav- ior and video consumption patterns using a unique dataset extracted from the servers’ logs of PPTV, a leading video provider in China offering both live streaming and VoD ser- vices. The dataset spans over 14 days in December 2011 and consists in a collection of approximately 86 million videos requests generated by more than 3.5 million users. This
Transcript
Watching Videos from Everywhere: a Study of the PPTVMobile VoD System
Zhenyu Li†, Jiali Lin†, Marc-Ismael Akodjenou†,Gaogang Xie†, Mohamed Ali Kaafar ? ‡, Yun Jin], Gang Peng]
†ICT, CAS, China,‡INRIA France, ?National ICT Australia,
ABSTRACTIn this paper, we examine mobile users’ behavior and theircorresponding video viewing patterns from logs extractedfrom the servers of a large scale VoD system. We focus onthe analysis of the main discrepancies that might exist whenusers access the VoD system catalog from WiFi or 3G con-nections. We also study factors that might impact mobileusers’ interests and video popularity. The users’ behavior ex-hibits strong daily and weekly patterns, with mobile users’interests being surprisingly spread across almost all cate-gories and video lengths, independently of the connectiontype. However, by examining the activity of users individ-ually, we observed a concentration of interests and peculiaraccess patterns, which allows to classify the users and thusbetter predict their behavior. We also find the skewed videopopularity distribution and demonstrate that the popularityof a video can be predicted using its very early popularitylevel. We then analyzed the sources of video viewing andfound that even if search engines are the dominant sourcesfor a majority of videos, they represent less than 10% (resp.20%) of the sources for the highly popular videos in 3G (resp.WiFi) network. We also report that both the type of con-nection and the type of mobile device used have an impacton the viewing time and the source of viewing. Using ourfindings, we provide insights and recommendations that canbe used to design intelligent mobile VoD systems and helpin improving personalized services on these platforms.
Categories and Subject DescriptorsC.2.4 [Computer Applications]: Distributed applications;C.4 [Performance of Systems]: Measurement techniques
General TermsMeasurement, Performance, Human Factors
Permission to make digital or hard copies of all or part of this work forpersonal or classroom use is granted without fee provided that copies arenot made or distributed for profit or commercial advantage and that copiesbear this notice and the full citation on the first page. To copy otherwise, torepublish, to post on servers or to redistribute to lists, requires prior specificpermission and/or a fee.IMC’12, November 14–16, 2012, Boston, Massachusetts, USA.Copyright 2012 ACM 978-1-4503-XXXX-X/12/11 ...$15.00.
KeywordsMobile VoD, user behavior, video popularity, view source
1. INTRODUCTIONThe advanced wireless technologies (e.g. WiFi, 3G and
4G) and smart mobile devices (e.g. iPad, iPhone, Androidsystems) enable users to watch Internet videos from almosteverywhere. Today video content providers often, if not al-ways, offer client applications that can be installed on mobileusers’ tablets and smart phones, making the video viewingubiquitous and contributing to the growing popularity ofmobile video services.
A recent report [1] indicated an increase of 50% of theglobal mobile video traffic in 2011 compared to the previousyear, and expected that the volume of video traffic will reach25 times its current volume by 2016. Video providers natu-rally strive to meet such a huge demand through the designof better system architectures. Understanding the currentsystem’s artifacts, e.g. users’ behavior, viewing patterns andtrends of video popularity is of tremendous importance todesign and optimize the efficiency of the systems, from theconsumption of network resources to the economic models.User- and video-related trends are two key factors combin-ing to influence the day-to-day performance of the VoD dis-tribution network. Analyzing and predicting these factorsis highly valuable to build scalable and robust distributionnetworks and caching systems.
There have been several measurement studies on landlinebased video systems, e.g. [15][14][5] for VoD systems, [10]for P2P VoD systems, [9] for P2P live streaming, [3] and [7]for IPTV systems. However, the observations reported so farmay not be applicable to mobile video systems because ofmobility-related constraints, limited bandwidth and smallscreen size of mobile devices. For example, Li et al. [12]found that viewing patterns in mobile TV systems are dif-ferent from those observed in landline-based TV broadcastand VoD systems.
In this paper, we analyze mobile users’ viewing behav-ior and video consumption patterns using a unique datasetextracted from the servers’ logs of PPTV, a leading videoprovider in China offering both live streaming and VoD ser-vices. The dataset spans over 14 days in December 2011 andconsists in a collection of approximately 86 million videosrequests generated by more than 3.5 million users. This
unique dataset enables us to dig into both mobile users’behavior and video consumption patterns. From a user be-havior perspective, we focus on temporal patterns, viewingtime, user interests and individual users’ activity, while forvideo-related patterns, we analyze the level of video pop-ularity and sources of video viewing. We are particularlyinterested in identifying the impact of types of connectionand mobile device on these metrics. Our main findings andobservations are summarized as follows:
• We observe that the behavior of users shows strong dailyand weekly patterns, with a relatively short viewing time.Longer viewing times are associated with the use of WiFirather than 3G and with the use of tablets (e.g. iPad)compared to smart phones (e.g. iPhone). We also founda surprisingly high number of requests of long videosfrom 3G users. The completion rate (i.e. the viewingtime normalized by the video length) for short videosis on average around 0.5, with lower rates observed forlong videos. This is however varying with the time ofthe day, as we observed that completion rates are muchhigher during evenings and late nights.
• We analyze the activity of individual users by aggre-gating the number of views and find that it follows astretched exponential distribution model. The stretchedfactor is correlated with the connection type. Interest-ingly, the users viewing videos through a mix of bothWiFi and 3G connections watch a higher number of videosthan those using exclusively one type of connection.
• We study the interests of users according to video cate-gory and found that such interests vary over the courseof the day. The interests are also correlated with geo-locations. In general, individual users generally requestand view videos from only a few categories, pointing toa high concentration of users’ interests.
• We measure that 10% of the requested set of top pop-ular videos attracted more than 80% of the views, inaccordance with the Pareto principle (“a minor propor-tion of causes generate a major proportion of effects”).Although the observation period of 14 days is relativelyshort to assess general behavior of video popularity dis-tributions, we find a high correlation between the amountof early viewing of videos and their near-future popular-ity, especially for animation videos and variety shows.
• We finally observe that even though the view source isdependent on the type of access to the network, overallthe category page is the primary source of views and isoften used to request highly popular videos. Anothersource is the PPTV video search engine which is themain source of views for more than half of the total videocatalog, especially for low-popularity videos. The videosearch engine thus contributes to the diversity of videoviews.
In the light of these results, it is desirable that the researchcommunity investigates the inclusion of several features intothe design of intelligent mobile VoD systems. Firstly, thePareto principle of video popularity indicates that it mightbe necessary for content delivery networks (CDNs) to cacheonly the 10% top popular videos, since they contribute tomore than 80% of the views. The high correlation coefficientbetween early view records of videos and their popularitycan be used to decide whether a video should be cached just
a few hours after its release. Secondly, it is important tonotice that the effectiveness of the cache can be optimizedby allocating most of the capacity to store the first chunksof videos, since the normalized viewing time of the vast ma-jority of views is low. Thirdly, despite the variety of users’behaviors, users’ interests reside in a few categories only,which could be leveraged to design efficient recommenda-tion systems and targeted advertisement. Finally, the typesof connection and mobile device should be considered as im-portant factors. The CDN can better predict the peculiarbehavior of its mobile users by taking these factors into ac-count and thus optimize further the placement of serversand the routing strategies.
The remaining of this paper is organized as follows: Sec-tion 2 describes the dataset. In Section 3, we perform anin-depth analysis of users’ behavior. Section 4 examinesvideo popularity patterns, followed by an analysis of viewingsource in Section 5. In section 6, we evaluate the design ofa caching system that uses the observations we made. Wediscuss the related work in Section 7. Section 8 concludesour work.
2. DATASET
2.1 Dataset DescriptionOur dataset was collected from the log servers of PPTV1,
a leading video content provider offering live streaming andVoD services in China. PPTV provides free access to 22categories of videos, including movies, TV series, animationor variety shows. Users can view videos either through aWeb browser or through a free client application available forvarious types of mobile devices (e.g. iPad, iPhone, Androidpads and Android phones).
Table 1: Main fields of logs
Field Example
Timestamp 13:10:01 Dec. 4 2011Geo-location BJ, SH, overseas, etc.Connection type WiFi, 3G or unknownUser ID 33ab8c95437fdFile name Tom and Jerry episode1.mp4Video category Movie, TV series, animationDevice iPhone, iPad, Android phone, etc.Viewing time 55 secondsViewing source video search, category page, etc.Streaming type VoD, live
Since most of the views of mobile accesses are generated bymobile devices-based software (as opposed to web browsers),we only consider the views records from the software. Arecord of each view is kept on the log servers after its end.Table 1 lists an example of the main fields contained in thelogs.
The timestamp field is formatted as GMT+8 (Beijing’stime zone). The geo-location field can refer to one of theprovinces in mainland China, Hongkong-Macao-Taiwan oran overseas location. Connection type has three possiblevalues: WiFi, 3G and unknown. A unique user ID is gener-ated when a client application is installed on a mobile device.Note that it is possible for some users to share a device (e.g.
1http://www.pptv.com/
members of the same household). Thus a user in this paperrelates to a client application which may correspond to dif-ferent users sharing the same device. The video name fieldcontains a unique identifier of the video in the PPTV sys-tem. The viewing time field contains the duration of a viewin seconds, not including the possible pauses in viewing. Fi-nally, the viewing source field identifies how users discovervideos, i.e. category page, video search, recent views, rec-ommendation, favorite, top popular videos, cover and nextepisode.
We uniformly sampled the logs of VoD and live streamingrequests that came from the client application on mobiledevices for a period spanning two weeks from Dec. 1st,2011 to Dec. 14th, 2011. Overall we collected 111,702,242view logs, out of which 108,851,161 views are VoD requests.By filtering out the logs with unknown connection type, thedata finally contained 86,521,403 logs, with a proportion of92.58% access with a WiFi connection and 7.42% via a 3Gconnection. These views were generated by 3,759,129 userswatching 427,316 unique videos. Hereafter, we will refer tothis final filtered dataset as the mobile dataset and use itas the base of our analysis.
Table 2: Dataset statistics
Access % of views frommethod Tablets Smart phones others
(iPad+aPad) (iPhone+aPhone)3G 5.37 94.63 ∼0
WiFi 44.89 55.10 0.01WiFi+3G 42.08 57.91 0.01
Table 2 shows the distribution of views generated by dif-ferent types of mobile devices. Almost all the views arefrom four types of mobile devices, i.e. iPad, iPhone, An-droid pad and Android phone (the latter two are abbrevi-ated aPad and aPhone in this paper). The number of viewsfrom smart phones and tablets is similar when a WiFi con-nection is used while for 3G accesses most of the views comefrom smart phones.
2.2 LimitationsThe dataset contains 14 days of viewing logs. This rel-
atively short period of does not allow us to fully observeusers’ behavior and videos’ consumption patterns, as theseries of viewing rates and video popularity trends usuallyspan larger time scales. Besides, the dataset is a uniformsample and not a total collection of logs. We will thus fo-cus on normalized values and avoid metrics that might beaffected by a sampling bias.
Another limitation is that the dataset does not containdetailed video attributes, such as video length, video up-loading time, video tags, bit rate or others. Among theseattributes, video length is certainly one of the most impor-tant for the analysis of viewing time. In order to obtainthis information, we used another large sample of viewinglogs from the Web portal of PPTV (with 91 million entries,mostly from PCs). In this Web sample the video length isincluded, along with an identifier for the video file with thesame format as in our mobile dataset. We were thus ableto obtain the length of 268,867 videos that were containedin both samples. Although these videos only cover 62.9% of
the unique videos in mobile dataset, they still account foraccount 95.8% of the views.
Finally, even though the viewing behavior during user’smobility would be of interest in this work, the dataset doesnot contain such information.
3. USERS’ BEHAVIOR AND INTERESTSWe analyze in this section both aggregated viewing be-
havior and individual behavior of the users, and discuss theimplications of our key observations.
3.1 Daily and Weekly PatternsSystem designers need insights on the workload of the
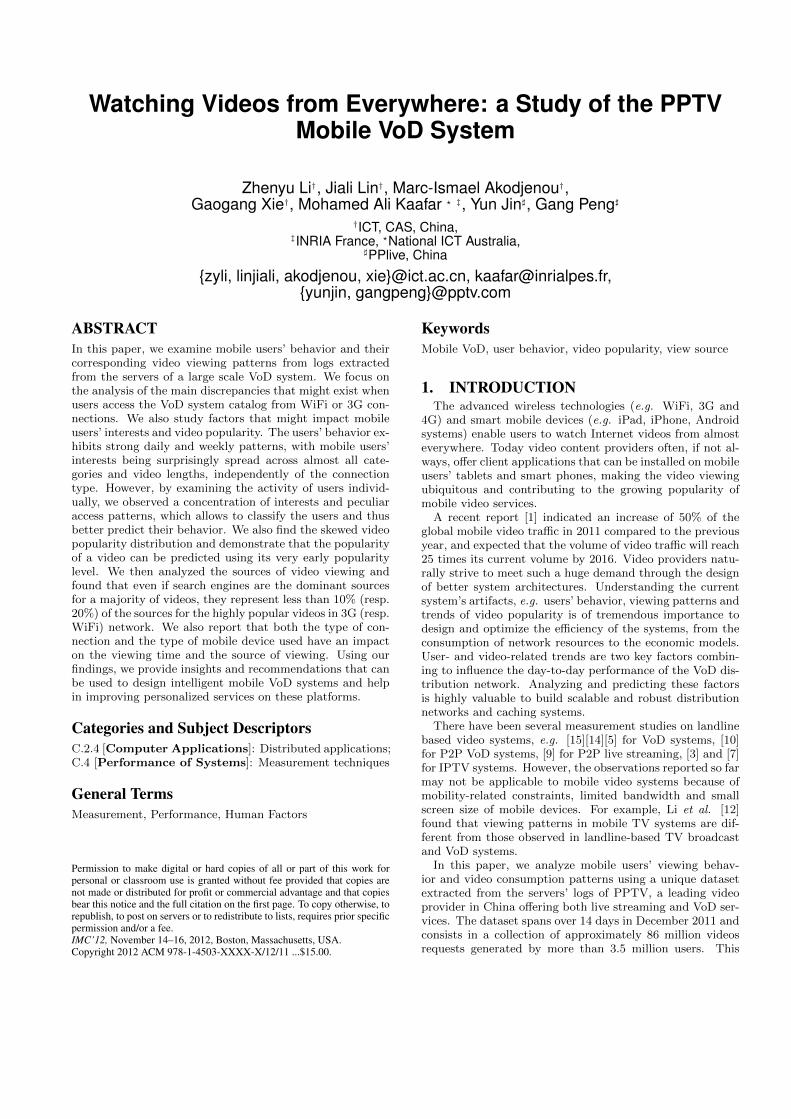
systems to perform adequate capacity design. In this article,we define workload as the number of video requests to thesystem. Figure 1 plots the variation of this workload overtime, for both WiFi and 3G connection types. Each of thetwo curves is produced in the following way: we aggregatethe number of views with a bin for each hour and countedthe number of views of the same hour of week. Finally thenumber of views per hour is normalized by the total numberof views through WiFi and 3G, respectively. Note that sincethe total number of views through WiFi is different fromthe number of views through 3G, one cannot quantitativelycompare the two curves.
Mon Tue Wed Thu Fri Sat Sun0
0.5
1
1.5
Time
Pe
rc.
of
vie
ws (
%)
WiFi 3G
Figure 1: Weekly patterns of access using WiFi and 3G
Both WiFi and 3G workloads exhibit strong daily andweekly patterns. The lowest level of workload happens be-tween 5AM and 7AM every day. The number of viewsreaches its first minor peak at 1PM in weekdays and at 2PMin weekends. The peak of day is observed around 11PM dur-ing both weekdays and weekends. We also observe that thenumber of views in the afternoon of the weekends is muchhigher than weekdays for both WiFi and 3G workloads.
Comparing 3G and WiFi workload patterns is also en-lightening. The gap between the first minor peak (around1PM) and the peak of the day (around 11PM) in WiFi net-work is much larger than that in 3G network, especially inweekends. The most probable reason is that the peak ofthe day happens during nights when users are most likely athome, thus favoring WiFi to obtain a better quality of videostreaming and to save cost.
The daily pattern is similar to the one observed in landline-based VoD systems [10]. However the weekly pattern weobserved is different from mobile TV systems [12], where forthe 3G connections the viewing pattern of the weekend wasalmost the same as the pattern of the weekdays.
3.2 Video Viewing Time
1s 10s 2min 7min 22min45min0
0.01
0.02
0.03F
rac. of vie
ws
1s 10s 2min 7min 22min45min0
0.01
0.02
0.03
Fra
c. of vie
ws
Viewing time
WiFi
3G
Movie trailorShort variety show
Animation
TV series
Figure 2: Distribution of viewing time via WiFi and 3Gconnections
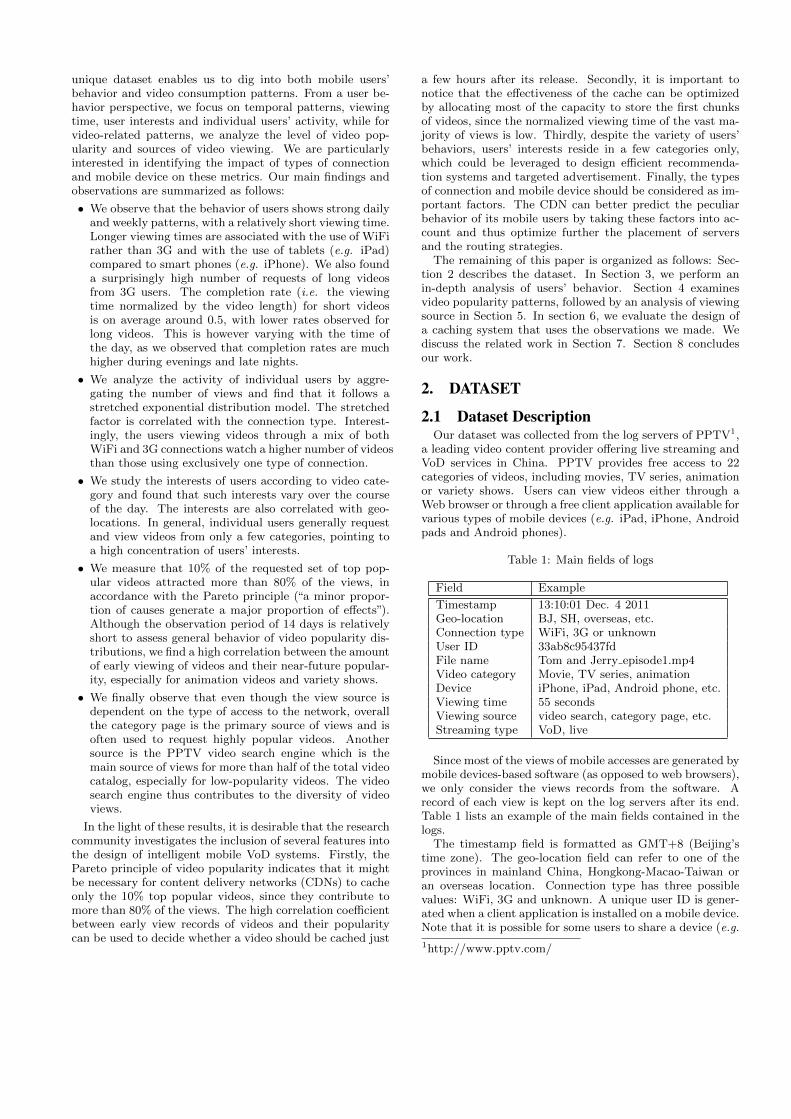
Viewing time is another indicator of workload, which canbe also used for cache policy design. In particular, if mostof the views last only a few minutes, it would be efficientto cache the first chunks of videos in content delivery net-works (CDNs) so as to maximize the effectiveness of systemstorage.
Figure 2 shows the histogram distribution of viewing timefor WiFi and 3G connection types. The y-axis is the normal-ized number of views. For both connection types, a consider-able fraction of views last less than 10 seconds and generally,the number of views decreases with the growth of viewingtime. There are noticeable peaks around 2 minutes, 7 min-utes, 21 minutes and 45 minutes in both distributions. Theycorrespond to typical video length for the following types ofvideos: movie trailer, short variety shows, animation andTV series. The peaks correspond to users watching entirelythese types of videos. The variations in 3G viewing timedistribution are not as marked as in the WiFi viewing time,indicating there are fewer users watching full videos in 3G. Apossible reason is that the 3G network has a relatively lowerspeed and obviously higher cost. Another possible reason isthe limited power capacity of smart phones, which make upthe most of the views via 3G connections as shown in Table2.
Table 3: Cumulative distribution of viewing time
0 s 10s 1 min 10 min 20 minWiFi 23.9% 32.3% 48.7% 74.4% 83.8%3G 42.7% 54.5% 67.5% 88.5% 94.1%
Table 3 summarizes the cumulative distribution of viewingtime. The number of views with 0 seconds is considerablylarge, especially for views via 3G. 32.3% of the views viaWiFi connections and 54.5% via 3G connections last lessthan 10 seconds. These figures can be attributed to thelow access speed or to the poor rendering quality of mobiledevices, with which users would quickly abandon the viewingof the video. Examining the views with longer durations, wefind that only 26% of views via either WiFi or 3G last morethan 10 minutes.
We further evaluate the impact of mobile devices on view-ing time in Table 4. We only consider views via WiFisince views are more evenly distributed on tablets and smartphones as shown in Table 2. Views from tablets tend tolast longer than those from smart phones. This may beexplained by the smaller screen size and lower power capac-
ity of smart phones. We also observe a small proportionof views with very long viewing time, often caused by theviewing of movies and TV series. Additionally, we find thatviews from Android phones last longer than the views fromiPhones. While Android phones have various types of hard-ware with various screen sizes and battery capacities, alliPhones have the same type of hardware. Some Androidphones with larger screens or longer battery life may offerbetter video streaming quality than iPhone, which in turncontributes to making the viewing time longer. We concludethat the types of connection and mobile device impact theviewing time, with the larger screen size and longer batterylife being possible factors lengthening the viewing time.
Table 4: Impacts of devices on viewing time (WiFi)
Device 50th prctile (s) 95th prctile (min)iPad 121 45.1
iPhone 44 34.7aPad 80 45.8
aPhone 58 42.8
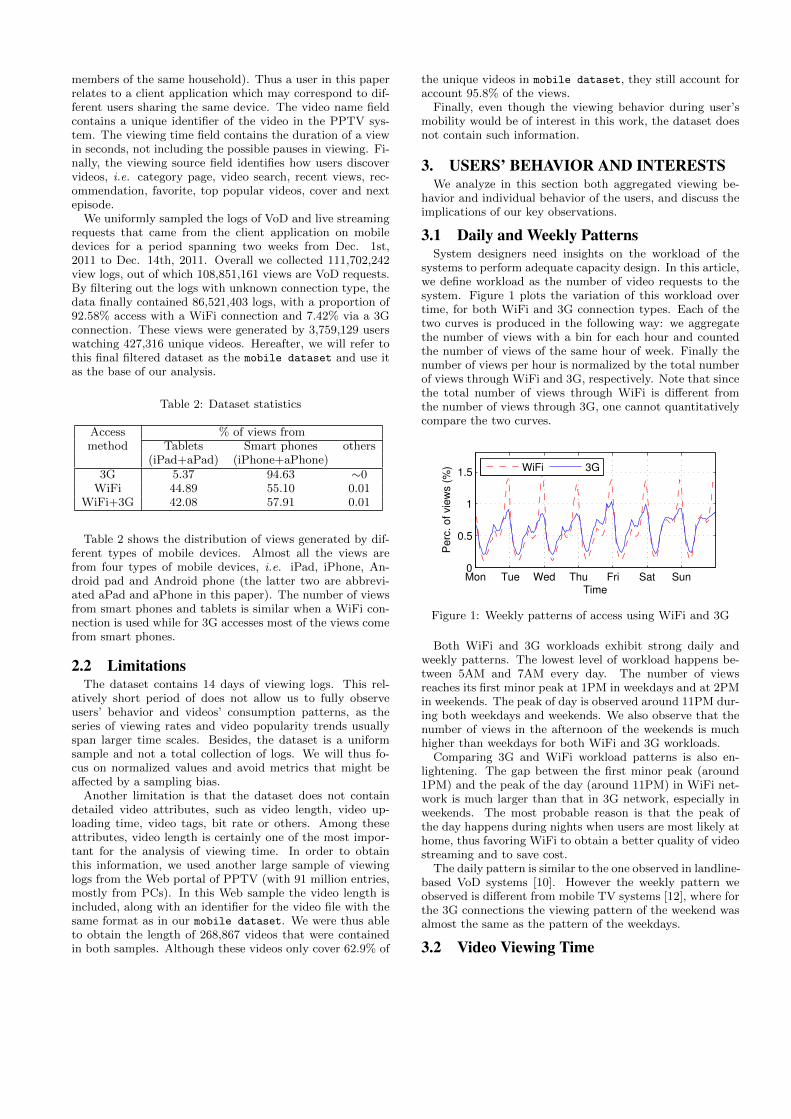
3.3 Normalized Viewing TimeThe viewing time is also affected by video length, which
varies from several seconds to more than 2 hours. In orderto have a better grasp of how complete are the viewings,we define a rate of completion of a video as the normalizedviewing time (NVT), which is the ratio of the viewing timeto the total length of the video. By definition, NVT can alsobe considered as a good indicator of the user’s interest in avideo.
1m 7m 20m 40m 1h 2h 3h0
0.2
0.4
0.6
0.8
Video length
Norm
aliz
ed v
iew
ing tim
e
WiFi: 50th prctile
WiFi: average
3G: 50th prctile
3G: average
Figure 3: Normalized viewing time against video length
We bin the views by video length in minutes and computethe average and median NVT for each bin. Figure 3 showsthe NVT against video length for WiFi and 3G connectiontypes. As expected, the NVT for WiFi is larger than for 3G.It is however interesting to notice that the NVT for WiFi and3G share similar patterns. In general, the NVT for shortervideos is higher than longer videos. For example with WiFiconnections, while the NVT is around 0.4 for videos withlength smaller than 12 minutes, it is only around 0.1 forthose longer than 1.5 hours. We also observe several abruptvariations as the video length increases. The most noticeableis around the 7-minute length (the typical length for shortvariety shows). The median NVT value with length around7 minutes even reaches 0.7 for WiFi connections.
Yu et al. [15] found that in landline-based VoD systems,the viewing time is inversely proportional to the popularityof videos. We observe similar behavior in the PPTV mobile
VoD systems as shown in Table 5. Regardless of the con-nection type, on average, the NVT grows with the decreaseof video popularity. With WiFi connections the NVT growsfrom 0.205 for the top 0.5% of videos to 0.336 for all videos;with 3G connections the NVT grows from 0.074 for top 0.5%videos to 0.229 for all videos.
4 8 12 16 18 24 4 8 12 16 18 24
0.2
0.25
0.3
0.35
Time in hour
Avera
ge N
VT
Fri., Dec. 2 Sat., Dec. 3
Figure 4: Normalized viewing time evolution over time ofday
We further examine the evolution of NVT over time ofdays for WiFi connections in Figure 4. Note that the evo-lution of NVT for 3G networks exhibits the same trend asfor the WiFi connections. Views are binned by 5-minutetime frames and then the average of each bin is computed.Figure 4 shows the results for two days. We observe thatthe average NVT in early morning is higher than in othertime of days, which is consistent with what was observed inmobile TV systems [12]. The NVT remains stable duringday time and reaches its minimum in the evening.
3.4 User InterestInternet video providers often store popular videos accord-
ing to users’ interest on CDN servers close to users. Thestorage locations of a video should be chosen by taking intoaccount several factors, including the variation of users’ in-terests over time and users’ geo-locations. Here we measureuser interest using the categories of the videos that the userswatched.
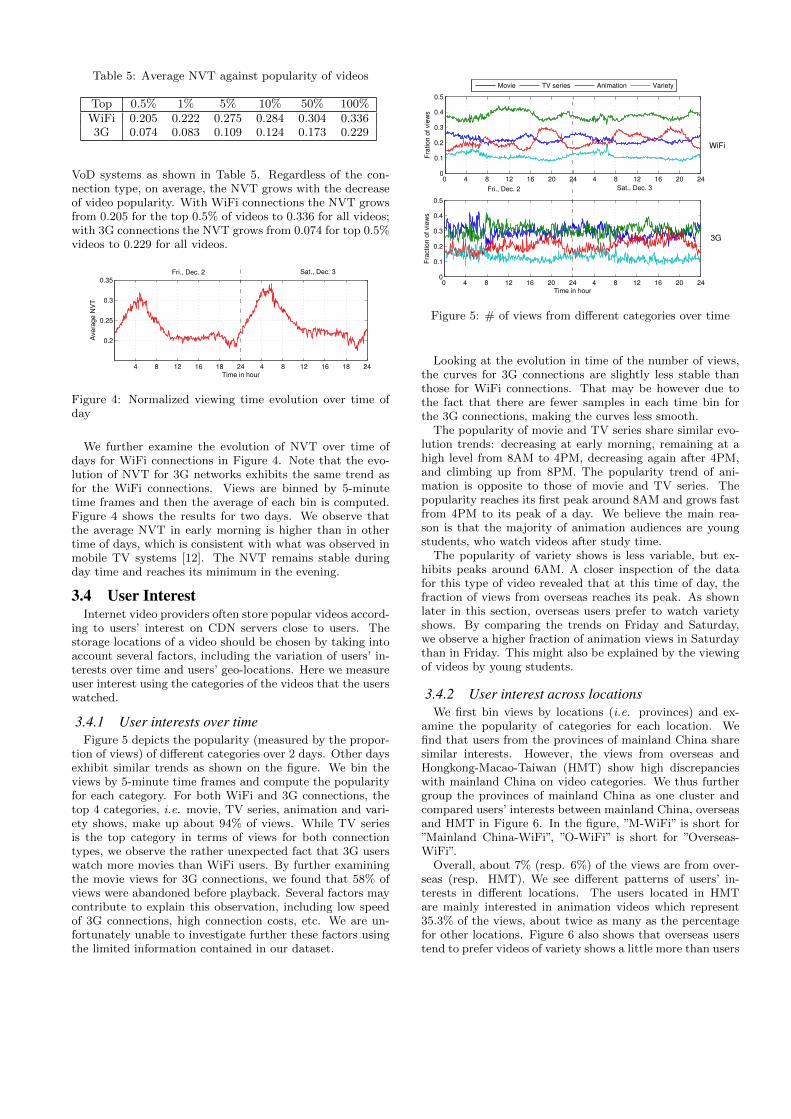
3.4.1 User interests over timeFigure 5 depicts the popularity (measured by the propor-
tion of views) of different categories over 2 days. Other daysexhibit similar trends as shown on the figure. We bin theviews by 5-minute time frames and compute the popularityfor each category. For both WiFi and 3G connections, thetop 4 categories, i.e. movie, TV series, animation and vari-ety shows, make up about 94% of views. While TV seriesis the top category in terms of views for both connectiontypes, we observe the rather unexpected fact that 3G userswatch more movies than WiFi users. By further examiningthe movie views for 3G connections, we found that 58% ofviews were abandoned before playback. Several factors maycontribute to explain this observation, including low speedof 3G connections, high connection costs, etc. We are un-fortunately unable to investigate further these factors usingthe limited information contained in our dataset.
0 4 8 12 16 20 24 4 8 12 16 20 240
0.1
0.2
0.3
0.4
0.5
Fra
tion o
f vie
ws
3G
WiFi
0 4 8 12 16 20 24 4 8 12 16 20 240
0.1
0.2
0.3
0.4
0.5
Time in hour
Fra
ction o
f vie
ws
Movie TV series Animation Variety
Fri., Dec. 2 Sat., Dec. 3
Figure 5: # of views from different categories over time
Looking at the evolution in time of the number of views,the curves for 3G connections are slightly less stable thanthose for WiFi connections. That may be however due tothe fact that there are fewer samples in each time bin forthe 3G connections, making the curves less smooth.
The popularity of movie and TV series share similar evo-lution trends: decreasing at early morning, remaining at ahigh level from 8AM to 4PM, decreasing again after 4PM,and climbing up from 8PM. The popularity trend of ani-mation is opposite to those of movie and TV series. Thepopularity reaches its first peak around 8AM and grows fastfrom 4PM to its peak of a day. We believe the main rea-son is that the majority of animation audiences are youngstudents, who watch videos after study time.
The popularity of variety shows is less variable, but ex-hibits peaks around 6AM. A closer inspection of the datafor this type of video revealed that at this time of day, thefraction of views from overseas reaches its peak. As shownlater in this section, overseas users prefer to watch varietyshows. By comparing the trends on Friday and Saturday,we observe a higher fraction of animation views in Saturdaythan in Friday. This might also be explained by the viewingof videos by young students.
3.4.2 User interest across locationsWe first bin views by locations (i.e. provinces) and ex-
amine the popularity of categories for each location. Wefind that users from the provinces of mainland China sharesimilar interests. However, the views from overseas andHongkong-Macao-Taiwan (HMT) show high discrepancieswith mainland China on video categories. We thus furthergroup the provinces of mainland China as one cluster andcompared users’ interests between mainland China, overseasand HMT in Figure 6. In the figure, ”M-WiFi” is short for”Mainland China-WiFi”, ”O-WiFi” is short for ”Overseas-WiFi”.
Overall, about 7% (resp. 6%) of the views are from over-seas (resp. HMT). We see different patterns of users’ in-terests in different locations. The users located in HMTare mainly interested in animation videos which represent35.3% of the views, about twice as many as the percentagefor other locations. Figure 6 also shows that overseas userstend to prefer videos of variety shows a little more than users
M−WiFi M−3G HMT−WiFi HMT−3G O−WiFi O−3G0
0.2
0.4
0.6
0.8
1
Bre
akd
ow
n o
f ca
teg
ory
po
pu
larity
Movie TV Animation Variety Others
Figure 6: Popularity of categories across locations
from other locations. The users from mainland China on theother hand favor TV series.
While the impact of the connection type on HMT mea-surements seems very limited, it is clear that 3G users inmainland China and overseas favor viewing movies morethan users with WiFi connections. This observation is con-sistent with the insight offered by Figure 5.
3.5 Activity of Individual UsersUnderstanding individual user behavior is key for the de-
sign of recommendation systems and targeted advertisement.In our dataset, users are identified by a unique user ID inthe log entries. We divide users into 3 categories accordingto their connection types, i.e. WiFi, 3G and mixed-accessusers. WiFi and 3G users are defined as those viewing videosexclusively through either connection type during the obser-vation period, while a mixed-access user is defined as onewho accessed used each connection type at least once.
Table 6 gives the number of users for the 3 categories andshows statistics for individual user activity. The number ofviews is aggregated for individual users from the dataset.We observe that the number of WiFi users is one order ofmagnitude greater than that of 3G and mixed-access users.WiFi users view twice as many videos as 3G users. Formixed-access users, the median number is about one orderof magnitude larger than that for 3G users.
Table 6: Statistics for individual user activity
% of # of views (percentile)users 50th 95th
WiFi 83.57 6 893G 8.49 3 39
Mixed 7.94 27 186
3.5.1 Per user NVT analysis
100
101
102
103
104
0
0.2
0.4
0.6
# of views
No
rma
lize
d v
iew
ing
tim
e
WiFi
3G
Mixed
Figure 7: Average NVT against number of views
We focus now on the possible correlation between thenumber of views and the normalized viewing time for in-dividual users. We bin users by their number of views andcompute the average NVT for each bin. In Figure 7, the re-lationship between the number of views and the NVT showsan interesting feature. The measured NVT grows with thenumber of views but the growth seems to stop when thenumber of views reached a level of 100 views. Above thislevel the average NVT is more dispersed, but the relationis globally reversed as the average NVT decreases with thenumber of views.
3.5.2 Distribution of user activity
0 0.2 0.4 0.6 0.8 10
0.2
0.4
0.6
0.8
1
Normalized user rank
Vie
ws/tim
e s
hare
d b
y r
ank >
= x
# of views
Agg. viewing time
Figure 8: Rank distribution for users’ activities
User activity can be quantified with our dataset throughthe per-user viewing time and the number of views. Weexamine the rank distribution of users for both viewing timeand aggregated number of views and plotted the results inFigure 8. The figure gives the important insight that the top20% of the users generated 75% of the views and 80% of theviewing time. Since viewing time can be directly mapped tosystem workload, it means 80% of the workload is generatedby 20% of users, following the Pareto principle.
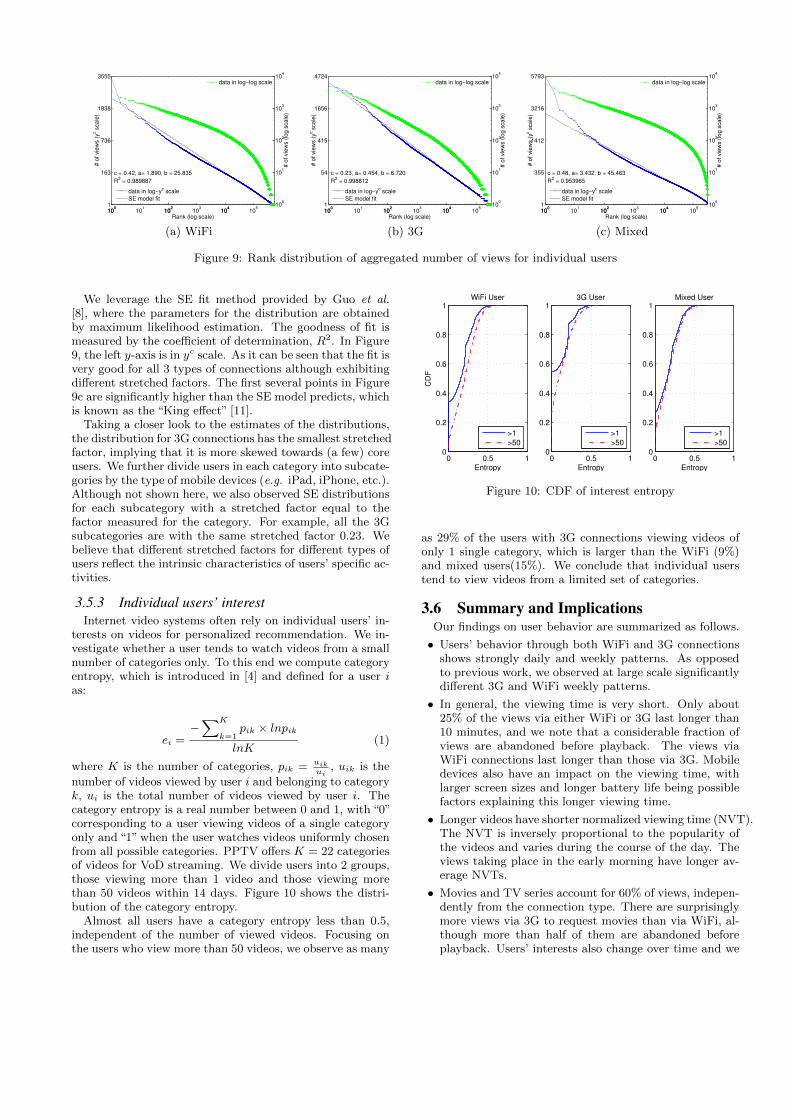
We next examine the activity distribution per category ofusers. We sort the users according to the number of viewsin a descending order, doing this for each category. Wethen plot the rank distribution of individual users’ activityin Figure 9, i.e. rank index i versus the number of viewsmade by the i-th ranked user. Note that the x-axis and theright y-axis are in logarithmic scale.
The well-known power law rank distribution would be ob-served as a straight line in log-log scale. It can be seen onFigure 9 that the rank distribution for the three connectiontypes WiFi, 3G and mixed-access significantly deviate fromsuch a straight line. We can clearly see a flat head and a thintail, showing that the distributions do not follow a power lawmodel.
Laherrere et al. [11] suggest a stretched exponential (SE)distribution, also known as the complementary Weibull dis-tribution, to model such a deviation from the straight line ina log-log plot. The complementary cumulative distributionfunction (CCDF) of the stretched exponential (SE) distribu-
tion is given as P (X ≥ x) = e−( x
x0)c
, where c is the stretchedfactor and x0 is a constant parameter. In the rank-orderingtechnique, N objects are ranked in a descending order oftheir reference numbers. Then P (X ≥ xi) = i/N , where i(1 ≤ i ≤ N) is the number objects with reference numberslarger or equal to xi. That is log(i/N) = −( x
x0)c. By sub-
stituting xi for yi, we have yic = −a log i+ b, where a = x0
c
and b = y1c. The log-yc plot of ranked data following a SE
distribution should be a straight line.
100
101
102
103
104
105
1
163
736
1838
3555
Rank (log scale)
# o
f vie
ws (
yc s
ca
le)
c = 0.42, a= 1.890, b = 25.835
R2 = 0.989887
100
102
104
100
101
102
103
104
# o
f vie
ws (
log
sca
le)
data in log−yc scale
SE model fit
data in log−log scale
(a) WiFi
100
101
102
103
104
105
1
54
415
1656
4724
Rank (log scale)
# o
f vie
ws (
yc s
ca
le)
c = 0.23, a= 0.454, b = 6.720
R2 = 0.998812
100
102
104
100
101
102
103
104
# o
f vie
ws (
log
sca
le)
data in log−yc scale
SE model fit
data in log−log scale
(b) 3G
100
101
102
103
104
105
1
355
1412
3216
5793
Rank (log scale)
# o
f vie
ws (
yc s
ca
le)
c = 0.48, a= 3.432, b = 45.463
R2 = 0.953965
100
102
104
100
101
102
103
104
# o
f vie
ws (
log
sca
le)
data in log−yc scale
SE model fit
data in log−log scale
(c) Mixed
Figure 9: Rank distribution of aggregated number of views for individual users
We leverage the SE fit method provided by Guo et al.[8], where the parameters for the distribution are obtainedby maximum likelihood estimation. The goodness of fit ismeasured by the coefficient of determination, R2. In Figure9, the left y-axis is in yc scale. As it can be seen that the fit isvery good for all 3 types of connections although exhibitingdifferent stretched factors. The first several points in Figure9c are significantly higher than the SE model predicts, whichis known as the “King effect” [11].
Taking a closer look to the estimates of the distributions,the distribution for 3G connections has the smallest stretchedfactor, implying that it is more skewed towards (a few) coreusers. We further divide users in each category into subcate-gories by the type of mobile devices (e.g. iPad, iPhone, etc.).Although not shown here, we also observed SE distributionsfor each subcategory with a stretched factor equal to thefactor measured for the category. For example, all the 3Gsubcategories are with the same stretched factor 0.23. Webelieve that different stretched factors for different types ofusers reflect the intrinsic characteristics of users’ specific ac-tivities.
3.5.3 Individual users’ interestInternet video systems often rely on individual users’ in-
terests on videos for personalized recommendation. We in-vestigate whether a user tends to watch videos from a smallnumber of categories only. To this end we compute categoryentropy, which is introduced in [4] and defined for a user ias:
ei =−∑K
k=1pik × lnpiklnK
(1)
where K is the number of categories, pik = uikui
, uik is the
number of videos viewed by user i and belonging to categoryk, ui is the total number of videos viewed by user i. Thecategory entropy is a real number between 0 and 1, with “0”corresponding to a user viewing videos of a single categoryonly and “1” when the user watches videos uniformly chosenfrom all possible categories. PPTV offers K = 22 categoriesof videos for VoD streaming. We divide users into 2 groups,those viewing more than 1 video and those viewing morethan 50 videos within 14 days. Figure 10 shows the distri-bution of the category entropy.
Almost all users have a category entropy less than 0.5,independent of the number of viewed videos. Focusing onthe users who view more than 50 videos, we observe as many
0 0.5 10
0.2
0.4
0.6
0.8
1
Entropy
CD
F
WiFi User
0 0.5 10
0.2
0.4
0.6
0.8
1
Entropy
3G User
0 0.5 10
0.2
0.4
0.6
0.8
1
Entropy
Mixed User
>1
>50
>1
>50
>1
>50
Figure 10: CDF of interest entropy
as 29% of the users with 3G connections viewing videos ofonly 1 single category, which is larger than the WiFi (9%)and mixed users(15%). We conclude that individual userstend to view videos from a limited set of categories.
3.6 Summary and ImplicationsOur findings on user behavior are summarized as follows.
• Users’ behavior through both WiFi and 3G connectionsshows strongly daily and weekly patterns. As opposedto previous work, we observed at large scale significantlydifferent 3G and WiFi weekly patterns.
• In general, the viewing time is very short. Only about25% of the views via either WiFi or 3G last longer than10 minutes, and we note that a considerable fraction ofviews are abandoned before playback. The views viaWiFi connections last longer than those via 3G. Mobiledevices also have an impact on the viewing time, withlarger screen sizes and longer battery life being possiblefactors explaining this longer viewing time.
• Longer videos have shorter normalized viewing time (NVT).The NVT is inversely proportional to the popularity ofthe videos and varies during the course of the day. Theviews taking place in the early morning have longer av-erage NVTs.
• Movies and TV series account for 60% of views, indepen-dently from the connection type. There are surprisinglymore views via 3G to request movies than via WiFi, al-though more than half of them are abandoned beforeplayback. Users’ interests also change over time and we
observed different video “tastes” according to users’ geo-location.
• Individual users’ activity follows the Pareto principle: aminor proportion of causes generate a major proportionof effects. About 20% of users generate 80% of views andusers requesting videos via both 3G and WiFi connec-tions view a higher number of videos. The aggregatednumber of views per user follows a stretched exponen-tial model with a stretched factor depending on the con-nection type. Besides, individual users and especiallythose using 3G connections tend to focus on videos froma small number of categories.
These observations might prove useful for caching policyof CDNs, buffering policy in client software, system design,recommendation and advertisement systems:
• The system maintenance and upgrade operations shouldbe scheduled between 5AM and 7AM to minimize theimpact on users. Since the system’s capacity is designedaccording to the peak workload, a major part of the sys-tem resources would be not used in the early morning.
• Shorter viewing time implies that the effectiveness ofcache could be optimized by allocating most of the ca-pacity to store the first chunks of videos on the CDNservers. The fact that the viewing time is also impactedby the connection type points to the need for differentcaching policies for different types of network access.
• A flexible buffering policy in the client application couldconsider the length, popularity of videos and the timeof day to perform effective buffering, which is key foruser engagement [5]. Firstly, client software should notaggressively buffer several chunks of videos, but ratheradopt a more efficient adaptive caching policy. Secondly,video providers’ customized client applications would ben-efit from the pre-fetching of more chunks of videos forbuffering in the early morning, since views exhibit a highcompletion rate during this period. Finally, as noticedpreviously, buffering policies should take into account thetype of connection and the type of mobile device used.
• Recommendation systems and content providers couldexploit the patterns we observed to better fit users’ vari-able interests across time and locations. A time-awarerecommendation system could weight the candidate itemsbased on the time of day, and for example propose toits users animation videos with a higher probability af-ter school time. Advertisers could consider the fact thatusers with 3G connections are more likely to watch moviesthan those with WiFi connections.
4. VIDEO POPULARITYIn this section, we focus on the video popularity in the
PPTV mobile VoD system. The video popularity character-istics not only help us to understand the underlying humancollective behaviors, but also provide insights into optimiza-tion of the cache policy and deployment of CDNs.
Individual videos are identified by the unique file names ofvideos in the PPTV video system. Video popularity can bemeasured by either the number of views or the aggregatedviewing time. We examine the correlation between thesetwo popularity metrics with the Spearman rank correlationcoefficient ρ. The coefficient ρ is defined as
0 20 40 60 80 1000
20
40
60
80
100
Normalized video rank
Vie
ws s
ha
red
by r
an
k >
= x
WiFi: all
3G: all
Figure 11: Pareto principle for video popularity
ρ = 1− 6∑
(xi − yi)2
n(n2 − 1)(2)
where xi and yi are the ranks of the i-th video according totwo different metrics, n is the total number of videos underconsideration. It is a non-parametric measure of correlation,which quantifies how well an arbitrary monotonic functioncould describe the relationship between two variables. Thecoefficient lies in [-1,1], a value of “1” indicating perfect pos-itive correlation and “-1” indicating perfect negative corre-lation.
The value of the correlation coefficient of the two popu-larity metrics is ρ = 0.884, a high correlation. Thus, in thefollowing we will use the number of views as the measureof video popularity. Unless otherwise specified, we considerthe aggregated number of views to be the popularity of avideo for the time period covered by our dataset.
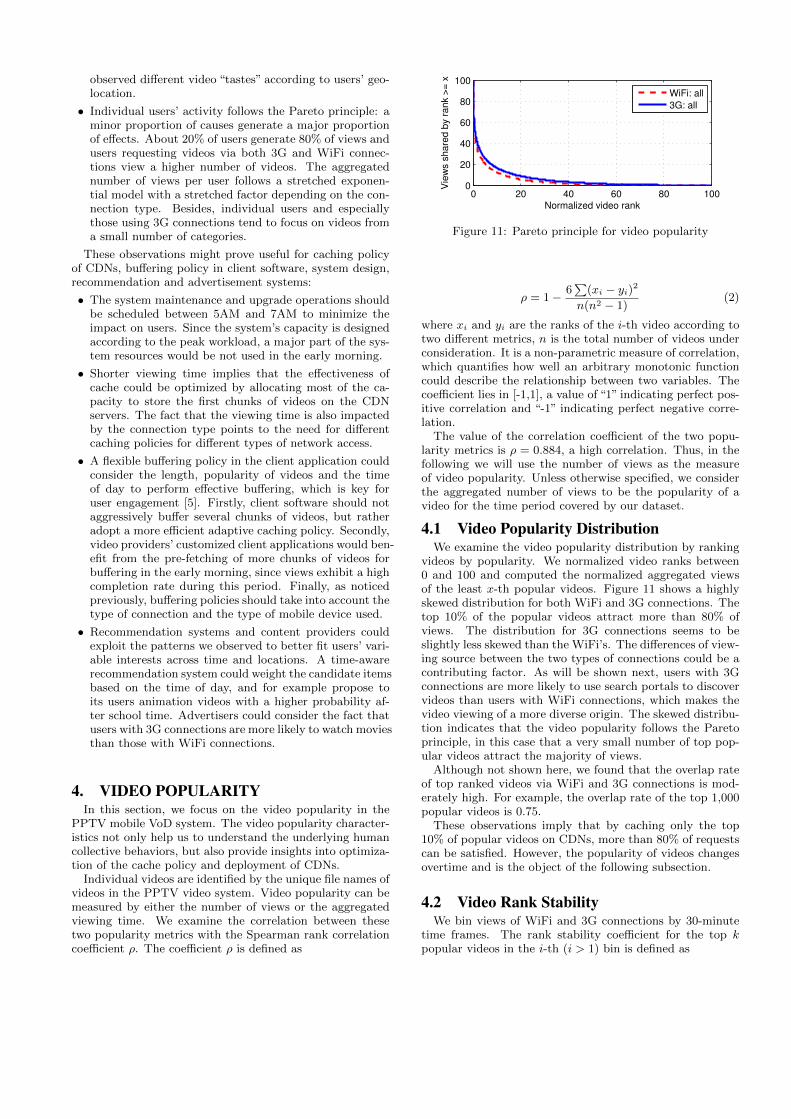
4.1 Video Popularity DistributionWe examine the video popularity distribution by ranking
videos by popularity. We normalized video ranks between0 and 100 and computed the normalized aggregated viewsof the least x-th popular videos. Figure 11 shows a highlyskewed distribution for both WiFi and 3G connections. Thetop 10% of the popular videos attract more than 80% ofviews. The distribution for 3G connections seems to beslightly less skewed than the WiFi’s. The differences of view-ing source between the two types of connections could be acontributing factor. As will be shown next, users with 3Gconnections are more likely to use search portals to discovervideos than users with WiFi connections, which makes thevideo viewing of a more diverse origin. The skewed distribu-tion indicates that the video popularity follows the Paretoprinciple, in this case that a very small number of top pop-ular videos attract the majority of views.
Although not shown here, we found that the overlap rateof top ranked videos via WiFi and 3G connections is mod-erately high. For example, the overlap rate of the top 1,000popular videos is 0.75.
These observations imply that by caching only the top10% of popular videos on CDNs, more than 80% of requestscan be satisfied. However, the popularity of videos changesovertime and is the object of the following subsection.
4.2 Video Rank StabilityWe bin views of WiFi and 3G connections by 30-minute
time frames. The rank stability coefficient for the top kpopular videos in the i-th (i > 1) bin is defined as
Rk(i) =|Sk(i) ∩ Sk(i− 1)|
k(3)
where Si is the set of top k popular videos during the i-thtime frame. The coefficient has values within [0, 1], where avalue of “1” indicates no change and a value of “0” that allthe videos in the top list change.
0 6 12 18 24 6 12 18 240
0.2
0.4
0.6
0.8
1
Time in hour
Ra
nk s
tab
ility
co
eff
icie
nt
WiFi: top 10
WiFi: top 100
3G: top 10
3G: top 100
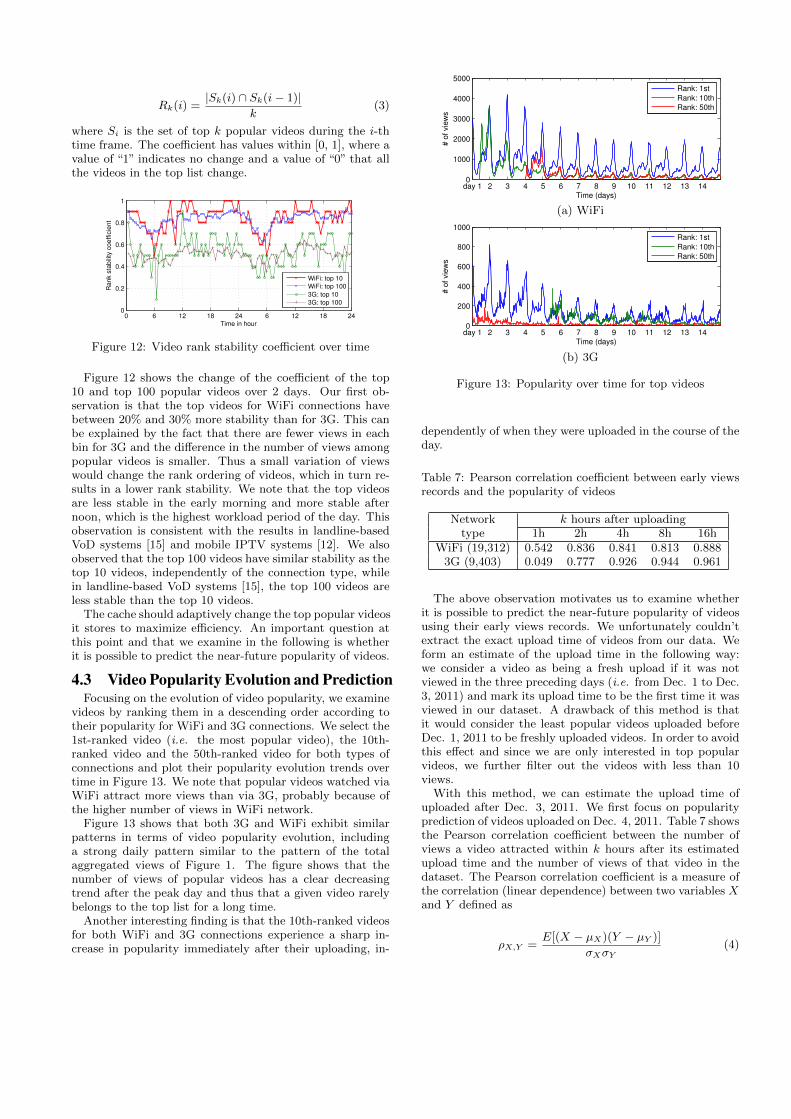
Figure 12: Video rank stability coefficient over time
Figure 12 shows the change of the coefficient of the top10 and top 100 popular videos over 2 days. Our first ob-servation is that the top videos for WiFi connections havebetween 20% and 30% more stability than for 3G. This canbe explained by the fact that there are fewer views in eachbin for 3G and the difference in the number of views amongpopular videos is smaller. Thus a small variation of viewswould change the rank ordering of videos, which in turn re-sults in a lower rank stability. We note that the top videosare less stable in the early morning and more stable afternoon, which is the highest workload period of the day. Thisobservation is consistent with the results in landline-basedVoD systems [15] and mobile IPTV systems [12]. We alsoobserved that the top 100 videos have similar stability as thetop 10 videos, independently of the connection type, whilein landline-based VoD systems [15], the top 100 videos areless stable than the top 10 videos.
The cache should adaptively change the top popular videosit stores to maximize efficiency. An important question atthis point and that we examine in the following is whetherit is possible to predict the near-future popularity of videos.
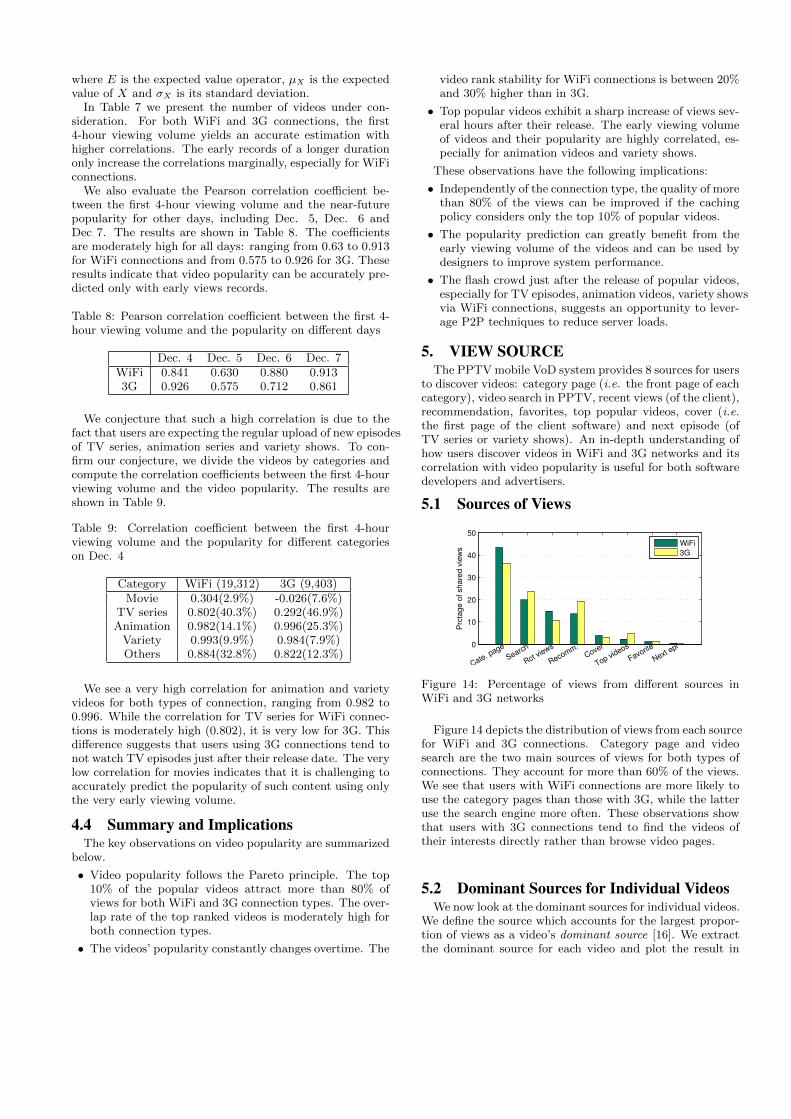
4.3 Video Popularity Evolution and PredictionFocusing on the evolution of video popularity, we examine
videos by ranking them in a descending order according totheir popularity for WiFi and 3G connections. We select the1st-ranked video (i.e. the most popular video), the 10th-ranked video and the 50th-ranked video for both types ofconnections and plot their popularity evolution trends overtime in Figure 13. We note that popular videos watched viaWiFi attract more views than via 3G, probably because ofthe higher number of views in WiFi network.
Figure 13 shows that both 3G and WiFi exhibit similarpatterns in terms of video popularity evolution, includinga strong daily pattern similar to the pattern of the totalaggregated views of Figure 1. The figure shows that thenumber of views of popular videos has a clear decreasingtrend after the peak day and thus that a given video rarelybelongs to the top list for a long time.
Another interesting finding is that the 10th-ranked videosfor both WiFi and 3G connections experience a sharp in-crease in popularity immediately after their uploading, in-
day 1 2 3 4 5 6 7 8 9 10 11 12 13 140
1000
2000
3000
4000
5000
Time (days)
# o
f vie
ws
Rank: 1st
Rank: 10th
Rank: 50th
(a) WiFi
day 1 2 3 4 5 6 7 8 9 10 11 12 13 140
200
400
600
800
1000
Time (days)
# o
f vie
ws
Rank: 1st
Rank: 10th
Rank: 50th
(b) 3G
Figure 13: Popularity over time for top videos
dependently of when they were uploaded in the course of theday.
Table 7: Pearson correlation coefficient between early viewsrecords and the popularity of videos
Network k hours after uploadingtype 1h 2h 4h 8h 16h
The above observation motivates us to examine whetherit is possible to predict the near-future popularity of videosusing their early views records. We unfortunately couldn’textract the exact upload time of videos from our data. Weform an estimate of the upload time in the following way:we consider a video as being a fresh upload if it was notviewed in the three preceding days (i.e. from Dec. 1 to Dec.3, 2011) and mark its upload time to be the first time it wasviewed in our dataset. A drawback of this method is thatit would consider the least popular videos uploaded beforeDec. 1, 2011 to be freshly uploaded videos. In order to avoidthis effect and since we are only interested in top popularvideos, we further filter out the videos with less than 10views.
With this method, we can estimate the upload time ofuploaded after Dec. 3, 2011. We first focus on popularityprediction of videos uploaded on Dec. 4, 2011. Table 7 showsthe Pearson correlation coefficient between the number ofviews a video attracted within k hours after its estimatedupload time and the number of views of that video in thedataset. The Pearson correlation coefficient is a measure ofthe correlation (linear dependence) between two variables Xand Y defined as
ρX,Y =E[(X − µX)(Y − µY )]
σXσY(4)
where E is the expected value operator, µX is the expectedvalue of X and σX is its standard deviation.
In Table 7 we present the number of videos under con-sideration. For both WiFi and 3G connections, the first4-hour viewing volume yields an accurate estimation withhigher correlations. The early records of a longer durationonly increase the correlations marginally, especially for WiFiconnections.
We also evaluate the Pearson correlation coefficient be-tween the first 4-hour viewing volume and the near-futurepopularity for other days, including Dec. 5, Dec. 6 andDec 7. The results are shown in Table 8. The coefficientsare moderately high for all days: ranging from 0.63 to 0.913for WiFi connections and from 0.575 to 0.926 for 3G. Theseresults indicate that video popularity can be accurately pre-dicted only with early views records.
Table 8: Pearson correlation coefficient between the first 4-hour viewing volume and the popularity on different days
We conjecture that such a high correlation is due to thefact that users are expecting the regular upload of new episodesof TV series, animation series and variety shows. To con-firm our conjecture, we divide the videos by categories andcompute the correlation coefficients between the first 4-hourviewing volume and the video popularity. The results areshown in Table 9.
Table 9: Correlation coefficient between the first 4-hourviewing volume and the popularity for different categorieson Dec. 4
We see a very high correlation for animation and varietyvideos for both types of connection, ranging from 0.982 to0.996. While the correlation for TV series for WiFi connec-tions is moderately high (0.802), it is very low for 3G. Thisdifference suggests that users using 3G connections tend tonot watch TV episodes just after their release date. The verylow correlation for movies indicates that it is challenging toaccurately predict the popularity of such content using onlythe very early viewing volume.
4.4 Summary and ImplicationsThe key observations on video popularity are summarized
below.
• Video popularity follows the Pareto principle. The top10% of the popular videos attract more than 80% ofviews for both WiFi and 3G connection types. The over-lap rate of the top ranked videos is moderately high forboth connection types.
• The videos’ popularity constantly changes overtime. The
video rank stability for WiFi connections is between 20%and 30% higher than in 3G.
• Top popular videos exhibit a sharp increase of views sev-eral hours after their release. The early viewing volumeof videos and their popularity are highly correlated, es-pecially for animation videos and variety shows.
These observations have the following implications:
• Independently of the connection type, the quality of morethan 80% of the views can be improved if the cachingpolicy considers only the top 10% of popular videos.
• The popularity prediction can greatly benefit from theearly viewing volume of the videos and can be used bydesigners to improve system performance.
• The flash crowd just after the release of popular videos,especially for TV episodes, animation videos, variety showsvia WiFi connections, suggests an opportunity to lever-age P2P techniques to reduce server loads.
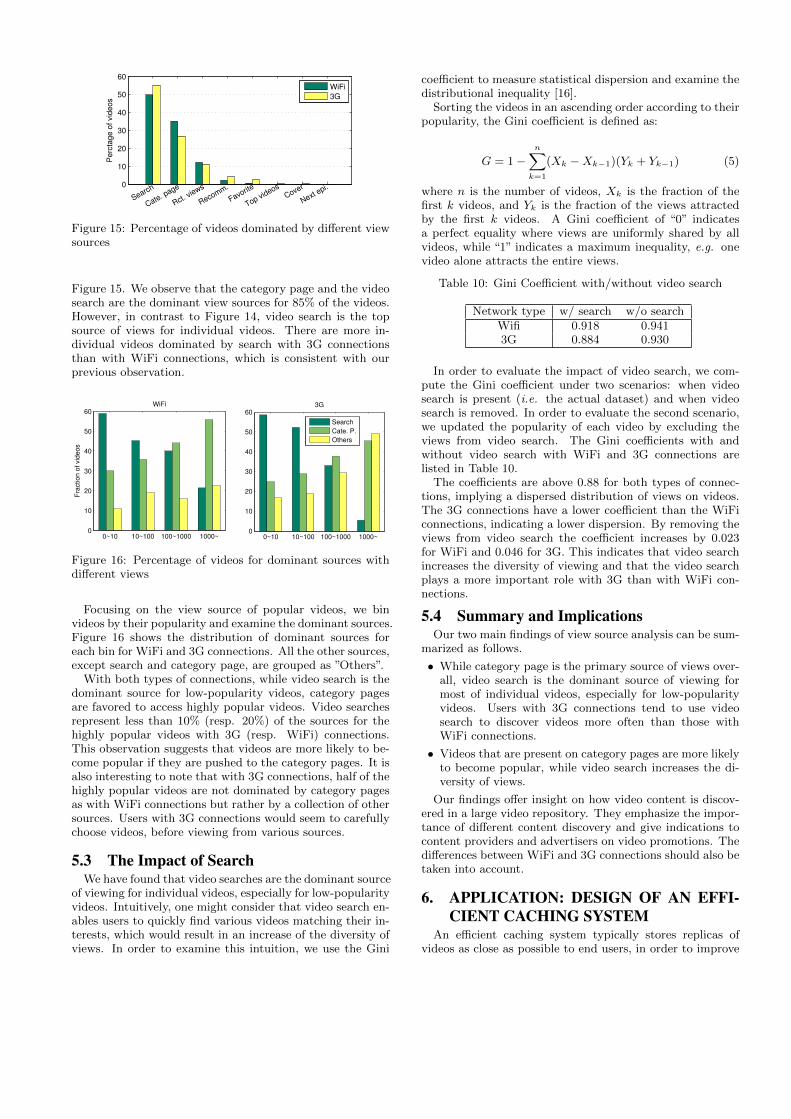
5. VIEW SOURCEThe PPTV mobile VoD system provides 8 sources for users
to discover videos: category page (i.e. the front page of eachcategory), video search in PPTV, recent views (of the client),recommendation, favorites, top popular videos, cover (i.e.the first page of the client software) and next episode (ofTV series or variety shows). An in-depth understanding ofhow users discover videos in WiFi and 3G networks and itscorrelation with video popularity is useful for both softwaredevelopers and advertisers.
5.1 Sources of Views
0
10
20
30
40
50
Prc
tage o
f share
d v
iew
s
Cate. page
Search
Rct views
Recomm.Cover
Top videos
Favorite
Next epi
WiFi
3G
Figure 14: Percentage of views from different sources inWiFi and 3G networks
Figure 14 depicts the distribution of views from each sourcefor WiFi and 3G connections. Category page and videosearch are the two main sources of views for both types ofconnections. They account for more than 60% of the views.We see that users with WiFi connections are more likely touse the category pages than those with 3G, while the latteruse the search engine more often. These observations showthat users with 3G connections tend to find the videos oftheir interests directly rather than browse video pages.
5.2 Dominant Sources for Individual VideosWe now look at the dominant sources for individual videos.
We define the source which accounts for the largest propor-tion of views as a video’s dominant source [16]. We extractthe dominant source for each video and plot the result in
0
10
20
30
40
50
60
Search
Cate. page
Rct. views
Recomm.
Favorite
Top videosCover
Next epi.
Perc
tage o
f vid
eos
WiFi
3G
Figure 15: Percentage of videos dominated by different viewsources
Figure 15. We observe that the category page and the videosearch are the dominant view sources for 85% of the videos.However, in contrast to Figure 14, video search is the topsource of views for individual videos. There are more in-dividual videos dominated by search with 3G connectionsthan with WiFi connections, which is consistent with ourprevious observation.
0~10 10~100 100~1000 1000~0
10
20
30
40
50
60
Fra
ction o
f vid
eos
WiFi
0~10 10~100 100~1000 1000~0
10
20
30
40
50
60
3G
Search
Cate. P.
Others
Figure 16: Percentage of videos for dominant sources withdifferent views
Focusing on the view source of popular videos, we binvideos by their popularity and examine the dominant sources.Figure 16 shows the distribution of dominant sources foreach bin for WiFi and 3G connections. All the other sources,except search and category page, are grouped as ”Others”.
With both types of connections, while video search is thedominant source for low-popularity videos, category pagesare favored to access highly popular videos. Video searchesrepresent less than 10% (resp. 20%) of the sources for thehighly popular videos with 3G (resp. WiFi) connections.This observation suggests that videos are more likely to be-come popular if they are pushed to the category pages. It isalso interesting to note that with 3G connections, half of thehighly popular videos are not dominated by category pagesas with WiFi connections but rather by a collection of othersources. Users with 3G connections would seem to carefullychoose videos, before viewing from various sources.
5.3 The Impact of SearchWe have found that video searches are the dominant source
of viewing for individual videos, especially for low-popularityvideos. Intuitively, one might consider that video search en-ables users to quickly find various videos matching their in-terests, which would result in an increase of the diversity ofviews. In order to examine this intuition, we use the Gini
coefficient to measure statistical dispersion and examine thedistributional inequality [16].
Sorting the videos in an ascending order according to theirpopularity, the Gini coefficient is defined as:
G = 1−n∑
k=1
(Xk −Xk−1)(Yk + Yk−1) (5)
where n is the number of videos, Xk is the fraction of thefirst k videos, and Yk is the fraction of the views attractedby the first k videos. A Gini coefficient of “0” indicatesa perfect equality where views are uniformly shared by allvideos, while “1” indicates a maximum inequality, e.g. onevideo alone attracts the entire views.
Table 10: Gini Coefficient with/without video search
Network type w/ search w/o searchWifi 0.918 0.9413G 0.884 0.930
In order to evaluate the impact of video search, we com-pute the Gini coefficient under two scenarios: when videosearch is present (i.e. the actual dataset) and when videosearch is removed. In order to evaluate the second scenario,we updated the popularity of each video by excluding theviews from video search. The Gini coefficients with andwithout video search with WiFi and 3G connections arelisted in Table 10.
The coefficients are above 0.88 for both types of connec-tions, implying a dispersed distribution of views on videos.The 3G connections have a lower coefficient than the WiFiconnections, indicating a lower dispersion. By removing theviews from video search the coefficient increases by 0.023for WiFi and 0.046 for 3G. This indicates that video searchincreases the diversity of viewing and that the video searchplays a more important role with 3G than with WiFi con-nections.
5.4 Summary and ImplicationsOur two main findings of view source analysis can be sum-
marized as follows.
• While category page is the primary source of views over-all, video search is the dominant source of viewing formost of individual videos, especially for low-popularityvideos. Users with 3G connections tend to use videosearch to discover videos more often than those withWiFi connections.
• Videos that are present on category pages are more likelyto become popular, while video search increases the di-versity of views.
Our findings offer insight on how video content is discov-ered in a large video repository. They emphasize the impor-tance of different content discovery and give indications tocontent providers and advertisers on video promotions. Thedifferences between WiFi and 3G connections should also betaken into account.
6. APPLICATION: DESIGN OF AN EFFI-CIENT CACHING SYSTEM
An efficient caching system typically stores replicas ofvideos as close as possible to end users, in order to improve
user experience and alleviate server load. In the preced-ing sections we observed that caching the top 10% popularvideos and the first few chunks of the videos could be part ofa caching strategy to optimize the overall performance. Inthis section, we aim to evaluate such a performance gain us-ing trace-driven simulations and comparing different cachingstrategies. We first assume a global virtual cache, where re-quests are first sent to the cache. Since we are primarilyinterested in the performance improvement potentially ob-tained by leveraging our findings, we do not assume any par-ticular distribution for the locations of content cache servers.We assume that a video can be cached at chunks level andthat it is divided in a set of 1-minute chunks. We considerthe following 3 caching strategies:
1. Full caching: Each day the cache is refreshed with thetop 10% popular videos accessed the day before. Allthe chunks of all these videos are stored in the cache.
2. Partial caching: Each day the cache is refreshed withthe top 10% popular videos accessed the day before,however as suggested by our findings, we only cache thefew first chunks of each video. The fraction of cachedchunks of each video is computed as a function of thenormalized viewing time (NVT), as depicted on Figure3. Specifically, considering the video lengths (in min-utes), we estimate the expected video’s viewing timewith the average NVT. The fraction of first chunks tobe cached is then those covering this expected viewingtime.
3. Full caching with limited size: In this strategy we fur-ther take into account the constraint of limited cachesize. The daily cache size is set to the size used inthe partial caching strategy of the same day. But allchunks of the selected videos are stored in the cache,which is populated with the top popular videos untilit has reached it maximal capacity. Due to the limitedcache size, less than 10% of the top popular videos willbe stored.
For a viewing request i, let hi denote the number of chunks’hits and let ri denote the number of requested chunks, thenthe cache hit rate of the view i is defined as Ci = hi
ri. We
perform the simulations by replaying the requests of 13 days,from Dec. 2 to Dec. 14. Table 11 shows the average cachehit ratio over all viewing requests. Note that the cache sizeis defined as the number of stored chunks in the cache. Thetable also shows the average value of each day’s cache size.
Table 11: Cache performance
Cache scheme avg. cache size avg. hit rateFull 658,630 75.3%
Partial 133,019 63.3%Full+limited 133,019 52.6%
We observe a high average hit rate for the full cachingstrategy, showing the effectiveness of only caching the top10% popular videos. Compared to the full caching strategy,the partial caching offers a reduction of 80% in cache size,at the expense of reduction of only 12% of the hit rate. Ourresults also suggest that the variant of the full caching withlimited size yields a lower hit rate when compared to the
partial caching. This preliminary analysis indicates that thepartial caching strategy provides a better tradeoff betweencache size and hit rate.
7. RELATED WORKUser behavior and video consumption patterns in Inter-
net video systems have been examined in the context of VoD[15][14] [5], IPTV [7][3], P2P VoD [10] and live streaming [9],including YouTube[2]. By measuring a VoD system, Yu etal. [15] made several observations on user arrival rate, videopopularity and the impact of recommendation. We havecompared our results on mobile VoD systems with what theauthors of [15] observed throughout our paper. Yin et al.[14] analyzed a live VoD system from the 2008 Olympics,focusing on how the dynamic nature of the system impacteduser behavior. Dobrian et al. [5] examined the impact ofvideo quality on user engagement and found that the buffer-ing ratio is the most important factor. Guo et al. [8] mod-elized the video access patterns of several Internet video sys-tems with stretched exponential distributions.
Another major type of video services is IPTV. Cha et al.[3] measured an IPTV system and analyzed the character-istics of viewing sessions and the patterns of channel popu-larity. Gopalakrishnan et al. [7] and Qiu et al. [13] modeledinteractive usage and user activity in IPTV systems.
Measurement studies [10][9] on P2P-based VoD and livestreaming systems emphasized the aspects of peer stabil-ity, chunk availability and scheduling mechanisms. We havediscussed the possibility of using P2P techniques on mobileVoD systems in this paper. As a UGC (user-generated con-tent) video system, YouTube constitutes a huge repositoryof short videos in the context of VoD streaming. Cha etal. [2] characterized the video popularity in YouTube. Theyidentified several popularity distributions and gave sugges-tions on the design of caching and P2P content distribution.
Watching videos with mobile devices becomes more andmore popular. Li et al. [12] analyzed traffic patterns anduser behavior for a mobile TV system. They showed thatthe wireless connectivity allowed smooth video viewing withmobile devices and modeled the sojourn time in channelswith two piecewise distributions. Finamore et al. [6] com-pared YouTube traffic generated by mobile devices with traf-fic generated by PCs. Their key observation is that aggres-sive buffering policies cause a considerable waste of band-width for mobile devices. In this paper, we observed theshort viewing times and suggested adaptive caching policieswhich could be also leveraged in YouTube.
To the best of our knowledge, this paper is among thefirst to systematically analyze the user viewing behavior andthe corresponding video consumption patterns for mobileVoD systems. We examined the impact of the connectiontype (3G or WiFi) and the type of mobile device on viewingbehavior, video popularity and viewing sources. We alsocompared our findings with landline-based VoD systems andmobile TV systems where applicable.
8. CONCLUSIONUnderstanding user behavior patterns in mobile video sys-
tems is of prime importance for content providers, systemdesigners and researchers. In this paper, using a uniquedata from a mobile VoD system, we systematically analyzed
users’ behavior and the corresponding video popularity pat-terns, emphasizing the impact of the connection type (3G orWiFi) and the type of mobile device used (tablet or smartphone). We have made several key observations and dis-cussed their implications on caching and buffering policiesand the design of systems, software and on-line advertising.We observed shorter viewing times (especially via 3G), astretched exponential distribution for user activity, a concen-tration of individual users’ interests and that the video popu-larity conformed to the Pareto principle. We also highlightedseveral surprising findings: 3G users request more moviesthan other categories of videos; users requesting videos viaboth 3G and WiFi view a far higher number of videos; theearly viewing volume of a video is a good predictor of popu-larity for animation and variety shows. These observationsconstitute useful insights for system designers, CDNs anddevelopers alike.
Substantial study remains to address issues such as theimpact of the type of client application (e.g. wired clients,web browsers and mobile clients) on video consumption pat-terns; the reasons underlying the differences in user be-havior depending on whether they connect using WiFi or3G; how to design better content delivery (e.g. P2P deliv-ery) in mobile VoD systems as well as designing effectivecaching strategies in content delivery networks. Identifyingthe main discrepancies that might exist between the wiredand wireless-based accesses to VoD content would also beworth investigating. In future work, we will also study thesepotentially fundamental differences, exploiting both mobileand Internet-based VoD datasets.
AcknowledgementThe authors would like to thank PPLive for providing uswith the dataset and Yi Sun from ICT-CAS for all the use-ful discussions we had. We are also grateful to our shep-herd Ming Zhang and anonymous reviewers for their feed-back. This work was supported in part by National BasicResearch Program of China with Grant 2012CB315801, byNational Natural Science Foundation of China (NSFC) withGrants 61133015 and 60903207, by Strategic Priority Re-search Program of the Chinese Academy of Sciences withGrant XDA06010303. The work was also supported by theNSFC-ANR (France) pFlower project and EC EINS project.
9. REFERENCES[1] Cisco visual networking index: Global mobile data
[2] M. Cha, H. Kwak, P. Rodriguez, Y.-Y. Ahn, andS. Moon. I tube, you tube, everybody tubes:analyzing the world’s largest user generated contentvideo system. In Proceedings of IMC ’07, 2007.
[3] M. Cha, P. Rodriguez, J. Crowcroft, S. Moon, andX. Amatriain. Watching television over an ip network.In Proceedings of IMC ’08, 2008.
[4] Y. Ding, Y. Du, Y. Hu, Z. Liu, L. Wang, K. Ross, andA. Ghose. Broadcast yourself: understanding youtubeuploaders. In IMC ’11, 2011.
[5] F. Dobrian, V. Sekar, A. Awan, I. Stoica, D. Joseph,A. Ganjam, J. Zhan, and H. Zhang. Understandingthe impact of video quality on user engagement. InProceedings of the ACM SIGCOMM, 2011.
[6] A. Finamore, M. Mellia, M. M. Munafo, R. Torres,and S. G. Rao. Youtube everywhere: impact of deviceand infrastructure synergies on user experience. InProceedings of IMC’11, 2011.
[7] V. Gopalakrishnan, R. Jana, K. K. Ramakrishnan,D. F. Swayne, and V. A. Vaishampayan.Understanding couch potatoes: measurement andmodeling of interactive usage of iptv at large scale. InProceedings of IMC ’11, 2011.
[8] L. Guo, E. Tan, S. Chen, Z. Xiao, and X. Zhang. Thestretched exponential distribution of internet mediaaccess patterns. In Proceedings of PODC ’08, 2008.
[9] X. Hei, C. Liang, J. Liang, Y. Liu, and K. Ross. Ameasurement study of a large-scale p2p iptv system.IEEE Transactions on Multimedia, 9(8):1672 –1687,dec. 2007.
[10] Y. Huang, T. Z. Fu, D.-M. Chiu, J. C. Lui, andC. Huang. Challenges, design and analysis of alarge-scale p2p-vod system. In Proceedings ofSIGCOMM ’08, 2008.
[11] J. Laherrere and D. Sornette. Stretched exponentialdistributions in nature and economy: “fat tails” withcharacteristic scales. The European Physical JournalB, 2:525–539, January 1998.
[12] Y. Li, Y. Zhang, and R. Yuan. Measurement andanalysis of a large scale commercial mobile internet tvsystem. In Proceedings of IMC ’11, 2011.
[13] T. Qiu, Z. Ge, S. Lee, J. Wang, J. Xu, and Q. Zhao.Modeling user activities in a large iptv system. InProceedings of IMC’09, 2009.
[14] H. Yin, X. Liu, F. Qiu, N. Xia, C. Lin, H. Zhang,V. Sekar, and G. Min. Inside the bird’s nest:measurements of large-scale live vod from the 2008olympics. In Proceedings of the ACM IMC ’09, 2009.
[15] H. Yu, D. Zheng, B. Y. Zhao, and W. Zheng.Understanding user behavior in large-scalevideo-on-demand systems. In Proceedings of EuroSys’06, 2006.
[16] R. Zhou, S. Khemmarat, and L. Gao. The impact ofyoutube recommendation system on video views. InProceedings of IMC ’10, 2010.