Aalborg University Water activity measurements of a system of poly(styrene-co-sodium acrylate) core-shell particles and water Master’s Thesis Katrine Skelbæk Christiansen September 2008 - June 2009 Department of Biotechnology, Chemistry and Environmental Engineering Section of chemistry
Transcript
Aalborg University
Water activity measurements of a system of poly(styrene-co-sodium acrylate)
core-shell particles and water
Master’s Thesis Katrine Skelbæk Christiansen September 2008 - June 2009
Department of Biotechnology, Chemistry and Environmental Engineering Section of chemistry
Faculties of Engineering, Science and MedicineAalborg Universitet
Department of Biotechnology, Chemistry and Environmental Engineering
Section of Chemistry
Title
Water activity measurements of a
system of poly(styrene-co-sodium
acrylate) core-shell particles and wa-
ter
Project period
September 2008 - June 2009
Composed by
Katrine Skelbæk Christiansen
Supervisor
Associate professor Kristian Keiding
Issues: 3
No of pages: 83
No of appendices: 4
CD-ROM
Katrine Skelbæk Christiansen
AbstractCore-shell particles are widely studied due to a va-riety of possible application. Especially for polyelec-trolyte core-shell particles the interaction with wa-ter has been studied. Though polyelectrolyte core-shell particles have never been investigated by wa-ter activity measurements in the concentrated range.Hence this study focus on the use of water activitymeasurements to describe the interaction betweencore-shell particles of poly(styrene-co-sodium acry-late) (PS-NaPAA) and water.The water activity has been measured for PS-NaPAAparticles both as a function of water content andtemperature. For comparison sodium polyacrylate,sodium acrylate, bare polystyrene particles and pro-tonated poly(styrene-co-acrylic acid) have been mea-sured as a function of water content.The results show that the water activity for PS-NaPAA is determined mainly by the charges andcounterions in the shell. Additionally the measuredwater activity as a function of water content indicatea water content below which the system can be de-scribed by adsorption. Above this point the systemcan be described as a suspension.From the measurements of the water activity as afunction of temperature an excess enthalpy neces-sary to evaporate the water from the samples of PS-NaPAA is determined. The behaviour of this excessenthalpy as a function of water content is confirmedby a drying experiment.It is concluded that water activity measurements canbe used to describe the interactions between polyelec-trolyte core-shell particles and water.
1. Synopsis
Kerneskalpartikler har en række mulige anvendelser og er derfor studeret af mange. Inter-
aktionerne mellem kerneskalpartikler og vand er specielt blevet undersøgt for kerneskalpar-
tikler med en polyelektrolytskal. Dog er vandaktivitetsmalinger aldrig blevet brugt til
undersøgelse af disse interaktioner for koncentrerede suspensioner. Formalet med dette
projekt er saledes at bruge vandaktivitetsmalinger til at bestemme interaktionerne mellem
poly(styren-co-natriumacrylate) (Ps-NaPAA) kerneskalpartikler og vand.
Vandaktiviteten er blevet malt for PS-NaPAA partikler bade som funktion af vandind-
holdet og temperaturen. Til sammenligning er natriumpolyacrylate, polystyren partikler,
natriumacrylate og protoneret poly(styren-co-acrylsyre) malt som funktion af vandind-
holdet.
Resultaterne viser, at det hovedsageligt er skallen med dens ladninger og modioner,
der er bestemmende for vandaktiviteten af PS-NaPAA. Desuden indikerer vandak-
tivitetsmalingerne som funktion af vandindhold et vandindhold, under hvilket systemet
kan beskrives med adsorption. Over dette punkt kan systemet betragtes som en suspen-
sion.
Fra vandaktivitetsmalingerne som funktion af temperatur er den ekstra entalpi, der er
nødvendigt for at fordampe vandet fra PS-NaPAA, bestemt. Variationen af denne entalpi
som funktion af vandindholdet er delvist bekræftiget af et tørringsforsøg.
Det kan konkluderes, at vandaktivitetsmalinger kan bruges til at beskrive interaktionerne
mellem polyelektrolyt kerneskalpartikler og vand.
Projekttitel: Vandaktivitetsmalinger for et system af poly(styren-co-natriumacrylate)
kerneskalpartikler og vand.
5
2. Preface
This master thesis is composed at Aalborg University, Department of Biotechnology,
Chemistry and Environmental Engineering, Section of Chemistry in the period September
2008 - June 2009. The focus of this report is ”Water activity measurements of a system
of poly(styrene-co-sodium acrylate) core-shell particles and water”.
The equations, tables and figures are numbered continuously in each chapter. The refer-
ences is given as [author, publication year].
All raw data and calculations is found on the attached CD-ROM. Additionally an elec-
tronic version of this report can be found on the CD-ROM.
The author wishes to thank Jonas Laursen for synthesis of core-shell particles.
Many systems in our every day life contains morphologies resembling core-shell particles.
These include soil, which is minerals with a soft charged polymeric surface layer among
others [Ellerbrock et al., 2005], and sewage sludge [Christensen, 2008]. Core-shell parti-
cles are also produced artificially as core-shell particles have properties different from the
proporties of the core and shell material separately [Wu et al., 2008, Small et al., 2005].
Artificial core-shell particles can be used for e.g. coatings as core-shell particles with one
film forming polymer is enough to make film formation possible [Kan et al., 2001] and
hence the other polymer can provide the film some extra strength, resistance etc. Core-
shell particles can also be used for rubber-strengthening, adhesives and impact-resistance
plastic [Wu et al., 2008].
Due to the many systems containing core-shell like structures and the many applications
of core-shell particles research has been done to investigate the behaviour and properties
of core-shell particles to get a thorough understanding of core-shell particles in different
systems. Thus the structure and morphology of core-shell particles are widely studied
[Semenov et al., 1999, Wu et al., 2008, Kan et al., 2001] along with the water uptake in a
dry films of core-shell particles [Wu et al., 2008, Kan et al., 2001]. Additionally, core-shell
particles with polyelectrolyte shell are studied in suspension regarding stability and floc-
culation [Fritz et al., 2002, Borget et al., 2005] and determination of osmotic coefficients
[Das et al., 2002]. The last two properties concern polyelectrolyte core-shell particles in-
teraction with water which is important since polyelectrolyte core-shell particles are always
considered in aqueous suspension.
One way to measure the behaviour of water associated with core-shell particles is to
measure the water activity (aw). The term water activity is used to describe the effec-
tive amount of water in a given mixture or solution [Chaplin, 2008] and is defined as
aw = Paq/P∗aq [Blandamer et al., 2005]. The water activity reflects both the colligative
properties of a system along with the specific interactions between water and solutes as
well as surfaces of e.g. colloids dispersed in the water [Chaplin, 2008]. Therefore water
activity measurements can provide an understanding of the osmotic pressure associated
with suspensions of polyelectrolyte core-shell particles as well as drying and adsorption
behaviour of core-shell particles. For example water activity measurements may give in-
formation on the extent of the hydration of polyelectrolyte core-shell particles.
No reports on water activity or osmotic pressure measurements for polyelectrolyte core-
shell particles in the concentrated range have been found in the literature and only few
reports concerning the osmotic pressure for dilute suspensions [Das et al., 2002]. Hence
11
CHAPTER 3. INTRODUCTION
the focus of this project is to measure the water activity of polyelectrolyte core-shell par-
ticles in order to answer the following question:
Is it possible to obtain information on the interactions between polyelectrolyte core-shell
particles and water by water activity measurements?
The measurements will be conducted on a model system of poly(styrene-co-acrylic acid)
core-shell (PS-PAA) particles. The particles will be investigated mainly in their deproto-
nated form i.e. with a shell of sodium polyacrylate. PS-PAA particles in the protonated
form will be measured as well to obtain information of the charges and the counterions
impact on the water activity. Additionally model substances for the different parts of the
particles will be measured individually in order to determine the different parts impact on
the water activity. For all samples the water activity will be measured by a chilled-mirror
dewpoint method at different concentrations. Additionally the particles of poly(styrene-
co-sodium polyacrylate) (PS-NaPAA) will be investigated at different temperatures. For
dilute suspensions the osmotic pressure will be measured using membrane osmometry.
For comparison a sample of PS-NaPAA particles will be dried using thermogravimetry.
12
4. Theory
In order to be able to interpret the measured water activity it is necessary to review
the relevant theory. Hence this chapter starts with a short summary of the definition of
water activity and osmotic pressure. As the water activity for PS-NaPAA particles will
be measured in a large concentration range the system may be partly described by the
theory for polyelectrolyte solutions and partly by adsorption theory, hence this chapter
proceed with descriptions of both theories. Additionally an interpretation of the water
activity for a polyelectrolyte-water system is given. Finally the relevant research results
for core-shell particles are reviewed.
4.1 Water activity and osmotic pressure
As mentioned the water activity is defined as [Blandamer et al., 2005]
aw =Paq(T )
P ∗aq(T )(4.1)
=RH
100
where Paq is the partial water vapour pressure, P ∗aq is the saturated water vapour pressure
at the same temperature and RH is the relative humidity in percentage.
The water activity can also be expressed as [Blandamer et al., 2005]
aw = γwxw (4.2)
where γw is the activity coefficient of water and xw is the mole fraction of water. Hence
xw describe the colligative part of aw and γw describe the specific interactions between
water and the solutes.
The chemical potential of water is related to the water activity of a given mixture by
[Blandamer et al., 2005]
µ = µ∗ +RT ln aw (4.3)
where µ is the chemical potential of water in the solution/suspension, µ∗ is the chemical
potential of pure water, R is the gas constant, T is the temperature and aw is the water
activity.
The relation between the change in the chemical potential of water and the chemical
potential of the solutes is given by the Gibbs-Duhem equation [Atkins and de Paula, 2002]
13
CHAPTER 4. THEORY
∑nidlnµi = 0 (4.4)
where ni is the number of moles of specie i and µi is the chemical potential of specie i.
Hence a change in the chemical potential for water is compensated by a change in the
chemical potential for the solutes.
The water activity is related to the osmotic pressure as [Chang, 2000]
Π =RT
Vmln aw (4.5)
where Π is the osmotic pressure, R is the gas constant, T is the temperature, Vm is the
partial molar volume of water and aw is the water activity.
4.2 Polyelectrolyte solutions
A polyelectrolyte in water consist of a polyion and its counterions [Vlachy, 2008].
The counterions are associated with the polyion either by attractive coulombic forces,
called physical association, or by specific site-binding, called chemical association
[Daoust and Hade, 1976]. In the former binding type the counterions are not not
bonded to the polyion whereas in the latter binding type the counterions are chemi-
cally bounded to the charged groups on the polyions and hence the overall charge is
reduced [Daoust and Hade, 1976]. Counterions chemically associated with the polyion
are also referred to as condensed [Manning, 1969]. The main difference between phys-
ical and chemical association is that the charge on the polyion and the counterion are
both hydrated when physical associated whereas the specific site-binding generally results
in a dehydration of the charges [Daoust and Hade, 1976]. The identity of the counter-
ions greatly influences the properties of the polyelectrolyte as do the identity of the
charged and uncharged groups on the polyion [Vlachy, 2008]. The counterions influ-
ence on the properties can be attributed to the degree of hydration of the counterions
[Vlachy, 2008, Daoust and Hade, 1976] and to the energy needed to release the from the
polyion [Daoust and Hade, 1976].
4.2.1 Charge density parameter
One way to model the amount of counterions chemically associated with the polyelec-
trolyte is the charge density parameter [Manning, 1969]. The charge density parame-
ter is the Bjerrum length divided by the distance between the charges on the polyion
14
4.2. POLYELECTROLYTE SOLUTIONS
[Manning, 1969] and hence it is defined as [Vlachy, 2008]
ξ =e20
4πε0εrkBTb(4.6)
where e0 denotes the elemental charge, ε0 is the dielectric constant of vacuum, εr is the
relative dielectric constant of the solvent, kB is Boltzmann constant, T is the temperature
and b is the distance between charges projected to the streched backbone of the polyion.
The Bjerrum length is defined as the distance between charges where the electrostatic
interaction energy equals the thermal energy kBT [Das et al., 2002]. If the charge density
parameter is below one the distance between two charges on the polyion is longer than the
Bjerrum length and the system is stable. If the charge density parameter is above one the
polyion charges have an unfavourable interaction which can be compensated by counterion
condensation until the charge density parameter is below one [Manning, 1969]. This
theory for ion condensation is derived for infinite dilute solutions which is not practical
obtainable [Manning, 1984] and therefore the charge density parameter can not be used
quantitatively [Blaul et al., 2000]. Though the theory can still be used in a qualitative
manner [Blaul et al., 2000].
4.2.2 Osmotic coefficient
An often used parameter to describe polyelectrolytes interaction with water is the osmotic
coefficient [Vlachy, 2008]. The osmotic coefficient relates the the real osmotic pressure to
that of the ideal solution, hence it is given by [Vlachy, 2008]
ϕ =Πreal
Πideal
=lnawlnxw
(4.7)
where ϕ is the osmotic coefficient, Π is the osmotic pressure, aw is the water activity and
xw is the mole fraction of water. Since the osmotic coefficient is calculated as the natural
logarithm to the water activity and the mole fraction of water, a small deviation in the
water activity results in a larger deviation in the osmotic coefficient.
The osmotic coefficient has been interpreted in several ways. When it is assumed that
bound counterions do not contribute to the osmotic pressure, the osmotic coefficient cor-
respond to the fraction of free counterions [Rice and Nagasawa, 1961]. Manning [1969]
does not agree with this interpretation since his calculations show that (1-ϕ) is not simply
the fraction of counterions condensed on the polyelectrolyte but rather a combination of
condensed counterions and Debye Huckel interactions on the free counterions. Neverthe-
less the osmotic coefficient is still today interpreted as the fraction of free counterions at
infinite dilution [Filho and Maurer, 2008]. As seen in equation 4.7 the osmotic coefficient
15
CHAPTER 4. THEORY
is correlated to the water activity and hence Vlachy [2008] interprets an increase in os-
motic coefficient as a stronger hydration of solutes. The osmotic coefficient is only slightly
dependent on the nature of the counterions [Vlachy, 2008].
For polyelectrolyte core-shell particles the osmotic coefficient of dilute solutions can be
regarded as the fraction of counterions which are not trapped in the shell of the core-shell
particles [Das et al., 2002].
4.2.3 A model for osmotic coefficient of polyelectrolytes
It is desirable to model the water activity measurements for the particles in suspension
by a model based on the theory for polyelectrolyte solutions. From such a model it will
be possible to distinguish the concentration range for which the particle-water system
is described by the theory for polyelectrolyte solutions. Additionally such a model may
provide some information of the activity coefficients for the counterions and the particles
(polyions) and hence by use of the Gibbs-Duhem equation give an idea of whether it is
the polyion or the counterions that causes the changes in water activity.
One attempt to model the non-ideality of polyelectrolyte solutions has been made by Filho
and Maurer [2008] who has developed a semiempirical model for the osmotic coefficients
of polyelectrolyte solutions. The model by Filho and Maurer [2008] is based on the
model derived by Pitzer [1973] for simple electrolytes along with polyelectrolyte theory
derived by Manning [Filho and Maurer, 2008]. Filho and Maurer [2008] had shown that
this model fits adequately to measured osmotic coefficients for e.g. sodium polyacrylate,
hence this model will be used to fit to the measurements in this project. In the following
the model by Filho and Maurer [2008] will be described followed by a brief discussion of
the limitations of the model.
The theoretical osmotic coefficient which must be fitted to the experimentally determined
osmotic coefficient are calculated as [Filho and Maurer, 2008]
ϕ =−Mwmp(1 + σ) + 2AϕMw
I1.5
1+b√I− 2Mw(λ0
c,p + λ1c,pexp(−α
√I))mcmp
−Mwmp(1 + rp)(4.8)
where Mw is the molar mass of water, mp is the molal concentration of polymer, σ is
the number of free charges per polyelectrolyte, Aϕ is the Debye-Huckel parameter which
is 0.3914 kg0.5mol−0.5 at 25 oC [Filho and Maurer, 2008], I is the ionic strength, b is
a constant equal to 1.2 kg0.5mol−0.5 at 25 oC [Pitzer, 1973], λ0c,p and λ1
c,p are interac-
tion parameters, α is a constant equal to 2.0 kg0.5mol−0.5 [Pitzer, 1973], mc is the molal
counterion concentration and rp is the number of monomers per polyion.
As the osmotic coefficient is calculated according to equation 4.7 the numerator in equa-
tion 4.8 corresponds to ln aw whereas the denominator corresponds to lnxw where all
16
4.2. POLYELECTROLYTE SOLUTIONS
counterions and polyions is taking into account [Filho and Maurer, 2008].
The expression for ln aw can be split into three contributions. The first term in the
numerator corresponds to lnxw taking only the free counterions and the polyions into
account. The second and third term are expressions for lnγw derived from the excess
Gibbs energy [Filho and Maurer, 2008]. The excess Gibbs energy regards the interac-
tion between the solutes [Filho and Maurer, 2008]. As depicted in figure 4.1 three dif-
ferent interaction pairs are present: counterion-counterion, polyion-polyion and polyion-
counterion. The model by Filho and Maurer [2008] regards only the the interaction
between unlike charges ions i.e. the polyion-counterion interaction which is depicted by
Figure 4.1: A part of a polyion and the corresponding counterions. The interactionsbetween the charged of the same sign (−−−) and unlike sign (· · · ) is depicted.
the small dotted lines in figure 4.1. A part of the interactions between the ions can be
attributed to coulomb forces [Filho and Maurer, 2008]. This part is denoted the long
range interactions and is described by the second term in the numerator in equation 4.8
[Filho and Maurer, 2008]. The remaining part of the interactions is denoted the short
range interaction [Filho and Maurer, 2008] and is given by the third term in the numera-
tor in equation 4.8.
mc is calculated as mc = σmp. σ is calculated as rp times the fraction of free counterions
εp. εp is assumed to be independent of concentration [Filho and Maurer, 2008] and is
obtained as the osmotic coefficient at infinite dilution i.e. the limiting osmotic coefficient
[Filho and Maurer, 2008]. The ionic strength is calculated as [Filho and Maurer, 2008]
I = 0.5∑
miσiz2i (4.9)
where mi is the molal concentration of solute i, σi is the number of charged groups per
molecule of i and zi is the valence of each charged group.
When λ0c,p and λ1
c,p is determined by fitting equation 4.8 to the experimental data, the
activity coefficients for the counterions and the polyions can be calculated according to
equation 4.10-4.13. As for the water the activity coefficients it divided into a long range
and a short range activity coefficient. The long range activity coefficient is calculated as
17
CHAPTER 4. THEORY
[Filho and Maurer, 2008]
lnγLRi = −Aϕσiz2i (
2
bln(1 + b
√I) +
√I
1 + b√I
) (4.10)
where γLRi is the activity coefficient for specie i regarding the the long range interaction.
The similar expression for the short range activity coefficient is [Filho and Maurer, 2008]
lnγSRi = 2(λc,p(I)mi + λc,p(I)mj) (4.11)
where λc,p(I) is calculated as [Filho and Maurer, 2008]
λc,p(I) = λ0c,p + λ1
c,p
2
α2I(1− (1 + α
√I)exp(−α
√I)) (4.12)
From equation 4.10-4.12 the activity coefficient of the counterions and the polyions can
be calculated as
γi = γLRi γSRi (4.13)
Since the values of the calculated activity coefficients for the counterions and the polyions
are determined by the model, the proportion between the activity coefficients for counter-
ions and polyions depends only on the model and not on the real system. Thus the model
cannot be used to describe the actual correlation between counterions, polyelectrolyte and
water in the system.
As noted the Filho and Maurer model is semiempirical. Hence the model must be fitted
to measurements in a concentration range for which the particles is clearly in suspension.
Thus the concentration range in which the particle suspension behaves like a polyelec-
trolyte suspension can be interpreted as the concentration range for which the model
approaches the measurements.
4.3 Adsorption
Most theory for adsorption is concerned with the adsorption of a gas to a solid. Even
though the system under investigation consist of liquid water and a solid the theory for
gas adsorption must still be applicable since the liquid water is in equilibrium with water
vapour.
4.3.1 Types of adsorption
Adsorption of a gas to a solid can be examined by studying the adsorption isotherms
for the system. Normally the isotherms are one of the types shown in figure 4.2
18
4.3. ADSORPTION
[Hiemenz and Rajagopalan, 1997, Lyklema, 1995]. The amount of adsorbed gas is given
as a volume in figure 4.2 but other quantities are equally usable [Lyklema, 1995].
Figure 4.2: The five general isotherms for adsorption. The isotherm is plotted asthe volume of adsorbed gas as a function of the relative pressure.
Type I is observed for monolayer adsorption i.e. when only one layer of adsorbate is ad-
sorbed [Hiemenz and Rajagopalan, 1997]. Additionally this type of adsorption is observed
for microporous solid [Lyklema, 1995]. Type II is observed for multilayer adsorption i.e.
there is no upper limit for the adsorbed amount of gas [Hiemenz and Rajagopalan, 1997].
Type III corresponds to multilayer adsorption where the enthalpy of adsorption is less
negative than the enthalpy of liquefaction [Hiemenz and Rajagopalan, 1997]. Both type
II and III are observed for adsorption of gas onto non-porous or macroporous adsor-
bents [Lyklema, 1995]. Type IV and V are adsorption isotherms similar to II and III
respectively, but for porous adsorbents [Hiemenz and Rajagopalan, 1997]. The upper
limit for adsorption observed in type IV and V is due to condensation of gas ind the
pores [Hiemenz and Rajagopalan, 1997]. The hysteresis loops results from the different
behaviour of adsorption and desorption due to the pores [Lyklema, 1995].
4.3.2 BET isotherm
Many efforts have been made to model the different isotherm in order to achieve insight
into the physical characteristics of the systems investigated [Lyklema, 1995]. In the fol-
19
CHAPTER 4. THEORY
lowing the BET isotherm is described as it is one of the most widely used isotherms
for multilayer adsorption, which is the most common type of adsorption of a gas to a
solid [Lyklema, 1995]. The BET isotherm can describe both type II and III adsorption
[Lyklema, 1995].
The BET isotherm is derived by evaluating the rate of adsorption and desorp-
tion for multiple layers [Hiemenz and Rajagopalan, 1997]. The resulting equation is
[Atkins and de Paula, 2002]
V/Vmono =c · x
(1− x)(1 + (c− 1)x)(4.14)
where V is the adsorbed volume, Vmono is the volume in the monolayer, x is the relative
pressure i.e. for water x = aw and c is a constant defined as [Atkins and de Paula, 2002]
c = e∆Hdes−∆Hvap
RT (4.15)
where ∆Hdes and ∆Hvap is the enthalpy of desorption and vaporization respectively, R is
the gas constant and T is temperature. In equation 4.14 the amount of adsorbed gas is
given as a volume but other quantities are equally valid e.g. if the gas is water vapour
the water content Y can be used.
The BET isotherm can be rewritten to obtain the relative pressure as a function of the
amount of adsorbed gas. This conversion is given in equation 4.16 for adsorption of water
to a solid i.e. x is substituted by aw and V is substituted by Y.
aw =Y c− 2Y − Ymonoc+ (Y 2c2 − 2Y Ymonoc
2 + 4Y Ymonoc+ Y 2monoc
2)0.5
2(Y c− Y )(4.16)
Equation 4.16 is denoted the inverted BET isotherm and can be used to describe the water
activity as a function of the water content. The isotherm corresponding to equation 4.16
is given in figure 4.3 along with an isotherm corresponding to equation 4.14.
According to equation 4.14 or 4.16 and 4.15 the BET isotherm can give values for both
the enthalpy of desorption and the amount of e.g. water in the monolayer. Though
the determination of ∆Hdes − ∆Hvap from c according to equation 4.15 provides only a
rough estimate, as c additionally include any entropic contribution and deviations of the
adsorption pattern between the model and the system [Lyklema, 1995]. The deviation in
adsorption pattern can be due to heterogeneity of the solid surface [Lyklema, 1995].
20
4.3. ADSORPTION
0
1
2
3
0 0.5 1
aw
Y
0
0.5
1
0 1 2 3Y
a w
Figure 4.3: Left: The BET isotherm for water content as a function of water activity.Right: The inverted BET isotherm for water activity as a function of water content.Ymono = 0.1 and c = 10.
4.3.3 Isosteric enthalpy of adsorption
The isosteric enthalpy of adsorption is the enthalpy of adsorption of a gas to a solid with
a constant coverage of the solid [Hiemenz and Rajagopalan, 1997]. Hence the equilibrium
under investigation is
H2O(g) H2O(ads) (4.17)
where g denoted gas and ads denote adsorbed. The isosteric enthalpy of adsorption for
the system described by equation 4.17 can be determined by [Atkins and de Paula, 2002]
dlnp
d(1/T )=
∆Hads
R(4.18)
where p is the pressure of the gas, T is the temperature, ∆Hads is the isosteric enthalpy
of adsorption and R is the gas constant. Hence the isosteric enthalpy of adsorption can
be calculated from the slope of a straight line of lnp vs. 1T
.
By substituting p in equation 4.18 by the expression for p given by the definition of water
activity in equation 4.1 the following rewriting is made
d(ln aw + lnp∗)d(1/T )
=∆Hads
R(4.19)
mdln awd(1/T )
+dlnp∗d(1/T )
=∆Hads
R(4.20)
As the term containing p∗ is known to give the condensation enthalpy divided by the
gas constant, the enthalpy of adsorption can be separated into a part concerning the
condensation enthalpy an a part concerning the excess enthalpy due to adsorption of gas
21
CHAPTER 4. THEORY
to solid. Hence equation 4.19 is rearranged to
dln awd(1/T )
+dlnp∗d(1/T )
=∆Hexcess
R+
∆Hcon
R(4.21)
where ∆Hexcess and ∆Hcon denote excess and condensation enthalpy respectively. Hence
∆Hexcess can be obtained by fitting a straight line to a plot of ln aw vs. 1T
. ∆Hexcess can
also be obtained from the slope of the straight line of ln γw vs. 1T
since aw = xw γw and
xw is independent of the temperature.
The negative excess enthalpy is also denoted the net isosteric heat of sorption
[Mulet et al., 1999].
Note that in theory ∆Hexcess has the same numerical value but the opposite sign as
∆Hdes −∆Hvap which can be obtained from a BET fit.
4.4 A theory for interpretation of water activity
In the following a theory for the interpretation of the relationship between relative hu-
midity and concentration for polyelectolyte solutions is given. As the relative humidity is
simply the water activity in percentage this theory may be useful for the interpretation
of the measurements in this study.
Thijs and coworkers [2007] had measured the weight change for dried samples of poly-
electrolytes exposed to air with different relative humidities. The results for sodium
polyacrylate (particle size <1000 µm) and poly(acrylic acid) (Mn=1800 g/mol) is shown
in figure 4.4. The samples of sodium polyacrylate is observed to have almost constant
Figure 4.4: The weight change for samples of poly(acrylic acid) (•) and sodiumpolyacrylate (�) as a function of relative humidity according to Thijs and coworkers[2007].
22
4.5. CORE-SHELL PARTICLES
weight at RH<40 % above which a gradually larger increase in weight change per RH is
observed with increasing RH. For PAA the weight change per increase in RH is gradually
increased as RH increases but less pronounced than for sodium polyacrylate.
According to Thijs and coworkers [2007] the almost constant weight of at low RH may
be caused by a conformation of the polymer for which water interaction is unfavorable.
To compensate for the energy needed to change the polymer conformation to a confor-
mation for which hydration is more favorable the first hydration shell must be formed
[Thijs et al., 2007]. When the conformation is changed water is much easier adsorbed to
the polymers and hence the water uptake increases at higher RH.
4.5 Core-shell particles
The core-shell particles used in this study has no added crosslinker and hence the
poly(acrylic acid) (PAA) in the shell is assumed to be linear polymers with one end
attached to the polystyrene core. This type of core-shell particles are sometimes referred
to as spherical polyelectrolyte brushes [Das et al., 2002].
The size of the core-shell particles depends on the charge of the shell and the elasticity
of the polyelectrolyte chains, as the counterions in the shell increase the osmotic pressure
and thereby draws water into the shell [Guo and Ballauff, 2001]. Since PAA is a weak
polyelectrolyte the charge of the shell and hence the size of the particles depends on pH.
For polystyrene colloids with poly(acrylic acid) brush the size is found to increase in the
range pH 3-9 above which the shell is completely swollen i.e. the poly(acrylic acid) chains
is fully stretched and hence constant [Guo and Ballauff, 2000]. Below pH 3 the shell is
collapsed [Guo and Ballauff, 2000]. A schematic representation of the charged core-shell
particle is shown in figure 4.5.
The counterions in a suspension of core-shell polyelectrolyte colloids can be classified into
three groups: Ions condensed on the polyelectrolyte i.e. chemically associated ions, ions
which can move freely within the shell but not leave the shell, and ions which are not
confined to the shell [Dingenouts et al., 2004]. The three groups of counterions is depicted
at A, B, and C in figure 4.5 respectively.
Small-angle neutron scattering measurements on isotop labeled counterions in copoly-
meric micelles with a polyelectrolyte coronal layer had shown that all counterions with a
10 % error margin were trapped within the coronal layer [Groenewegen et al., 2000]. Din-
genouts and coworkers [2004] have used anomalous small-angle x-ray scattering to show
that the counterions in polyelectrolyte brushes follow the distribution of polyelectrolyte
i.e. counterions are confined within the coronal layer. Osmotic coefficient determinations
for core-shell particles in dilute suspensions confirm the trapping of counterions in the
23
CHAPTER 4. THEORY
Figure 4.5: A schematic representation of a charged core-shell particle. The blackcircle represent the core whereas the dashed circle represent the surface of theshell. Some of the polyelectrolyte chains is depicted in the shell. A: a counterioncondensed on the polyion, B: a counterion free to move within the shell and C: acounterion which can leave the shell.
shell [Das et al., 2002]. Furthermore the osmotic coefficient of these colloidal suspensions
are independent of polymer concentration i.e. the fraction of free counterions are constant
[Das et al., 2002].
When the polyelectrolyte chains are anchored close enough on the core, the distance be-
tween the chains is smaller than the local screening length and hence the distribution of
counterions is only depend on the distance from the core [Dubreuil and Guenoun, 2001].
The radial distribution of counterion resembles the distribution of monomeric units of the
polyelectrolyte [Dubreuil and Guenoun, 2001, Dingenouts et al., 2004].
24
5. Experimental approach
As mentioned in chapter 3 on page 11 the PS-PAA samples will be investigated both in
their protonated and in their deprotonated form to study the contribution to the water
activity from the charges and the counterions. It is chosen to focus on sodium as counter-
ion i.e. all measurements will be performed on samples containing sodium as counterion
unless the sample is in the protonated form. In order to achieve PS-PAA particles with
deprotonated acid groups (denoted PS-NaPAA) pH in the PS-PAA suspension will be
increased to pH 9.5, which is determined to be the equivalence point [Nielsen, 2009] for
the particles in a 0.1 M NaClO4 solution.
To be able to correlate the measured water activity to the different parts of the PS-NaPAA
particles, substances resembling the different parts of the particles are measured individ-
ually. Hence bare polystyrene (PS) particles, free sodium polyacrylate (NaPAA) and
sodium acrylate (abbreviated NaAc) will be measured in the same concentration range.
The free sodium polyacrylate will be obtained by adjusting pH to 9.5 in solutions of PAA.
Since there is evidence that the water activity of some polymer solutions depends on the
molecular weight of the polymer [Money, 1989], the size of the free PAA must be cho-
sen to correspond to the size of the PAA in the shell. Hence the size of the PAA shell
must be determined. According to [Christensen, 2008] the PAA chains is fully stretched
above pH 9.3 and completely collapsed at pH 3. Thus the size of the PAA chain will be
determined by measuring the size at pH 9.5 and pH 3. The size of the particles will be
determined by dynamic light scattering as this method is well suited for determination of
the size of polyelectrolyte core-shell particles [Guo and Ballauff, 2001]. The procedure for
calculating the size of the chains can be found in appendix A.2. The size determined in
this manner corresponds to the size of the longest PAA chains [Guo and Ballauff, 2001].
The water activity will be measured using a chilled-mirror dewpoint method as
this method is comparable simple and can be used in a large concentration range
[Decagon Devices, Inc, 2008].
To be able to measure the water activity for concentrated samples, the suspensions/solu-
tions will be freeze-dried. Freeze-drying is chosen to concentrate the samples as prelim-
inary experiments show that freeze-drying do not damage the samples (cf. appendix B
on page 77). The concentration of the samples will be stepwise decreased by addition of
water. The samples will not be stirred after addition of water as preliminary experiments
(not shown) showed that stirring result in sample loss.
The concentrations of the samples will be calculated according to the dry matter content
in suspensions before freeze-drying. After each experiment the dry matter content will be
25
CHAPTER 5. EXPERIMENTAL APPROACH
determined to measure the sample loss during the experiments.
To be able to fit the model by Filho and Maurer [2008] the limiting osmotic coefficient must
be obtained. Hence diluted suspensions of PS-NaPAA will be measured using membrane
osmometry, since membrane osmometry can measure the osmotic pressure for samples to
dilute to be measured using the chilled-mirror dewpoint method.
Besides the measurements of water activity as a function of water content (i.e. gram water
per gram dry matter, denoted Y), the water activity for PS-NaPAA is also studied as a
function of temperature to be able to calculate the excess enthalpy for water associated
with the PS-NaPAA particles as described in section 4.3.3 on page 21. In order to keep
the water content constant in a series of measurements the water activity at different
temperatures are measured in continuation of each other without any interruption.
Since the relative humidity (RH) of the laboratory may cause water uptake or evaporation
from the samples, the relative humidity in the laboratory will be measured.
For comparison a sample of PS-NaPAA will be measured using simultaneous thermal
analysis (STA) to dry a sample at constant temperature. The flux in mass loss can be ob-
tained from this measurement and as the flux is proportional to the water vapor pressure
above the sample these measurements can be compared to the water activity measured as
a function of water content. Additionally the energy needed to evaporate the water from
the PS-NaPAA suspension can be compared with the excess enthalpy determined from
the measurements of water activity as a function of temperature.
Thus the particles will be initially characterised to obtain the size of the particles and the
dry matter content. The water activity for the PS-NaPAA will be measured both as a
function of water content and as a function of temperature. The measured water activity
as a function of water content will be fitted with both the model by Filho and Maurer
[2008] and with the BET isotherm as these may describe different parts of the concentra-
tion range. Additionally samples of PS-PAA, NaAc, PS and NaPAA will be measured as
a function of water content to be able to interpret which part of the PS-NaPAA particles
that has the largest impact on the water activity. Finally the PS-NaPAA suspension will
be dried using STA.
26
6. Methods
The suspensions of PS-PAA particles studied in this project is synthesised by free-radical
surfactant-free emulsion polymerisation using a procedure similar to the procedure de-
scribed by [Hinge, 2006]. Though the synthesis is performed without extra salt and the
acrylic acid is added after 1 hour of styrene polymerisation. After synthesis the PS-PAA
is purified by dialysis.
Suspensions of bare PS particles is produced by the same procedure as the PS-PAA sus-
pension by omitting the addition of acrylic acid1.
6.1 Determination of dry matter content
The dry matter content in the suspensions of PS-PAA is determined in triplicate accord-
ing to [DS 204, 1980]. Aluminum weigh dished are dried in an oven (Model UE 200,
Memmert, Germany) at 105 oC in an hour. The weigh dishes are cooled in a desiccator
and weighed (Mettler AM100, Switzerland). Each dish is added 3 ml of the PS-PAA
suspension (shaken). The dishes with PS-PAA is dried in a 105 oC oven for at least 20
hours, cooled in a desiccator and weighed.
Dry matter content for the suspension of bare PS particles is determined using the same
procedure. Additionally the dry matter content of PAA (Mw approx. 2000, Aldrich, Ger-
many) is determined according to the described procedure with the exception that the
dry aluminum dish containing the PAA is weighed before drying as well.
6.2 Size determination by dynamic light scattering
In order to calculate the size of the shell, the size of the PS-PAA particles is measured by
dynamic light scattering.
A stock suspension of 5 µl PS-PAA particle suspension and 25 ml demineralised water
is prepared. A part of the stock solution is adjusted to pH 3 (PHM200 MeterLabTM
Samples of free NaPAA is prepared by dissolving an appropriate amount of PAA in dem-
ineralised water and adjusting to pH 9.5. The samples are freeze-dried using the procedure
described above with the exception that the volume of the NaPAA solution is adjusted
to reached a total dry matter content of 0.3 - 0.35 g.
Sodium acrylate (97 %, Aldrich, USA) is used as received.
6.3.2 Water activity as a function of water content
The water activity of the samples are measured using Aqualab (Aqualab 4TE Decagon
Devices, USA) at a pre-set temperature (30 or 40 oC). The samples is measured numerous
times until three subsequent measurements differ by less than 0.0005. At this point no
significant change in water activity is assumed to take place. The sample cup is removed
from the Aqualab, closed and weighed immediately to obtain the water content (g water
per g solid) corresponding to the measured water activity.
A small amount of demineralised water (at least 5 µl) is added to the sample before a
new measurement is started. The amount of water added before each measurement is
gradually increased as the water activity increases. When more than 5 µl water is added
the water is added in portion to different parts of the sample to get are better initial
distribution of the water.
28
6.4. OSMOTIC PRESSURE BY MEMBRANE OSMOMETRY
This procedure is repeated until aw equals 1. When such measurement series are longer
than one day the sample is covered with the lid and placed in the laboratory overnight as
preliminary results show no change in water activity due to storage (cf. appendix C on
page 80).
After each measurement series the sample cup containing the sample and the lid is dried
for at least 20 h in an oven at 105 oC and subsequently weighed to verify the initial
calculated dry matter content. All measurement series is conducted twice except for PS.
At least once a day the relative humidity in the laboratory is measured using a capacitive
humidity sensor (Honeywell HIH-4000-001, Mexico).
6.3.2.1 Validation of method
To verify the procedure described in section 6.3.2 a sample of PS-NaPAA at pH 9.5
is freeze-dried. Demineralised water is added until aw ≈ 0.75 and the water activity
of the sample is measured at 30 oC using Aqualab several times over a period of 19
days. Between the measurements the sample is stored in a closed sample cup at room
temperature (approximately 22 oC).
6.3.3 Water activity as a function of temperature
A sample of PS-NaPAA at pH 9.5 is freeze-dried in a pre-weighed measurement cup with
a lid with air holes. After freeze-drying the lid is closed with parafilm. The sample is
weighed and the water activity is measured using Aqualab. The sample is measured in
the temperature interval 20-50 oC starting at 20 oC and increasing the temperature in
steps of 5 oC when three subsequent measurements differ by less than 0.0005. After
reaching a stable water activity at 50 oC the sample is weighed and demineralised water
is added. After weighing the sample the water activity is measured once again in the same
temperature range by repeating the described procedure. After finishing the measurement
series the sample cup and lid are oven-dried at 105 oC for at least 20 hours and weighed.
6.4 Osmotic pressure by membrane osmometry
The stock suspension of PS-PAA is adjusted to pH 9.5 with sodium hydroxide. Afterwards
the suspension is diluted and the dilutions are adjusted to pH 9.5 with the stock suspension
of PS-PAA. The osmotic pressure of the resulting suspensions is measured using membrane
osmometry (Osmomat 90, Gonotec Berlin, MWCO 20 kD). 0.6 ml of the investigated
suspension is repeatably injected into the membrane osmometer until the response for the
29
CHAPTER 6. METHODS
pressure difference across the membrane is constant. The measurements is corrected for
the pressure difference across the membrane before and after measuring the suspensions by
injection of demineralised water until a stable value for the pressure response is obtained.
6.5 Drying by simultaneous thermal analysis
5 ml of the stock suspension of PS-PAA was adjusted to approximately pH 9.5 by use of
sodium hydroxide. The suspension is centrifuged in 20 minutes at 20 oC with a speed of
15000 rpm (Eppendorf Centrifuge 5403, Germany). The supernatant is removed and the
pellet is used for measuring by simultaneous thermal analysis (STA) (Netzsch STA 449
C, Jupiter, Germany). Approximately 40 mg of the concentrated PS-NaPAA sample is
transfered to a pre-weigh aluminium crucible and weighed. The crucible is placed in the
STA and dried at 40 oC under an air flow of 40 ml/min. The samples are measured with
240 measurement points per min.
From the measured mass loss the flux is calculated by numeric differentiation over 400
points. The energy input from STA is converted to a quantity proportional to the enthalpy
by dividing the energy input with the calculated flux.
30
7. Results
In this chapter the results are presented. The different samples are denoted with the
the abbreviation for the substance followed by the temperature at which the sample is
measured and a number indicating if it is the first or the second measurements series for
the given substance at the given temperature. Thus PS-NaPAA-30-1 is the first sample
of PS-NaPAA at 30 oC. For the samples measured by membrane osmometry the same
notation is used except a M is added before the number of the measurement e.g. PS-
NaPAA-30-M1. For the samples measured at different temperatures a T is used instead
of the temperature e.g. PS-NaPAA-T-1.
7.1 Initial characterisation of the particles
Table 7.1 shows some characteristics for the PS-PAA and the PS particles. The dry matter
content is determined as described in section 6.1 and the charge density (σ, charges per
gram dry matter) is taken from [Nielsen, 2009]. The size of the particles is measured as
described in section 6.2 on page 27. During the measurements at pH 9.5, pH decreased
slightly but no tendency between the decrease in pH and the determined size was observed.
The remaining values given in table 7.1 are calculated according to appendix A on page 73
from the dry matter content, σ and the size.
Table 7.1: Selected characteristics for the PS-PAA and PS particles. σ denotesthe charges per gram drymatter, rcol and rswol denotes the radius of the collapsedand the swollen particle respectively, rcore is the radius of the core, MPAA is themaximum molecular weight of each PAA chain in the shell, cp is the concentrationof particles, and zp is the number of charges per particle. The values are calculatedaccording to appendix A on page 73. *[Nielsen, 2009].
For all PS-NaPAA particles xw for one hydration layer (4 water molecules per sodium
ion [Cotton et al., 1995]) on each sodium ion is xw = 0.80 where as complete hydration
(16.6 water molecules per sodium ion [Cotton et al., 1995]) of all sodium ions correspond
to xw = 0.94. The corresponding values for NaPAA-30-1 is xw = 0.78 and xw = 0.94
and for NaPAA-30-2 xw = 0.79 and xw = 0.94.
The charge density parameter is calculated by equation 4.6 on page 15 to be 2.33 at 30 oC
(εr is taken from [Fernandez et al., 1995]).
7.2 Water activity as a function of water content
The water activity for samples of PS-NaPAA, PS, PS-PAA, NaPAA, and NaAc was mea-
sured as a function of water content by the method described in section 6.3.2 on page 28.
In order to validate this method, the water activity for a sample of PS-NaPAA was mea-
sured repeatably over a period of 19 days as described in section 6.3.2.1. The results for
these measurements is presented in the following section.
7.2.1 Validation of method
To validate the method for measuring the water activity described in section 6.3.2, aw
was measured repeatably in a PS-NaPAA sample over a period of 19 days. aw measured
in this period and the corresponding water content is shown in figure 7.1 as function of
32
7.2. WATER ACTIVITY AS A FUNCTION OF WATER CONTENT
0
0.2
0.4
0.6
0.8
0 2 4 6 8 10 12 14 16 18 20
Time [days]
a w
0
0.1
0.2
0.3
0.4
Y [g
/g]
Figure 7.1: The water activity (�), water content (+), and the relative humidity ofsurroundings (•) as a function of time.
time along with the relative humidity of the surroundings.
The fall in water activity measured during the first 10 days is due to the evaporation of
water from the sample. After 10 days the water activity cease at approximately aw = 0.3,
which corresponds to the relative humidity in the laboratory. In the period from day 10
until day 19 no distinct tendency is observed in the water activity, hence equilibrium may
be established in the sample. The measured aw may not be the true equilibrium water
activity, since the sample is stored at a lower temperature between the measurements,
than the measurement temperature, thus a new equilibrium must first be established dur-
ing the measurement. The variation in the water activity measurements is not observed
to depend on the variation of the relative humidity of the surroundings.
In figure 7.2 the water activity from the above mentioned experiment is plotted against
Y and compared to the water activity measured for two samples at 30 oC measured ac-
cording to section 6.3.2 on page 28.
For the measurement series measured over a period of 19 days the highest value for aw
is obtained at day 1. The approximately constant water activity observed in figure 7.1 is
observed at Y = 0.12 in figure 7.2. According to figure 7.2 the water activity measured
over a period of 19 days differs more and more from the water activity measured in the
ordinary way as equilibrium is established in the sample cup. Hence equilibrium may not
33
CHAPTER 7. RESULTS
0
0.2
0.4
0.6
0.8
1
0 0.1 0.2 0.3 0.4 0.5 0.6 0.7 0.8 0.9 1
Y [g/g]
a w
Figure 7.2: The water activity (� and �) measured as described in section 6.3.2 asa function of water content and the water activity (�) measured over a period of19 days as a function of water content. The highest value for aw is obtained of thefirst day of measurement after which aw decreases.
be established in the two ordinary measurements series. As seen in figure 7.2 the two
measurements series without long equilibration time are slightly different as well. This
difference may depend on how far from equilibrium the measurement is performed. As the
measurements is most likely not at equilibrium, the measurements may not be accurate,
but since the aw vs. Y tendency is reproduced for all three measurement series depicted
in figure 7.2 the measurements is assumed to reflect the reality.
When using the method described in 6.3.2 the amount of water added to the samples is
observed to be larger than the amount of water calculated from the weighing. This means
that water is evaporating from the samples.
In table 7.3 the relative humidity in the laboratory on the day of measurements is given
along with the percentage of the total amount of evaporated water which is assumed to
evaporate inside Aqualab. This amount of water is calculated by assuming that all the
water necessary to reach the measured water activities is evaporated from the sample i.e.
the water activity of the air in Aqualab is zero until water is evaporated from the sample.
Additionally the water vapour is assumed to behave ideally.
According to table 7.3 less than 25 % of the evaporated water can be ascribed to equi-
libration of the sample and the air in Aqualab. Thus water must evaporate somewhere
34
7.2. WATER ACTIVITY AS A FUNCTION OF WATER CONTENT
Table 7.3: The range for the relative humidity [%] in the laboratory on the days ofmeasurements for the given samples.
else in the procedure. No correlation between the theoretical evaporated amount of water
and the relative humidity in the laboratory is found. It is assumed that the water con-
tent calculated from the weighing represent the actual water content in the samples. The
negative value for PS-30 in table 7.3 is due to sample loss during measurement as will be
described later.
As described in this section the method described in section 6.3.2 may not give accurate
values for aw but the measurements obtain by this method is assumed to reflect the re-
ality. Hence the results obtained by this method for PS-NaPAA, PS, PS-PAA, NaPAA
and NaAc are presented in the following sections.
7.2.2 Poly(styrene-co-sodium acrylate) particles
Samples of PS-NaPAA was measured as a function of water content at both 30 and 40 oC.
The observations and results are presented in the following.
Table 7.4 shows the degree of charge neutralisation in the samples of PS-NaPAA. The
degree of neutralisation is calculated as the amount of sodium hydroxide divided by the
amount of acrylic acid groups present in the samples.
Table 7.4: The degree of neutralisation for the samples of PS-NaPAA.Sample Degree of neutralisationPS-NaPAA-30-1 0.998PS-NaPAA-30-2 0.991PS-NaPAA-40-1 1.016PS-NaPAA-40-2 0.963
As can be seen from table 7.4 all samples of PS-NaPAA is approximately neutralised.
35
CHAPTER 7. RESULTS
The freeze-dried samples of PS-NaPAA is a fluffy substance which is fixed to the bottom
of the sample cup as seen in figure 7.3left. Hence a minimum of sample is lost during the
measurement series. The conversion of sample dry matter content is confirmed by the
weigh after the the final drying of the samples, which deviates by less than 3.5 % from
the amount calculated from the known amount of PS-NaPAA in the suspension before
freeze-drying. The fluffy sample structure collapses gradually when water is added to the
Figure 7.3: Left: A sample of PS-NaPAA after freeze-drying. Right: A sampleof PS-NaPAA after freeze-drying and water addition. The holes in the samplecorrespond to the places where a drop of water has been added.
sample. The sample collapses completely at the specific site of water addition as seen
in figure 7.3right, whereas the remaining part of the sample is observed to collapse more
slowly as the water content is increased.
The water activity as a function of water content (Y) for the four samples of PS-NaPAA
is shown in figure 7.4. At higher water content than the range shown in figure 7.4 aw
approaches 1 and hence this part is omitted from figure 7.4 to give at better view of the
range in which aw is changing significantly.
According to figure 7.4 aw for the samples change in the same manner with increased wa-
ter content. The samples generally have a steep increase until Y ≈ 0.11. Above Y ≈ 0.11
aw increases less and less with increases water content. Figure 7.4 shows no significant
difference between the measurements at 30 and 40 oC except in the range 0.3<Y<0.8
where PS-NaPAA-40-1 is sligthly lower than the three others. Since this tendency is not
reproduces for PS-NaPAA-40-2, no clear tendency by varying the temperature is observed
and hence the remaining samples are only measured at 30 oC.
36
7.2. WATER ACTIVITY AS A FUNCTION OF WATER CONTENT
0
0.2
0.4
0.6
0.8
1
0 0.1 0.2 0.3 0.4 0.5 0.6 0.7 0.8 0.9 1
Y [g/g]
a w
Figure 7.4: The water activity as a function of water content for PS-NaPAA-30-1(�), PA-NaPAA-30-2 (�), PS-NaPAA-40-1 (N), PS-NaPAA-40-2 (N).
7.2.3 Bare polystyrene particles
The water activity was measured as a function of water content for one sample of PS
particles using the procedure described in section 6.3.2.
The freeze-dried PS is loose particles which do not stick to the sample cup as was the
case for PS-NaPAA. Hence a part of the PS sample was observed to be lost before, during
and after the measurement series. Figure 7.5 shows the water activity as a function of the
water content. As some of the sample is lost during the measurement series the measured
aw is plotted as a function of both the water content calculated according to the dry
matter content of the PS suspension and the water content based on the final dry matter
content. According to the weighting 13.3 % of the sample dry matter content is lost
during the measurement series.
According to figure 7.5 the water activity of PS increase to aw = 1 with in a very small
water content range. Since the water content based on the initial dry matter content is
calculated to be negative it is evident that sample is lost already before the measurement
series is started. The behaviour of the first three points is believed to be due to sample
loss as well. Taken the sample loss into account the water activity is assumed to increase
steeply towards aw = 1 at Y ≈ 0. Hence PS particles have no influence on the water
Figure 7.5: The water activity as a function of water content for PS-30-1. Thewater content is calculated from the initial dry matter content (�) and accordingto the final dry matter content (�).
activity. This is confirmed by the fact that the PS particles is observed to repel the water
added to the sample.
7.2.4 Poly(styrene-co-acrylic acid) particles
In order to determine the charges and the counterions impact on the water activity sam-
ples of PS-PAA is measured as a function of water content. The samples of PS-PAA is
assumed to be completely protonised.
The freeze-dried samples look similar to the freeze-dried PS-NaPAA. The final determi-
nation of the dry matter content deviates by less than 1 % from the initial dry matter
content. The measurement for aw as a function of water content is depicted in figure 7.6.
According to figure 7.6 aw increases steeply at low water content but above Y ≈ 0.05 the
water activity increases gradually less and less with increasing water content. The two
measurements series progress similar except for the lowest measured aw for PS-PAA-30-1
which is measured at higher water content than the following aw. No explanation for this
behaviour is found and hence it is assumed to be a experimental error.
38
7.2. WATER ACTIVITY AS A FUNCTION OF WATER CONTENT
0
0.2
0.4
0.6
0.8
1
0 0.1 0.2 0.3 0.4 0.5 0.6 0.7 0.8 0.9 1
Y [g/g]
a w
Figure 7.6: The water activity as a function of water content for PS-PAA-30-1 (�)and PS-PAA-30-2 (�).
7.2.5 Sodium polyacrylate
Two samples of PAA (Mw = 2 kD) was neutralised with sodium hydroxide and measured
according to the method in section 6.3.2. The degree of neutralisation of PAA in the Na-
PAA samples is given i table 7.5. It is noted that the NaPAA is only partly neutralised.
Table 7.5: The degree of neutralisation for the samples of NaPAA.Sample Degree of neutralisationNaPAA-30-1 0.766NaPAA-30-2 0.795
The freeze-dried samples of NaPAA appear as a glassy network which is partly fixed to
the bottom of the sample cup. According to the initial and final dry matter content ap-
proximately 4 % of the sample is lost during both of the measurement series. The water
activity as a function of the water content is depicted in figure 7.7 along with values from
the literature.
According to figure 7.7 the measured water activity increases with increasing water con-
tent. For both NaPAA-30-1 and NaPAA-30-2 the water activity increases most steeply
until Y ≈ 0.3. Above Y ≈ 0.3 aw increases less with increased water content. The water
activity do not reach one before Y ≈ 15 (not shown in figure 7.7). The water activity as a
39
CHAPTER 7. RESULTS
0
0.2
0.4
0.6
0.8
1
0 0.5 1 1.5 2 2.5 3
Y [g/g]
a w
Figure 7.7: The water activity as a function of water content for NaPAA-30-1 (•)and NaPAA-30-2 ( •) Mw = 2 kD. Additionally literature data is shown for PAA1250 kD (4) [Hwang et al., 1998], PAA Mn=1.8 kD (×) and NaPAA <1000 µm(◦) [Thijs et al., 2007] along with the model for NaPAA Mn=2.6 kD obtained from[Filho and Maurer, 2008] (−−−).
function of the water content for NaPAA-30-2 deviates from the corresponding measure-
ments for NaPAA-30-1. The deviation is most pronounced below aw ≈ 0.45.
In general the water activity from the literature is above the values obtained in this
project. The model by filho is observed to correspond to the measured aw. The model
by Filho and Maurer is only included in the range where Filho and and Maurer has fitted
the model to their measurements.
7.2.6 Sodium acrylate
Two samples of sodium acrylate was measured as a function of water content.
The sodium acrylate is a white powder which was measured without any initial drying. No
sample loss were observed during the measurement series. This is confirmed by the final
dry matter content determination which differ by less than 2 % from the initial weighing.
In the begining of the two measurement series the water added to the samples stay as
the drops at the surface of the sodium acrylate. If these drops are still visible when a
stable aw is obtained, the sample is measured again and only the measurements, where
40
7.2. WATER ACTIVITY AS A FUNCTION OF WATER CONTENT
no distinct drops was observed in the sample after the measurement, is used. Figure 7.8
shows the measured aw as a function of water content.
0
0.2
0.4
0.6
0.8
1
0 2 4 6 8 10 12 14
Y [g/g]
a w
Figure 7.8: The water activity as a function of water content for NaAc-30-1 (×) andNaAc-30-2 (+).
As depicted in figure 7.8 the water activity as a function of water content is reproducible
for NaAc. According to the figure the water activity increases stepwise. The water activity
increase gradually less and less with increasing water content until aw ≈ 0.73 i.e. Y ≈ 1.4.
Above Y ≈ 1.4 the water activity increases steeply and then increase asymptotic towards
aw = 1. For both samples the measurement at Y ≈ 1.4 is observed to be the last point
where some of the sodium acrylate is not dissolved. Thus the plateau at aw ≈ 0.73 may
corresponds to the water activity of a saturated NaAc solution.
7.2.7 Comparison of water activity for the parts of PS-NaPAA
To determine which parts of the PS-NaPAA that influence the water activity, the water
activities given above for PS-NaPAA, PS, PS-PAA, NaPAA and NaAc are compared.
As mentioned in section 7.2.3 the PS particles has no influence on the measured water
activity.
Figure 7.9 shows the water activity as a function of water content for PS-NaPAA-30-2 and
PS-PAA-30-2. This samples is representative for PS-NaPAA and PS-PAA respectively.
41
CHAPTER 7. RESULTS
0
0.2
0.4
0.6
0.8
1
0 0.1 0.2 0.3 0.4 0.5 0.6 0.7 0.8 0.9 1
Y [g/g]
a w
Figure 7.9: The water activity as a function of the water content for PS-NaPAA-30-2(�) and PS-PAA-30-2 (�).
Figure 7.9 shows that the water activity is considerably lower for PS-NaPAA than for
PS-PAA at the same water content.
A comparison of PS-NaPAA-30-2 with NaAc-30-1 and NaPAA-30-1 is shown in figure
7.10. These samples is representative for the different types of samples. To compare the
different samples the water activity is plotted against the modified mole fraction of water
(x∗w). x∗w is calculated regarding only the sodium ions and the water in the samples. The
advantage of using x∗w to compare the PS-NaPAA with NaPAA and NaAc is that at the
same mole fraction of water PS-NaPAA, NaPAA and NaAc contains the same amount
of sodium ions and hence the same amount of charges carboxylate groups (neglecting
counterion condensation).
According to figure 7.10 PS-NaPAA and NaPAA approach each other with increased mole
fraction of water until x∗w ≈ 0.9. PS-NaPAA has a lower water activity than NaPAA until
x∗w ≈ 0.9 after which aw for NaPAA and PS-NaPAA is approximately equal.
The water activity for NaAc approach PS-NaPAA above x∗w ≈ 0.78 which is the point at
which all NaAc is dissolved. Above x∗w ≈ 0.9 the water activity for NaAc resemble the
water activity for NaPAA and PS-NaPAA.
42
7.2. WATER ACTIVITY AS A FUNCTION OF WATER CONTENT
0
0.2
0.4
0.6
0.8
1
0 0.1 0.2 0.3 0.4 0.5 0.6 0.7 0.8 0.9 1
xw*
a w
Figure 7.10: The water activity as a function of the modified mole fraction of water(see text) for PS-NaPAA-30-2 (�), NaPAA-30-1 (•) and NaAc-30-2 (+).
As noted the water activity as a function of the water content has a bend for all samples
of PS-NaPAA and NaPAA. The values for the measurement closest to the bend are listed
in table 7.6.
Table 7.6: The modified mole fraction of water corresponding to the bend on theplots of aw as function of water content.
As seen in table 7.7 the intersection for γw = 1 is approximately constant for the different
samples of PS-NaPAA, NaPAA and NaAc. The slightly higher values for PS-NaPAA-40-1
is caused by the slightly lower aw measured for PS-NaPAA-40-1 in this range than for
the remaining PS-NaPAA samples.
7.2.9 Modelling the osmotic coefficient
In order to be able to interpret the concentration range for which the PS-NaPAA system
behave like a suspension, the water activity as a function of water content is converted to
osmotic coefficient and fitted by the model by Filho and Maurer [2008].
The osmotic coefficient is calculated for all samples of PS-NaPAA and NaPAA by using
equation 4.7. To model the osmotic coefficient the fraction of free counterions must be
estimated. According to [Filho and Maurer, 2008] this fraction can be obtained as the
osmotic coefficient at infinite dilution. The osmotic coefficients determined from the mea-
surement by membrane osmometry are depicted as a function of xw in figure 7.12. The
samples measured is denoted PS-NaPAA-30-M1 etc. All three samples are neutralised to
a degree of more than 0.99.
As it is observed for the more concentrated solutions in figure 7.4 it is not possible to dis-
tinguish between the 30 and 40 oC. Additionally the progress for ϕ with xw is different
for all three samples hence all three samples is fitted with a straight line due to the lack
of evidence for something more appropriate.
The fitted lines in figure 7.12 is used to calculate ϕ at xw = 1. The values is listed in table
7.8. According to the limiting osmotic coefficient only a fraction of 0.073 of the sodium
ions are free.
45
CHAPTER 7. RESULTS
0
0.02
0.04
0.06
0.08
0.1
0.12
0.9995 0.9996 0.9997 0.9998 0.9999 1
xw
φ
Figure 7.12: The osmotic coefficient for PS-NaPAA-30-M1 (�), PS-NaPAA-30-M2(N), and PS-NaPAA-40-M1 (•) along with a linear fit to PS-NaPAA-30-M1 (—),PS-NaPAA-30-M2 (−−−) and PS-NaPAA-40-M1 (· · · ).
The number of monomers per polyion (rp) corresponds to the number of charges on a com-
pletely deprotonated particles i.e. zp, which is calculated as given in appendix A.1. The
amount of particles in each sample (np) is calculated as described in appendix A.3. For
Table 7.8: The limiting osmotic coefficient for PS-NaPAA.Sample ϕlim
∆Hdes − ∆Hvap obtained from the BET fittings is in the order of 10000 J/mol for PS-
NaPAA whereas it is slightly smaller for NaPAA. For PS-PAA ∆Hdes−∆Hvap is approx-
imately 20 times larger than for PS-NaPAA.
7.3 Water activity as a function of temperature
The water activity was measured as a function of temperature according to the method
described in section 6.3.3 on page 29 to obtain values for ∆Hexcess as described in sec-
tion 4.3.3 on page 21. Four different samples of PS-NaPAA was investigated as a function
of temperature. The degree of neutralisation is given in table 7.13.
Table 7.13: The degree of neutralisation for the samples of PS-NaPAA measuredat different temperatures.
Sample Degree of neutralisationPS-NaPAA-T-1 0.982PS-NaPAA-T-2 0.963PS-NaPAA-T-3 1.02PS-NaPAA-T-4 0.994
To verify the method described in section 6.3.3 on page 29 aw measured at 35 oC is
plotted as a function of the average water content for each measurement series in figure
7.20 together with aw for PS-NaPAA-30-2.
According to figure 7.20 aw measured for the four samples at T = 35 oC resemble the
51
CHAPTER 7. RESULTS
0
0.2
0.4
0.6
0.8
1
0 0.1 0.2 0.3 0.4 0.5 0.6 0.7 0.8 0.9 1
Y [g/g]
a w
Figure 7.20: Water activity as a function of water content for PS-NaPAA-T-1 (4),PS-NaPAA-T-2 (�), PS-NaPAA-T-3 (◦) and PS-NaPAA-T-4 (�) along with thewater activity for PS-NaPAA-30-2 (�).
corresponding aw for PS-NaPAA-30-2. The deviation between the samples is in the same
range as the deviation observed in figure 7.4 on page 37. Hence the method for measuring
aw as a function of temperature gives values similar to the values obtained by the method
for varying water content.
The excess enthalpy is calculated according to equation 4.21 on page 22. The values ob-
tained are listed in table 7.14 along with the standard deviation in percentage obtained
from the fitting. The weighing before and after each measurement series indicate a change
in xw during each measurement series. The change in xw is generally below 5 % as it
is seen in table 7.14. Even though the change in xw is small it still affects the value of
∆Hexcess, hence a corrected value for ∆Hexcess is calculated by subtracting the contribu-
tion from the change in xw. The xw given in table 7.14 is an average of the xw before
and after each measurement series.
A negative value for ∆Hexcess means that the water has a favourable interaction with
PS-NaPAA i.e. more energy is required to remove the water from the PS-NaPAA. Table
7.14 shows that a higher xw results in a less negative ∆Hexcess. The standard devia-
tion in percentage for ∆Hexcess is generally increases as ∆Hexcess becomes less negative.
∆Hcorrectedexcess is generally more negative than ∆Hexcess at the same xw. The only exception
is for PS-NaPAA-T-4 at xw=0.58 at which ∆Hcorrectedexcess is more negative than ∆Hexcess
52
7.3. WATER ACTIVITY AS A FUNCTION OF TEMPERATURE
Table 7.14: The ∆Hexcess obtained at the given xw for four different samples. Thechange in xw is given along with a value for ∆Hexcess which is corrected for thecontribution from the change in xw.
Sample xw ∆Hexcess %SD Change in xw ∆Hcorrectedexcess
droxide and freeze-dried (Christ Alpha 1-2 LDplus, Germany). A part of the freeze-dried
sample is resuspended in demineralised water. A small amount of this suspension is di-
luted with 10 mM borate buffer (pH 9.5). This suspension is used to measure the particle
size by dynamic light scattering (Zetamaster, Malvern Instruments, United Kingdom).
The particle size is measured three times, where each measurement consist of three sub-
measurements.
For comparison PS-PAA from the stock suspension are mixed with 10 mM borat buffer
(pH 9.5) to achieve two independent samples. These samples are each measured ones
where each measurement consist of three subruns.
B.1.2 Results and discussion
The size measurement for non-freeze-dried sample is shown in figure B.1. From figure B.1
the average size of the particles is found to be approximately 278 nm.
The resuspended sample of freeze-dried PS-NaPAA was observed to be homogeneous. The
resulting size measurements is shown in figure B.2. According to figure B.2 five out of
the 9 subruns show an average diameter of approximately 277 nm. This is the same size
as the size measured for the non-freeze-dried samples. Hence the freeze-dried Ps-NaPAA
can be resuspended. The fact that it is not all the sub-measurements which give the same
size may be due to flocculation, but since no deviation is observed in measurement 3 the
77
APPENDIX B. SAMPLE STABILITY DURING FREEZEDRYING
0
2
4
6
8
10
12
14
150 200 250 300 350 400
Diameter [nm]
[%]
Figure B.1: The size distribution for Ps-NaPAA in 10 mM borat buffer measure-ment 1 (×) and 2 (�). The three peaks for each measurement correspond to thethree sub-measurements.
flocculation is assumed to be reversible.
B.2 pH for resuspended poly(styrene-co-sodium
acrylate)
B.2.1 Method
A sample of the PS-PAA suspension is adjusted to pH 9.49 (PHM200 MeterLabTM
ide. 4.5 ml of the sample is freeze-dried. After freeze-drying the sample is resuspended
in 4.4 ml water, which corresponds to the amount of water removed during freeze-drying.
The sample is stirred until the sample appears to be homogeneous and the pH is measured.
78
B.3. CONCLUSION
0
2
4
6
8
10
12
14
150 200 250 300 350 400
Diameter [nm]
[%]
Figure B.2: The size distribution for resuspended PS-NaPAA in 10 mM boratbuffer measurement 1 (×), 2 (�) and 3 (N). The three peaks for each measurementcorrespond to the three sub-measurements.
B.2.2 Results and discussion
The pH of the resuspended PS-NaPAA is measured to be pH 9.43, which is approximately
equal to the pH before freeze-drying.
B.3 Conclusion
Both the investigation of particle size after freeze-drying and the investigation of pH after
freeze-drying show that samples of PS-NaPAA are not damaged by freeze-drying. Hence
freeze-drying is a suitable method for concentrating the samples of PS-NaPAA.
79
C. Effect of sample storage
Since it is not possible to measure the water activity in the entire concentration range
during an ordinary workday, the time dependence of the water activity was investigated.
Additionally the evaporation of water during the experiment was studied.
C.1 Method
15 ml of the PS-PAA suspension was adjusted to pH 9.82 by sodium hydroxide and 10 ml
of this suspension was freeze-dried in an aluminium tray. The dry sample was stored in a
desiccator until it was transfered to a pre-weighed measurement cup with a pair tweezers.
The sample cup is closed with a pre-weighed lid, covered with parafilm and weighed.
The water activity of the sample was measured using Aqualab (Aqualab 4TE Decagon
Devices, USA) and subsequently weighed. Afterwards the sample was either added a small
amount (at least 2×5 µl) of water or the sample was stored in the closed sample cup for a
given amount of time. The sample cup with sample, lid and parafilm was weighed before
a new measurement.
This procedure was repeated until the water activity equals one.
The sample cup containing the sample along with the lid was dried in an oven to get an
exact determination of the drymatter content.
C.2 Results
Table C.1 shows the change in the sample mass (inclusive water) during measurements and
storage for a given water activity along with the corresponding storage and measurement
time. According to table C.1 water is evaporating mainly during the measurement and in
minor extent during storage. This is true even though the measurement time is shorter
than the storage times. The amount of water evaporated during storage seems to increase
with increasing storage time.
Figure C.1 shows the aw as a function of water content for the sample of PS-NaPAA pH
9.8 T = 30 oC.
The measurements in figure C.1 is independent of the storage time since all measurements
follow the same tendency.
80
C.2. RESULTS
Table C.1: The change in mass during measurement and storage for the given wateractivity. When no storage time is given the sample is added water and measuredimmediately after weighing, hence a positive ∆mstorage corresponds to addition ofwater.storage time [hr] ∆mmeasurement ∆mstorage aw measurement time [min]
Figure C.1: The water activity (�) measured directly after water addition as afunction of water content and the water activity (�) measured after 1 to 29 hoursafter storage as a function of water content.
81
APPENDIX C. EFFECT OF SAMPLE STORAGE
C.3 Conclusion
It is necessary to weigh the samples after measuring to find the corresponding water con-
tent as part of the added water evaporates during the measurement.
The water activity depends only on the water content and not on the storage time.
82
D. Day of measurement
Table D.1 gives the water content and the corresponding mole fraction of water for the
first measurement on day 2, 3 and 4 i.e. the water content for which the measurement of
aw may be affected by the storage of the sample over night.
Table D.1: The water content and mole fraction for the first measurement on eachday of the given measurement series
Day 2 Day 3 Day 4Sample Y xw Y xw Y xwPS-NaPAA-30-1 0.099 0.707 0.366 0.899PS-NaPAA-30-2 0.100 0.710 0.255 0.863PS-NaPAA-40-1 0.115 0.734 0.337 0.890PS-NaPAA-40-2 0.086 0.685 0.281 0.877NaPAA-30-1 0.282 0.628 1.426 0.895NaPAA-30-2 0.113 0.398 0.269 0.611 1.058 0.861


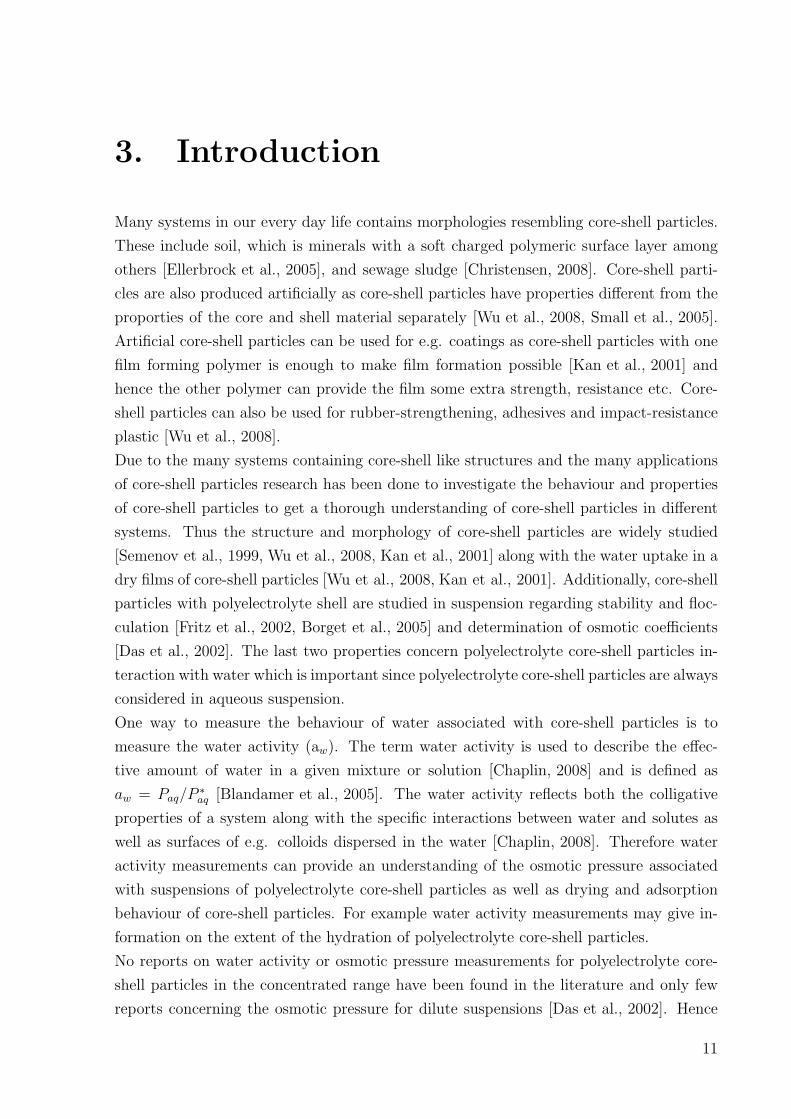


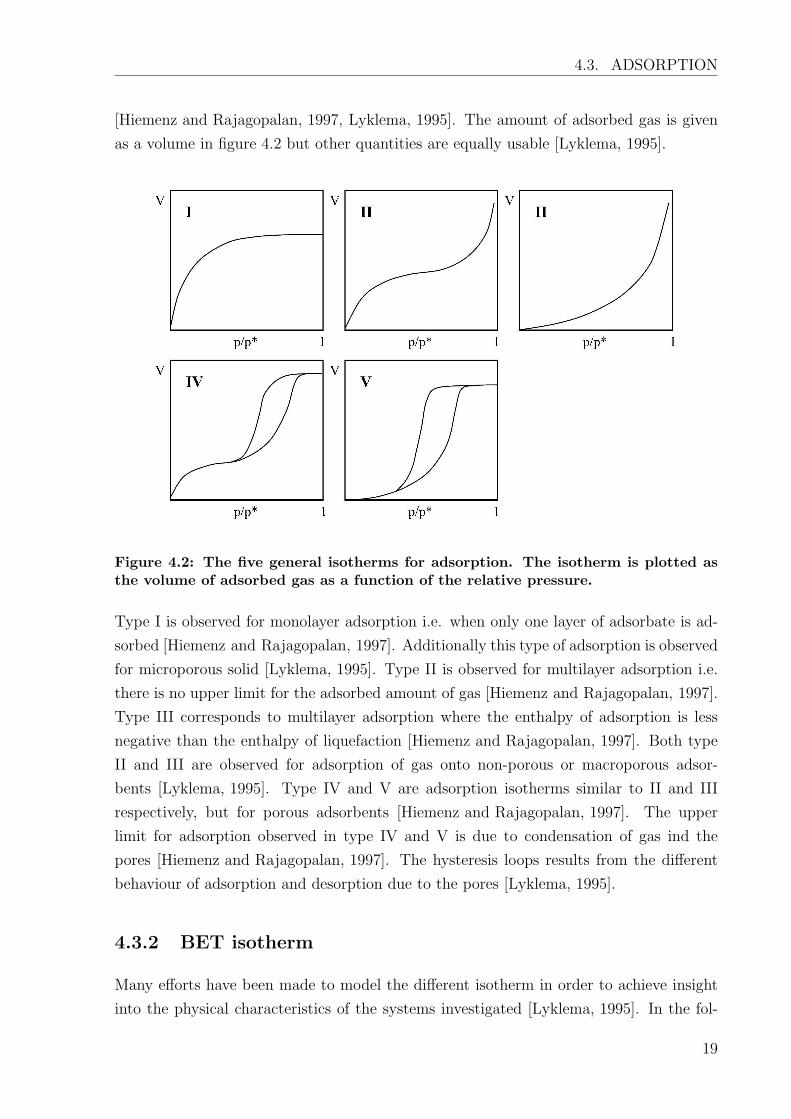
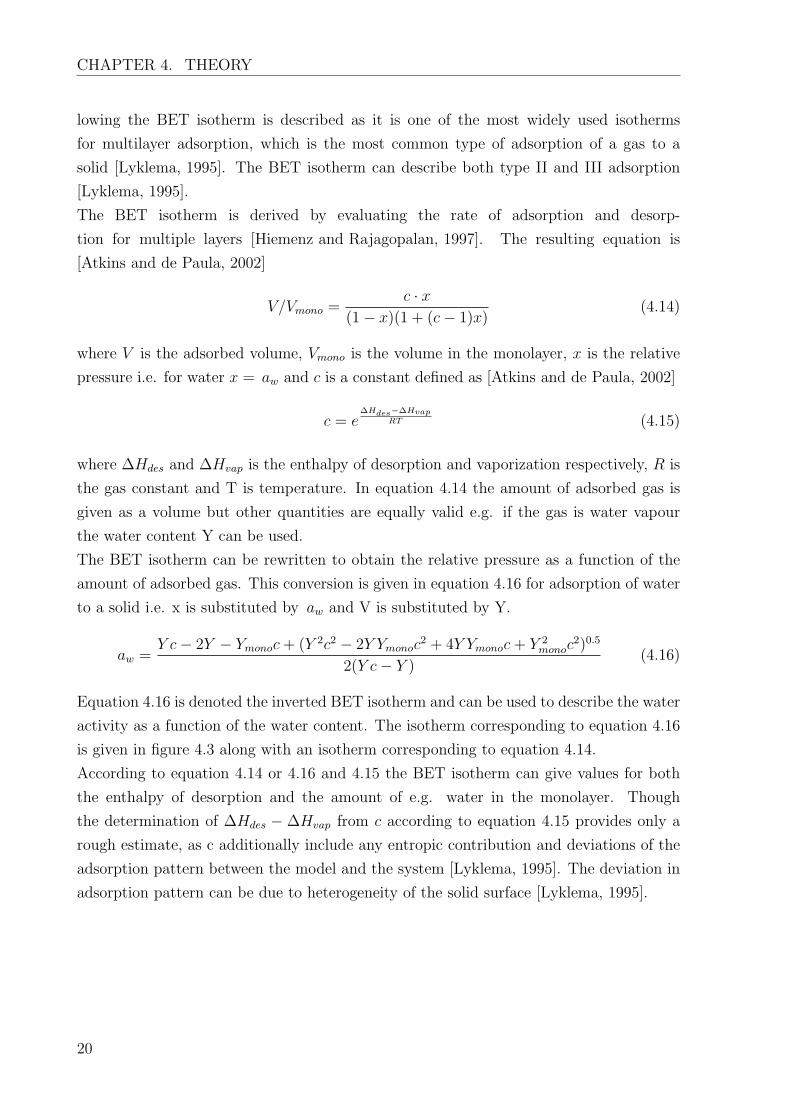
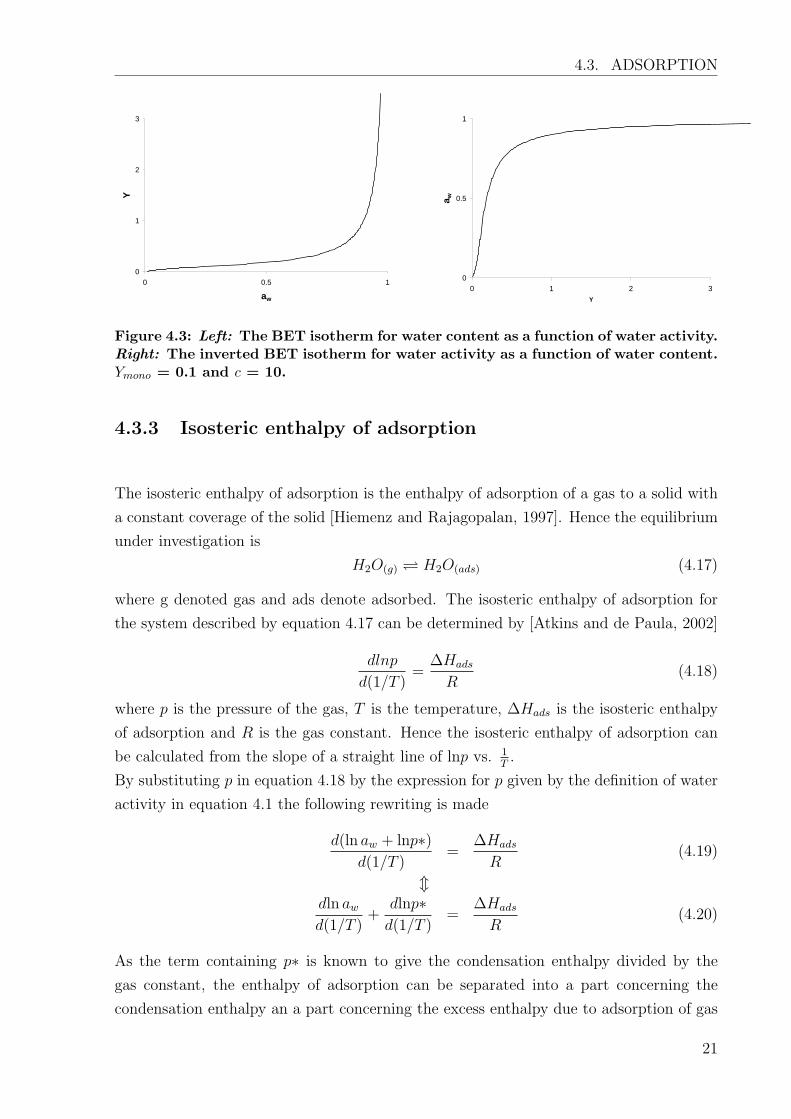


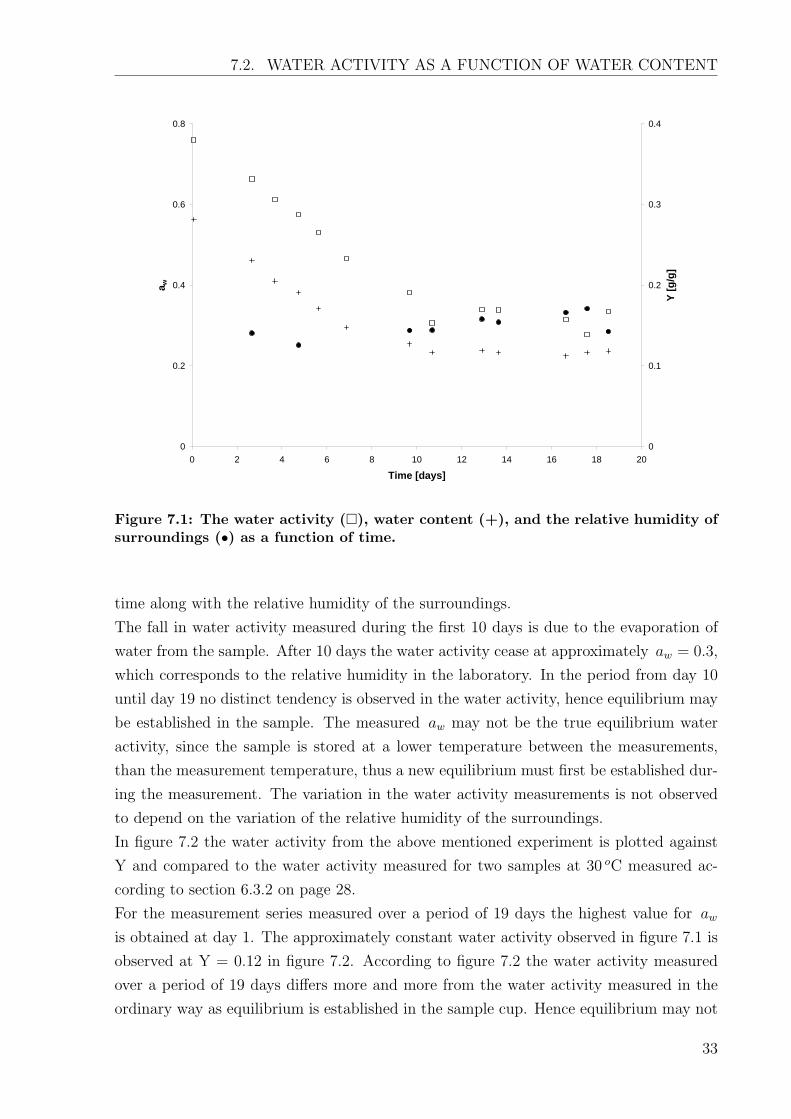


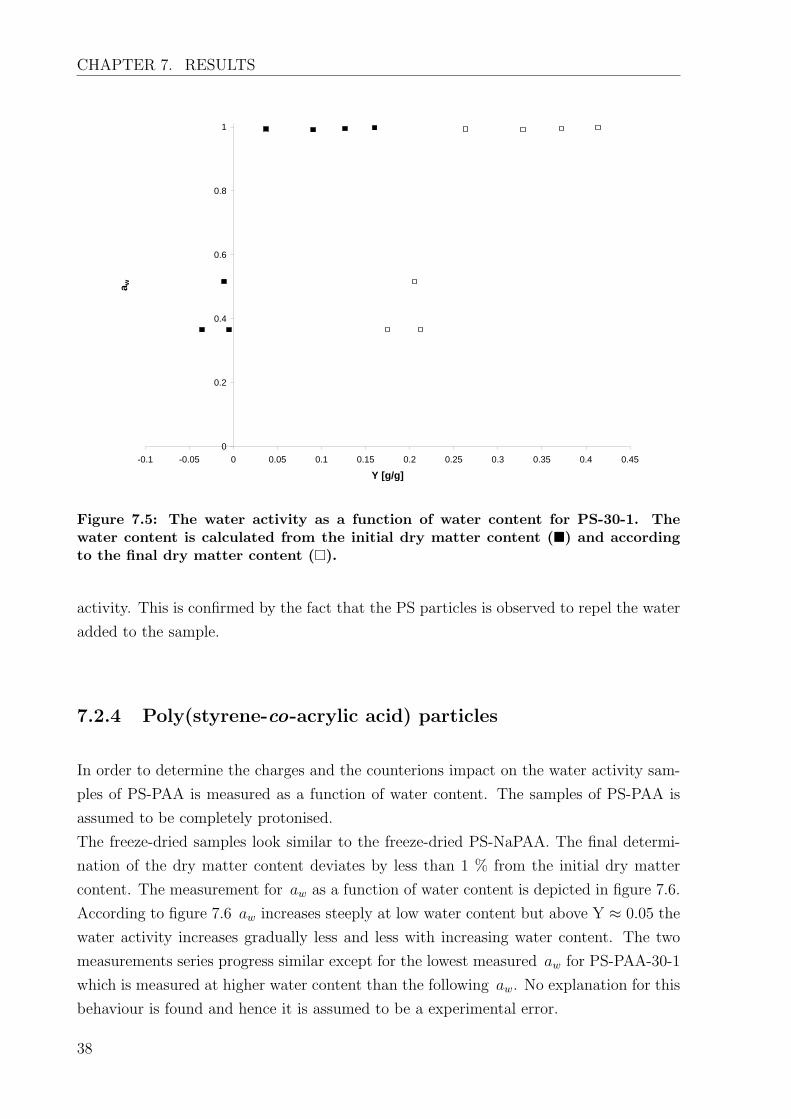


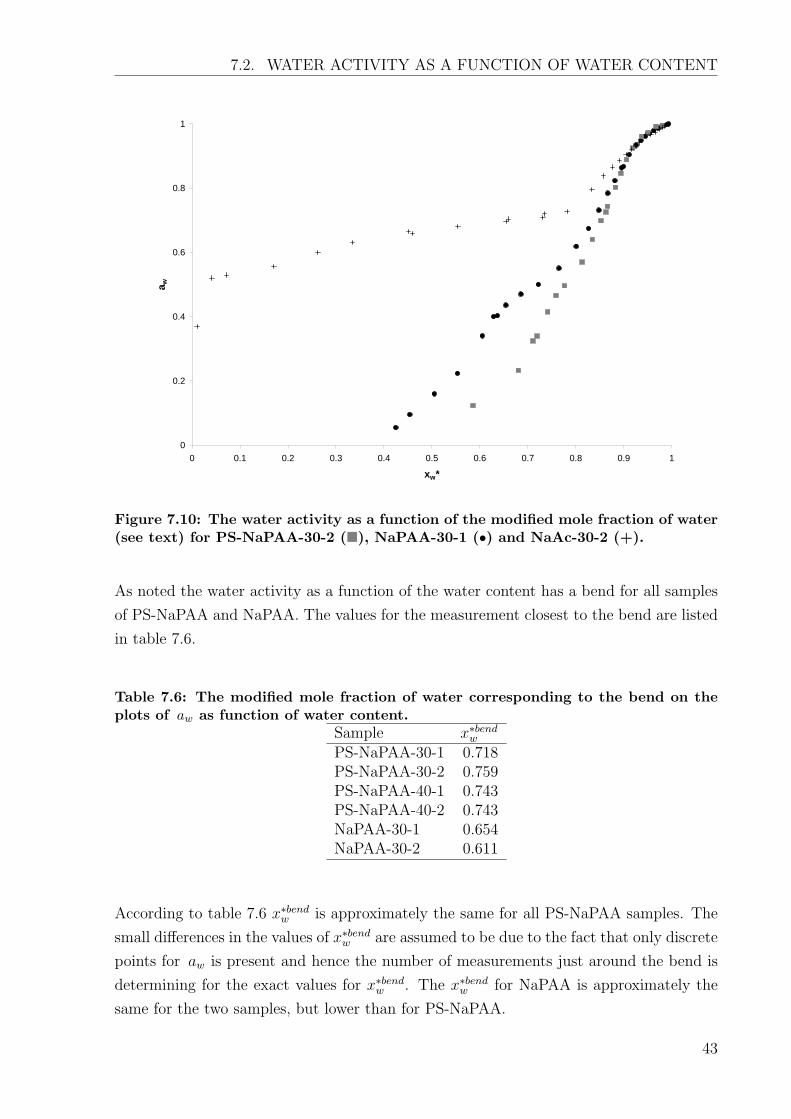


![Blå skridt mod bæredygtige byer: Vurdering af dansk ... · dering af brugen af beton, jern/stål, plast asfalt m.v., samt brug af pumper [oplistning], #6) andel af området med](https://static.documents.pub/doc/80x56/5f553e42e2f5b15c581a33d6/bl-skridt-mod-bredygtige-byer-vurdering-af-dansk-dering-af-brugen-af-beton.jpg)


