25
FOOD AND NUTRITION TECHNICAL ASSISTANCE Water and Sanitation Indicators Measurement Guide Patricia Billig Diane Bendahmane Anne Swindale SERIES TITLE 2 INDICATOR GUIDES

FOOD AND
NUTRITION
TECHNICAL
ASSISTANCE
Water and SanitationIndicatorsMeasurement Guide
Patricia BilligDiane Bendahmane
Anne Swindale
SE
RIE
S
T I T L E 2
I N D I C ATO R G U I D E SFood and Nutrition Technical Assistance ProjectAcademy for Educational Development
1825 Connecticut Ave,NW, Washington D.C., 20009-5721
Tel: 202-884 8700Fax: 202-884 8732
E-mail: [email protected]: http://www.fantaproject.org

Patricia BilligDiane BendahmaneAnne Swindale
Water and SanitationIndicatorsMeasurement Guide
FOOD AND
NUTRITION
TECHNICAL
ASSISTANCE
Proof 2 15/9/99 1:09 pm Page 1

This publication was made possiblethrough support provided by the Office ofHealth and Nutrition, Bureau for GlobalPrograms, U.S. Agency for InternationalDevelopment to the Food and NutritionTechnical Assistance Project. Additionalsupport was provided by the Office ofFood for Peace, Bureau for HumanitarianResponse. Development of the guide wasalso through the Linkages Project ,Cooperative Agreement HRN-A-00-97-00007-00 (Academy for EducationalDevelopment) and the Food andNutrition Monitoring Project (IMPACT),Contract No. DAN-5110-Q-00-0014-00,Delivery Order 16 (International Scienceand Technology Institute). The opinionsexpressed herein are those of the authorsand do not necessarily reflect the viewsof the U.S. Agency for InternationalDevelopment.
Published June 1999
Copies of the Guide can beobtained from:
1. Food and Nutrition TechnicalAssistance Project, Academy forEducational Development, 1825Connecticut Ave, , NW, Washington D.C.,20009-5721. Tel: 202-884 8700. Fax: 202-884 8732. E-mail: [email protected]: http://www.fantaproject.org
2. Food Aid Management (FAM), 300 IStreet, NE. 212, Washington D.C., 20002.Tel: 202-544 6972. Fax: 202-544 7065.
Proof 2 15/9/99 1:09 pm Page 2

Page number
Contents
Part 1.Introduction
Part 2.Impact indicators for measuring water and sanitation-relatedprogram performance: definitions, calculation, sources of data,issues, target valuesPercentage of children under <36 months with diarrhea in the
last two weeksQuantity of water used per capita per dayPercentage of child caregivers and food preparers with
appropriate handwashing behaviorPercentage of population using hygienic sanitation facilities
Part 3.Annual monitoring indicators for measuring water and sanita-tion-related program performance: definitions, calculation,sources of data, issues, target valuesPercentage of households with year-round access to waterPercentage of households with access to a sanitation facilityPercentage of recurrent costs for water supply services
provided by community servedPercentage of constructed water supply systems operated andmaintained by the communities served
Part 4.ReferencesBibliographyAppendix: Title II Generic Indicators Acronyms
6
10
10
1113
15
17
171819
19
20202224
3.
4.
2.
1.
Proof 2 15/9/99 1:09 pm Page 3

Acknowledgements
4
The Guide was written by Patricia Billig, Senior Technical Director,Environmental Health Project (EHP); Anne Swindale, Deputy Director,Food and Nutrition Technical Assistance (FANTA), Academy forEducational Development (AED); Diane Bendahmane, Technical Directorfor Information Services, International Science and Technology Institute(ISTI); and, with significant technical input and thoughtful comments fromseveral reviewers including Gilles Bergeron and Bruce Cogill of FANTA, andEduardo Perez, Mary Lamb and Frank Baer of EHP. Eunyong Chung ofUSAID’s Bureau for Global Programs, Field Support and Research, Office ofHealth and Nutrition and John Austin of USAID’s Office of Health andNutrition, Environmental Health Division provided insight and support forthe guides and their efforts are appreciated. The USAID Office of Food forPeace has also encouraged and supported the development of the guides.The Title II PVO’s were essential to the development of the guide and it is tothem that this guide is dedicated.
Proof 2 15/9/99 1:09 pm Page 4

5
This series
This series of Title II Generic Indicator Guides has been developed by theFood and Nutrition Technical Assistance (FANTA) Projects, and its prede-cessor projects (LINKAGES and IMPACT), as part of USAID’s support todevelop monitoring and evaluation systems for use in Title II programs.These guides are intended to provide the technical basis for the indicatorsand the recommended method for collecting, analyzing and reporting on theindicators. A list of Title II Generic Indicators that were developed in con-sultation with the PVOs in 1995/1996 is included in Appendix 1. The guidesare available on the project website http://www.fantaproject.org
Guides are available on these topics: Agricultural Productivity Indicators Measurement GuideFood Security Indicators and Framework for use in the Monitoring and
Evaluation of Food Aid Programs Infant and Child Feeding Indicators Measurement Guide Sampling Guide Water and Sanitation Indicators Measurement Guide
Proof 2 15/9/99 1:09 pm Page 5

W ater and sanitation improvements, in association with hygienebehavior change, can have significant effects on populationand health by reducing a variety of disease conditions such as
diarrhea, intestinal helminths, guinea worm, and skin diseases. Theseimprovements in health can, in turn, lead to reduced morbidity and mortal-ity and improved nutritional status.
Water and sanitation improvements affect health primarily by inter-rupting or reducing the transmission of disease agents, as illustrated inFigure 1. This occurs through a variety of mechanisms. Of primary impor-tance is the safe disposal of human feces, thereby reducing the pathogenload in the ambient environment. Increasing the quantity of water allows forbetter hygiene practices. Raising the quality of drinking water reduces theingestion of pathogens. With less disease, children can eat and absorb morefood, thereby improving their nutritional status. Also, a healthier adult pop-ulation is a more productive population, and improvements in water andsanitation can improve income and the capacity to acquire food. Other ben-efits associated with better water delivery include time savings for primarycaregivers, which can result in the preparation of more or better food forchildren (see Bergeron and Esrey 1993 for a review).
Improvements in sanitation have been shown consistently to result inbetter health, as measured by less diarrhea, reductions in parasitic infec-tions, increased child growth, and lower morbidity and mortality. Theexpected reductions in mortality can be substantial, particularly in areaswith low levels of education. Modest improvements in sanitation, such as pitlatrines, will result in better health, but major improvements in sanitation,such as flush toilets, will result in even larger health benefits (Anker andKnowles 1980). These results have been reproduced consistently in a num-ber of settings (e.g. Bateman and Smith 1991). Nutritional benefits were alsoshown in individuals belonging to households without adequate sanitation,in communities where other most people had adequate sanitation. This sug-
1. IntroductionPA
RT
6
1.
Proof 2 15/9/99 1:09 pm Page 6

7
1.
I N T RO D U C T I O N PA RT 1 .
gests that all efforts towards improving sanitation are worth undertaking, asthey have community-level effects as well as individual ones.
It is commonly believed that the main health benefit from improvedwater supply occurs through better water quality, which reduces the ingestionof pathogens. Reviews, however, suggest that the improvements in health asso-ciated with better water quality are smaller than those obtained throughincreases in the quantity of water, which allow for better personal and domes-tic hygiene practices (e.g., hand washing, food washing, and householdcleaning) (Esrey et al. 1991, Huttly et al. 1997). Population groups that consis-tently use more water have better health than groups that use less water. Thishas been shown repeatedly for several health outcomes, such as specific diar-rheal pathogens, diarrheal morbidity, and child growth (Esrey et al. 1991).
Another potential benefit from increasing the quantity of water is theuse of water for income generating (e.g., local industries) or food producing(e.g., gardening) activities, both of which could result in the intake of moreand better food, improving the family’s diet as well as child anthropometry.A fourth benefit is a reduction in the time spent obtaining water. Studiessuggest that when women have more time for other activities, they spendmuch of that time in food-related activities, such as preparing food and feed-ing young children (Bergeron and Esrey 1993). More time for women canalso increase women’s opportunities for generating income (ICRW 1996).
Improvements in water and sanitation do not automatically result inimprovements in health. The addition of hygiene education is often requiredto see health impacts materialize. The most important hygiene messages toimpart concern the basic issues of hand washing, proper disposal of feces,and protection of drinking water (EHP 1999). Several studies in differentparts of the world, in daycare centers, and in community settings, have indi-cated that frequent hand washing, with and without soap, results in lessdiarrhea. Collectively, these studies report a 33 percent reduction in diar-rhea from hand washing alone (Esrey et al. 1991, Huttly et al. 1997). Proper
Improved Hygiene Behaviorsand Access to Sanitation Solutions
and Adequate Water
Reduced DiarrhealDisease Episodes and Reduced
Intestinal Parasites
Decreased Pathogen Exposure
Increased Nutrient Absorptionand Improved
Disease Resistance
Reduced Mortality and Morbidity
Figure 1
Proof 2 15/9/99 1:09 pm Page 7
disposal of feces, which is not guaranteed by the mere presence of latrines,is also critical for the potential benefits of sanitation to materialize.
All of the mechanisms are summarized in Figure 1. Improvements inwater, sanitation and hygiene education are expected to reduce the burdensof disease and improve the overall health of people. Reductions in morbid-ity, such as diarrhea, are expected to improve nutritional status by areduction in dehydration, fever and malabsorption of nutrients. In turn,improvement in nutritional status is expected to decrease rates of severediarrhea (e.g. shorter duration). Reductions in diarrhea and malnutritionwould lead to a reduction in mortality (Bergeron and Esrey 1993).
The Water and Sanitation Guide was developed by the Food andNutrition Technical Assistance Project for use by PVOs and USAID in mon-itoring and evaluating Title II supported activities. The purpose of theGuides is to facilitate the consistent measurement of a set of generic per-formance indicators for results reporting to USAID. USAID will use thisinformation to report the impact of food aid on global development toCongress and the American public.
This Guide provides information on the Water and Sanitation ImpactIndicators and the Annual Monitoring Indicators for WAS-related Title IIactivities, a subset of the P.L. 480 Title II Generic Performance Indicators forDevelopment Activities.
The Impact Indicators are:1. Percentage of children under <36 months with diarrhea in the lasttwo weeks, where diarrhea is defined as more than three loose stoolspassed in a 24 hour period2. Quantity of water used per capita per day, where all the water collectedby or delivered to the household and used for personal purposes is considered3. Percentage of child caregivers and food preparers with appropriatehandwashing behavior, where appropriate handwashing includes the
8
1.
Proof 2 15/9/99 1:09 pm Page 8
time at which it is done and the technique used4. Percentage of population using hygienic sanitation facilities, where san-itation facility is defined as an excreta disposal facility, typically a toilet orlatrine; and hygienic means there are no feces on the floor or seat and thereare few flies
One or more of these indicators, or equivalent alternatives, are to beused in the reports of projects with water and sanitation components andshould be collected at baseline, mid-term and final-year evaluations.
The monitoring indicators are:1. Percentage of households with year-round access to improved watersource, where access means either direct connection to the home or a pub-lic facility within 200 meters of the home2. Percentage of households with access to a sanitation facility, wheresanitation facility is defined as above3. Percentage of recurrent costs for water supply services provided by thecommunity served, where recurrent costs refer to the full operating andmaintenance costs of the water supply system which services the community4. Percentage of constructed water supply facilities maintained by thecommunities served, where the constructed facilities refer to those estab-lished by the NGO or project
The choice of indicators for annual monitoring and reporting shouldbe decided based upon a review of available sources of data and the infor-mation needs of the Cooperating Sponsor and USAID. The primary purposeof collecting and reporting the monitoring indicators is to improve programmanagement, but these indicators can also provide valuable insights intothe interpretation of the program’s impact on health. In addition, reportingthe annual indicators may provide PVOs a further opportunity to demon-strate progress towards the achievement of results.
9
1.
I N T RO D U C T I O N PA RT 1 .
Proof 2 15/9/99 1:09 pm Page 9

Definition of termsThis indicator is the period prevalence ofdiarrhea based on the two-week recall ofthe child's primary caretaker (usually themother). It is defined as the proportion ofchildren in a given sample who have diar-rhea at the time the information iscollected or who have had it anytime in thetwo preceding weeks. Diarrhea is definedas more than three loose stools passed in atwenty-four hour period. Age is calculatedin completed months at the time the infor-mation is collected from the caretaker. Achild who is 20 days old is considered zeromonths of age, and a child of 50 days isconsidered one month old.
CalculationNumber of children < 36 months
of age in the sample with diarrhea in the last two weeks
divided byTotal number of children
< 36 months of age in the sample
Sources of dataData for this indicator are obtaineddirectly from the caretaker by means of apopulation-based survey of a sample ofhouseholds. The accuracy of the two-week recall period is well established.The survey respondent should be theprincipal caretaker of the child. He or shemust provide information on how manychildren <36 months of age there are inthe household and whether or not they
have had diarrhea as defined above in thetwo preceding weeks.
Health service records should not beused as a source of data for this indicator.They underestimate the overall diseaseburden of diarrhea because most childrenwith diarrhea are not taken to a healthcare facility.
IssuesThe simple definition of diarrhea givenabove is suitable for the purpose of assess-ing programmatic performance. Additionalcriteria may be used to define diarrhea,such as the presence of blood in the stool,which strongly suggests dysentery (asevere form of diarrhea that may be causedby amebas or bacteria). However, for awater and sanitation intervention, the typeof diarrhea would not substantially influ-ence the type of intervention.
Diarrheal disease prevalence is alsoinfluenced by season, generally beingmore prevalent in the rainy seasons.Therefore, surveys must occur in thesame seasons to be comparable.
Target ValuesWater and sanitation-related programsinclude improvements in facilities as wellas hygiene education for behavior change.It is well-documented that such programscan bring about decreases in the rate ofdiarrheal disease on the order of 25%.
In an assessment of the impact of com-bined water, sanitation and hygiene
2.Impact Indicators forMeasuring Water andSanitation-RelatedProgram PerformanceP
AR
T
10
2.
Percentage of children <36 months of age with diarrhea in the last two weeks
Proof 2 15/9/99 1:09 pm Page 10

11
2.
I M PAC T I N D I C ATO R S F O R M E A S U R I N G WAT E R A N D S A N I TAT I O N - R E L AT E D P RO G R A M P E R F O R M A N C E PA RT 2 .
Definition of TermsThis indicator includes all water collect-ed by or delivered to the household andused there for drinking, cooking,bathing, personal and householdhygiene and sanitation by the inhabi-tants of the household. It does not includewater used for gardening or for wateringanimals. A day is a 24-hour period. Alladults and children in the household arecounted. It is assumed that the amountcollected is the amount used.
CalculationVolume of water (in liters) collected
for domestic use per day byall households in the sample
divided byTotal number of persons in the sample
households
Note: This calculation is more precise ifcalculated for individual households firstand then averaged for the total number ofhouses sampled. Adding this step helpsaccount for potentially large variations inthe number of persons per household.
Sources of DataFor water systems in which water is col-lected or delivered in containers from acommunity source and brought to thehome, data should be collected throughrandom surveys of households. Clustersurveys should not be employed becausewater sources or availability may belocation-related. The mother or personresponsible for water use in the family—this may be the person who collects mostor all of the water—is asked in aninterview how much water has been col-lected since the same time the daybefore. As the answer will probably begiven in numbers of containers ratherthan liters, the interviewer should betrained to assess container volume visu-ally or to have a series of pictures of thecommon water containers in that com-munity with the volumes pre-measured.The person being interviewed shouldalso be asked the number of people forwhom the water has been collected.Information about all household wateracquisitions (except gardens and ani-mals) is needed.
education, Aziz et al. (1990) found a 25%decrease in diarrheal morbidity. Esrey et al.(1991) reviewed 74 studies on the effect ofwater and sanitation on diarrheal diseasemorbidity and mortality and nutritional sta-tus. The median reduction in diarrhealmorbidity calculated for all the studies was22% and from the more rigorous ones, 26%.Using studies on individual interventionsfrom which morbidity reductions could becalculated, the review showed medianreductions of 22% for sanitation alone, 17%for improvements in water quality alone,27% for improvements in water quantityalone, and 33% for hygiene alone. Themedian reductions were greater if only themost rigorous studies were considered. Anupdate of Esrey's review by Huttly et al.(1996), which added studies completed inthe interval, reported similar findings.
Handwashing promotion is one of themost effective hygiene interventions. Reduc-tions of 32 to 43% in diarrheal disease have
been documented from improvements inhandwashing with soap (Feachem 1984). Inthree studies assessing only handwashing,the reduction ranged from 30 to 48% (Bootand Cairncross 1993).
It can be assumed that greater effectscan be achieved when interventions arecombined, although the estimated effectsof single interventions cannot necessari-ly be summed. The type of water andsanitation service provided will likelyaffect the impact as will the level of ser-vice before and after the intervention andthe environmental conditions in the pro-ject area . Several studies have found thatthe impact of water and sanitation onchild diarrhea is greatest among infantswho are not breastfed (VanDerslice et al.1994). In areas where breastfeeding isthe norm, the rate of diarrheal diseasewould likely be lower and targets forimprovements might be set below thesuggested 25%.
Quantity of water used per capita per day
Proof 2 15/9/99 1:09 pm Page 11

Collecting data on water use whenwater is piped directly into the house orcompound is very difficult for small-scalesystems characteristic of rural and someperi-urban communities. Because thesesystems are typically not metered eitherat the source or at the household, it is notpossible to calculate total water used in acommunity. In some situations, it may befeasible to install a meter at the source forthe purposes of a water usage study, butinstalling individual house meters is notrecommended. If a central meter wereinstalled, then the per capita consump-tion would be the amount of waterdelivered per day by the system dividedby the population in the service area.
Many problems call into question thereliability of this method. For example,piped water may be used for purposes otherthan those specified for the indicator; pipedsystems may have leaks or water may betaken from them by persons outside theservice area; and/or it may be difficult to getaccurate population figures. For these andother reasons, it may be advisable to obtaintechnical assistance in methods of deter-mining per capita use in piped systems withhousehold connections.
Some researchers believe that dis-tance to the water source may be anindirect indicator of water use (Boot andCairncross 1993). The closer the sourceof water is to the home, the greater theuse. Per capita use per day has beenshown to average less than 10 liters whenthe public standpipe is farther away thanone kilometer; at the other extreme, withhouse connections the average per capitause per day ranges from 150 to 400 liters(also used for gardens) (Gleick 1996).
IssuesEsrey et al. (1991) concluded that, afterexcreta disposal, the next most effectiveintervention for reducing water and sani-tation-related diseases is making morewater available and accessible to house-holds. Their review showed thatincreasing water quantity had more of animpact on diarrheal disease than improv-ing water quality.
Water use varies seasonally, based onclimate and household activities. Pre- and
post-intervention comparisons should beconducted within the same season.
Also, data based on a single surveyinterview may be highly inaccuratebecause families' water needs may not beconstant from day to day. A family mayperiodically collect larger volumes ofwater for non-routine uses such as brew-ing or washing clothes. The survey sampleshould be large enough to take account ofsuch variations.
Water used for purposes not specifiedin the indicator should not be included inthe numerator. Water used for householdgardens and animals is not among thespecified uses. In houses without house-hold connections, the mother or watercaretaker can be asked how much of thewater is used for gardening, and that vol-ume can be deducted from the totalvolume used by the household. In systemswith household connections, the volumeof water used for gardens and animalsmight be estimated (along with otheramounts that would have to be deducted—such as water loss from leakage) or itmight be calculated by multiplying theestimated flow rate of the hose or faucet bythe amount of time spent watering the gar-den or by asking mothers or otherhousehold members how much water iscarried from the faucet to the garden or toanimal watering troughs.
In urban areas, family members willoften be at work for extended periods.Because washing and bathing are typical-ly the major water use activities, thosepeople who wash and bathe routinely athome should be considered as part of thehousehold even if they are gone most ofthe day.
Target ValuesIt is difficult to establish uniform per capi-ta water quantity goals because of localand regional differences in availability ofwater, climate, and type of water supply.The 1977 Mar del Plata conference and the1992 Earth Summit in Rio de Janeiro bothendorsed the right of all people to haveaccess to potable water for their basicneeds, but in neither case was a specificquantity suggested. In a 1996 article inWater International, Peter H. Gleick of the
12
2.
Proof 2 15/9/99 1:09 pm Page 12
Pacific Institute for Studies in Develop-ment, Environment, and Security, inOakland, California, sets a reasonable tar-get by looking at basic needs for thespecific uses of water.
Drinking Water Minimum drinkingwater requirements for survival in a tem-perate climate with normal activitieshave been estimated by different expertsat 2.5 to 5 liters per capita per day (lcd).These requirements could increase sub-stantially with changes in climate andactivities. Gleick's recommended stan-dard is 5 lcd, since the lower level is forsubsistence only.
Bathing Estimates of minimumrequirements in developing country set-tings for bathing range from 5 to 15 lcd,for showering from 15 to 25 lcd. The rec-ommended standard is 15 lcd.
Food Preparation Food preparationneeds in both developing and developedcountries probably range from 10 to 20lcd. The recommended standard is 10 lcd.
Hygiene and Sanitation Gleick recom-mends 20 lcd for sanitation, includingpersonal and domestic hygiene. Setting astandard for sanitation is problematicbecause of the wide range of excreta dis-posal technologies. A number of themrequires no water at all (such as ventilated,-improved-pit (VIP) latrines, compostingtoilets, etc), but cultural and social prefer-ences favor water-based systems. Thestandard of 20 lcd permits use of apour/flush toilet (6–10 lcd) or other rudi-mentary water-based system. However, 20lcd is not high enough to allow for con-
ventional sewered systems which can useup to 75 lcd.
Gleick's target is the sum of the quan-tities for the four basic uses or 50 lcd. Thisis in line with the standard of 20 to 40 lcdset by USAID, the World Bank, and WHO,which excludes water for cooking andcleaning. Fifty-five countries report aver-age domestic water use below 50 lcd. Inaddition, millions of people in countrieswhere the national average use is above50 lcd live in locales that are below thenational average. Per capita use in theUnited States averages from 246 to 295lcd, depending on which study is cited.
The 50 lcd target may have be to beadjusted downward based on considera-tions of availability, climate, and technologymentioned above, and on baseline condi-tions and desired coverage goals.
The 50 lcd target may be used as aguideline in designing a water supply sys-tem when important decisions have to bemade about the quantity to be made avail-able per capita. In some projects, adecision may be made to design a systemwhich will provide a smaller quantity ofwater per capita (for example, 20 lcd) sothat a greater number of persons can haveaccess. In others, the goal may be to assurethat all users are provided with 50 lcd (ora similar “ample” amount) even if fewerhouseholds can be connected to the sys-tem. Design decisions should be made onthe basis of the goals to be achieved by thesystem with attention to the relationshipbetween quantity of water and reductionsin water and sanitation-related diseases.
13
2.
I M PAC T I N D I C ATO R S F O R M E A S U R I N G WAT E R A N D S A N I TAT I O N - R E L AT E D P RO G R A M P E R F O R M A N C E PA RT 2 .
Percentage of child caregivers and food preparers with appropriate
Definition of terms Food preparers and child caregiversare persons who prepare most of thefood in the household and provide mostof the care for young children. Appro-priate handwashing behavior includestwo dimensions: critical times andtechnique:Critical times for handwashing:
• After defecation
• After cleaning babies’ bottoms
• Before food preparation
• Before eating
• Before feeding childrenHandwashing technique:
• Uses water
• Uses soap or ash
• Washes both hands
• Rubs hands together at leastthree times
• Dries hands hygienically—by air drying or using a clean cloth
handwashing behavior
Proof 2 15/9/99 1:09 pm Page 13
CalculationNumber of food preparers and child
caretakers in the sample who report anddemonstrate appropriate handwashing behavior
divided byTotal number of food preparers and child
caretakers interviewed in the sample
Sources of dataHandwashing can be measured by self-reporting of critical times anddemonstration of technique in a house-hold survey. The interviewer firstidentifies the main food preparer andprincipal child caretaker in the house-hold. Usually this is the mother; but itcould be two persons. The interviewerasks the person or persons the followingtwo open-ended questions without pro-mpting and checks off all the itemsmentioned by the interviewee, using asurvey form that lists the five criticaltimes and five techniques given above.
Question 1: When do you wash yourhands?
Question 2: Would you explain andshow me what you do when you washyour hands?
One point is given for each correcttime or technique mentioned or observed.A score of 8 points or more (out of a pos-sible 10) qualifies as appropriatehandwashing behavior.
Data on handwashing behavior canalso be obtained through direct observa-tion in the household, but this method isnot recommended because it is difficult todesign, it requires extensive training ofobservers, and it is intrusive, time-con-suming, and expensive.
IssuesHandwashing is one of the most effectiveways to break the fecal-oral route of dis-ease transmission.
Handwashing behavior is stronglyinfluenced by the presence or absence of aconvenient source of water and soap.Studies have shown that, because theyfacilitate handwashing and other impor-tant hygiene behaviors, in-house watersupplies are associated with reduced ratesof diarrhea (Boot and Cairncross 1993).
A key issue is the bias that may be presentin self-reporting of behavior. Maun’Ebo et al.(1997) compared direct observation to surveyresults in a study of handwashing behaviorof mothers in Zaire. The investigators con-cluded that mothers generally over-reportdesirable behaviors. Persons conducting thesurvey should be as neutral as possible whenposing the questions and not prompt or sug-gest answers. Initial and follow-up surveysshould use exactly the same methodology sothat any bias is systematic.
Sustainabilty of improved handwashingbehavior after the conclusion of promotion-al programs is an important issue that hasnot received adequate attention.
Target ValuesFew studies indicate reasonable targets forimprovements in handwashing practices;instead, most correlate handwashingimprovement programs with reduction ofdiarrheal disease. Extensive evidence con-firms that improved handwashing leads toreductions in diarrheal disease (see periodprevalence indicator section).
Examples from social marketing and health extension programs may pro-vide guidance for setting targets forimprovement:
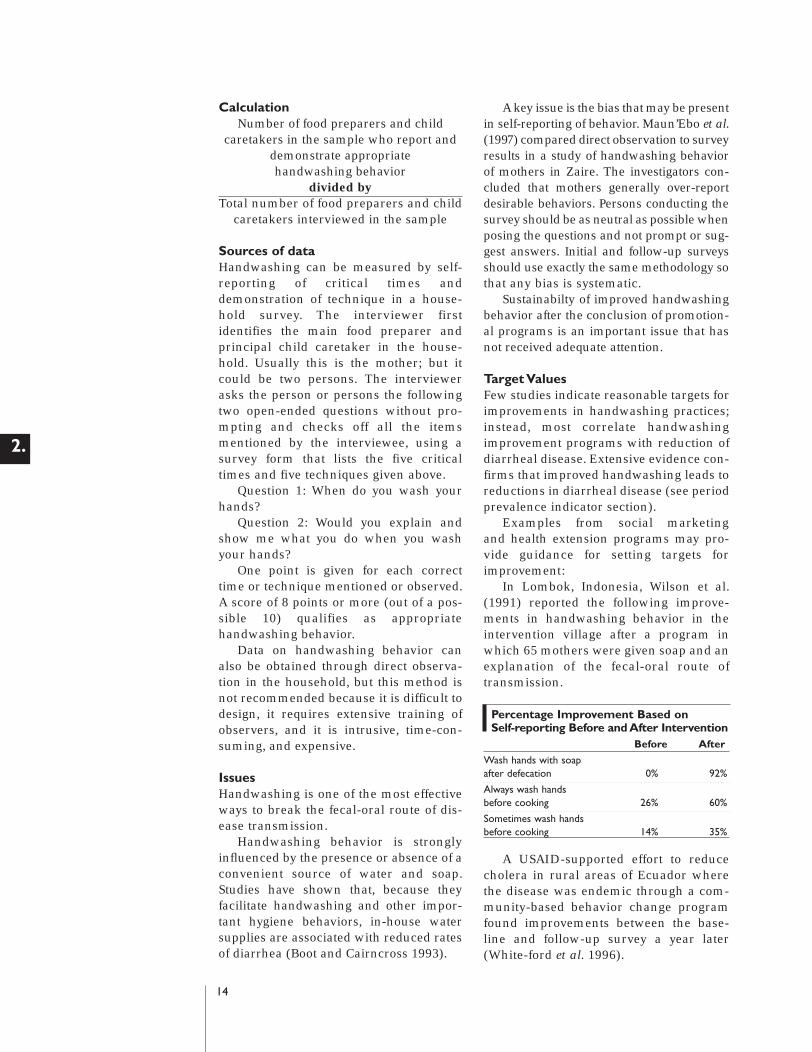
In Lombok, Indonesia, Wilson et al.(1991) reported the following improve-ments in handwashing behavior in theintervention village after a program inwhich 65 mothers were given soap and anexplanation of the fecal-oral route oftransmission.
Percentage Improvement Based onSelf-reporting Before and After Intervention
Before After
Wash hands with soap after defecation 0% 92%
Always wash hands before cooking 26% 60%
Sometimes wash hands before cooking 14% 35%
A USAID-supported effort to reducecholera in rural areas of Ecuador wherethe disease was endemic through a com-munity-based behavior change programfound improvements between the base-line and follow-up survey a year later(White-ford et al. 1996).
14
2.
Proof 2 15/9/99 1:09 pm Page 14

Self-reporting of Community Members
Baseline Follow-up
People engaged in food 25% 40%preparation wash their hands with soap and clean water.
After washing their hands, 20% 30%food preparers air-dry their hands or dry them on clean cloths.
After defecating or urinating, 50% 77%people wash their hands with soap and clean water.
Handwashing is done in 37% 46%.running water or in a container of clean water.
CARE’s Sanitation and Family Education(SAFE) pilot project in Bangladesh orga-nized by ICDDR, B, aimed for behavioralchange through two project models; onewas a conventional model using courtyardeducation sessions; the second addedschool programs, child-to-child activitiesand activities with influential communitymembers (Bateman et al. 1995). Datawere obtained in a household survey;mothers were asked the two open ended-questions recommended for this indicatorand the surveyor observed the presence or
absence of soap or ash and a drying cloth.The results in terms of handwashingbehavior were as follows:
Handwashing Times and Techniques at Conclusion of Promotional Program Intervention Community Compared with Control Community
Appropriate handwashing times = interviewee mentionssix handwashing times (the five given above for this indi-cator plus a sixth:“after disposal of children’s feces”).Model 1 SAFE 33% Control 0%Model 2 SAFE 78% Control 3%
Appropriate handwashing technique - all five elements of handwashing technique as given above.Model 1 SAFE 74% Control 3%Model 2 SAFE 82% Control 16%
Observations of availability of soap or ash in the house-hold confirmed the self-reported behavior.Soap/ash any place in the household.Model 1 SAFE 92% Control 25%Model 2 SAFE 99% Control 16%
The above and other studies that couldbe cited suggest that considerable im-provements in handwashing behavior canbe achieved through promotional programs.Targets aimed at increasing appropriatehandwashing by 50% over the baselinewould not be unrealistic.
15
2.
I M PAC T I N D I C ATO R S F O R M E A S U R I N G WAT E R A N D S A N I TAT I O N - R E L AT E D P RO G R A M P E R F O R M A N C E PA RT 2 .
Percentage of population using hygienic sanitation facilities
Definition of termsA sanitation facility is defined as a func-tioning excreta disposal facility, typically atoilet or latrine. Hygienic means that thereare no feces on the floor, seat, or walls andthat there are few flies. Using sanitationfacilities means that a sanitation facility isthe predominant means of excreta disposalfor household members >12 months of age.
CalculationNumber of people >12 months of age inhouseholds in the sample using hygienic
sanitation facilitiesdivided by
Total number of people >12 months of age in households in the sample
Sources of dataInformation concerning usage of sanita-tion facilities can be obtained through ahousehold survey in which the surveyor
asks the mother or household head aboutfamily latrine use and then inspects thelatrine to see if it is (1) is functioning and(2) hygienic and (3) shows signs of use.The person being interviewed is asked“Do you use the toilet/latrine?” and “Whoin the family uses the toilet/latrine?” Foryoung children, the issue is whether theirfeces are deposited into a sanitation facil-ity, not whether they actually use thefacility themselves. For example, mothersmay put soiled diapers or feces from smallpedi-pots into a latrine.
The toilet or latrine is inspected formaintenance and evidence of use, such asa well worn path between the house andsanitation facility, signs of wear on theseat, absence of storage materials, door ingood repair, absence of spider webs, etc.If the household's facility is not hygienic,the number of household members >12months of age should be counted, but
Proof 2 15/9/99 1:09 pm Page 15
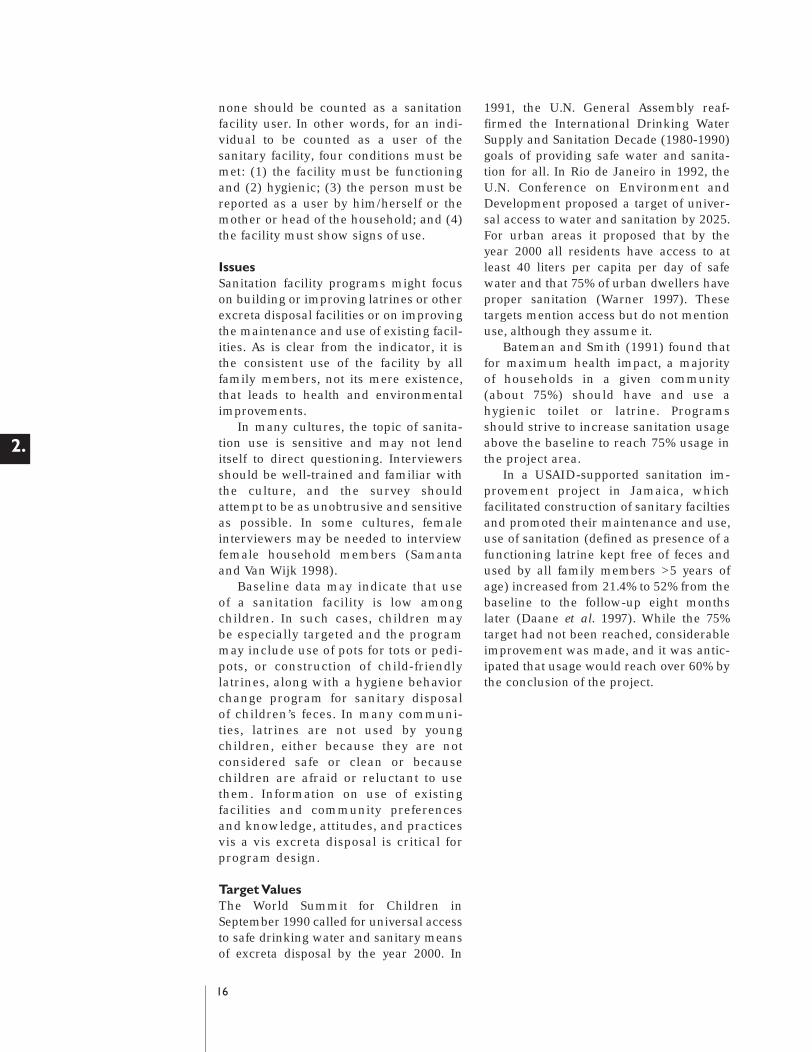
none should be counted as a sanitationfacility user. In other words, for an indi-vidual to be counted as a user of thesanitary facility, four conditions must bemet: (1) the facility must be functioningand (2) hygienic; (3) the person must bereported as a user by him/herself or themother or head of the household; and (4)the facility must show signs of use.
IssuesSanitation facility programs might focuson building or improving latrines or otherexcreta disposal facilities or on improvingthe maintenance and use of existing facil-ities. As is clear from the indicator, it isthe consistent use of the facility by allfamily members, not its mere existence,that leads to health and environmentalimprovements.
In many cultures, the topic of sanita-tion use is sensitive and may not lenditself to direct questioning. Interviewersshould be well-trained and familiar withthe culture, and the survey shouldattempt to be as unobtrusive and sensitiveas possible. In some cultures, femaleinterviewers may be needed to interviewfemale household members (Samantaand Van Wijk 1998).
Baseline data may indicate that useof a sanitation facility is low amongchildren. In such cases, children maybe especially targeted and the programmay include use of pots for tots or pedi-pots, or construction of child-friendlylatrines, along with a hygiene behaviorchange program for sanitary disposalof children’s feces. In many communi-ties, latrines are not used by youngchildren, either because they are notconsidered safe or clean or becausechildren are afraid or reluctant to usethem. Information on use of existingfacilities and community preferencesand knowledge, attitudes, and practicesvis a vis excreta disposal is critical forprogram design.
Target ValuesThe World Summit for Children inSeptember 1990 called for universal accessto safe drinking water and sanitary meansof excreta disposal by the year 2000. In
1991, the U.N. General Assembly reaf-firmed the International Drinking WaterSupply and Sanitation Decade (1980-1990)goals of providing safe water and sanita-tion for all. In Rio de Janeiro in 1992, theU.N. Conference on Environment andDevelopment proposed a target of univer-sal access to water and sanitation by 2025.For urban areas it proposed that by theyear 2000 all residents have access to atleast 40 liters per capita per day of safewater and that 75% of urban dwellers haveproper sanitation (Warner 1997). Thesetargets mention access but do not mentionuse, although they assume it.
Bateman and Smith (1991) found thatfor maximum health impact, a majorityof households in a given community(about 75%) should have and use ahygienic toilet or latrine. Programsshould strive to increase sanitation usageabove the baseline to reach 75% usage inthe project area.
In a USAID-supported sanitation im-provement project in Jamaica, whichfacilitated construction of sanitary faciltiesand promoted their maintenance and use,use of sanitation (defined as presence of afunctioning latrine kept free of feces andused by all family members >5 years ofage) increased from 21.4% to 52% from thebaseline to the follow-up eight monthslater (Daane et al. 1997). While the 75%target had not been reached, considerableimprovement was made, and it was antic-ipated that usage would reach over 60% bythe conclusion of the project.
16
2.
Proof 2 15/9/99 1:09 pm Page 16

17
3.
Definition of TermsAccess to an improved water sourcemeans that the home or compound is con-nected directly to a piped system or that a public fountain, well, or standpost islocated within 200 meters of the home.Year-round means that water is availableduring the time(s) of the year when thewater supply is least reliable. No particu-lar level of water quality is implied, but access must be to water used fordrinking, cooking, cleaning and bathing.Unimproved surface water sources, suchas rivers, lakes, and streams, should notbe counted.
CalculationNumber of households in the sample
with access to an improved water sourcedivided by
Total number of households in the sample
Sources of DataData are collected by means of a survey of a random sample of households. Again,a cluster survey should not be usedbecause water sources may be location-related. The survey should be carried outat the time of year when the waterquantity is lowest or most sources haverun dry. The surveyor should visit eachhouse or compound and verify access to awater supply as defined above. In somecases, the distance to the water supplymay have to be measured to be sure it iswithin 200 meters.
IssuesWHO collected data on “reasonableaccess to safe drinking water” fromnational governments five times duringthe International Decade for DrinkingWater Supply and Sanitation (1980 to1990). Such access was defined for urbanareas as access to piped water or a publicstandpipe within 200 meters of a dwellingor housing unit. For rural areas, “reason-able “is taken to mean that a familymember need not spend a “dispropor-tionate” part of the day collecting water.The source may be treated surface waterand untreated water from protectedsprings, boreholes, and sanitary wells.Definitions of “safe” vary depending uponlocal conditions. (See World Resources1996-97.)
In WHO terms, having “access” towater implies nothing about adequacy.For example, it does not seem reason-able to say that people have “access” todrinking water if the water is barelytrickling out of the nearest public stand-pipe and they must wait long in line toobtain a small amount of water. It maybe desirable to set some additional crite-ria for access based on local conditionsto address the issue of adequacy. Forexample, the amount of time it takes tofill a standard bucket or water receptaclecould be used as a criterion: if it takeslonger than a given amount of time, thesource would be considered by defini-tion to be dry and those forced to rely on
3.Annual Monitoring
Indicators for Measuring Water and Sanitation-Related
Program Performance
PA
RT
Percentage of households with year-round access to improved water source
Proof 2 15/9/99 1:09 pm Page 17
18
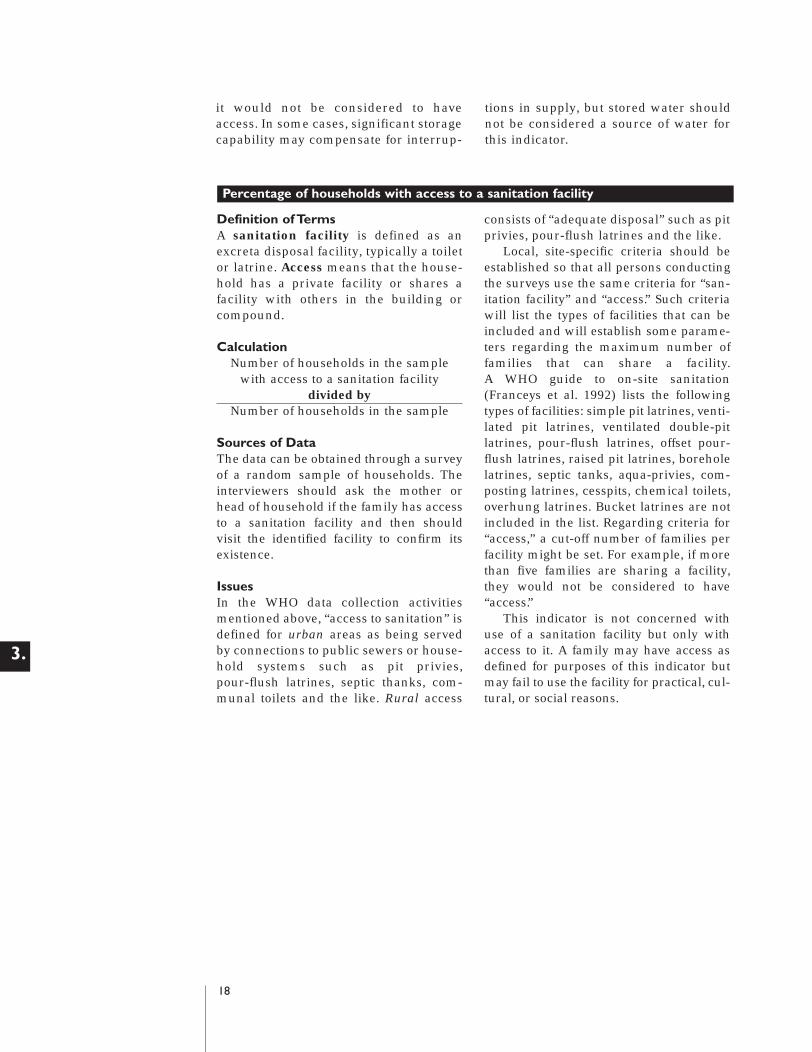
it would not be considered to haveaccess. In some cases, significant storagecapability may compensate for interrup-
tions in supply, but stored water shouldnot be considered a source of water forthis indicator.
3.
Definition of TermsA sanitation facility is defined as anexcreta disposal facility, typically a toiletor latrine. Access means that the house-hold has a private facility or shares afacility with others in the building orcompound.
CalculationNumber of households in the sample
with access to a sanitation facilitydivided by
Number of households in the sample
Sources of DataThe data can be obtained through a surveyof a random sample of households. Theinterviewers should ask the mother orhead of household if the family has accessto a sanitation facility and then shouldvisit the identified facility to confirm itsexistence.
IssuesIn the WHO data collection activitiesmentioned above, “access to sanitation” isdefined for urban areas as being servedby connections to public sewers or house-hold systems such as pit privies,pour-flush latrines, septic thanks, com-munal toilets and the like. Rural access
consists of “adequate disposal” such as pitprivies, pour-flush latrines and the like.
Local, site-specific criteria should beestablished so that all persons conductingthe surveys use the same criteria for “san-itation facility” and “access.” Such criteriawill list the types of facilities that can beincluded and will establish some parame-ters regarding the maximum number offamilies that can share a facility. A WHO guide to on-site sanitation(Franceys et al. 1992) lists the followingtypes of facilities: simple pit latrines, venti-lated pit latrines, ventilated double-pitlatrines, pour-flush latrines, offset pour-flush latrines, raised pit latrines, boreholelatrines, septic tanks, aqua-privies, com-posting latrines, cesspits, chemical toilets,overhung latrines. Bucket latrines are notincluded in the list. Regarding criteria for“access,” a cut-off number of families perfacility might be set. For example, if morethan five families are sharing a facility,they would not be considered to have“access.”
This indicator is not concerned withuse of a sanitation facility but only withaccess to it. A family may have access asdefined for purposes of this indicator butmay fail to use the facility for practical, cul-tural, or social reasons.
Percentage of households with access to a sanitation facility
Proof 2 15/9/99 1:09 pm Page 18

19
3.
ANNUAL MONITORING INDIC ATORS FOR MEASURING WATER AND SANITATION-RELATED PROGRAM PERFORMANCE PA RT 3 .
Definition of termsRecurrent costs refer to all operations andmaintenance costs of the water supply system which services the communityincluding preventive maintenance andrepairs.
CalculationMonthly recurrent costs for water supply
services provided by the communitydivided by
Total monthly recurrent costs for watersupply services
Sources of dataInformation for this indicator may beobtained from community bank accountsand payment records. The full operationsand maintenance costs should be deter-mined for a specified period, usually a
year. That should be the basis for deter-mining monthly costs.
IssuesThe NGO is usually responsible forworking with the community to set userfees. The larger the percentage of costsborne by the community the greater thesustainability of the system.
If in-kind contributions are to be takeninto consideration, as they often are, a practical means for valuing them mustbe determined. Labor should be valuedby determining the time required andmultiplying it by the local minimumwage. Materials should be priced at localmarket rates. It is important to accountfor all community contributions; oftenthey are not reported because it is diffi-cult to estimate their monetary value.
Percentage of recurrent costs for water supply services provided
by the community served
Definition of termsConstructed water supply systems refers tothose water supply systems constructed bythe NGO or project. Such systems are typi-cally for villages or urban or peri-urbanneighborhoods. Criteria for communityoperations and maintenance need to bedeveloped by the NGO and might includethe following:
• Existence of a functioning operations and maintenance committee that meets regularly
• Designated people responsible for operations and maintenance who canarticulate (or demonstrate) proceduresfollowed to operate and maintainfacilities
• Appropriate tools in good working order
• Up-to-date accounts
• Water system operational and in goodrepair
CalculationNumber of constructed water supply systems operated and maintained by
the community divided by
Number of constructed water supplyfacilities
Sources of dataData would be collected from each commu-nity with a constructed system throughreview of project and community records;interviews with community leaders, main-tenance by committee members, consum-ers, maintenance persons; and observationand inspection of the water supply system.
IssuesWater supply systems operated and main-tained by the community served are likelyto be more sustainable than those main-tained by persons outside the communityor centralized services.
Percentage of constructed water supply systems adequately operated
and maintained by the community they serve
Proof 2 15/9/99 1:09 pm Page 19

Aziz, K., B. Hoque, K.. Hasan,M.Patwary, S.. Huttly, M. Rahman andR. Feachem. 1990. Reduction in diar-rhoeal diseases in children in ruralBangladesh by environmental andbehavioural modifications. Transactionsof the Royal Society of Tropical Medicineand Hygiene 84(3):433-438.
Bateman, O.., R. Jahan, S. Brahman, S.Zeitlyn and S. Laston. 1995. Preventionof Diarrhea Through Improving HygieneBehaviors: The Sanitation and FamilyEducation (SAFE) Pilot ProjectExperience. Bangladesh: CARE-ICDDR,BJoint Publication.
Bateman, O., and S. Smith. 1991. AComparison of the Health Effects of WaterSupply and Sanitation in Urban andRural Guatemala. Water and Sanitationfor Health (WASH) Project Field Report352 reprinted by the EnvironmentalHealth Project, Arlington, VA.
Bergeron, G. and S. Esrey. 1993.Baseline Survey for the GuatemalaHighlands Rural Water and SanitationProject. WASH Field Report #403. WASH:Washington DC.
Boot, M.., and S. Cairncross, eds. 1993.Actions Speak: The Study of HygieneBehavior in Water and SanitationProjects. IRC International Water andSanitation Centre and London School ofHygiene and Tropical Medicine: TheHague.
Daane, J. , M. Lamb, and E..Perez. 1997.Evaluation of the Jamaica UrbanEnvironmental Program for On-SiteSanitation. Activity Report No. 35.Arlington, VA: Environmental HealthProject (EHP).
Esrey, S., J.Potash, L. Roberts, C. Shiff.1991. Effects of improved water supplyand sanitation on ascariasis, diarrhea,drancunculiasis, hookworm infection,schistosomiasis and trachoma. Bulletin ofthe World Health Organization 60:609-621.
Feachem, R. 1984. Interventions for thecontrol of diarrhoeal diseases amongyoung children: promotion of personaland domestic hygiene. Bulletin of theWorld Health Organization 62(3): 467-476.
Franceys, F, J. Pickford, and R. Reed.1992. A Guide to the Development of On-Site Sanitation. Geneva: World HealthOrganization.
4. ReferencesPA
RT
20
4.
Bibliography
Proof 2 15/9/99 1:09 pm Page 20

Gleick, P. 1996. Basic water require-ments for human activities: meetingbasic needs. Water International 21:83-92.
Huttly, S.., S. Morris, and V. Pisani. 1997.Prevention of diarrhoea in young childrenin developing countries. Bulletin of theWorld Health Organization 75(2):163-174.
Manun’Ebo, M., S. Cousens, P.Haggerty, M.. Kalengaie, A. Ashworth,and B. Kirkwood. 1997. Measuringhygiene practices: a comparison of ques-tionnaires with direct observations inrural Zaire. Tropical Medicine andInternational Health 2(11): 1015-1021.
Samanta, B., and C. Van Wijk. 1998.Criteria for successful sanitation pro-grammes in low income countries.Health Policy and Planning 13(1):78-86.
VanDerslice, J, B Popkin, and J.Briscoe. 1994. Drinking-water quality,sanitation, and breast-feeding:their inter-active effects on infant health. Bulletin ofthe World Health Organization 72:589-601.
Warner, D. 1997. Environmental sanita-tion and child health: the missing link inchild survival. Speech given at theUniversity of Notre Dame, at a confer-ence on the Changing Status of Childrenin Latin America: Issues in Child Healthand Children’s Right, September 26-29.
Whiteford, L., C. Laspina, and M.Torres. 1996. Monitoring the Effect ofBehavior Change Activities on Cholera: AReview in Chimborazo and Cotopaxi,Ecuador. Activity Report #25. Arlington,VA: Environmental Health Project.
Wilson, J., G. Chandler, Muslihatun,and Jamiluddin. 1991. Hand-washingreduced diarrhoea episodes: a study inLombok, Indonesia. Transactions of theRoyal Society of Tropical Medicine andHygiene 85:819-821.
World Resources Institute. 1996. WorldResources 1996-97. New York and Oxford:Oxford University Press. (Jointly pub-lished with the United NationsEnvironment Program, the UnitedNations Development Program, and theWorld Bank.)
21
4.
R E F E R E N C E S PA RT 4 .
Proof 2 15/9/99 1:09 pm Page 21

CATEGORY
Health, nutritionand MCH
Water andSanitation
Household foodconsumption
Agriculturalproductivity
22
4.
Appendix 1:Title II Generic Indicators
LEVEL
Impact
Annual monitoring
Impact
Annualmonitoring
Impact
Impact
Annual monitoring
INDICATOR
% stunted children 24-59 months (height/age z-score)
% underweight children by age group (weight/age z-score)
% infants breastfed w/in 8 hours of birth
% infants under 6 months breastfed only
% infants 6-10 months fed complementary foods
% infants continuously fed during diarrhea
% infants fed extra food for 2 weeks after diarrhea
% eligible children in growth monitoring/promotion
% children immunized for measles at 12 months
% of communities with community health organization
% children in growth promotion program gaining weight in past 3 months (by gender)
% children < 36 mo with diarrhea in last two weeks
Quantity of water used per capita per day
% child caregivers and food preparers with appropriatehand washing behavior
% population using hygienic sanitation facilities
% households with year-round access to improved water source
% households with access to a sanitation facility
% constructed water facilities maintained by community
% recurrent costs for water supply services provided by community
% households consuming minimum daily food requirements
number of meals/snacks eaten per day
number of different food/food groups eaten
annual yield of targeted crops
yield gaps (actual vs. potential)
yield variability under varying conditions
value of agricultural production per vulnerable household
months of household grain provisions
% of crops lost to pests or environment
annual yield of targeted crops
number of hectares in which improved practices adopted
number of storage facilities built and used
Proof 2 15/9/99 1:09 pm Page 22
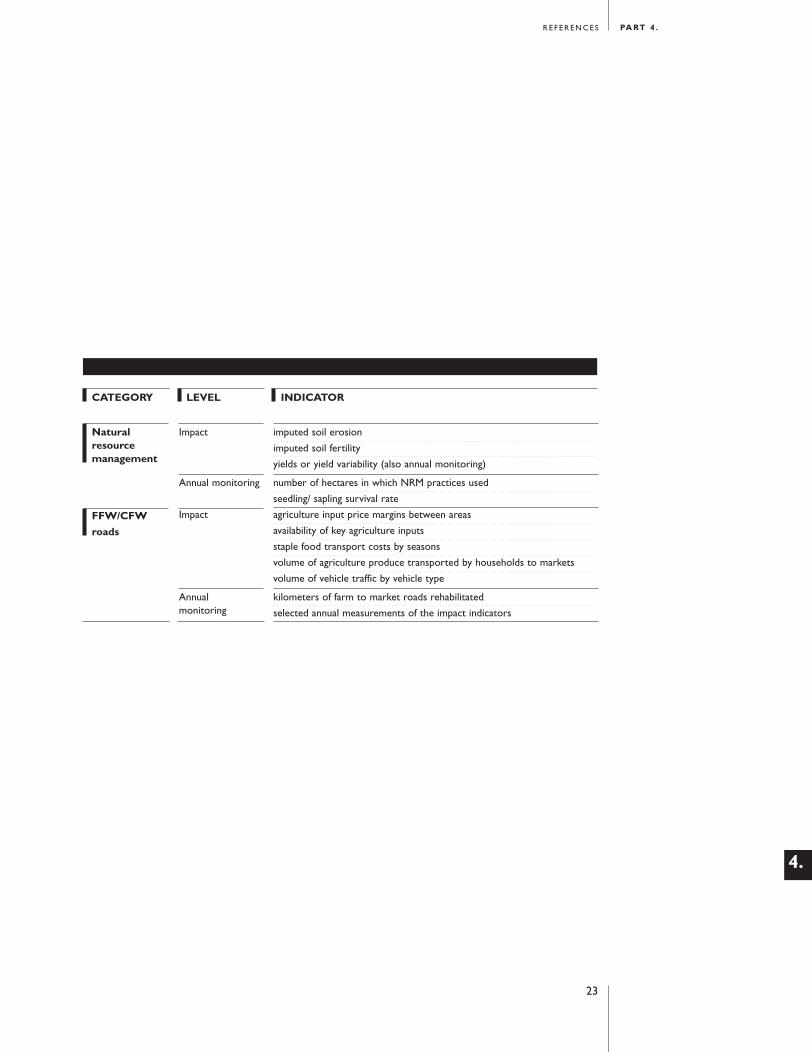
CATEGORY
Naturalresourcemanagement
FFW/CFW
roads
LEVEL
Impact
Annual monitoring
Impact
Annualmonitoring
INDICATOR
imputed soil erosion
imputed soil fertility
yields or yield variability (also annual monitoring)
number of hectares in which NRM practices used
seedling/ sapling survival rate
agriculture input price margins between areas
availability of key agriculture inputs
staple food transport costs by seasons
volume of agriculture produce transported by households to markets
volume of vehicle traffic by vehicle type
kilometers of farm to market roads rehabilitated
selected annual measurements of the impact indicators
23
4.
R E F E R E N C E S PA RT 4 .
Proof 2 15/9/99 1:09 pm Page 23
24
4.
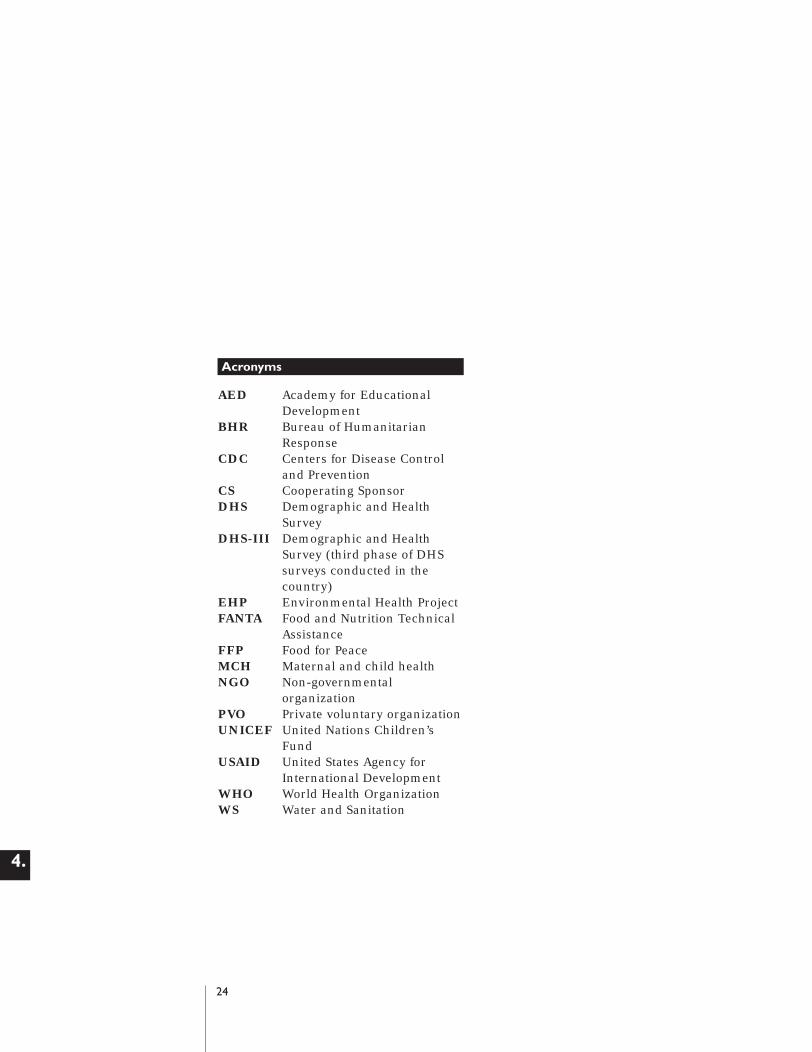
Acronyms
AED Academy for Educational Development
BHR Bureau of Humanitarian Response
CDC Centers for Disease Control and Prevention
CS Cooperating SponsorDHS Demographic and Health
SurveyDHS-III Demographic and Health
Survey (third phase of DHS surveys conducted in the country)
EHP Environmental Health ProjectFANTA Food and Nutrition Technical
AssistanceFFP Food for PeaceMCH Maternal and child healthNGO Non-governmental
organizationPVO Private voluntary organizationUNICEF United Nations Children’s
FundUSAID United States Agency for
International DevelopmentWHO World Health OrganizationWS Water and Sanitation
Proof 2 15/9/99 1:09 pm Page 24


