Ellen Hanak Jay Lund Barton “Buzz” Thompson W. Bowman Cutter Brian Gray David Houston
Richard Howitt Katrina Jessoe Gary Libecap Josué Medellín-Azuara Sheila Olmstead Daniel Sumner David Sunding Brian Thomas Robert Wilkinson
with research support from Elizabeth Stryjewski
Supported with funding from the S. D. Bechtel, Jr. Foundation
What are the key economic issues related to water management in California today? This report offers a consensus view, drawn from a wide-ranging group of experts. We find
that despite many beneficial innovations in water management over the last several decades, risks to the economy remain.
Water is indeed vital to the California economy, but not always in the ways one might think. It is a scarce resource, subject to numerous and competing demands—including increasing demands for environmental uses. And the state essentially stopped expanding its vast surface storage network several decades ago. Yet the economy has weathered peri-odic droughts, and enough water has been available to support a growing population and economy, thanks to management innovations including water use efficiency, water markets, underground storage (or “banking”), and reuse of highly treated wastewater.
Another reason for resilience: California’s economy has become less reliant on water-intensive activities. For instance, agriculture and related manufacturing account for nearly four-fifths of all business and residential water use—but make up just 2 percent of state GDP and 4 percent of all jobs.
But California’s current water system raises several red flags. Catastrophic interruptions of water supplies from earthquakes and floods could cause large short-term losses; unre-liable supplies could also jeopardize business and infrastructure investments that support economic growth. Catastrophic flood risk and severely overdrafted groundwater basins are major concerns in some regions.
California is also susceptible to increasing costs associated with climate change, which is expected to raise environmental demands on the water system, reduce “free” seasonal water storage in the mountain snowpack, and increase the size and frequency of coastal floods.
Smarter management and investment can make California’s economy more resilient in the face of these threats. We recommend seven key changes to support California’s economic vitality.
1. Modernize water measurement and pricing with better estimates of water use and prices that reflect water’s economic value.
2. Reduce vulnerability to water supply interruptions, particularly for the large parts of the state that rely on water exported through the Sacramento–San Joaquin Delta, where supplies are susceptible to levee failures and measures to protect endangered species.
3. Strengthen water markets by clarifying and streamlining the approval process for the sale and lease of water rights and addressing infrastructure gaps.
4. Improve local groundwater management to facilitate groundwater banking and reduce overdraft.
5. Reduce exposure to catastrophic flood risk by targeting flood protection dollars and making better land use decisions.
6. Improve environmental management through more integrated, coordinated, and accountable approaches.
7. Develop more reliable funding, especially for environmental management, flood pro-tection, and statewide data collection and analysis.
Many of these changes require strong, proactive state leadership. But all stakeholders, including the business community, have a vital role to play, by engaging in the policy process and helping to ensure that California undertakes the water reforms needed to support a healthy and prosperous economy.
For the full report and related resources, please visit our publication page: http://www.ppic.org/main/publication.asp?i=1015
www.ppic.org
Water and the California Economy 3
Introduction
In the popular media and in public policy debates, it is common to encounter statements emphasizing the vital role of water in the California economy. Many observers assume that the state’s economy will suffer—or indeed is already suffering—from water shortages related to droughts, regulatory cutbacks in water deliveries, and the failure of water infrastructure development to keep pace with a growing population. Yet there has been surprisingly little research on the role of water in California’s economic growth and the economic well-being of its residents. Clearly, some amount of water is essential for virtually all types of economic activity, just as it is essential for daily human life. But how important is water—now and in the foreseeable future—as a driver of the state’s economy? And how vulnerable is the state’s economy to weaknesses in its water system?
The purpose of this report is to shed light on these questions. To this end, we gathered for an all-day workshop in late September 2011 to assess available data and research findings. As a group, we represent a wide range of expertise and perspectives (see “About the Authors”). This report reflects our consensus view on the role of water in Califor-nia’s economy, key areas of economic vulnerability, and the priorities that policymakers, business leaders, and water managers must address to ensure that the state’s water sys-tem does not impede economic progress.
Given the high levels of unemployment that have persisted since the last recession, current discussions about the economy generally focus on jobs. We will also consider other economic measures—some familiar and others less so. Total revenues (or sales) and “value added” are two of the most common measures. Value added is the difference between total revenues and the cost of non-labor business expenses; it is the primary measure of the value of eco-nomic activity in a region, and it corresponds to the famil-iar measure of gross domestic product (GDP). Less obvious, but also important, is the value to the state’s residents of
healthy ecosystems and watersheds. Although the mar-ketplace generally does not fully measure such “amenity” values, they are part of what makes California a desirable place to live and what makes it possible to attract and keep a highly productive workforce and the businesses that cre-ate jobs and economic growth.1
We also take a broad view of the water system, consid-ering not just water supply but also water quality and flood protection. In California, these three areas involve thou-sands of local management entities—mostly public agen-cies but also many private companies. These entities are responsible for delivering “raw” (untreated) irrigation water to farms and treated drinking water to other businesses and households, managing groundwater supplies, removing and treating wastewater, building and maintaining thou-sands of miles of levees and other structures to reduce flood exposure, and keeping polluted storm water from reaching rivers and beaches. They are also increasingly responsible for protecting aquatic habitat. Federal, state, and local
agencies own and operate major water supply and flood protection infrastructure, and federal and state regulations for public health and the environment affect management decisions throughout the water system.
We begin with an overview of the role of water in the state’s economy in the past, present, and foreseeable future. We then explore key economic vulnerabilities caused by weaknesses in the water system and priorities for action to address these weaknesses and reduce the associated economic risks.
How important is water—now and in the foreseeable future—as a driver of the state’s economy? And how vulnerable is the economy
Water and California’s Economy, Yesterday, Today, and Tomorrow
Water plays many roles in California’s economy. Every business and household uses water for a variety of pur-poses, both to support daily human needs and in the pro-duction of agricultural and industrial products and other goods and services. Safe drinking water is invaluable to the California economy, preventing waterborne illness and death. Watersheds and waterways provide Californians with many services, including hydroelectric power, recre-ation, transportation, fisheries, and aesthetic pleasure.
Water management itself is an important sector of California’s economy. Numerous public agencies and private businesses manage water supplies and wastewater, provide flood protection, and help support environmental amenities. These activities directly account for roughly $34 billion annually in operating and investment expenditures (see the table) and $14 billion to $23 billion in value added.2 Thus, water management directly accounts for about 1 per-cent of California’s $1.9 trillion economy (GDP). It directly employs some 53,000 people (0.3 percent of all California employment) and indirectly employs many additional personnel through contracts with private engineering, con-struction, consulting, and law firms.
Economic size of California’s water management system, late 2000s
State Water Resources Control Board (water quality and rights) 435 – 435 1,465
Department of Fish and Game (ecosystems) 173 1 174 1,093
Department of Public Health (drinking water quality) 80 – 80 206
California Public Utilities Commission (private water utilities) 83 – 83 68
Water-related general obligation debt repayment – 530 530 –
Federal agencies (California programs) 374 136 510 3,012
U.S. Bureau of Reclamation (water supply) 207 – 207 937
U.S. Army Corps of Engineers (flood management) 47 136 183 1,246
U.S. Environmental Protection Agency (water quality) 8 – 8 56
U.S. Fish and Wildlife Service (ecosystems) 58 – 58 400
National Marine Fisheries Service (ecosystems) 54 – 54 373
Total local, state, and federal 19,927 13,950 33,877 52,811
SOURCES: Author estimates using a variety of state and federal sources. For details, see the online technical appendix (www.ppic.org/content/pubs/other/512EHR_appendix.pdf).
NOTES: Investment expenditures generally include capital outlays, interest payments on debt, and loss on sale of assets. Operating expenditures generally cover all other expenditures. Capital outlays constituted 71 and 77 percent of investment expenditures for public wastewater and water agencies, respectively. To avoid double counting, the table excludes $720 million in state grants to local agencies and $481 million in federal grants.
NOTES: The map shows the distribution of runoff—the amount of local precipitation that flows into streams and recharges groundwater. Two major farming areas have limited runoff: the San Joaquin Valley (the area between Stockton and Bakersfield) and the Imperial Valley (El Centro).
Figure 1. Most of California’s precipitation falls far from major cities and farms
But because the water system supports activities in the rest of the economy, the most important question is how water management helps create value in other sec-tors. The bottom line? Although water is an essential input, California’s economy has been evolving in ways that have increased the economic productivity of water use, whether it is measured by jobs or the value added per unit of water used. This evolution has enabled the state’s economy to grow even though water is a scarce resource that has to meet numerous competing demands, including increasing demands for environmental water. As long as we manage it well, the water sector can continue to support a healthy economy.
Despite Water Scarcity, the Economy Has Grown Water has always been a scarce resource in California, often unavailable at the time and place and in the quantity desired. The state’s climate features a predictably dry grow-ing season and highly variable annual precipitation. Most precipitation falls on the northern and eastern mountains and most of the population and irrigated farmland is in drier regions to the south and west (Figure 1). To meet the agricultural and urban water demands in these dry places, federal, state, and local agencies built vast storage and conveyance networks during the early to mid-20th century.3 Agriculture, which depends on irrigation water, has been the principal user of much of this infrastructure. Over time, however, the rapid growth in the production of other goods and (especially) services has dwarfed agricul-ture’s share of statewide employment (Figure 2). By the late 2000s, crop and livestock production directly repre-sented just 2 to 3 percent of employment; even when related manufacturing is included, the share was 3 to 4 percent.4 Agriculture’s share of state GDP is even lower—roughly 1 percent for crops and livestock, and 2 percent with agro-processing.5 On average, non-farm sectors generate much more economic value per drop of water used.6 As a result, California’s real economy has grown, even though total business and residential water use appears to have flattened since the early 1980s. Over the past four decades, per capita water use has been halved, while real per capita GDP has
Sacramento
StocktonSan Francisco
San Jose
Fresno
Los Angeles
San Diego
Redding
Bakers�eld
Palm Springs
El Centrokm0 80 160 240
mi0 50 100 150
Average annual runo� (land area)
66% (20%)
24% (20%)
9% (20%)
1% (10%)
0.1% (30%)
Figure 2. California’s economy has become less dependent on agriculture, which uses more water than any other sector
SOURCE: Author calculations using US Census data (IPUMS, 1950 industry basis).
NOTES: “Agriculture” includes crop and livestock production and related manufacturing, as well as forestry (which never exceeded 0.2% of employment and now accounts for less than 0.1%). “Other goods” includes non-food manufacturing and construction. “Recreation” includes fisheries (which never exceeded 0.5% of employment and now account for less than 0.1%).
Figure 3. California has been using less water to generate more economic activity
SOURCE: Author calculations using California Department of Water Resources (water use), California Department of Finance (population), and U.S. Bureau of Economic Analysis (state GDP).
NOTES: Water use estimates are for applied use in the agricultural and urban sectors. Pre-2000 estimates are adjusted to levels that would have been used in a year of normal rainfall. Estimates for 2000 and 2005 are for actual use (both years had near-normal precipitation). Estimates omit conveyance losses (6–9% of the total). GDP was converted to real values using the GDP deflator for the nation as a whole.
doubled. Each unit of water now generates four times more economic value than it did in 1967 (Figure 3).
The State’s Economy Will Continue to Grow These trends are likely to persist as the state’s economy grows and evolves, with increasing emphasis on higher valued uses of water, continuing decline in the share of agricultural water use, greater efficiencies in urban use, and growing demands for environmental water and healthy watersheds.
Agriculture Will Use Less Water, Generate More Value
Agriculture’s share of all business and residential water use has declined over time, but it still accounts for roughly three-quarters of the total (Figure 4). Although total agri-cultural water use peaked around 1980, the real value of agricultural output has continued to grow as farmers have improved irrigation efficiency and shifted toward crops that generate more value and profits per volume of water used. In 2005, farmers applied 23 percent less water to their
fields than in 1980, but real agricultural GDP was 11 percent higher.7 Over this period, average yields increased by more than 40 percent, and higher-value fruits, nuts, vegetables, and horticultural crops shifted from 29 to 38 percent of total cropland.8 These crop shifts have generally been accompanied by more precise irrigation technology, such as drip irrigation, which has contributed to yield improve-ments (Orang, Matyac, and Snyder 2008). These trends appear to have continued during the recent drought.9
Productivity increases and shifts toward crops that generate higher revenues and profits per unit of irrigation water are likely to continue as farmers respond to incen-tives in commodity markets (notably, strong growth in specialty crops) and to rising water costs (Medellín-Azuara et al. 2012).
Residential Conservation Can Help Offset Demands from Population Growth
Urban water use efficiency has been increasing: Total urban use has been flat since the mid-1990s despite con-tinuing population growth (Figure 4). Average per capita urban use is estimated to have fallen by nearly 25 percent between 1995 and 2005 (from 247 to 201 gallons per capita per day [gpcd]). This downward trend continued during the late 2000s as urban water utilities promoted conserva-tion to cope with a multi-year drought.10 California house-holds are directly responsible for more than two-thirds of urban water use in the state (Figure 5), making them a natural target for conservation efforts. There is still consid-erable room for cost-effective urban water savings, which can help offset demands from anticipated population growth (California Department of Water Resources 2009; Gleick et al. 2003; CALFED 2006).11 To date, improvements in indoor plumbing and appliances such as low-flow toilets and showers have generated most of the savings. Outdoor water use for landscaping, which accounts for at least half of all urban water use, represents a largely untapped reser-voir for savings (Figure 5). Improving landscape irrigation technology and switching from thirsty lawns to plants that consume less water can reduce per capita water use sub-stantially (Hanak and Davis 2006; Gleick et al. 2003).
0
50
100
150
200
250
300
350
400
450
1967
= 1
00
1967 1972 1980 1985
State GDP per unit of water used
State GDP per capita
Water use per capita
1990 1995 2000 2005
www.ppic.org
Water and the California Economy 7
Water use levels in other developed economies with similar climates suggest the potential for additional urban conservation in California. Compared with California’s 201 gpcd, Australia’s urban water use in the early 2000s was 80–130 gpcd, Israel’s was 84 gpcd, and Spain’s was 76 gpcd (Food and Agricultural Organization of the United Nations n.d.).12 Legislation adopted in late 2009, which requires California’s urban agencies to reduce per capita use by 20 percent by 2020, should help maintain momentum in urban water use efficiency.
Manufacturing and Services Use Only a Small Share of Water
As shown in Figure 5, commercial and institutional water uses, corresponding to service sectors of the economy, account for a small fraction of total urban use (23%), and manufacturing industries use even less (6%). It is difficult to quantify the water used in specific commercial, indus-trial, and institutional sectors because many utilities do not track this information separately, and some indus-trial plants have their own supply systems.13 In the most detailed analysis to date, Gleick et al. (2003) identified the petroleum refining, high tech, fruit and vegetable process-ing, and beverages sectors as the four largest industrial water users in 2000, each using more than 50,000 acre-feet (af) per year. (An acre-foot is 325,851 gallons, the amount of water needed to spread one foot of water over an acre of land; at 2005 levels of urban per capita use, an acre-foot equals an annual water supply for 4.4 people.) The leading commercial and institutional users, each drawing more than 150,000 acre-feet per year, included office build-ings, schools, golf courses, restaurants, and retail stores. Whereas most industrial uses were for process-related and cooling purposes, the commercial sector, like the residential sector, used water mostly for landscaping and restrooms.
Commercial, institutional, and industrial water users have been making strides in efficiency with advanced appliances (e.g., pre-wash spray nozzles in restaurants, low-flow toilets) as well reductions in outdoor watering
Figure 4. Agricultural water use peaked in the early 1980s, and urban use has been leveling off
Figure 5. Residential use accounts for more than two-thirds of all urban water use
SOURCE: Authors calculations using data from the California Department of Water Resources.
NOTES: The figure shows applied water use. “Urban” includes residential and nonagricultural business uses. Pre-2000 estimates are adjusted to levels that would have been used in a year of normal rainfall. Estimates for 2000 and 2005 are for actual use; both years had near-normal precipitation. Estimates omit conveyance losses (6–9% of the total).
SOURCE: Author calculations using data from the California Department of Water Resources.
NOTES: Average annual applied water use for 1998–2005. The total (8.3 million acre-feet) excludes conveyance losses and active groundwater recharge. Water for landscaping uses includes “residential exterior,” “commercial and institutional large landscapes” (e.g., parks, golf courses, cemeteries) and a portion of other commercial, institutional, and industrial water use.
Agric
ultu
re’s
shar
e of
tota
l (%
) 0
5
10
15
20
25
30
35
40
45
Acre
-feet
(mill
ions
)
0
10
20
30
40
50
60
70
80
90
100
19601967
19721980
19851990
19952000
2005
Total
Agriculture
Urban
Industrial, interior and exterior
(6%)
Commercial and institutional, interior and small landscapes
(13%)
Energy(2%)
Residential,interior(32%)
Residential,exterior
(37%)
Commercial and institutional, large landscapes
(10%)
www.ppic.org
Water and the California Economy8
(e.g., replacement of lawns with lower-water-using plants and artificial turf). Many industrial plants are reusing process water and switching to recycled wastewater, and under new regulations, the energy sector will be using less potable water for cooling. But there is still considerable opportunity for cost-effective conservation in these sectors (Gleick et al. 2003). And because it takes a lot of energy to heat, transport, and treat water, water savings can also trans-late into substantial energy savings (Wilkinson 2011).14
Environmental Water Demands Are Likely to Grow
In contrast to the trends in agricultural and urban water use, the demand for environmental water, healthy water-sheds, and clean beaches—met through a combination of flow management and water quality protections—has been increasing in recent decades and is likely to continue to grow in the 21st-century economy. The evidence for this shift is largely indirect, because there are no comprehen-sive measurements of environmental water use in Califor-nia or the value residents place on it.
Societal demand for healthy watersheds is reflected in the passage of a variety of state and federal environ-mental laws beginning in the late 1960s and 1970s. It is also reflected in California voters’ approval since 1970 of over $30 billion in state general obligation bonds for water (2010 dollars), most of which focus on water quality and other environmental water issues (Hanak et al. 2011). In addition, although the market does not generally put a price on environmental flows, many studies document their value in supporting commercial and recreational fisheries and other forms of water-based recreation.15 For example, during the early 1990s drought, the water left in California reservoirs and wildlife preserves to support recreation services produced an estimated economic value comparable to the value produced by water used for many agricultural activities.16 Nationwide, watershed protection saves cities billions of dollars per year in avoided treat-ment costs (Postel and Thompson 2005)—San Francisco alone saves tens of millions of dollars per year because it
receives water from the pristine Hetch Hetchy watershed (Null and Lund 2006).17 In addition, most people value the continued existence of native species and landscapes even if they never see them (this is sometimes called a “nonuse” or “existence” value).18
The recent settlement agreement to restore flows in the San Joaquin River illustrates the importance of considering the economic value of healthy watersheds. The estimated value of additional flows on stretches of that river (in terms of recreation, lower treatment costs, and the existence value of restored flows) exceeds farm revenue losses.19 The plan to rehabilitate the Los Angeles River (which was paved over in
concrete in the mid-20th century to manage floodwaters) is another illustration: the new riverfront is expected to generate a variety of recreational and commercial benefits (City of Los Angeles 2007).
These are just two among many decisions over the past several decades to improve the health of California’s watersheds by increasing environmental flows and devot-ing other resources to better stewardship of the state’s aquatic resources. In some places, the rising demand for environmental water and healthy watersheds has reduced the amount of water available for other uses. Environmen-tal concerns have also reduced the popularity of surface storage construction as a way of expanding water supplies for human uses, because of the damage caused by past projects.20 Environmental limits on water diversions have correspondingly encouraged the adoption of a broader portfolio of tools to use existing supplies more efficiently. Meeting environmental demands poses funding chal-lenges, because many environmental benefits accrue to the broader public rather than a readily identifiable group of
Environmental limits on water diversions have encouraged Californians to use existing
supplies more efficiently.
www.ppic.org
Water and the California Economy 9
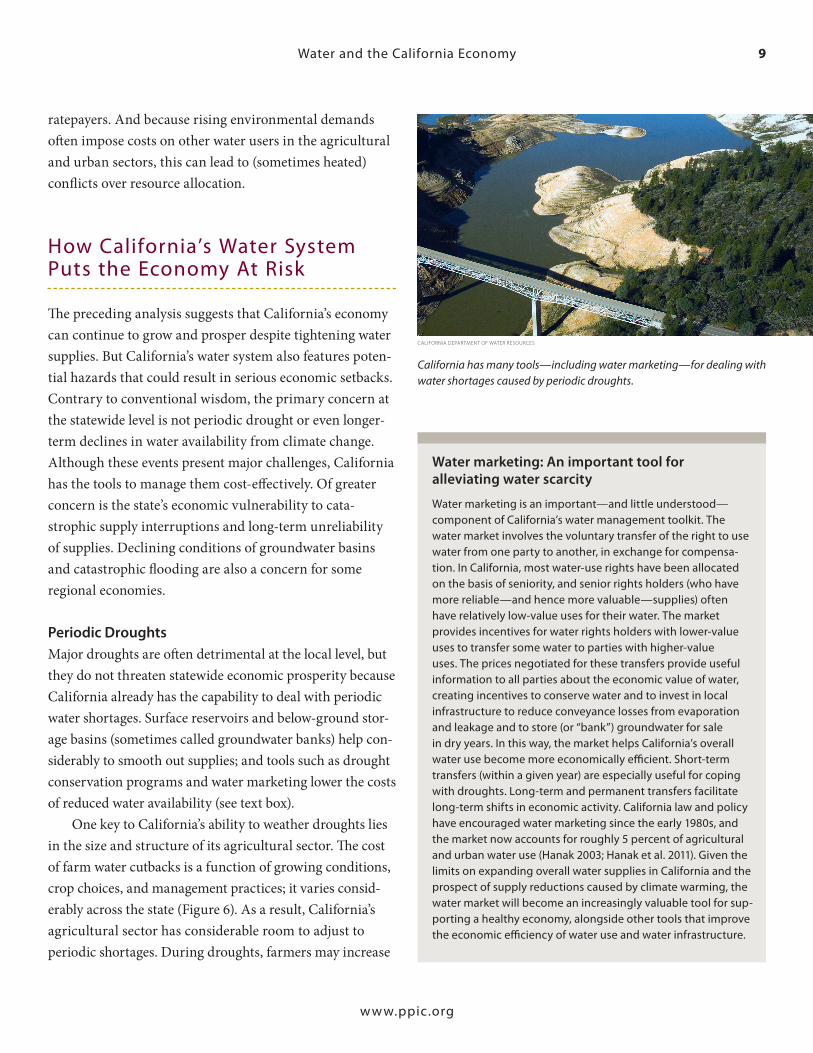
CALIFORNIA DEPARTMENT OF WATER RESOURCES
California has many tools—including water marketing—for dealing with water shortages caused by periodic droughts.
ratepayers. And because rising environmental demands often impose costs on other water users in the agricultural and urban sectors, this can lead to (sometimes heated) conflicts over resource allocation.
How California’s Water System Puts the Economy At Risk
The preceding analysis suggests that California’s economy can continue to grow and prosper despite tightening water supplies. But California’s water system also features poten-tial hazards that could result in serious economic setbacks. Contrary to conventional wisdom, the primary concern at the statewide level is not periodic drought or even longer-term declines in water availability from climate change. Although these events present major challenges, California has the tools to manage them cost-effectively. Of greater concern is the state’s economic vulnerability to cata-strophic supply interruptions and long-term unreliability of supplies. Declining conditions of groundwater basins and catastrophic flooding are also a concern for some regional economies.
Periodic DroughtsMajor droughts are often detrimental at the local level, but they do not threaten statewide economic prosperity because California already has the capability to deal with periodic water shortages. Surface reservoirs and below-ground stor-age basins (sometimes called groundwater banks) help con-siderably to smooth out supplies; and tools such as drought conservation programs and water marketing lower the costs of reduced water availability (see text box).
One key to California’s ability to weather droughts lies in the size and structure of its agricultural sector. The cost of farm water cutbacks is a function of growing conditions, crop choices, and management practices; it varies consid-erably across the state (Figure 6). As a result, California’s agricultural sector has considerable room to adjust to periodic shortages. During droughts, farmers may increase
Water marketing: An important tool for alleviating water scarcity
Water marketing is an important—and little understood— component of California’s water management toolkit. The water market involves the voluntary transfer of the right to use water from one party to another, in exchange for compensa-tion. In California, most water-use rights have been allocated on the basis of seniority, and senior rights holders (who have more reliable—and hence more valuable—supplies) often have relatively low-value uses for their water. The market provides incentives for water rights holders with lower-value uses to transfer some water to parties with higher-value uses. The prices negotiated for these transfers provide useful information to all parties about the economic value of water, creating incentives to conserve water and to invest in local infrastructure to reduce conveyance losses from evaporation and leakage and to store (or “bank”) groundwater for sale in dry years. In this way, the market helps California’s overall water use become more economically efficient. Short-term transfers (within a given year) are especially useful for coping with droughts. Long-term and permanent transfers facilitate long-term shifts in economic activity. California law and policy have encouraged water marketing since the early 1980s, and the market now accounts for roughly 5 percent of agricultural and urban water use (Hanak 2003; Hanak et al. 2011). Given the limits on expanding overall water supplies in California and the prospect of supply reductions caused by climate warming, the water market will become an increasingly valuable tool for sup-porting a healthy economy, alongside other tools that improve the economic efficiency of water use and water infrastructure.
groundwater pumping, use irrigation water more sparingly, and fallow fields used for lower value annual crops.21 Such measures can allow some farmers to lease unused water to those with higher-value agricultural, urban, and envi-ronmental uses. Farm water sales during the early 1990s drought provided significant relief to cities, wildlife refuges, and other farmers (Hanak 2003). Farm-to-farm trans-fers also substantially reduced the cost of the most recent drought in the San Joaquin Valley (Howitt, MacEwan, and Medellín-Azuara 2011).
In contrast to agriculture, there is not much good information about the economic costs of shorting indus-trial and commercial water users, although it is gener-ally assumed that the costs would be much higher.22 One reason such information is lacking is that these sectors tend not to be shorted during droughts, so as to protect the economy from job losses. Instead, urban drought conser-vation programs, which typically include some rationing, are generally imposed on residential users. Water ration-ing imposes costs on consumers, particularly in terms of
inconvenience. Studies have shown that greater reliance on pricing signals would incur lower costs than “command and control” policies such as outdoor water use restric-tions (Olmstead and Stavins 2009; Mansur and Olmstead 2012).23 Water markets are another important vehicle for avoiding large economic losses in the urban sector. One impetus for launching the 1991 drought water bank, in which the state served as broker between buyers and sellers, was to avoid rationing water supplies to computer chip manufacturers and other water-intensive industries (Carter, Vaux, and Scheuring 1994; Gray 1994).24
A Changing ClimateCalifornia’s economy should also be able to withstand (albeit at some cost) the anticipated reductions in water caused by climate change. Scientists are relatively confi-dent that rising temperatures will reduce the “free” sea-sonal storage provided by the Sierra Nevada snowpack; there is less certainty about whether the climate will also become drier (Cayan et al. 2007). Warming is also likely
Figure 6. Varying costs of farm water cutbacks facilitate water marketing during droughts
SOURCE: Hanak et al. (2011), using the Statewide Agricultural Production Model.
NOTES: Using 2005 crop prices, costs, and technology, this map shows the loss of farm manager earnings and farm profits incurred by the last acre-foot of water lost when supplies are reduced by 5 and 25 percent, reflecting conditions under a mild and severe drought, respectively. The maps show the payment that farmers would be willing to accept as compensation for transferring water, or the price they would be willing to pay for an additional acre-foot of water. The much higher values in coastal areas reflect the prevalence of vineyards, fruits and vegetables, and horticultural crops.
0 50 100 150mi
km0 80 160 240
Marginal cost with 5% water cut (2008 $/af)
$60–$74
$75–$99
$100–$149
$150–$300
Marginal cost with 25% water cut (2008 $/af)
$115–$249
$250–$499
$500–$699
$1800 +
www.ppic.org
Water and the California Economy 11
to increase environmental demands on the water system, requiring additional flows to keep water below reservoirs cool enough for salmon (Hanak and Lund 2012). How-ever, greater “conjunctive” use of surface and ground-water storage facilities—using groundwater basins more actively to bank water for dry years and allowing surface reservoirs to hold more water for seasonal storage—can help mitigate reductions in water availability (Tanaka et al. 2006; Connell-Buck et al. 2012). Again, efficient pric-ing can encourage water savings and water markets can help ensure that enough water goes to higher-value farm, urban, and environmental uses and increase incentives to store groundwater for resale during dry years. As Figure 7 shows, a drier climate would significantly reduce farm water use and crop acreage, but the farm economy could con-tinue to grow by concentrating on crops that use less water and generate higher revenues and profits.25
Our optimism about California’s ability to man-age droughts and water shortages caused by a changing climate depends critically on the continued adoption of tools that improve the economic efficiency of water use. These tools include efficient pricing, water marketing, and groundwater banking, as well as the conservation, recy-cling, and stormwater-capture programs that stretch local supplies. As we discuss below, California must continue its progress on these fronts.
Catastrophic Supply Disruptions California is earthquake-prone, and many parts of its water system are vulnerable to catastrophic supply disrup-tions. The U.S. Geological Survey predicts a 99 percent likelihood of a major earthquake (greater than 6.7 mag-nitude on the Richter scale) in the southern half of the state within the next three decades; the risk is only slightly lower (97%) in northern California (Field et al. 2008). Not all major earthquakes will affect water infrastructure, but some could cause major damage.
A particularly vulnerable area is the Sacramento–San Joaquin Delta, which serves as the conveyance hub for roughly 30 percent of all water supplies in the San Francisco Bay Area, the San Joaquin Valley, and Southern California
(Lund et al. 2010). Pumps at the southern edge of the Delta draw water supplies from northern and eastern parts of the state through the Delta’s channels. Fragile levees separate these channels from islands that lie well below sea level. A large earthquake along one of five major faults could cause massive levee failures (URS Corporation and Jack R. Ben-jamin & Associates 2009; Mount and Twiss 2005). If a levee failure were to occur when there is a limited amount of fresh water in the Delta’s watershed (in late summer or autumn or any time during a prolonged drought), the empty space above sunken islands would draw in salt water from the San Francisco Bay, potentially ending water exports for up to two years.
If water agencies do not have contingency plans in place to access alternative supplies, the economic costs could be substantial. A state-funded analysis estimates the cost to water users of such a failure would fall in the range of $8 bil-lion to $16 billion, depending on the season and the length of time it takes to restore water deliveries (URS Corporation and Jack R. Benjamin & Associates 2007). If such an outage occurred after a prolonged drought had depleted storage reserves, the costs could be much higher. Over the past
Figure 7. California agriculture can continue to prosper, even if climate change substantially reduces future water supplies
SOURCE: Medellín-Azuara et al. (2012).
NOTES: The figure shows changes by 2050 relative to baseline conditions in 2005, assuming historical hydrology and a warm-dry form of climate change, with average 2.3°C increase in temperature and 3 percent reduction in precipitation by 2050 in the Central Valley. The model endogenously estimates cropping patterns resulting from changing climate, technology, urbanization, and agricultural commodity market conditions and assumes water marketing will allocate water resources to the highest value uses.
-40
-30
-20
-10
0
10
20
30
40
50
Perc
enta
ge c
hang
e re
lativ
e to
200
5 co
nditi
ons
Farm revenues
Historical climate
Farm water useIrrigated acreage
-7
-26
-8
-29
Warm-dry climate change
42
26
www.ppic.org
Water and the California Economy12
few years, the Department of Water Resources and water exporters have been developing emergency responses to reduce the worst-case outage to no more than six months. But more must be done to protect the most vulnerable urban agencies—for example, some communities in Alameda and Ventura Counties rely almost entirely on Delta exports. The costs of a catastrophic urban outage would be very high for these local economies, including risks for public safety (e.g., there would be less ability to fight fires).
Earthquakes and other natural disasters could also disrupt local supply networks throughout the state. Follow-ing the 1989 Loma Prieta earthquake, the East Bay Munici-pal Utilities District (EBMUD), which supplies water to much of Alameda and Contra Costa Counties, estimated that earthquake-related supply interruptions could cost the local economy as much as $3 billion (East Bay Municipal Utilities District n.d.). A more recent investigation of San Francisco’s water system, which also supplies most of the peninsula communities to the south, found that it is highly vulnerable to interruption for several months or more in the event of an earthquake (Brozović, Sunding, and Zilberman 2007). The economic risks are greatest when urban systems rely heavily on a single source of vulnerable supplies, as do San Francisco and the peninsula as well as portions of Alameda, Contra Costa, and Ventura Counties. Steps that could reduce risk include seismic upgrading (already completed for EBMUD and now under way in San Francisco’s system), diversifying supply sources, and build-ing connections among different utilities so that they can share supplies when one source is interrupted. For example, the new connection between the Contra Costa Water Dis-trict and EBMUD systems is a valuable risk-reduction tool against catastrophic disruptions in either system.
Local and regional water utilities have made significant progress in diversifying water sources over the past two decades, and these utilities have also been heavily invest-ing in local infrastructure upgrades (see local investment expenditures in the table on p. 4). However, the risk to water infrastructure posed by earthquakes and other cata-strophic events, such as large floods, has generally received insufficient attention.
Economically Unreliable Supplies The short-term economic effects of catastrophic supply outages are likely to end when damaged infrastructure is restored or replaced. However, continuing uncertain-ties over the “economic reliability” of water supplies can pose longer-term risks to the state’s economy by under-mining the ability to finance infrastructure investments and discouraging business investments that contribute to economic growth.26 Some uncertainty about water supplies is inevitable, given California’s variable climate. But too much uncertainty can stymie investments.
Uncertainty over the returns on infrastructure invest-ments—which are usually financed over long periods—is a potential obstacle to addressing Delta water supply problems.27 Water agencies relying on Delta exports have been pursuing a proposal to build an alternative convey-ance channel that would draw water around or under Delta channels. This solution would reduce vulnerability to levee failures and could improve conditions for numer-ous endangered and threatened native fish species that depend on the Delta (Bay Delta Conservation Plan 2010). Yet there is still uncertainty about the volume of supplies that can be sustainably exported from the Delta over the long term, given the state of the Delta ecosystem and the likelihood that environmental regulations will restrict export volumes if native species do not thrive. Without some predictable range of export volumes, it will be dif-ficult for water agencies to finance new infrastructure and associated ecosystem investments. As we discuss below, it is not necessary to guarantee the export volumes that were available in the past in order to provide a sound basis for conveyance investments. Moreover, there are economically feasible—albeit costly—alternatives to new conveyance, including more intensive water conservation, local supply development (e.g., recycling wastewater and harvesting stormwater),28 and water marketing within the areas dependent on Delta exports. But until this situation is resolved, areas dependent on the Delta will be economi-cally vulnerable.
More generally, large uncertainties about future water supplies have the potential to limit non-farm business
www.ppic.org
Water and the California Economy 13
investment and residential growth. This issue is central to legislation adopted in 2001—“show me the water” laws that require cities and counties to obtain assurances from local water utilities that adequate long-term supplies are avail-able before approving new development.29 There is little evidence that California has lost businesses in the past because of water supply shortages, in large part because
local and regional water agencies have done a good job of mitigating shortages.30 California has faced very little development pressure since the onset of the recession and the collapse of the real estate market in late 2007. But ques-tions regarding the adequacy of long-term supplies will resurface when growth resumes, particularly in parts of the San Francisco Bay Area and Southern California that depend on unreliable Delta exports. There are numerous ways to mitigate this problem: water transfers, conserva-tion (including “offsets,” whereby new development can move forward by paying for conservation investments on existing properties), and expanded use of local supplies. Water agencies will need to work collaboratively with local governments and the business community to make these solutions available, because it is neither reasonable nor cost-effective to expect businesses and developers to resolve the problem on their own.
Declining Groundwater Basins Groundwater is a major asset in California. It accounts for roughly a third of agricultural and urban water use statewide; it is especially important in dry years, and it is a critical resource in some areas (California Department of Water Resources 2009). In many parts of rural California, groundwater use is not managed as effectively as it should be. The absence of effective regulation has resulted in long-term overdraft (when more water is pumped out
than is replenished) and contamination from farming (particularly nitrates from excess fertilizer and manure use, which seep into the aquifers). These problems are particularly acute in two important agricultural areas where groundwater also makes up a very large share of total water use: the Tulare Basin (covering large parts of Fresno, Kern, Tulare, and Kings Counties), where half of all water used is pumped from the ground; and the Salinas Basin (Monterey County), where this share exceeds 80 percent (U.S. Geological Survey 2009; Monterey County Water Resources Agency 2001; California Department of Water Resources 2009). In both areas, overdraft threat-ens the long-term viability of agricultural production; in the Tulare Basin, overdraft also threatens the reliability of water supplies for new development (Hanak 2010). In addition, the nitrate pollution in these areas raises the costs of drinking water treatment and poses public health risks for small rural communities that cannot afford treat-ment (Moore et al. 2011; Harter et al. 2012).
Increasing Risk of Catastrophic Floods California is also a flood-prone land. Much of the Central Valley was once a seasonal floodplain. Although invest-ments in reservoirs, levees, and bypasses have reduced the frequency of flooding, many urban and suburban commu-nities still face high risk. Indeed, current federal and state policies increase economic risk in floodplains by allowing new development without restrictions once an area is con-sidered safe from a relatively low “100-year” or “200-year” level of flood protection. (A 100-year flood has a 1 percent chance of occurring in any given year, or a 26 percent chance of occurring during the span of a 30-year mortgage. In the Netherlands, most urbanized areas are required to have protection against a “10,000-year flood,” which has only a 0.01 percent chance of occurring in any given year.) In 2000, about 5 percent of all California households (and many businesses) lacked even the minimal 100-year level of protection, and another 12.5 percent of households were located in a “500-year” floodplain, an area susceptible to floods that have a 0.2 percent or more chance of occurring in any given year (Hanak et al. 2011). A large flood in the
Large uncertainties about future water supplies have the potential to limit non-farm business
investment and residential growth.
www.ppic.org
Water and the California Economy14
Sacramento area would put thousands of lives at risk and destroy tens of billions of dollars in property.31 Climate warming could increase the risks of inland flooding: with faster snowmelt and more precipitation falling as rain than snow, it will become more challenging to manage winter flooding (Willis et al. 2011).32
Climate change is also projected to increase flood risk in coastal areas as sea levels rise. Sea level along California’s coast has risen roughly one foot since the mid-1800s (Cali-fornia Energy Commission 2009). It could rise another foot or more by the middle of this century, and three to four-and-a-half feet by 2100 (Vermeer and Rahmstorf 2009). Higher storm surges will accompany rising sea levels, likely increas-ing both the frequency and severity of coastal flooding.
In 2000, roughly a quarter-million residents, 2,000 miles of road and rail, and $50 billion in building assets (2000 dollars) were within a 100-year coastal floodplain; the risk exposure would roughly double with four-and-a-half feet of sea level rise and no additional growth in coastal population or structures (Heberger et al. 2009). The most vulnerable region is the San Francisco Bay Area, because so much development has occurred in low-lying areas along the bay. Sea level rise also poses risks to the tourism and recreation-related economy along California’s ocean coastline (valued at $11 billion per year in 2004), as many beaches could shrink or disappear (Hanak and Moreno 2012). Adaptation measures are costly and imperfect: sea walls and other physical barriers that protect oceanfront properties and infrastructure can cost more than $50 mil-lion per linear mile, and these barriers can restrict public access and destroy beaches and wetlands (Heberger et al. 2009; Hanak and Moreno 2012).33 As with inland flooding, the costs of coastal flooding (and flood prevention) could weigh heavily on some of the state’s regional economies.
Priorities for Action
Many of the economic vulnerabilities described above reflect physical drivers that are beyond the direct control of water managers, including droughts, floods, seismicity,
and climate change. But smarter management and invest-ments can make California’s economy more resilient and robust in the face of such threats. Below, we propose seven priorities for making the state’s water system more flexible, responsive, and capable of supporting a strong 21st-century economy.
1. Modernize water measurement and pricingCalifornia needs to modernize its systems for measuring and tracking water supplies and for sending the right price signals to water users. Outside observers are frequently amazed by how antiquated these systems are in much of the state. For example, the water use estimates presented above (Figures 3, 4, and 5) are only rough approximations because the state does not record most groundwater use, even though groundwater makes up roughly a third of average total use. And though there has been some progress since the early 1990s, water use is still unmetered—and not priced by volume—in some agricultural and urban dis-tricts.34 In areas where water is priced volumetrically, rate structures rarely manage scarcity conditions effectively, by charging higher rates when supplies are tight. As a result, when utilities need to encourage customers to reduce water use during droughts, they often lose money because they cannot cover fixed costs (which are generally the majority of total costs). The frequent result is “catch-up” rate increases that send confusing messages to water users: instead of being charged more up front as part of a proactive, trans-parent drought management policy, customers are charged more after they have successfully saved water.35
In the 21st-century economy, water will become increasingly scarce—and increasingly valuable. It is hard to make sound business and policy decisions about a scarce resource without measuring and pricing it cor-rectly. There has been some recent progress—for instance, counties must now report groundwater levels (but not withdrawals) to the state, and all urban utilities will be required to bill by usage by 2024—but more progress is needed. In the agricultural sector, priorities include metering and billing surface water by volumes used and measuring ground-water extraction. To bypass the
www.ppic.org
Water and the California Economy 15
political obstacles and costs of directly measuring extraction from farmers’ wells, the state should pursue the use of satellite data to provide reasonable and consis-tent estimates of net farm water use.36 Both agricultural and urban water suppliers should make it a priority to develop rate structures that provide incentives for conservation while enabling the suppliers to cover their costs. Such structures should anticipate the need to raise rates during droughts, when extraordinary conservation is needed, and include a longer-term schedule of planned rate increases that simultaneously encourage reductions in water use and ensure fiscal stability.
2. Address the unreliability of Delta water suppliesHighly unreliable water supplies can pose significant long-term threats to California’s economy by limiting new growth and investment. The biggest single source of unreliability in California today is the Sacramento–San Joaquin Delta, given its importance as a supply source for large parts of the state. Steps must be taken now to reduce supply risk in the near term and into the future. In the near term, efforts are needed to build more resil-iency into the system to reduce the costs of a catastrophic supply disruption. For the longer term, it is essential to make a decision about new conveyance.
Past PPIC research has shown that a peripheral canal would be the best option to meet the “coequal goals” of water supply reliability and ecosystem health (Lund et al. 2010).37 Today, options have multiplied—from a canal to a tunnel to two tunnels—and cost estimates have increased significantly. In 2008, official estimates for new above-ground conveyance ranged from $4 billion to $9 billion (California Department of Water Resources 2008). By 2012, as attention has shifted to building tunnels, cost estimates have increased to roughly $14 billion—not including the costs of financing and added operational expenses.38 With cost estimates growing, the question arises: Are the benefits of new conveyance great enough to justify the expense?
The answer depends partly on the environmen-tal benefits this solution could provide. Routing water
exports under or around the Delta would make it possible to manage Delta flows in ways that more closely approxi-mate the natural, more variable patterns that existed before the large water export projects came online (Moyle and Bennett 2008; Fleenor et al. 2010). Such changes, along with expanded seasonal floodplain and tidal marsh habitat and other improvements, could make the Delta more hos-pitable for native species now in distress. Ecosystem invest-ments could constitute a significant share of the total costs
of a new management plan for the Delta—the Bay Delta Conservation Plan estimates that environmental mitiga-tion, including capital and operating costs, could range from $4.7 to $6.2 billion (BDCP Steering Committee 2010). Water exporters would be expected to bear some of these costs, along with the full costs of new conveyance.
New conveyance would provide more reliable, higher-quality exports from the Delta—but some water users may find it too costly.39 High-level state leadership will be essential to broker any new conveyance deal, because the various stakeholders are having difficulty finding common ground.
In any event, it will take at least a decade before any new conveyance comes online. This means that agencies will need to pursue alternative strategies to make their systems more resilient in the face of Delta pumping shut-downs and regulatory cutbacks. These alternatives include expanding reliance on local water sources (through conser-vation, recycling, desalination, stormwater capture) and water marketing.
Past PPIC research has also shown that with planning and appropriate investments in alternatives, California’s urban economies could adjust to taking far less water—or even no water at all—from the Delta.40 Large long-term losses in Delta exports would significantly reshape San
Smarter water management and investments can make California’s economy more resilient
and robust in the face of various threats.
www.ppic.org
Water and the California Economy16
Joaquin Valley agriculture, which uses roughly three-quarters of total exports. Farmers would likely reduce production of lower-value, water-intensive crops such as alfalfa and irrigated pasture. Although the losses from reduced agricultural production would not be sig-nificant relative to the state’s $1.9 trillion economy, they would carry greater weight for the San Joaquin Valley economy.41
3. Strengthen institutions and infrastructure for water marketsWater marketing is an essential component in the more flexible water management approach needed to support the 21st-century economy. It can help reduce the costs of temporary supply shortages and facilitate shifts in supply in line with longer-term shifts in economic activity. Cali-fornia’s water market has advanced significantly since it took off in the early 1990s, when the state was in the midst of a six-year drought (Figure 8). The market continued to grow when the rains returned, and by the early 2000s the annual volume of water committed for sale or lease was about 2 million acre-feet, with roughly 1.4 million acre-feet actually moving between parties in any given year. Over time, the share of long-term and permanent sales contracts—which generally involve more complex negotiations—has increased from a small fraction to well over half of all volumes traded, a sign that the market is maturing.
Despite these positive market developments, there is evidence of an overall weakening in market momentum. Overall trading volumes have leveled off over the past decade, despite a multiyear drought in the late 2000s that might have been expected to increase trading.42
Water market roadblocks stem from two primary weaknesses: insufficient infrastructure and cumbersome approval procedures. Historically, California’s sophisticated supply infrastructure has made it possible to transfer water either directly or through exchanges across most demand and supply centers. However, the Delta is an important con-veyance hub for north-to-south and east-to-west transfers, and pumping restrictions since late 2007 have impeded
movements in both directions. New east-west conveyance within the San Joaquin Valley could help compensate for the reduced pumping capacity in the Delta, facilitating transfers between relatively water-rich eastern areas and water-scarce farmland and cities to the west and the south (MacEwan, Howitt, and Lund 2010).
Approvals for water transfers have also become more difficult, raising the transaction costs for parties wishing to engage in trading. California law appropriately seeks to protect the environment and other “third parties” from “injury”—the negative physical consequences that transfers may have on water quantity or quality for other users.43 Over time, transfers have been subject to environ-mental restrictions beyond the requirement of no injury to environmental flow conditions.44 In 2009, uncertainties over these new restrictions, combined with the inability to move water through the Delta in the spring, depressed drought water bank activity. Fewer than 80,000 acre-feet were transferred, whereas the goal was several hundred thousand acre-feet (Hanak 2011). Moreover, because state law generally does not regulate groundwater, many local governments have enacted their own “no injury” restric-tions on groundwater-related transfers, and these restric-tions tend to be overly broad (Hanak 2003, 2011). Local objections also arise to transfers involving land fallowing, given the potential negative effects that reduced farming activity might have on local economies. Such effects are not proscribed under state law, which generally views them as a natural consequence of economic shifts—much like the opening or closing of a manufacturing plant, which affects neighboring businesses and property values for better or worse.45 Finally, water market development is hindered by the fragmentation of water management; different types of water rights and contracts are subject to different types of approval.46
But perhaps the most glaring institutional problem is the lack of clear leadership at the top. If water marketing has foundered in recent years, it is because no one is in charge of making sure that it is working. Strengthening the water market needs to become a top state priority again, as it was when the state launched the 1991 drought water bank, or
www.ppic.org
Water and the California Economy 17
when state and federal leaders brokered a set of large trans-fers of Colorado River water in the early 2000s. New mecha-nisms are needed to clarify and streamline the approval pro-cess, particularly for medium-term agreements that create flexibility to transfer water quickly in the event of shortages. To reduce permitting delays, we recommend programmatic environmental impact reviews (EIRs) for river and stream systems most likely to sell water. These EIRs would exam-ine the potential third-party impacts of transfers under a variety of hydrologic conditions, enabling the preapproval of a range of transfer volumes, depending on market condi-tions. The EIRs would assess negative effects on both surface and groundwater (for which mitigation would be required), and they would flag potential problems to the local economy in source regions. Consistent with general economic policy practice, mitigation for these local economic effects would continue to be optional, although it would be encouraged for large, long-term transactions.47 State water leaders must also assess infrastructure gaps, such as east-west conveyance in the San Joaquin Valley and the Delta, and determine where it would be cost-effective to improve linkages.
4. Improve local groundwater management Groundwater basins are both a vital source of everyday water supply and a cost-effective way to bank water for dry
years, when water is more valuable. As California’s climate becomes warmer and the snowpack shrinks, storing water in groundwater basins will become even more important. But basin management needs to be improved to make the best use of this resource. Unlike most other western states, California relies on local users to manage groundwater. Only a few areas—principally urbanized parts of Southern California and the Silicon Valley—have established local management entities that exercise direct control over this resource through adjudicated basins or special manage-ment districts that regulate pumping volumes and charge for water (Blomquist 1992).
Water users in some other parts of the state have improved local basin management. But this oversight generally continues to be voluntary and has difficulty preventing overdraft unless local users either have ample access to imported surface water for recharging the basin or can agree to limit pumping to sustainable levels (Nelson 2011). Voluntary arrangements can also impede effective basin storage operations, particularly when the goal is to store water for parties located outside the basin. Effective groundwater banking has developed in places where local institutions do what any good bank must do: carefully monitor deposits and withdrawals (Thomas 2001; Hanak 2003).48 Groundwater banks must also have mechanisms
Figure 8. California’s water market leveled off in the early 2000s
SOURCE: Updated from Hanak et al. (2011).
NOTES: The figure shows actual flows under short- and long-term lease contracts (yellow and red bars), estimated flows under permanent sale contracts (green bars), and the additional volumes committed under long-term and permanent contracts that were not transferred in those years (blue bars). The database includes transactions between water districts, federal and state agencies, and private parties that are not members of the same water district or wholesale agency. “Dry years” are those classified as critical or dry for the Sacramento Valley based on the California Cooperative Snow Survey.
0
500
1,000
1,500
2,000
2,500
Wat
er tr
aded
(taf
)
19821986
19841990
19881992
19941998
19962002
20002004
20062008
2010
Contracts:
Dry years
Water committedbut not transferred
Permanent
Long-term
Short-term
www.ppic.org
Water and the California Economy18
to mitigate negative effects of withdrawals on neighboring groundwater uses, including groundwater-dependent eco-systems. Banking is difficult to develop in areas that lack effective groundwater management, because it amounts to depositing money in a bank to which everyone has a key. To increase the potential for banking—and more sustain-able use of groundwater basins—the state should continue to promote stronger local management of groundwater.49 Improvements in the water market will help, because the market provides incentives to store water purchased in wet years for use (or sale) in dry years.
5. Reduce vulnerability to flood riskAnother obvious priority is to protect Californians’ lives, property, and infrastructure from catastrophic flooding. This task cannot be achieved through flood infrastructure investments alone; a major component of risk management is making smart land use decisions that keep people and property out of harm’s way.50 In 2007, California adopted a law that aims to double the federally required level of protection for new development in the Central Valley, providing protection against a 200-year flood (i.e., a 0.5 percent chance of a flood occurring in any given year). The state has also increased investments to address a backlog of flood infrastructure work, thanks to roughly $5 billion in general obligation bonds approved by voters in 2006. Yet these efforts, while important, will not sustainably reduce risk: the 200-year standard is still quite low, it applies only to the Central Valley, and flood frequencies are likely to increase with climate warming and rising sea levels. In addition, flood protection is woefully and chronically underfunded. The system has historically relied on up to 65 percent of its funding through federal cost sharing, but federal funds are both insufficient and declining.
To modernize flood protection, California needs to rely more on reducing vulnerability through better land use decisions, restored wetlands and riparian buf-fer zones, stronger building codes, and expanded use of insurance. Also, local property owners will need to invest more in flood protection, and properties at higher risk should pay higher fees. State and federal agencies should
allocate scarce resources on a cost-effective basis that considers not only on the costs of the investments but also on their value in reducing economic risk (generally areas with more population and economic assets). Finally, the flood protection portfolio needs to include invest-ments that expand “room for the river” (e.g., bypasses and setback levees). Such investments will reduce flood exposure in the areas where people live and work and will provide environmental benefits as well (Hanak et al. 2011). Many of these measures—including risk-based investment decisions and an expanded flood protection portfolio—have been proposed as part of a new flood plan for the Central Valley (California Department of Water Resources 2011). However, the plan does not specify how California will pay the bill, which for the Central Valley alone carries an estimated price tag of $17 billion to meet existing standards of protection.
6. Improve environmental managementEnvironmental regulations play a central role in protecting public health and the health of our watersheds and in mak-ing California a desirable place to live and work. But at pres-ent, the regulatory framework affecting water management entails too much uncertainty, too little attention to system-atic performance outcomes and innovation, and too much piecemeal implementation. One particularly worrisome sign is that populations of native fish species—an important indicator of overall ecosystem health—are declining across the state, despite several decades of well-intentioned efforts and expense (Figure 9). These declines heighten conflicts with other water management goals, because they lead to increasingly tight and costly restrictions on water supply, wastewater, and flood protection projects.
There are no easy fixes for this problem; a century and a half of land and water management in support of human activities has irrevocably altered our aquatic ecosystems, making them less favorable for native species. In the future, climate change and the continuing arrival of inva-sive species—which now dominate many watersheds—will likely compound the challenges of addressing declines of native species. Fortunately, modern ecological thinking
www.ppic.org
Water and the California Economy 19
points in a hopeful direction. The science of “ecosystem reconciliation” seeks to identify and implement water and land management strategies to restore the essential quali-ties of natural ecosystems in which native species once thrived, while acknowledging that restoration of entirely “natural” conditions is impossible and that humans will continue to use the land and waterscapes.51 A central tool in reconciled aquatic ecosystems is the adoption of a more natural flow regime—whereby flows are managed in ways that approximate more natural, variable patterns, albeit with smaller volumes than would exist if humans were not using some of the water (Dudgeon et al. 2006).
Ecosystem reconciliation is a key to more effective environmental management because it shifts the focus from piecemeal regulation to an approach that seeks to improve overall ecosystem function. At present, environmental management is often “siloed,” with each agency and each project addressing particular issues in particular loca-tions—water quality, wetlands, flows, habitat—without an integrated vision of how these actions might contribute to overall improvement of ecological conditions. Coordinated approaches would be much more effective in protecting
native species and would enable us to spend our dollars (and environmental water) more wisely.
Water dedicated to the environment and healthy watersheds contribute significantly to California’s econ-omy, and their importance is likely to increase in this century. It is therefore essential that we assess environmen-tal protection in business terms, just as we do the rest of our water management. This means defining what we aim to achieve, identifying the most cost-effective institutions and mechanisms for arriving at our goals, monitoring and evaluating the results to make sure we are success-ful, and systematically improving the effectiveness of our approaches over time.
7. Develop sustainable fundingImproving the effectiveness of environmental management and water management in general will require sustainable funding. Many parts of California’s water system are on relatively sound financial footing. In particular, local and regional water and wastewater agencies rely primarily on income from ratepayers to cover both operating expenses and the capital costs of infrastructure improvements, and these agencies are generally investing in water infrastruc-ture upgrades at a healthy pace.52 Although they sometimes face public opposition, the agencies’ governing boards are generally able to raise rates to cover necessary expenses.53
In contrast, funding for both flood management and environmental management is inadequate and erratic. Flood protection can no longer rely on insufficient (and declining) federal funding streams; and apart from recent bond funding, which will soon be exhausted, the state has allocated little for flood protection, even though a 2003 court ruling substantially increased the state’s liability for flood damage.54 To improve the integrity of the sys-tem, local contributions—which historically have covered only 10 to 15 percent of flood investments—will need to increase. But this will be politically challenging. Whereas water and wastewater utilities can generally rely on board approval to increase rates, California law requires flood control districts to get approval from two-thirds of the public or at least half of all property owners.55
Figure 9. California’s native fishes are in trouble
SOURCE: Moyle, Katz, and Quiñones (2011).
NOTES: “Extinct” = extirpated from California; “listed” = threatened or endangered under state or federal Endangered Species Acts; “special concern” = in decline and could qualify for listing in the future; “reasonably secure” = widespread and abundant according to current knowledge. N = number of species.
Reasonably secure
Special concern
Listed
Extinct
1989n=115
Perc
enta
ge
90
80
70
60
50
40
30
20
10
100
01995
n=1162010
n=129
7
44
14
50
7
38
18
53
7
22
31
69
www.ppic.org
Water and the California Economy20
Funding environmental management should be a major public policy priority. Some of the costs are already covered by other water system budgets. For example, water users bear the costs of regulatory cutbacks in pumping and diversions; wastewater system ratepayers fund upgrades that reduce harmful discharges; and flood control projects include measures to mitigate their effects on aquatic habitat. But improving ecosystem function also requires investments in habitat, flow modification, and research and experimen-tation. Although some water users now pay into funds to support such efforts, state taxpayers have largely funded these costs through general obligation (GO) bonds, which increased dramatically during the 2000s (Figure 10).56
These investments will need to be more systematic and substantial. There are also legitimate debates over whether taxpayers should continue to fund these expenses or whether they should be borne directly by those who use water, discharge pollutants into water, or develop land in ways that degrade aquatic habitat. The argument for funding by water and land users—for instance, through higher water and wastewater rates and flood control assess-ments—is that these users have not been fully mitigating the effects of their actions on the environment. The argu-ment for taxpayer funding is that these investments benefit the general public and often reflect changing societal demands for environmental amenities. Some members of the group authoring this report leaned more in one direc-tion or the other on this question. But all agreed that it is imperative to identify sustainable funding, because the smooth functioning of the water system as a whole is tied to improving California’s aquatic ecosystems.
We also generally agreed that water users might need to help fund statewide data collection, planning, and analysis. Given the highly decentralized nature of most water management in California, it is essential to under-take high-quality data collection and analysis of the system for the state as a whole. Historically, these efforts have been covered by taxpayers through the state’s general fund. But with a shrinking state budget and many competing priori-ties, water users may need to begin supporting this work through higher water bills.
As part of a water reform package adopted in late 2009, the legislature put the largest water bond to date—more than $11 billion—on the November 2010 ballot (Figure 10). This measure was postponed until November 2012 over concerns that California’s difficult economic and fiscal conditions would lead voters to reject the bond, and there have been renewed discussions about postponing it again or reducing its size to make it more palatable to voters. Passage of this bond would temporarily alleviate some of the funding gaps discussed in this report (for instance, it includes more than $2 billion for Delta ecosystem restora-tion) but would not address gaps in other critical areas such as flood management.
Conclusion
Water lies at the heart of California’s economy and quality of life, and Californians face tremendous water manage-ment challenges. The state’s variable climate subjects it to periodic droughts, and climate change is likely to increase the frequency and severity of these events. The water supply network is also vulnerable to catastrophic inter-ruptions from large earthquakes and floods. Hundreds of
Figure 10. The 2000s saw unprecedented growth in state general obligation bonds for water
SOURCE: Adapted from Hanak et al. (2011), Table 2.9.
NOTES: Values are converted to 2010 dollars using the construction cost index from Engineering News-Record. Past bonds have supported water supply, water quality, flood infrastructure, and ecosystem and open space improvements. The sole failed bond (water supply–oriented) was rejected by voters in November 1990.
Passed
Failed
Pending
0
5
10
15
20
25
30
Wat
er-o
rient
ed s
tate
GO
bon
ds(b
illio
ns 2
010
$)
1970s 1980s 1990s 2000s 2010s
www.ppic.org
Water and the California Economy 21
thousands of residents and billions of dollars in property are exposed to high levels of flood risk, and this risk is likely to increase with warming winters and accelerat-ing sea level rise. California’s aquatic ecosystems—part of what makes the state a desirable place to live and work—are also under severe strain. A quarter of all native fish species—bellwethers of ecosystem health—are currently listed as threatened or endangered under federal and state laws, and more than half are in decline and on their way to becoming listed in the future.
As great as these challenges may seem, they need not limit economic growth and prosperity if we take actions now and in the future to manage water wisely. Califor-nia’s economy is becoming less dependent than in the past on large volumes of water as a production input. Indeed, combined urban and agricultural water use might already have peaked several decades ago, and real state GDP has more than doubled in size since then. Agriculture, which still uses roughly three-fourths of this water, is a small and declining proportion of economic activity, and it still has considerable capacity to adapt to tighter supplies while increasing revenues and profits. California’s growing non-farm business sectors, which create most of the state’s jobs and value added, use relatively little water. Water use efficiency is increasing in all sectors, and the margin for continued efficiency is considerable. Numerous other management tools—water markets to voluntarily reallocate some supplies, more active use of groundwater basins to bank water for dry years, reuse of highly treated waste-water, and capture of stormwater—can also help secure reliable supplies into the foreseeable future.
But to ensure that water does not become a drag on the economy, California must move beyond its business-
as-usual water management practices. The state needs to reduce risk and improve the flexibility and effectiveness of water management decisions. We have outlined seven priorities:
• Modernize water measurement and pricing• Reduce vulnerability to water supply interruptions• Strengthen water markets• Improve groundwater management• Reduce exposure to catastrophic flood risk• Improve environmental management• Develop more reliable funding
Many of these changes will require strong, proactive state leadership. But state policymakers do not make deci-sions in a vacuum, and stakeholders can play a vital role by engaging in the policy process and expressing their concerns. One group of stakeholders that has been largely absent from recent water policy discussions is the Cali-fornia business community. Business leaders played a major role in supporting infrastructure investments for flood protection and water supply in the early to mid-20th century (Hanak et al. 2011; Hundley 2001; Kelley 1989; Pisani 1984). And in the early 1990s, when California faced serious problems from drought and declining native spe-cies in the Delta, business groups engaged constructively in the development of the state’s water market and a more sustainable Delta water policy (Gray 1996). More recently, the business community helped to reform the funding sys-tem in another area that lacked adequate support—school construction.57 The time has come for business leaders to join with others in promoting water reform in California. Water problems need not limit our economic growth and prosperity; if they do, we have only ourselves to blame.
A technical appendix to this report is available on the PPIC website: www.ppic.org/content/pubs/other/512EHR_appendix.pdf
www.ppic.org
Water and the California Economy22
Notes
1 On the challenges of putting an economic value on “ecosystem services,” see National Research Council (2005) and Brauman et al. (2007). For research showing that California metropolitan areas benefit from high amenity values as well as high produc-tivity, see Albouy (2009).
2 Value added for the water system was estimated by applying the ratios of value added to gross revenues for private sector water and wastewater utilities (0.7) and for state and local public enterprises (0.42) for 2007 and 2009 from IMPLAN, a com-monly used model to analyze regional economies (www.implan .com), and multiplying this by total estimated expenditures in the table on p. 4). These figures exclude the “multiplier” effects of water system spending on the economy. The estimated multipli-ers for value added are 1.7 and 2.3 for private utilities and public enterprises, respectively.
3 For the history of this development, see Hundley (2001) and Hanak et al. (2011).
4 Estimates of agriculture’s share of employment are from the IMPLAN model for 2007 and 2009 (roughly 2% for crops and livestock and roughly 3% including agro-processing) and the U.S. Census (roughly 3% for crops and livestock and 4% includ-ing agro-processing).
5 Estimates of agriculture’s share of state GDP are from the U.S. Bureau of Economic Analysis (www.bea.gov/regional/gsp) and the IMPLAN model. As with other sectors, spending in agri-culture and agro-processing creates additional value through multiplier effects. In the late 2000s, the value added multipliers for primary production and related manufacturing were roughly 2 and 3, respectively.
6 Between 1998 and 2005, primary agricultural production generated $565 in value-added per acre-foot (af) of water used (30.2 million acre-feet [maf]). The corresponding figure for all other sectors of the economy combined was at least $195,000/af (8.3 maf of total urban use). Counting only water used by the nonresidential sectors (2.6 maf), that figure jumps to $628,000/af. (Author calculations using water use data from California Department of Water Resources and GDP data from the U.S. Bureau of Economic Analysis, values in 2009 dollars.)
7 Author calculations using water use data from California Department of Water Resources (see Figure 4) and agricultural GDP data from the U.S. Bureau of Economic Analysis. See also Rich (2009).
8 Yield growth estimates are from Brunke, Howitt, and Sumner (2005), who estimated annual increases of 1.42 percent over the four preceding decades. Crop share estimates are from County Agricultural Commissioner Reports, taking averages for the
periods 1980–84 and 2004–08. Average acreage totals (including some non-irrigated cropland) were 10.6 million in 1980–84 and 10.4 million in 2004–08.
9 Using U.S. Department of Agriculture estimates of output, revenues, and irrigation water use, Christian-Smith, Levy, and Gleick (2011) estimate that average crop revenues increased from an average of $980/af in the three years preceding the drought (2004–06) to $1,110/af (2010 dollars) in 2009, the third year of the drought. Some of this increase reflects a commodity price boom in the late 2000s, but farmers also continued to shift away from lower-value crops. Between 2001 and 2010, drip irrigation increased from 33 to 38 percent of crop acreage, up from 15 percent in 1991 (Tindula, Orang, and Snyder 2011).
10 The recessionary economy also dampened urban demand.
11 “Cost-effective” in this context generally refers to costs per acre-foot that are at or below the costs of alternative new sup-plies. Some conservation measures can directly save money for end-users, particularly if they also reduce energy costs (Cooley et al. 2010).
12 The low estimate for Australia is from www.nwc.gov.au/www/html/2765-national-performance-report-2008-09---urban-water-utilities.asp?intSiteID=1. Urban water use in Australia declined further in recent years in response to a prolonged drought lasting most of the 2000s.
13 In 2005, roughly 25 percent of all industrial water and 30 percent of all water used for large commercial and institutional landscapes was self-supplied. The shares were much lower for residential uses (7%) and other commercial and institutional uses (4%). (Author estimates using data supplied by the Califor-nia Department of Water Resources.)
14 Water use accounts for 19 percent of total electricity use and 32 percent of non–power plant natural gas in California (Cali-fornia Energy Commission 2005). Roughly three-quarters of the electricity and nearly all of the natural gas are consumed by end users (water heating, chilling water and ice, in-building and agricultural pumps, and industrial processes).
15 For overviews see Freeman (1995), Wilson and Carpenter (1999), Loomis (2000), Boyer and Polasky (2004), and Birol, Karousakis, and Koundouri (2006).
16 Ward, Roach, and Henderson (1996) found that the marginal value of water for recreation in ten Central Valley reservoirs varied from $6/af to more than $600/af (1994 dollars), with other reservoirs falling in a range of $20/af to nearly $130/af, depend-ing on proximity to population centers, bank slope conditions, size of the recreation pool, and other factors affecting their attractiveness for recreational use. The comparable marginal values for agricultural water within the Central Valley (based on the price farmers required to sell their water) ranged from $55/af
to $200/af. Creel and Loomis (1992) estimated that water in San Joaquin Valley wetlands was worth about $300/af (1989 dollars) for waterfowl hunting, fishing, and wildlife viewing, more than twice the value paid to farmers for water sold during the 1991 drought water bank. Neither study considered the additional value of these recreational water resources to people who value the sites but never visit them.
17 Of course, this water quality benefit also comes with the sig-nificant environmental cost of damming the Hetch Hetchy Val-ley in Yosemite National Park to create a water storage reservoir for San Francisco.
18 This is one of the more difficult types of value to measure, because it relies on hypothetical survey questions rather than direct observations of how much people are willing to pay for healthy watersheds (e.g., through higher expenditures on recre-ation or higher property values). Such survey-based studies tend to find that most residents do value endangered species and the existence value of healthy watersheds, although the estimates vary widely. Evidence from the energy sector may provide useful additional insights into the value residents place on the environ-ment for its own sake. Studies have found that people are willing to pay more for “green” energy, which reduces greenhouse gas emissions, even though it provides no immediate or direct ben-efit to them (e.g., Kotchen and Moore 2007; Kotchen 2010).
19 Annual losses in net agricultural revenues were estimated at $14.5 million to $38 million, depending on the extent of water marketing (which can lower agricultural losses). Environmental benefits included $45 million in increased value of recreation, plus additional benefits from improved water quality for down-stream urban and agricultural users and nonuse value from the restoration of the river (Hanemann 2005).
20 See Hanak et al. (2011), ch. 5, for a discussion of the negative effects of dams on habitat for salmon and steelhead trout.
21 Christian-Smith, Levy, and Gleick (2011) describe farmer responses to the recent drought using a combination of these strategies and water transfers.
22 California Urban Water Agencies (1991) reports the results of an industry opinion survey conducted in late 1990 (several years into a major drought) in which respondents were asked to envisage the costs of hypothetical cuts of 15 and 30 percent of supplies. Respondents estimated that with 30 percent cuts, over 5 percent of the labor force in the surveyed industry groups would be laid off. The industries most susceptible to layoffs were computer and electronic component manufacturers in Northern California. The implied marginal income losses from 15 to 30 percent cuts ranged from $4,850/af for the refining industry to over $640,000/af for the soaps and cleansers industry.
23 Pricing policies reduce costs to consumers because they give water users more flexibility to decide when and where they want
to reduce water use, depending on their specific conditions. Providing consumers with additional information, such as how much water they are using compared with other households, can further augment conservation, especially among high water users (Ferraro and Price 2011).
24 Since the early 1990s, high tech manufacturing has largely moved to lower cost locations domestically and overseas.
25 Harou et al. (2010) analyze the long-term economic effects of much drier conditions, corresponding to the severe multi-decade droughts California experienced between 890 and 1350 AD. The costs of adjustment would be higher (roughly $3 billion per year by 2020 and more over time with sustained population growth) but still small relative to the size of the state’s economy.
26 See Hashimoto, Stedinger, and Loucks (1982) and Vogel and Bolognese (1995) for a discussion of the concepts of reliability, resiliency, and vulnerability related to water supply. Reliability refers to the likelihood that a system will fail to supply planned volumes, resiliency to the speed with which it can recover from a failure, and vulnerability to the severity of the consequences of failure. Lund, Jenkins, and Kalman (1998) extend these ideas in the context of a broader risk-based view.
27 Typically, infrastructure bonds are repaid over 20 to 40 years, sometimes even longer.
28 Stormwater harvesting can simultaneously reduce pollution discharges and increase usable water supplies (Cutter et al., 2008; Garrison et al., 2009).
29 Hanak (2010) finds that the laws are generally being followed and that many utilities are considering adequacy over a longer time horizon than the 20-year minimum required by statute.
30 More generally, California’s economy has created jobs and new businesses on pace with the national average, and roughly equivalent numbers of businesses and jobs move into and out of the state every year (Kolko 2010). Of course, the lack of evidence that water supply unreliability has slowed economic growth in California is not proof that it has not done so. It is difficult to investigate such “counterfactuals” given the many confounding factors that influence regional economic growth (Kolko, Neu-mark, and Cuellar-Mejia 2011).
31 In the area managed by the Sacramento Area Flood Control Agency (SAFCA)—the City of Sacramento and part of Sacra-mento County—property losses are projected to be close to $20 billion in the event of flooding in 2019 (Sacramento Area Flood Control Agency 2008) and many other communities (including West Sacramento, Yuba City, Marysville, and the surrounding areas) are at high risk of flooding at the same time. Ongoing efforts to upgrade SAFCA levees could reduce the likelihood of flooding from about 1.5 percent per year to about 0.5 percent per year (www.safca.org). But Sacramento will still face large
residual risks (defined as damage X likelihood) of more than $90 million per year. Moreover, in some low-lying areas such as Natomas, levee failures could still put many lives at risk.
32 This will be a greater problem if California experiences a wet form of climate warming (Das et al. 2011).
33 Heberger et al. (2009) estimate that another 800 miles of seawalls and levees would be needed to protect against the added flood risk from 55 inches of sea level rise, in addition to upgrades of existing armoring).
34 The lack of metering is still an issue for agricultural districts that are not part of the federally run Central Valley Project or state-run State Water Project and also for some urban districts in the Central Valley.
35 In principle, price increases could either increase or decrease utilities’ total revenues. But at current prices, urban water demand decreases by less than 1 percent for every 1 percent price increase, so price increases will raise utility revenues.
36 Advances in the interpretation of satellite imagery are facili-tating crop water use estimation and estimation of groundwater basin depletion across the western United States. For informa-tion on the METRIC program used in many applications, see www.idwr.idaho.gov/GeographicInfo/METRIC/et.htm. For information on the Sebal North America, Inc., program, see www.sebal.us/. See also MacEwan et al. (2010).
37 These coequal goals were proposed by the Governor’s Delta Vision Task Force in 2007 and codified into law in the Delta Reform Act of 2009.
38 In 2010, the mid-range capital cost estimate for two tunnels with a combined capacity of 15,000 cubic feet per second had increased to nearly $13 billion, with additional expenditures required to cover operating costs (BDCP Steering Committee 2010). In February 2012, the Department of Water Resources reported that the estimated capital costs for the two tunnels had increased to roughly $14 billion to accommodate engineering concerns, with further cost increases possible (Weiser 2012). Some alternatives, such as a single tunnel, could reduce costs.
39 Because water tapped upstream of the Delta is less saline, it needs less treatment for urban uses and causes less long-term damage to croplands (Chen et al. 2010; Medellín-Azuara et al. 2008).
40 Lund et al. (2010) estimate that the long-term annualized cost to the California economy in the mid-21st century of a planned end to all exports would range between $1.5 billion and $2.5 billion (2008 dollars). These costs would be lower if California achieves long-term urban water conservation, but they could be higher with a warm-dry form of climate change (Hanak et al. 2011). As long as water users reduce lower value water-using
activities first, the initial reductions in exports are far less costly than more severe reductions (Tanaka et al. 2011). To determine which strategy is best for the economy, the net costs of new con-veyance need to be compared to the net costs of implementing alternatives with reduced exports.
41 Based on the model used in Howitt, Medellín-Azuara, and MacEwan (2011) (2005–06 conditions, reported in 2006 dollars), we estimate that ending all exports would translate to a loss of 35 percent of agricultural surface water (3.6 million acre-feet) in the greater San Joaquin Valley (Calaveras, Contra Costa, Fresno, Kern, Kings, Madera, Mariposa, Merced, San Joaquin, Stanislaus, Tulare, and Tuolumne Counties). This would reduce cropland in the region by 11 to 17 percent (475,000 to 784,000 acres) and annual crop revenues by 6 to 10 percent ($700 million to $1,200 million). Total regional revenues (including multiplier effects) would decline by $1,500 million to $2,600 million per year, and total value-added revenues by $925 million to $1,600 million. Direct agricultural jobs would decline by 5,700 to 9,800 (2 to 4%), and total jobs (including multiplier effects) by 16,000 to 27,400. The total losses in employment, revenues, and value added amount to roughly 1 percent of regional economic activity; the share of losses would be higher in some counties. The lower end of the range corresponds to maximum capac-ity groundwater pumping, and the higher end to zero addi-tional pumping. The true effect likely lies within these bounds: although farmers would increase pumping somewhat, it is not sustainable over the long run to pump at maximum capacity. Preliminary analysis suggests that farmers could continue to meet the fodder requirements of the region’s large dairy herds, although the cost of corn silage would increase substantially in some areas.
42 Between 1990 and 2001, Hanak (2005) found that drought years were associated with significantly higher transfers after controlling for water allocations, crop prices, and other factors.
43 For instance, selling water to a downstream user can injure aquatic species or other water users by altering the flows within a river or stream.
44 For instance, under the 2009 drought water bank program operated by the Department of Water Resources, fallowing of rice fields was restricted to protect the habitat of the giant garter snake, a listed species that now depends on artificial wetlands created by irrigation water. Use of diesel pumps for ground-water-substitution transfer was also restricted because it was deemed in violation of Clean Air Act rules, from which farm-ers are normally exempt when operating pumps for their own activities.
45 State law does require public hearings if a local agency wishes to transfer water made available through fallowing and the volume exceeds 20 percent of the agency’s water supplies (Water Code §1745.05).
www.ppic.org
Water and the California Economy 25
46 Current rules heavily favor transfers between agencies within the same large project (Central Valley Project, State Water Project, Colorado River), because these transfers may be accom-plished without review by the State Water Resources Control Board (Gray 1996). This incentive can deter out-of-project trans-fers to potential buyers who may value the water more than the competing in-project transferees.
47 Two farm-to-city transfers of Colorado River water have established local mitigation funds that can serve as potential models: The transfer from the Imperial Irrigation District to the San Diego County Water Authority has set aside $40 million for socioeconomic mitigation, and the transfer from the Palo Verde Irrigation District to the Metropolitan Water District of South-ern California has set aside $6 million (now over $7 million with accumulated interest) (Hanak et al. 2011).
48 As an example, between 1992 and 2006 the Metropolitan Water District of Southern California (MWDSC) stored nearly one million acre-feet in groundwater banks outside its service area (Kern County and the Mojave Basin in Riverside and San Bernardino Counties). During the recent drought (2007–09) it withdrew close to 500,000 acre-feet from these banks. The Mojave Basin is adjudicated, and the Kern County banks each have monitoring and mitigation systems. MWDSC and its mem-ber agencies have also developed groundwater storage within the MWDSC service area.
49 See Nelson (2011) and Association of California Water Agen-cies (2011) for a description of successful management practices that would lead to greater efficiencies if adopted more widely.
50 Indeed, public flood infrastructure investments can increase the value of assets at risk, because they encourage more develop-ment on flood-prone land (Stavins and Jaffe 1990).
51 The term was introduced by Rosenzweig (2003). For a discus-sion of its application in California, see Hanak et al. (2011), ch. 5.
52 According to recent U.S. Environmental Protection surveys, estimated annual investment needs to maintain publicly owned urban water infrastructure to regulatory standards in Califor-nia are on the order of $2 billion and $1.2 billion for water and wastewater, respectively. Capital spending by these utilities tends to be substantially higher (see investment expenditures in the table on p. 4 and Hanak et al. 2011, ch. 2).
53 Rate structures of investor-owned utilities are approved by the California Public Utilities Commission. Recent court decisions have ruled that rate increases are potentially subject to sub-sequent rejection by voters, causing some concern that it may become more difficult for utilities to obtain bonds to finance infrastructure. Smaller utilities in more rural areas, which do not benefit from economies of scale, often face more significant challenges in maintaining and upgrading their systems.
54 Under the Paterno ruling, the state is liable for damages caused by levee failures within the federally-authorized Sac-ramento–San Joaquin flood control project (some 1,600 miles of levees), even if the levees were built and maintained by local authorities. This ruling granted more than $400 million to plaintiffs in Yuba County for damages sustained from flooding in 1986, and it leaves the state open to extensive future liabilities (California Department of Water Resources 2005).
55 Since the enactment of Proposition 26, a constitutional initia-tive passed by voters in November 2010, a two-thirds vote is also required before the state legislature or local agencies may raise taxes or fees to fund environmental restoration or other types of public improvements.
56 An important exception is the environmental restoration fund established by the Central Valley Project Improvement Act of 1992, which places a surcharge on water delivered to Central Valley Project contractors (currently $9.39/af for agricultural contractors and $18.78/af for municipal and industrial contrac-tors). From 1993 to 2010, the restoration fund collected $753 million ($885 million in 2009 dollars) from water and power contractors; these funds have been used for a variety of miti-gation activities. The Sonoma County Water Agency also has a surcharge on water sales (currently $54.56/af) to support environmental restoration activities for endangered salmon and steelhead within its service area.
57 The California Business Roundtable strongly supported Prop-osition 39, an initiative passed by voters in November 2000 that lowered the majority required for passing local bonds to sup-port schools and community colleges from 66.67 to 55 percent. Since this measure passed, local funding of school facilities has increased substantially (Hanak 2009).
www.ppic.org
Water and the California Economy26
References
Albouy, D. 2009. “The Unequal Geographic Burden of Federal Taxation.” Journal of Political Economy 117 (4): 635–67.
Association of California Water Agencies. 2011. Sustainability from the Ground Up: Groundwater Management in California, A Framework. Sacramento.
Bay Delta Conservation Plan. 2010. Highlights of the BDCP. Sacramento: California Natural Resources Agency.
BDCP Steering Committee. 2010. Progress Report on the Bay Delta Conservation Plan. Sacramento: California Natural Resources Agency.
Birol, E., K. Karousakis, and P. Koundouri. 2006. “Using Economic Valuation Techniques to Inform Water Resources Management: A Survey and Critical Appraisal of Available Techniques and an Application.” Science of the Total Environ-ment 365 (1–3): 105–22.
Blomquist, W. 1992. Dividing the Waters: Governing Ground-water in Southern California. San Francisco: ICS Press.
Boyer, T., and S. Polasky. 2004. “Valuing Urban Wetlands: A Review of Non-Market Valuation Studies.” Wetlands 24 (4): 744–55.
Brauman, K. A., G. C. Daily, T. K. Duarte, and H. A. Mooney. 2007. “The Nature and Value of Ecosystem Services: An Over-view Highlighting Hydrologic Services.” Annual Review of Environment and Resources 32: 67–98.
Brozović, N., D. L. Sunding, and D. Zilberman. 2007. “Esti-mating Business and Residential Water-Supply Interruption Losses from Catastrophic Events.” Water Resources Research 43. W08423, DOI: 10.1029/2005WR004782.
Brunke, H., R. Howitt, and D. Sumner. 2005. “Future Food Pro-duction and Consumption in California under Alternative Sce-narios.” California Water Plan Update 2005, Vol. 4 – Reference Guide. Sacramento: California Department of Water Resources.
CALFED. 2006. Comprehensive Evaluation of Water Use Effi-ciency. CALFED Bay Delta Program.
California Department of Water Resources. 1995. Sacramento–San Joaquin Delta Water Atlas.
California Department of Water Resources. 2005. Flood Warn-ings: Responding to California’s Flood Crisis.
California Department of Water Resources. 2008. An Initial Assessment of Dual Delta Water Conveyance. Prepared for the Delta Vision Blue Ribbon Task Force.
California Department of Water Resources. 2009. California Water Plan Update. Bulletin 160-09.
California Department of Water Resources. 2011. 2012 Central Valley Flood Protection Plan: A Path for Improving Public Safety, Environmental Stewardship, and Long-Term Economic Stability. Public Draft.
California Energy Commission. 2009. The Future Is Now: An Update on Science Impacts and Response Options for California. Report CEC-500-2008-271.
California Energy Commission. 2005. Integrated Energy Policy Report. CEC-100-2005-007-CMF.
California Urban Water Agencies. 1991. Cost of Industrial Water Shortages. San Francisco: Spectrum Economics, Inc.
Carter, H. O., H. J. Vaux, and A. F. Scheuring. 1994. Sharing Scarcity: Gainers and Losers in Water Marketing. Agricultural Issues Center, University of California, Davis.
Cayan, D. R., E. P. Maurer, M. D. Dettinger, M. Tyree, and K. Hayoe. 2007. “Climate Change Scenarios for the California Region.” Climatic Change 87 (1): S21– S42.
Chen, W-H., K. Haunschild, J. R. Lund, and W. Fleenor. 2010. “Current and Long-Term Effects of Delta Water Quality on Drinking Water Treatment Costs from Disinfection Byproduct Formation.” San Francisco Estuary and Watershed Science 8 (3).
Christian-Smith, J., M.C. Levy, and P.H. Gleick. 2011. Impacts of the California Drought from 2007 to 2009. Oakland: Pacific Institute.
City of Los Angeles 2007. Los Angeles River Revitalization Plan. Available at www.lariver.org.
Connell-Buck, C. R., J. Medellín-Azuara, J. R. Lund, and K. Madani. 2012. “Adapting California’s Water System to Warm vs. Dry Climates.” Climatic Change 109: 133–49.
Cooley, H., J., Christian-Smith, P. H. Gleick, M. J. Cohen, and M. Heberger. 2010. California’s Next Million Acre-Feet: Saving Water, Energy, and Money. Oakland, CA: Pacific Institute.
Creel, M., and J. Loomis. 1992. “Recreation Value of Water to Wetlands in the San Joaquin Valley: Linked Multinomial Logit and Count Data Trip Frequency Models.” Water Resources Research 28 (10): 2597–2606.
Cutter, W. B., K. A. Baerenklau, A. DeWoody, R. Sharma, and J. G. Lee. 2008. “Costs and Benefits of Capturing Urban Runoff with Competitive Bidding for Decentralized Best Manage-ment Practices.” Water Resources Research 44, W09410, DOI: 10.1029/2007WR006343.
www.ppic.org
Water and the California Economy 27
Das, T., M. D. Dettinger, D. R. Cayan, and H. G. Hidalgo. 2011. “Potential Increase in Floods in California’s Sierra Nevada under Future Climate Projections.” Climatic Change 109 (Suppl 1): S71–S94.
Dudgeon, D., A. H. Arthington, M. O. Gessner, Z-I. Kawabata, D. J. Knowler, C. Lévêque, R. J. Naiman, A-H. Prieur-Richard, D. Soto, M. L. J. Stiassny, and C. A. Sullivan. 2006. “Freshwater Biodiversity: Importance, Threats, Status and Conservation Challenges.” Biological Reviews 81: 163–82.
East Bay Municipal Utilities District. n.d. Earthquake Readiness: Protecting Life Safety and Public Health. Available at www.ebmud .com/sites/default/files/pdfs/Earthquake_Readiness_0.pdf. Last accessed January 29, 2012.
Ferraro, P. J., and M. K. Price. 2011. “Using Non-Pecuniary Strategies to Influence Behavior: Evidence from a Large Scale Field Experiment.” NBER working paper No. 17189.
Field, E. H., T. E. Dawson, K. R. Felzer, A. D. Frankel, V. Gupta, T. H. Jordan, T. Parsons, M. D. Petersen, R. S. Stein, R. J. Weldon II, and C. J. Wills. 2008. The Uniform California Earthquake Rupture Forecast, Version 2 (UCERF 2). U.S. Geological Survey Open File Report 2007-1437.
Fleenor, W., W. Bennett, P. Moyle, and J. Lund. 2010. “On Devel-oping Prescriptions for Freshwater Flows to Sustain Desirable Fishes in the Sacramento–San Joaquin Delta.” Report submitted to the State Water Resources Control Board by the Center for Watershed Sciences, University of California, Davis.
Food and Agricultural Organization of the United Nations. n.d. AQUASTAT online database. Available at www.fao.org/nr /water/aquastat/main/index.stm.
Freeman III, A. M. 1995. “The Benefits of Water Quality Improvements for Marine Recreation: A Review of the Empirical Evidence.” Marine Resource Economics 10 (4): 385–406.
Garrison, N., R. C. Wilkinson, R. Horner. 2009. A Clear Blue Future: How Greening California Cities Can Address Water Resources and Climate Challenges in the 21st Century. Natural Resources Defense Council and Water Policy Program, Bren School of Environmental Science and Management, University of California, Santa Barbara.
Gleick, P. H., D. Haasz, C. Henges-Jeck, V. Srinivasan, G. Wolff, K. K. Cushing, and A. Mann. 2003. Waste Not, Want Not: The Potential for Urban Water Conservation in California. Oakland, CA: Pacific Institute for Studies in Development, Environment, and Security.
Gray, B. E. 1994. “The Market and the Community: Lessons from California’s Drought Water Bank.” Hastings West-North-west Journal of Environmental Law and Policy 1: 17–45.
Gray, B. E. 1996. “The Shape of Transfers to Come: A Model Water Transfer Act for California.” Hastings West-Northwest Journal of Environmental Law and Policy 4: 23–59.
Hanak, E. 2003. Who Should Be Allowed to Sell Water in Cali-fornia? Third-Party Issues and the Water Market. San Francisco: Public Policy Institute of California.
Hanak, E. 2005. “Stopping the Drain: Third-Party Responses to California’s Water Market.” Contemporary Economic Policy 23 (1): 59–77.
Hanak, E. 2009. Paying for Infrastructure: California’s Choices. San Francisco: Public Policy Institute of California.
Hanak, E. 2010. “Show Me the Water Plan: Urban Water Man-agement Plans and California’s Water Supply Adequacy Laws.” Golden Gate University Environmental Law Review 4 (1).
Hanak, E. 2011. “California’s Water Market: Lessons from the Field.” In Permit Trading in Different Applications, ed. B. Hansjuergen et al. (London: Routledge).
Hanak, E., and M. Davis. 2006. “Lawns and Water Demand in California.” California Economic Policy 2 (2). San Francisco: Public Policy Institute of California.
Hanak, E., J. Lund, A. Dinar, B. Gray, R. Howitt, J. Mount, P. Moyle, B. Thompson. 2011. Managing California’s Water: From Conflict to Reconciliation. San Francisco: Public Policy Institute of California.
Hanak, E., and J. Lund. 2012. “Adapting California’s Water Man-agement to Climate Change.” Climatic Change 111 (1): 17–44.
Hanak, E., and G. Moreno. 2012. “California Coastal Manage-ment with a Changing Climate.” Climatic Change 111 (1): 45–73.
Hanemann, M. 2005. Rebuttal Expert Report of Professor W. Michael Hanemann, Ph.D. Case No. Civ-S-88-1658 LKK/GGH.
Harou, J., J. Medellín-Azuara, T. Zhu, S. K. Tanaka, J. R. Lund, S. Stine, M. A. Olivares, and M. W. Jenkins. 2010. “Eco-nomic Consequences of Optimized Water Management for a Prolonged, Severe Drought in California.” Water Resources Research 46: W05522, DOI: 10.1029/2008WR007681.
Hashimoto, T., J. R. Stedinger, and D. P. Loucks. 1982. “Reli-ability, Resiliency, and Vulnerability Criteria for Water Resource System Performance Evaluation.” Water Resources Research 18 (1): 14–20.
Harter, T., J. R. Lund, J. Darby, G. E. Fogg, R. Howitt, K. K. Jes-soe, G. S. Pettygrove, J. F. Quinn, J. H. Viers, D. B. Boyle, H. E. Canada, N. DeLaMora, K. N. Dzurella, A. Fryjoff-Hung, A. D. Hollander, K. L. Honeycutt, M. W. Jenkins, V. B. Jensen, A. M. King, G. Kourakos, D. Liptzin, E. M. Lopez, M. M. Mayzelle,
A. McNally, J. Medellín-Azuara, and T. S. Rosenstock. 2012. Addressing Nitrate in California’s Drinking Water with a Focus on Tulare Lake Basin and Salinas Valley Groundwater. Report submitted to the State Water Resources Control Board by the Center for Watershed Sciences, University of California, Davis.
Heberger, M., H. Cooley, P. Herrera, P. H. Gleick, and E. Moore. 2009. The Impacts of Sea-Level Rise on the California Coast. Sac-ramento: California Climate Change Center.
Howitt, R. E., D. MacEwan, and J. Medellín-Azuara. 2011. “Eco-nomic Impacts of Reductions in Delta Exports on Central Valley Agriculture.” Agricultural and Resources Economics Update 14 (6) 1–4.
Hundley Jr., N. 2001. The Great Thirst: Californians and Water—A History. Berkeley: University of California Press.
Kelley, R. 1989. Battling the Inland Sea. Berkeley: University of California Press.
Kolko, J. 2010. Business Relocation and Homegrown Jobs. San Francisco: Public Policy Institute of California.
Kolko, J., D. Neumark, and M. Cuellar Mejia. 2011. Business Climate Rankings and the California Economy. San Francisco: Public Policy Institute of California.
Kotchen, M. 2010. “Climate Policy and Voluntary Initiatives: An Evaluation of the Connecticut Clean Energy Communities Program.” Working paper 16117, National Bureau of Economic Research.
Kotchen, M., and M. R. Moore. 2007. “Private Provision of Environmental Public Goods: Household Participation in Green Electricity Programs,” Journal of Environmental Economics and Management 53: 1-16.
Loomis, J. B. 2000. “Environmental Valuation Techniques in Water Resource Decision Making. “ Journal of Water Resources Planning and Management 126 (6): 339–44.
Lund, J. R., E. Hanak, W. E. Fleenor, W. A. Bennett, R. E. How-itt, J. F. Mount, and P. B. Moyle. 2010. Comparing Futures for the Sacramento–San Joaquin Delta. Berkeley: University of Califor-nia Press and Public Policy Institute of California.
Lund, J. R., M. Jenkins, and O. Kalman. 1998. Integrated Plan-ning and Management for Urban Water Supplies Considering Multiple Uncertainties. Issue 205. Center for Water Resources, University of California.
MacEwan, D., B. Clark, B. Thoreson, R. E. Howitt, J. Medellín-Azuara, and G. Davids. 2010. “Assessment of Economic and Hydrologic Impacts of Reduced Surface Water Supply for Irrigation via Remote Sensing.” Presented at the United States
Commission for Irrigation and Drainage Annual Conference, Sept. 28–Oct. 1, Fort Collins, Colorado.
MacEwan, D., R. E. Howitt, and J. R. Lund. 2010. “Economic Modeling of Agriculture and Water in California Using the Statewide Agricultural Production Model.” Available at www .waterplan.water.ca.gov/docs/cwpu2009/0310final/v4c04a02_cwp2009.pdf. Last accessed: January 2012.
Mansur, E. and S. Olmstead. 2012. “The Value of Scarce Water: Measuring the Inefficiency of Municipal Regulations.” Journal of Urban Economics 71: 332–46.
Medellín-Azuara, J., R. E. Howitt, D. J. MacEwan, J. R. Lund. 2012. “Economic Impacts of Climate-Related Changes to Cali-fornia Agriculture.” Climatic Change 109 (1): 387–405.
Medellín-Azuara, J., R. E. Howitt, J. R. Lund, E. Hanak. 2008. “The Economic Effects on Agriculture of Water Export Salinity South of the Delta.” Technical Appendix I, Comparing Futures for the Sacramento–San Joaquin Delta. Available at www.ppic.org/content/pubs/other/708EHR_appendixI.pdf.
Monterey County Water Resources Agency. 2001. Draft Envi-ronmental Impact Report/Environmental Impact Statement for the Salinas Valley Project.
Moore, E., E. Matalon, C. Balazs, J. Clary, L. Firestone, S. De Anda, and M. Guzman. 2011. The Human Costs of Nitrate- Contaminated Drinking Water in the San Joaquin Valley. Oak-land, CA: Pacific Institute.
Mount, J. F., and R. Twiss. 2005. “Subsidence, Sea Level Rise, Seismicity in the Sacramento–San Joaquin Delta.” San Francisco Estuary and Watershed Science 3 (1).
Moyle, P. B., and W. A. Bennett. 2008. “The Future of the Delta Ecosystem and Its Fish.” Technical Appendix D, Comparing Futures for the Sacramento–San Joaquin Delta. Available at www.ppic.org/content/pubs/other/708EHR_appendix.pdf.
Moyle, P. B., J. V. E. Katz and R. M. Quiñones. 2011. Rapid Decline of California’s Native Inland Fishes: A Status Assess-ment. Biological Conservation 144: 2414–23.
National Research Council. 2005. Valuing Ecosystem Services: Towards Better Environmental Decision-Making. Washington DC: National Academies Press.
Nelson, R. 2011. “Uncommon Innovation: Developments in Groundwater Management Planning in California.” Water in the West Working Paper 1, Woods Institute for the Environment and Bill Lane Center for the American West, Stanford University.
Null, S. E., and J. R. Lund. 2006. “Re-Assembling Hetch Hetchy: Water Supply Implications of Removing O’Shaughnessy Dam.” Journal of the American Water Resources Association 42 (4): 395–408.
www.ppic.org
Water and the California Economy 29
Olmstead, S., and R. Stavins. 2009. “Comparing Price and Non-Price Approaches to Water Conservation.” Water Resources Research 45.
Orang, M. N., J. S. Matyac, and R. L. Snyder. 2008. “Survey of Irrigation Methods in California in 2001.” Journal of Irrigation and Drainage Engineering 4 (1): 96–100.
Pisani, D. 1984. From the Family Farm to Agribusiness: The Irrigation Crusade in California, 1850–1931. Berkeley: University of California Press.
Postel, S. L., and B. H. Thompson Jr. 2005. “Watershed Protec-tion: Capturing the Benefits of Nature’s Water Supply Services.” Natural Resources Forum 29: 98–108.
Rich, J. 2009. “Comparing Changes in Applied Water Use and the Real Gross Value of Output for California Agriculture: 1967 to 2007.” Available at www.waterplan.water.ca.gov/docs /cwpu2009/0310final/v4c07a01_cwp2009.pdf.
Rosenzweig, M. 2003. Win-Win Ecology: How the Earth’s Species Can Survive in the Midst of Human Enterprise. Oxford: Oxford University Press.
Sacramento Area Flood Control Agency. 2008. Development Fee Program: Comparative Risk Analysis. Sacramento, CA: David Ford Consulting Engineers.
Stavins, R. N., and A. B. Jaffe. 1990. “Unintended Impacts of Public Investments on Private Decisions: The Depletion of For-ested Wetlands.” American Economic Review 80 (3): 337–52.
Tanaka, S. K., C. Buck, K. Madani, J. Medellín-Azuara, J. Lund, and E. Hanak. 2011. “Economic Costs and Adaptations for Alternative Regulations of California’s Sacramento–San Joaquin Delta.” San Francisco Estuary and Watershed Science 9 (2).
Tanaka, S. K., T. Zhu, J. R. Lund, R. E. Howitt, M. W. Jenkins, M. A. Pulido, M. Tauber, R. S. Ritzema, and I. C. Ferreira. 2006. “Climate Warming and Water Management Adaptation for Cali-fornia.” Climatic Change 76 (3–4): 361–87.
Thomas, G. 2001. Designing Successful Groundwater Banking Programs in the Central Valley: Lessons from Experience. Berke-ley, CA: Natural Heritage Institute.
Tindula, G. N., M. N. Orang, and R. L. Snyder. 2011. “Survey of Irrigation Methods in California in 2010.” California Depart-ment of Water Resources working paper (under submission).
URS Corporation and Jack R. Benjamin & Associates. 2007. “Delta Risk Management Strategy (DRMS) Phase 1 Risk Analy-sis Report.” Draft prepared for the California Department of Water Resources.
URS Corporation and Jack R. Benjamin & Associates. 2009. Delta Risk Management Strategy (DRMS) Phase 1 Risk Analy-sis Report. Prepared for the California Department of Water Resources.
U.S. Geological Survey. 2009. “Groundwater Availability of the Central Valley Aquifer, California.” Professional Paper 1766, U.S. Department of the Interior.
Vermeer, M. and S. Rahmstorf. 2009. “Global Sea Level Linked to Global Temperature.” Proceedings of the National Academy of Sciences, doi:10.1073/pnas.0907765106.
Vogel, R. M., and R. A. Bolognese. 1995. “Storage-Reliability-Resilience-Yield Relations for Over-Year Water Supply Systems. Water Resources Research 31 (3): 645–54.
Ward, F. A., B. A. Roach, and J. E. Henderson, 1996. “The Eco-nomic Value of Water in Recreation: Evidence from the Califor-nia Drought.” Water Resources Research 32 (4): 1075–81.
Weiser, M. 2012. “Water Tunnels Would Be Huge Project—If They Clear Huge Obstacles.” Sacramento Bee, February 20.
Wilkinson, R. 2011. “The Water-Energy Nexus: Methodologies, Challenges, and Opportunities.” In The Water-Energy Nexus in the Western United States, ed. D. S. Kenney and R. Wilkinson (Cheltenham: Edward Elgar Publishing).
Willis, A. D., J. R. Lund, E. S. Townsley, and E. Faber. 2011. “Climate Change and Flood Operations in the Sacramento Basin, California.” San Francisco Estuary and Watershed Science 9 (2).
Wilson, M. A., and S. R. Carpenter. 1999. “Economic Valuation of Freshwater Ecosystem Services in the United States: 1971–1997.” Ecological Applications 9 (3): 772–83.
W. Bowman Cutter is an associate professor of economics at Pomona College.
Brian Gray is a professor of law at the University of Califor-nia, Hastings College of Law, San Francisco.
Ellen Hanak is a senior policy fellow at the Public Policy Institute of California.
David Houston is managing director and head of the Water Infrastructure Group at Citigroup Global Markets. He pre-viously served as regional director of the mid-Pacific region of the U.S. Bureau of Reclamation and deputy assistant secretary of the U.S. Department of the Interior.
Richard Howitt is a professor of agricultural and resource economics at the University of California, Davis.
Katrina Jessoe is an assistant professor of agricultural and resource economics and the University of California, Davis.
Gary Libecap is distinguished professor of corporate envi-ronmental management, Bren School of Environmental Science and Management and Department of Economics, University of California, Santa Barbara.
Jay Lund is the Ray B. Krone Professor of Environmental Engineering and director of the Center for Watershed Sciences at the University of California, Davis.
Josué Medellín-Azuara is a research scientist at the Center for Watershed Sciences at the University of California, Davis.
Sheila Olmstead is a fellow at Resources for the Future in Washington DC.
Daniel Sumner is the Frank H. Buck, Jr. Professor of Agricultural and Resource Economics at the University of California, Davis and director of the University of Califor-nia’s Agricultural Issues Center.
David Sunding is the Thomas J. Graff Professor of Natural Resource Economics and Policy at the University of California, Berkeley, codirector of the Berkeley Water Center, and principal at The Brattle Group, an economics, finance, and regulatory consulting firm.
Brian Thomas is managing director for Public Financial Management (PFM), a financial advisory firm for state and local governments. He previously served as the chief finan-cial officer for the Metropolitan Water District of Southern California.
Barton “Buzz” Thompson is the Robert E. Paradise Profes-sor in Natural Resources Law at Stanford Law School and the Perry L. McCarty Director of the Woods Institute for the Environment at Stanford University.
Robert Wilkinson is adjunct associate professor at the Bren School of Environmental Science and Management and lecturer in the Environmental Studies Program at the University of California, Santa Barbara.
Acknowledgments
This report is a consensus document resulting from a one-day workshop held in late September 2011 at the Woods Institute at Stanford University. We thank Joya Banerjee, Heather Cooley, Peter Gleick, and Allison Harvey Turner for their contributions to the workshop discussions. We also thank Juliet Christian-Smith, Heather Cooley, Kent Frame, Peter Gleick, Ray Hoagland, David Lesher, and David Todd for providing valuable comments on an earlier draft of the report. Gary Bjork, Mary Severance, and Lynette Ubois provided helpful editorial guidance and Kate Reber provided production support. We alone are responsible for any remaining errors.
G A R Y K . H A R T, C H A I RFormer State Senator and Secretary of EducationState of Califor nia
M A R K B A L DA S S A R EPresident and CEOPublic Policy Institute of California
R U B E N B A R R A L E SPresident and CEOSan Diego Regional Chamber of Commerce
M A R Í A B L A N COVice President, Civic EngagementCalifornia Community Foundation
B R I G I T T E B R E NChief Executive OfficerInternational Strategic Planning, Inc.
R O B E R T M . H E R T Z B E R GPartnerMayer Brown, LLP
WA LT E R B . H E W L E T TChair, Board of DirectorsWilliam and Flora Hewlett Foundation
D O N N A L U C A SChief Executive OfficerLucas Public Affairs
DAV I D M A S M A S U M O T OAuthor and Farmer
S T E V E N A . M E R K S A M E RSenior PartnerNielsen, Merksamer, Parrinello, Gross & Leoni, LLP
K I M P O L E S EChairmanClearStreet, Inc.
T H O M A S C . S U T T O NRetired Chairman and CEOPacific Life Insurance Company
PPIC is a private operating foundation. It does not take or support positions on any ballot measures or on any local, state, or federal legislation, nor does it endorse, support, or oppose any political parties or candidates for public office. PPIC was established in 1994 with an endowment from William R. Hewlett.
Short sections of text, not to exceed three paragraphs, may be quoted without written permission provided that full attribution is given to the source and the above copyright notice is included.
Research publications reflect the views of the authors and do not necessarily reflect the views of the staff, officers, or Board of Directors of the Public Policy Institute of California.
Library of Congress Cataloging-in-Publication data are available for this publication.
ISBN 978-1-58213-150-4
P U B L I C P O L I C Y I N S T I T U T E O F C A L I F O R N I A500 Washington Street, Suite 600 San Francisco, California 94111Telephone 415.291.4400 Fax 415.291.4401
P P I C S A C R A M E N T O C E N T E RSenator Office Building 1121 L Street, Suite 801 Sacramento, California 95814Telephone 916.440.1120 Fax 916.440.1121
Additional resources related to water policy are available at www.ppic.org.
The Public Policy Institute of California is dedicated to informing and improving public policy in California through independent, objective, nonpartisan research.