Page 1
Water and wastewater treatment processes
ENV H 452/ENV H 542
John Scott Meschke
Office: Suite 2249,
4225 Roosevelt
Phone: 206-221-5470
Email: [email protected]
Gwy-Am Shin
Office: Suite 2339,
4225 Roosevelt
Phone: 206-543-9026
Email: [email protected]
Page 2
Key points
• Purpose of the individual unit processes
• The typical operating conditions
• The outcome of the processes
• Microbial reduction in the processes
Page 3
Wastewater treatment processes
Page 4
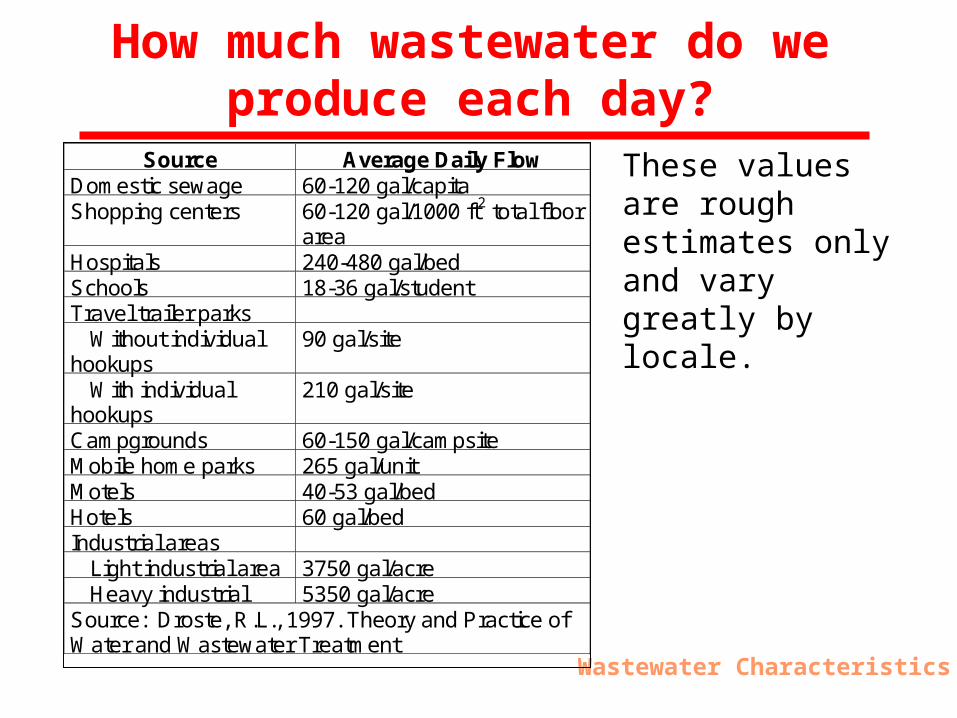
How much wastewater do we produce each day?
Wastewater Characteristics
Source Average Daily FlowDomestic sewage 60-120 gal/capitaShopping centers 60-120 gal/1000 ft2 total floor
areaHospitals 240-480 gal/bedSchools 18-36 gal/studentTravel trailer parks
Without individualhookups
90 gal/site
With individualhookups
210 gal/site
Campgrounds 60-150 gal/campsiteMobile home parks 265 gal/unitMotels 40-53 gal/bedHotels 60 gal/bedIndustrial areas
Light industrial area 3750 gal/acreHeavy industrial 5350 gal/acre
Source: Droste, R.L., 1997. Theory and Practice ofWater and Wastewater Treatment
These values are rough estimates only and vary greatly by locale.
Page 5
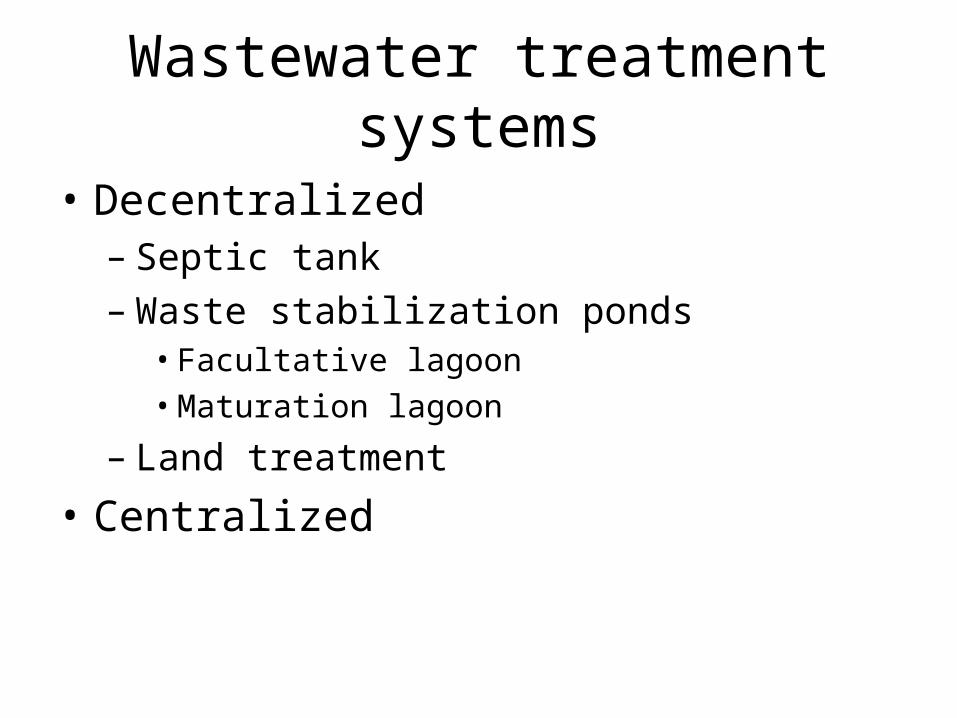
Wastewater treatment systems
• Decentralized– Septic tank– Waste stabilization ponds
• Facultative lagoon• Maturation lagoon
– Land treatment
• Centralized
Page 7
Typical composition of untreated domestic wastewater
Page 8
Microorganism concentrations in untreated wastewater
Page 9
(Minimum) Goals of wastewater treatment processes
• <30 mg/L BOD5
• <30 mg/L of suspended solids
• <200 CFU/100ml fecal coliforms
Page 10
Conventional Community (Centralized) Sewage Treatment
Pathogen Reductions Vary from: low (<90%) to Very High (>99.99+%)
Secondary Treatment Using Activated Sludge Process
Sludge drying bed or mechanical dewatering process
Page 11
Typical Municipal Wastewater Treatment System
Preliminary or Pre-Preliminary or Pre-TreatmentTreatment
PrimaryTreatment
SecondaryTreatment
Disinfection
Sludge Treatment& Disposal
Page 12
Preliminary Wastewater Treatment System
Preliminary or Pre-Preliminary or Pre-TreatmentTreatment
Solids to Landfill
Page 13
Preliminary Treatment Facilities
Preliminary Treatment - Bar Racks
Bar Racks: are used to remove large objects that could potentially damage downstream treatment/pumping facilities.
Ref: Metcalf & Eddy, 1991
Page 14
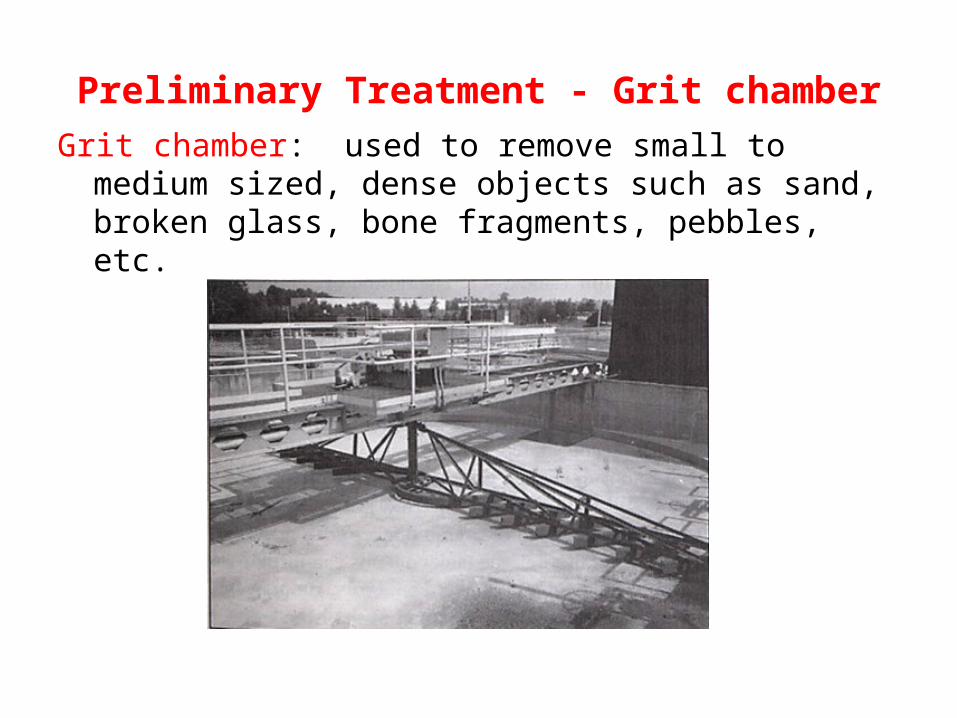
Preliminary Treatment - Grit chamber
Grit chamber: used to remove small to medium sized, dense objects such as sand, broken glass, bone fragments, pebbles, etc.
Page 15
Primary Wastewater Treatment
PrimaryTreatmentPrimary
Treatment
Page 16
Primary sedimentation • To remove settleable solids from wastewater
Page 17
Primary Clarification
PrimarySludge
PrimaryEffluent
Influent from Preliminary Treatment
Section through a Circular Primary Clarifier
Primary Treatment
Scum: Oil, Grease, Floatable Solids
Page 18
Primary sedimentation
• To remove settleable solids from wastewater• Maximum flow: 30 - 40 m3 per day• Retention period: 1.5 - 2.0 hours (at maximum flow)• 50 - 70 % removal of suspended solids• 25 - 35 % removal of BOD5
• ~20 % removal of phosphate • ~50 % removal of viruses, bacteria, and protozoa• 90 % removal of helminth ova
Page 19
Secondary Wastewater Treatment
SecondaryTreatmentSecondaryTreatment
Page 20
Secondary treatment processes
• To remove suspended solids, nitrogen, and phosphate
• 90 % removal of SS and BOD5
• Various technologies– Activated sludge process– Tricking filter– Aerated lagoons– Rotating biological contractors
Page 21
Secondary Treatment Using Activated Sludge Process
SecondaryTreatment
Secondary Treatment
Sludge drying bed or mechanical dewatering process
Page 22
The Activated Sludge Process
Aerobic microbes utilities carbon and other nutrients to form a healthy activated sludge (AS) biomass (floc)
The biomass floc is allowed to settle out in the next reactor; some of the AS is recycled
Secondary Treatment
Simplified Activated Sludge Description
Page 23
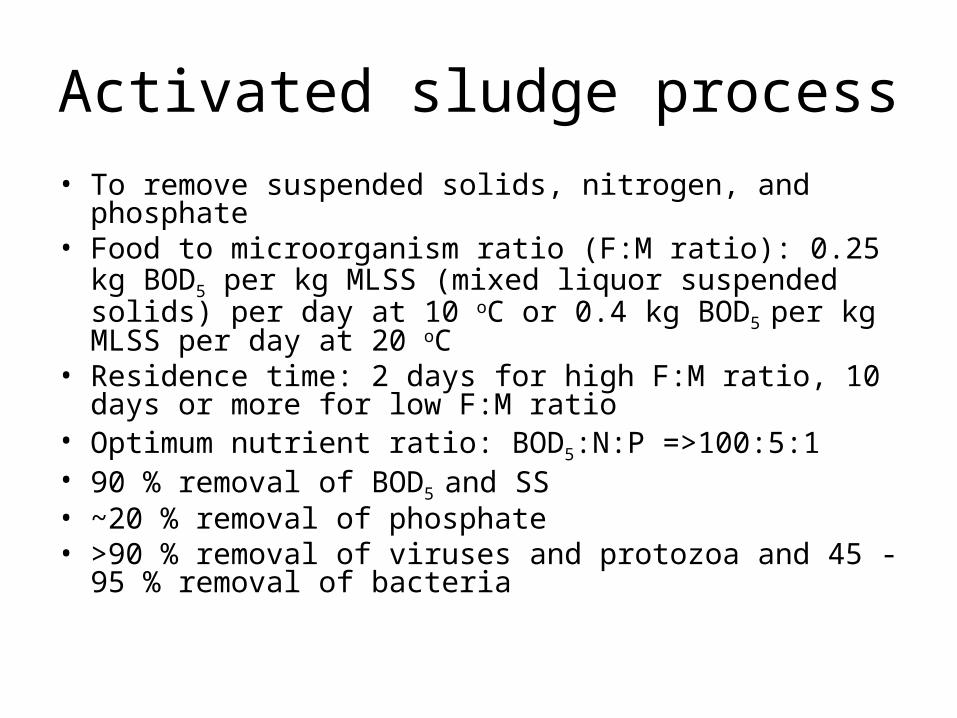
Activated sludge process
• To remove suspended solids, nitrogen, and phosphate• Food to microorganism ratio (F:M ratio): 0.25 kg BOD5
per kg MLSS (mixed liquor suspended solids) per day at 10 oC or 0.4 kg BOD5 per kg MLSS per day at 20 oC
• Residence time: 2 days for high F:M ratio, 10 days or more for low F:M ratio
• Optimum nutrient ratio: BOD5:N:P =>100:5:1• 90 % removal of BOD5 and SS• ~20 % removal of phosphate• >90 % removal of viruses and protozoa and 45 - 95 %
removal of bacteria
Page 24
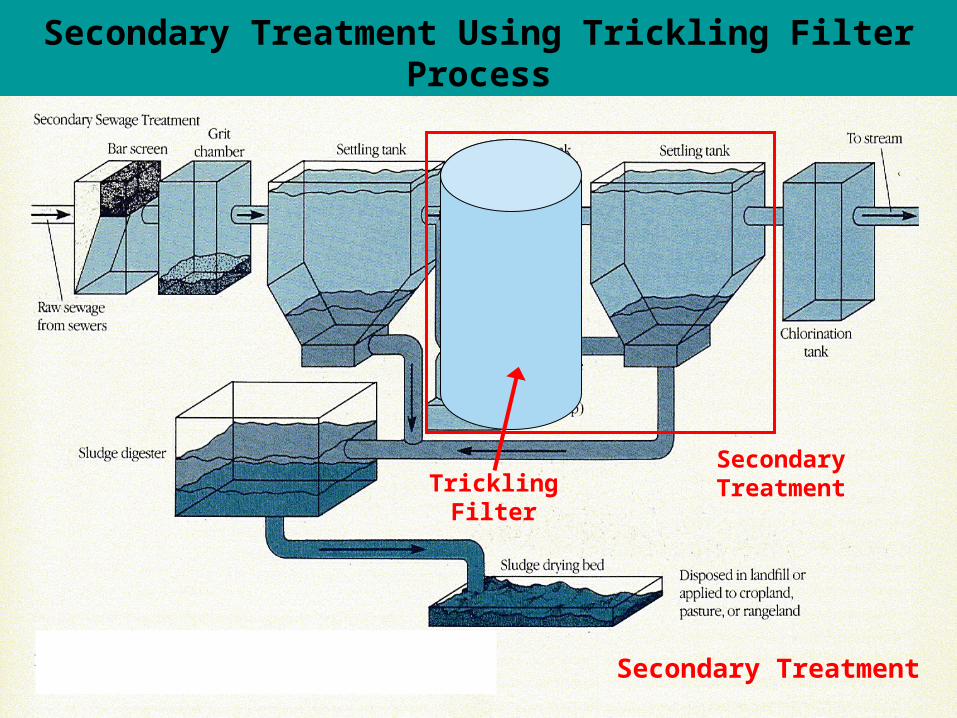
Secondary Treatment Using Trickling Filter Process
SecondaryTreatment
Secondary Treatment
TricklingFilter
Page 25
Trickling Filter
http://www.rpi.edu/dept/chem-eng/Biotech-Environ/FUNDAMNT/streem/trickfil.jpg
Primary effluent drips onto rock orman-made media
Rotating arm todistribute water evenly over filter
Rock-bed with slimy (biofilm) bacterial growth
Primary effluent pumped inTreated waste to secondary clarifier
Page 26
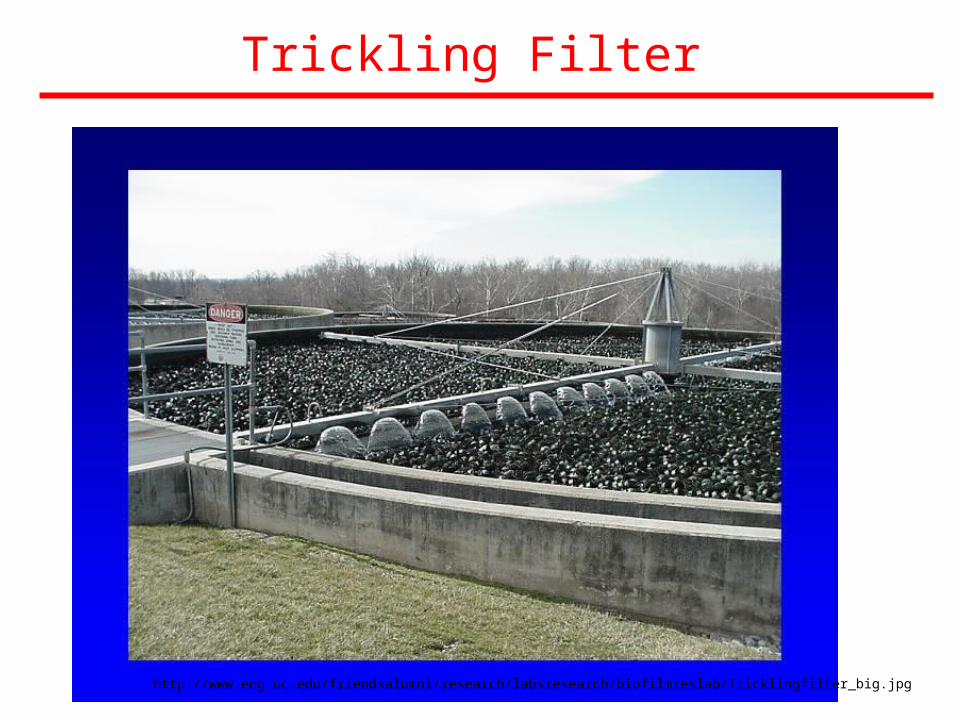
Trickling Filter
http://www.eng.uc.edu/friendsalumni/research/labsresearch/biofilmreslab/Tricklingfilter_big.jpg
Page 27
Tricking filter process
• To remove suspended solids, nitrogen, and phosphate
• Organic loading (BOD5 X flow/volume of filter): 0.1 kg BOD5 per m3 per day
• Hydraulic loading: 0.4 m3 per day per m3 of plan area
• 90 % removal of BOD5 and SS• ~20 % removal of phosphate• Variable removal levels of viruses, 20-80 %
removal of bacteria and >90 % removal of protozoa
Page 28
Wastewater Disinfection
Disinfection
Page 29
Wastewater disinfection
• To inactivate pathogens in wastewater
• Several choices– Free chlorine and combined chlorine– UV– Ozone– Chlorine dioxide
Page 30
Overall pathogen reduction in wastewater treatment
Page 31
Water treatment processes
Page 32
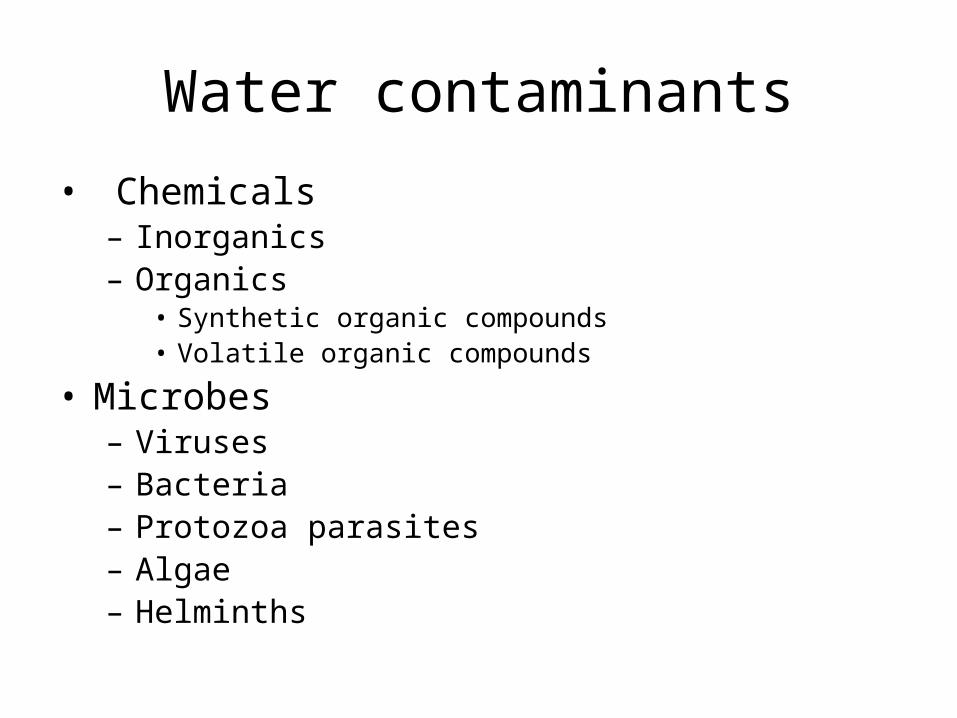
Water contaminants
• Chemicals– Inorganics– Organics
• Synthetic organic compounds• Volatile organic compounds
• Microbes– Viruses– Bacteria– Protozoa parasites– Algae– Helminths
Page 33
Water contaminants (I)
Page 34
Water contaminants (II)
Page 35
Water contaminants (III)
Page 36
Water contaminants (IV)
Page 37
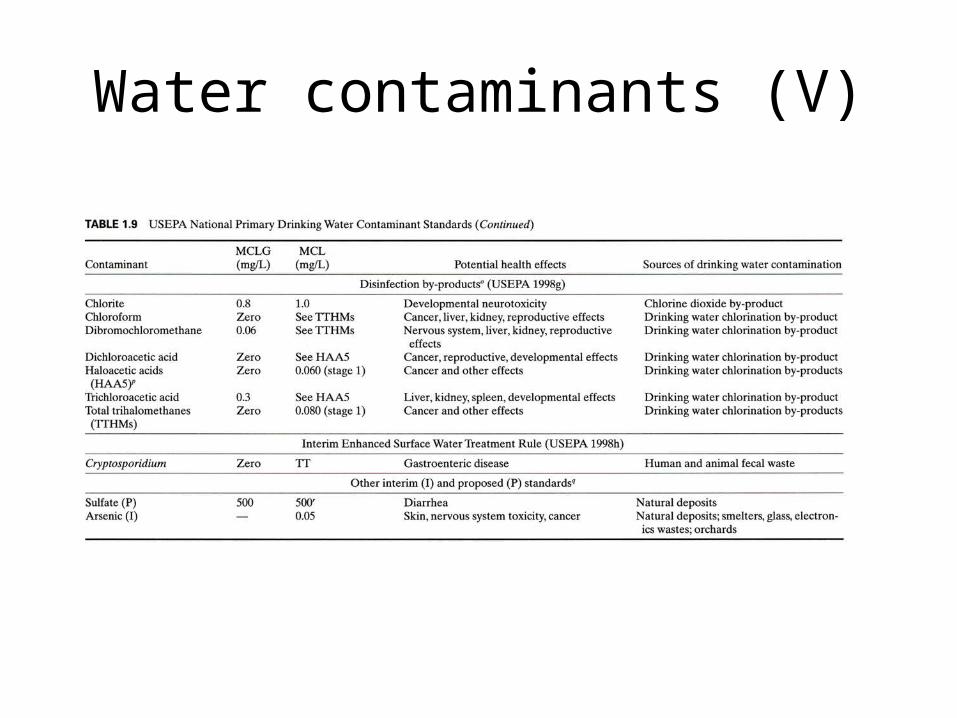
Water contaminants (V)
Page 38
Multiple barrier concept for public health protection
Page 39
Barrier Approach to Protect Public Health in Drinking Water
• Source Water Protection
• Treatment Technology
• Disinfection
• Disinfectant residual in distribution system
Page 40
Water treatment processes
Page 41
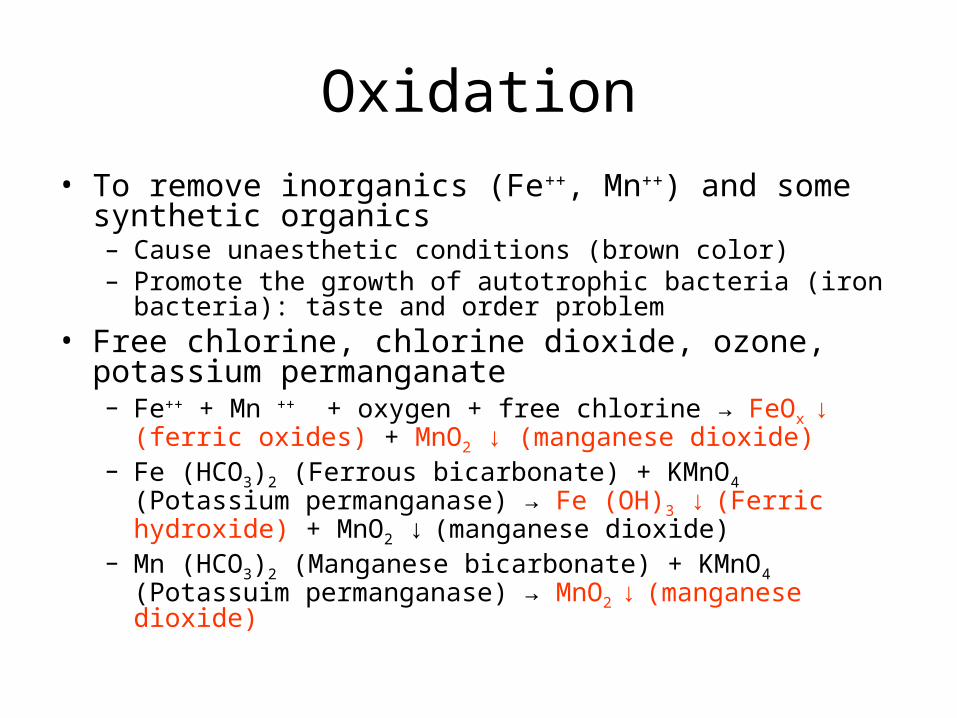
Oxidation
• To remove inorganics (Fe++, Mn++) and some synthetic organics– Cause unaesthetic conditions (brown color)– Promote the growth of autotrophic bacteria (iron bacteria): taste
and order problem• Free chlorine, chlorine dioxide, ozone, potassium
permanganate– Fe++ + Mn ++ + oxygen + free chlorine → FeOx ↓ (ferric oxides) +
MnO2 ↓ (manganese dioxide)– Fe (HCO3)2 (Ferrous bicarbonate) + KMnO4 (Potassium
permanganase) → Fe (OH)3 ↓ (Ferric hydroxide) + MnO2 ↓ (manganese dioxide)
– Mn (HCO3)2 (Manganese bicarbonate) + KMnO4 (Potassuim permanganase) → MnO2 ↓ (manganese dioxide)
Page 42
Physico-chemical processes
• To remove particles in water
• Coagulation/flocculation/sedimentation
• Filtration
Page 43
Rapid Mix
• Intense mixing of coagulant and other chemicals with the water
• Generally performed with mechanical mixers
Chemical Coagulant
Page 44
Major Coagulants
• Hydrolyzing metal salts– Alum (Al2(SO4)3)
– Ferric chloride (FeCl3)
• Organic polymers (polyelectrolytes)
Page 45
Coagulation with Metal Salts
Al(OH)
Alx(OH)y
Colloid
Al(OH)3
Al(OH)3 Colloid
Al(OH)3
Al(OH)3
Colloid
+ +Soluble Hydrolysis Species
(Low Alum Dose)
Colloid
Colloid
Colloid
Al(OH)3Al(OH)3
Al(OH)3
Al(OH)3
Al(OH)3
(High Alum Dose)
Floc
Sweep CoagulationCharge Neutralization
Page 46
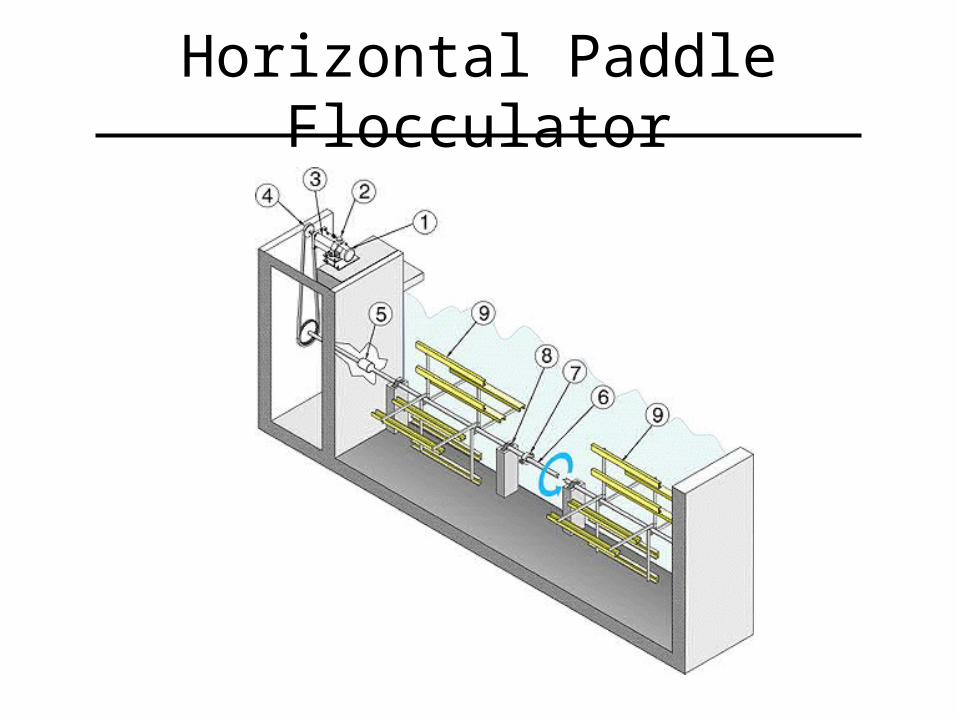
Horizontal Paddle Flocculator
Page 47
Flocculation ExampleFlocculation Example
Water coming from Water coming from rapid mix.rapid mix. Water goes to sedimentationWater goes to sedimentation
basin.basin.
Page 48
Sedimentation Basin
Page 49
Sedimentation Basin ExampleSedimentation Basin ExampleWater coming from Water coming from flocculation basin.flocculation basin.
Water goes to Water goes to filter.filter.
Floc (sludge) collectedin hopperSludge to solids
treatment
Page 50
Coagulation/flocculation/and sedimentation
• To remove particulates and natural organic materials in water• Coagulation
– 20 -50 mg/L of Alum at pH 5.5-6.5 (sweep coagulation)– rapid mixing: G values = 300-800/second
• Flocculation: – Slow mixing: G values = 30-70/second– Residence time:10 -30 minutes
• Sedimentation– Surface loading: 0.3 -1.0 gpm/ft2
– Residence time: 1 – 2 hours• Removal of suspended solids and turbidity: 60-80 %• Reduction of microbes
– 74-97 % Total coliform – 76-83 % of fecal coliform – 88-95 % of Enteric viruses– 58-99 % of Giardia– 90 % of Cryptosporidium
Page 51
Filtration
• To remove particles and floc that do not settle by gravity in sedimentation process
• Types of granular media– Sand– Sand + anthracite– Granular activated carbon
• Media depth ranges from 24 to 72 inches
Page 52
Filter ExampleFilter Example
Water coming from Water coming from sedimentation sedimentation basin.basin.
AnthraciteAnthracite
SandSand
Gravel (supportGravel (support
media)media)
Water going to disinfectionWater going to disinfection
Page 53
Mechanisms Involved in Filtration
Interception: hits & sticks
Sedimentation: quiescent, settles, & attaches
Flocculation: Floc gets larger within filter
Entrapment: large floc gets trapped in space between particles
Floc particles
Granular media, e.g., grain of sand
Removal of bacteria, viruses and protozoa by a granular media filter requires water to be coagulated
Page 54
Rapid filtration
• To remove particulates in water• Flow rate: 2-4 gpm/ft2
• Turbidity: < 0.5 NTU (often times < 0.1 NTU)• Reduction of microbes
– 50-98 % Total coliform – 50-98 % of fecal coliform – 10-99 % of enteric viruses– 97-99.9 % of Giardia– 99 % of Cryptosporidium
Page 55
Disinfection in water
• To inactivate pathogens in water
• Various types– Free chlorine– Chloramines– Chlorine dioxide– Ozone– UV
Page 56
Trend in disinfectant use (USA, % values)
Disinfectant 1978 1989 1999
Chlorine gas 91 87 83.8
NaClO2 (bulk) 6 7.1 18.3
NaClO2 (on-site)
0 0 2
Chlorine dioxide
0 4.5 8.1
Ozone 0 0.4 6.6
Chloramines 0 20 28.4
Page 57
Comparison of major disinfectants
Consideration Disinfect ants
Cl2 ClO2 O3 NH2Cl
Oxidation potential
Strong Stronger? Strongest Weak
Residuals Yes No No Yes
Mode of action
Proteins/NA
Proteins/NA
Proteins/NA
Proteins
Disinfecting efficacy
Good Very good Excellent Moderate
By-products Yes Yes Yes? No