Water co-produced with coalbed methane in the Powder River Basin, Wyoming: preliminary compositional data by Rice, C.A. 1 , Ellis, M.S. 1 , and Bullock, J.H., Jr. 1 ______________________________________________________ Open-File Report 00-372 2000 This report is preliminary and has not been reviewed for conformity with the U.S. Geological Survey editorial standards or with the North American Stratigraphic Code. Any use of trade names is for descriptive purposes only and does not imply endorsement by the U.S. Government. U.S. DEPARTMENT OF THE INTERIOR U.S. GEOLOGICAL SURVEY 1 Denver, Colorado
Transcript
Water co-produced with coalbed methane inthe Powder River Basin, Wyoming:preliminary compositional data
by Rice, C.A.1, Ellis, M.S.1, and Bullock, J.H., Jr.1
This report is preliminary and has not been reviewed for conformity with the U.S. Geological Surveyeditorial standards or with the North American Stratigraphic Code. Any use of trade names is fordescriptive purposes only and does not imply endorsement by the U.S. Government.
U.S. DEPARTMENT OF THE INTERIORU.S. GEOLOGICAL SURVEY
Figure 1. Generalized geologic map of the Powder River Basin, Wyoming and Montanashowing the basin axis, counties, major cities, location of cross section (Fig. 2),and approximate extent of the study area (modified from Flores and Bader,1999).................................................................................................................... 7
Figure 2. Cross section showing an example of the complex stratigraphic relationship ofcoal beds in part of the Tongue River Member of the Fort Union Formation.This cross section is in the central part of the Powder River Basin, Wyomingnear the city of Gillette. (Modified from Flores and others, 1999). .................. 8
Figure 3. Composite stratigraphic column showing the Upper Cretaceous LanceFormation (part) and Tertiary Fort Union and Wasatch Formations in thePowder River Basin, Wyoming and Montana. Major coal beds and zones inthe Fort Union Formation are identified. Coal zones or beds targeted forcoalbed methane are bold. (Modified from Flores and Bader, 1999). .............. 9
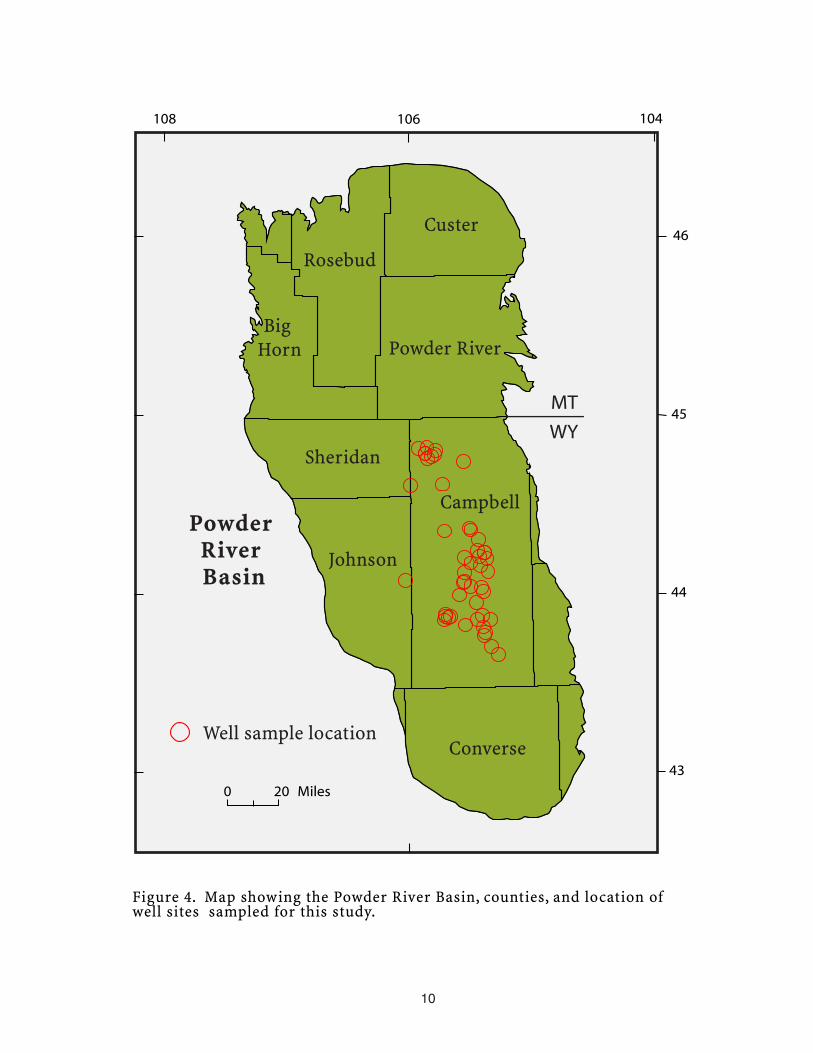
Figure 4. Map showing the Powder River Basin, counties, and location of well sitessampled for this study. ......................................................................................10
Figure 5. Collecting filtered samples for analysis. ...........................................................11Figure 6. Distribution of total dissolved solids in water co-produced with coalbed
methane from the Wyodak-Anderson coal zone. Composition of selectedsamples indicated by Stiff diagrams. ................................................................12
List of Tables
Table 1. Information on wells sampled. Information is from Wyoming Oil and GasConservation Commission well files and completion reports..........................13
Table 2. Measured parameters and major and minor element concentrations in watersproduced with coalbed methane from wells in the Powder River Basin,Wyoming. ..........................................................................................................15
Table 3. Trace element concentrations in water produced with coalbed methane fromwells in the Powder River Basin, Wyoming.....................................................17
1
Water co-produced with coalbed methane in the Powder River Basin, Wyoming:preliminary compositional data
C. A. Rice, M. S. Ellis, and J. H. Bullock, Jr.
INTRODUCTION
Production of water and natural gas from coal beds (coalbed methane, CBM) hasincreased dramatically over the past ten years and the gas currently accounts for about6% of the total produced in the United States. The Powder River Basin (PRB) inWyoming and Montana (Fig. 1) has emerged as one of the most active new areas of CBMproduction since 1997. Gas and water are being produced from thick coals in thePaleocene age Fort Union Formation primarily in the eastern part of the basin, althoughdevelopment is expanding to the northwest in the basin at the time of this report. Thenumber of producing wells has increased from 270 in March, 1997 to 2,469 as of March,2000 (Wyoming Oil and Gas Conservation Commission (WOGCC)). CBM productionin the same period has increased from 34,529 thousand cubic feet per day (mcf/day) toover 333,000 mcf/day (WOGCC, 2000). Estimates from State and federal officials andindustry representatives of the total number of wells expected in the basin over the next20-30 years vary from 15,000-70,000.
Water is also brought to the surface during production of coalbed methane. Thewater in coal beds contributes to pressure in the coal beds that keeps methane gasadsorbed to the coal. During production, this water is pumped to the ground surface tolower the pressure in the reservoir and stimulate desorption of methane from the coal. Aswith gas production, water production in the PRB has also increased in the three-yearperiod between 1997 and 2000 from about 130,000 barrels per day to over 1.28 millionbarrels per day (WOGCC, 2000), a ten-fold increase. As the number of CBM wellsincreases, the amount of water produced will also increase. Water production from aCBM well typically declines over the life of the well, and declining water production isanticipated and has been observed in CBM wells that have produced for several years.Decline in water production in developing areas of the basin and the basin as a whole isnot expected to occur until most of the CBM wells have been developed and produced fora number of years.
Reliable data on the composition of the water produced from the CBM wells areneeded so that State and federal land use managers can make informed decisions onhandling, disposal, and possible beneficial use of water produced with CBM. Previousstudies of water associated with coal beds in the PRB have focused on small areas nearsurface coal mines (Drever and others, 1977; Larson, 1988). Composition data ongroundwater in the Fort Union Formation presented previously (Larson and Daddow,1984) and other data acquired by the State of Wyoming Department of EnvironmentalQuality through the discharge permit process are not coal bed specific. The data mayrepresent co-mingled water from multiple coal beds and/or surface water or water fromstrata in the Fort Union Formation distinctly different from water produced from coal bedmethane wells. Compositional data for CBM water can provide information on the
2
heterogeneity of the CBM reservoirs, the potential flow paths in the Fort UnionFormation, and the source and compositional evolution of the water.
In an effort to provide a better understanding of CBM resources and associatedwater, the U.S. Geological Survey, in cooperation with the U. S. Bureau of LandManagement and coalbed methane production companies in the PRB is conductingmultidisciplinary studies in the Powder River Basin. These studies are investigatingregional geology and hydrology, coal composition, gas composition, methane desorption,and water composition. This report provides preliminary compositional data on waterfrom 47 CBM wells sampled between June, 1999 and May, 2000 in the Powder RiverBasin, Wyoming. Data on major, minor, and trace elements are included. Otheranalyses on these samples, including deuterium, oxygen, and carbon stable isotopes, anddissolved organic carbon are not yet available. Additional sampling in the basin isplanned over the next year to include other areas brought into development.
GEOLOGICAL SETTING
Powder River Basin geology is described by Ellis and others (1998), Flores andBader (1999), and Flores and others (1999) and summarized below. The Powder RiverBasin includes over 12,000 square miles (Fig. 1). It is an asymmetrical structural andsedimentary basin with an axis that trends northwest to southeast on the western side.Coalbed methane is currently produced from coal reservoirs in the Paleocene TongueRiver and Lebo Shale Members of the Fort Union Formation. The Fort Union Formationcrops out along the margin of the Powder River Basin and, in much of the study area, isoverlain by the Eocene Wasatch Formation (Fig. 1). Fort Union rocks dip an average of20 to 25 degrees to the east along the western margin of the basin, and have an averagedip of 2 to 5 degrees to the west on the eastern margin of the basin. The formationreaches a maximum of over 6,000 ft in thickness in the deepest part (along the axis) ofthe basin.
The Fort Union Formation contains conglomerate, sandstone, siltstone, andmudstone, with minor amounts of limestone, coal, and carbonaceous shale. Coal in theformation ranges from a few inches to over 200 ft thick, with an average thickness of 25ft. The Fort Union was deposited in fluvial environments that consisted of braided,meandering, and anastomosed streams in the center of the basin, and alluvial plains alongthe basin margins (Flores and others, 1999). Coal developed from peat that accumulatedin low-lying swamps and in raised or domed mires, in fluvial floodplains, abandonedfluvial channels, and interchannel environments. The thickest coal beds developed frompeat that accumulated in raised mires, which formed above drainage level (Flores andothers, 1999). The coal beds either split laterally or pinch out in areas where the peat wasincised by fluvial channels, now represented by sandstone; or was inundated withoverbank, floodplain, or floodplain-lake deposits, now represented by mudstone (Fig. 2).
The stratigraphic relationship of coal beds in the Fort Union Formation is verycomplex. The beds merge, split, and pinch out within short distances. Therefore,targeted coalbed methane beds vary across the basin (Figs. 2 and 3). Much of the CBMdevelopment is concentrated in the Wyodak-Anderson coal zone, although other beds andzones are locally being targeted as well (Fig. 3). Because of the complex stratigraphy,correlation and nomenclature problems have arisen in the basin. According to operatorcompletion reports filed with the WOGCC, the Tongue River Member coal beds
3
producing coalbed methane in the sampled wells include the Wyodak, Anderson,Canyon, Cook, Big George, Wall, and Pawnee. Two of the reservoirs, identified as theCache and Moyer, are in the Lebo Shale Member. Also, in the operator completionreports, if the name of the coal bed was not known, the operator designated the producingunit as Fort Union. In an effort to clarify some of the correlation and nomenclatureproblems, the U.S. Geological Survey is currently working with the U.S. Bureau of LandManagement and the WOGCC to standardize coalbed nomenclature (Flores, R.M.,personal communication).
METHODS
Wells were selected for water sampling according to the distribution and the ageof the wells. Sufficient time (minimum 1-2 weeks) past completion or workover isneeded to ensure that formation water uncontaminated by drilling and completion fluidsis sampled. Two wells per township were sampled to represent each producing coalseam. From June, 1999 through May, 2000, 47 wells were sampled for water (Fig. 4).Wells sampled, the date of sampling, and other pertinent information is listed in Table 1and was obtained from the WOGCC well files and drilling completion reports. Theproducing coal listed in Table 1 for each sample is the well operator’s designation (fromwell completion reports) and identification of coal seams or coal seam names may neitherbe consistent among operators nor consistent with nomenclature used by others.
Water samples were collected following guidelines of Lico and others (1988).Wells were allowed to flow through the tubing and fittings prior to collection of watersamples to ensure flushing of the sample ports and collection of a representative sample.Most wells were pumping nearly continuously so water in the well bore was constantlybeing replaced. Water was collected directly from the wellhead by attaching tygontubing to a port on the wellhead tee. The pressure on the port was generally less than 60psi. Both gas and water were expelled from the well, but the amount of gas expelled wasgenerally small relative to the amount of water. The water was allowed to collect in 5gallon buckets while flushing the well and into a clean, rinsed polyethylene carboy withspigot or directly to the filter setup during sampling. Clean sample bottles were rinsedwith well water at least twice prior to collection of a sample. For those analyses that didnot require filtering (total inorganic carbon, alkalinity, and conductivity) samples weretaken directly from the tygon tubing.
Water in the carboy was immediately filtered through a 0.1 µm polyethersulfonemembrane filter utilizing a peristaltic pump, tygon tubing, and an acrylic filter holder(Fig. 5). Polyethylene bottles for major, minor, and trace cation analyses were prewashedwith a mixture of 1.6 N nitric and 3.6 N sulfuric acid followed by a rinse with deionizedwater. Polyethylene bottles used for anions were prewashed with deionized water.Samples for major, minor, and trace cations, deuterium, oxygen, and carbon stableisotopes, and anions were collected from filtered water. The major, minor, and tracecation samples, except for mercury, were acidified with Ultrex nitric acid to a pH <2.Samples analyzed for mercury were collected in 30 mL glass bottles containing 1.5 mLof a sodium dichromate-ultrapure nitric acid mixture.
Temperature and pH were measured while the well flowed prior to collection ofsamples. The pH meter and electrode were calibrated using standard buffers before eachmeasurement. Conductivity of the water was measured at the well, but measurements
4
proved to be unreliable because of gas bubbles affecting the conductivity probe.Conductivity reported in this paper is the measured conductivity in the laboratory at 20o
C. Total alkalinity for samples was determined by titration with standard sulfuric acid assoon as possible after sample collection, generally within 8 hours of collection. Samplesfor alkalinity, anions, dissolved organic carbon, ammonia, and δ13C of bicarbonate wereplaced on ice in an ice chest in the field and transferred to a refrigerator on return to thelaboratory.
Analytical methods used in this study are described in detail in Arbogast, 1996.Major and minor cations were determined by inductively-coupled plasma atomicemission spectroscopy (ICP-AES) with duplicate samples having a mean deviationgenerally within 6 percent. Trace cations except for mercury and selenium weredetermined by inductively-coupled plasma mass spectroscopy (ICP-MS). Samplesanalyzed by ICP-AES and ICP-MS were analyzed using both prepared multi-elementstandards and standard water samples obtained from the U.S. Geological Survey NationalWater Quality Laboratory. Mercury was determined by two methods. Sixteen sampleswere analyzed using cold vapor atomic fluorescence spectroscopy having a detectionlimit of 0.005 µg/L (Crock, J., USGS, personal communication) and the remainder of thesamples were analyzed utilizing cold vapor atomic absorption spectroscopy with adetection limit of 0.1 µg/L. Selenium was determined by hydride generation atomicabsorption spectroscopy. Values of detection limits for each element are shown in Tables2 and 3. Concentrations of anions in the samples were determined by ionchromatography using a Dionex 500 chromatography system equipped with an AS-14anion exchange column and using a sodium bicarbonate-sodium carbonate eluent. Theestimated precision for the anion analyses is +/- 5 percent except for bromide whoseconcentrations are near the detection limit. Estimated precision for bromide is +/- 11percent.
RESULTS AND DISCUSSION
Parameters measured at the wellhead such as temperature and pH and the majorand minor element composition of the 47 samples are presented in Table 2. Thetemperature ranges from 13.8 to 28.7o C with a mean of 19.6o C and the pH of the waterhas a mean of 7.3 and a range of 6.8 to 7. 7. Total dissolved solids (TDS) ranges from370 to 1,940 mg/L with a mean of 840 mg/L. For comparison, the national drinkingwater standards recommendation for potable water is 500 mg/L and seawater is about35,000 mg/L. These samples suggest that TDS in waters in the Wyodak-Anderson coalzone increases from south to north and from east to west (Fig. 6). This trend may be aresult of increased water-rock interaction along a flowpath, an increase or change incomposition of the ash content of the coal, or other factors not yet recognized. Theincrease in TDS is generally a result of an increase in the sodium and bicarbonate contentof the water. The preliminary data may support other basin-wide trends in constituents.
Powder River Basin CBM water has sodium as the dominant cation andbicarbonate as the major anion with the remaining cations and anions contributing lessthan 16 percent of the TDS (Table 2, Fig. 6). The major element composition of water inthis study is in close agreement with water sampled from Tongue River Member coals inJune, 1999 by the Water Resources Division of the USGS (Bartos, T., USGS, personal
5
communication; Swanson and others, 1999). The data differ significantly from valuesreported in Larson and Daddow, 1984 for waters from the Fort Union Formation inCampbell County. In particular, many of the water analyses in Larson and Daddow havesulfate concentrations in the hundreds to thousands of mg/L, whereas sulfateconcentrations in waters from Tongue River Member coals collected in this study rangefrom <0.01 to 12 mg/L with a mean of 2.4 mg/L. As mentioned earlier, data from Larsonand Daddow may not represent water from specific coal beds or zones in the Fort UnionFormation.
Low values of sulfate in the CBM waters analyzed in this report are consistentwith water in contact with a coal reservoir that has undergone or is undergoingmethanogenesis. Sulfate concentrations in the CBM water have a direct influence on theamount of barium found in the water because barite (barium sulfate) generally controlsthe solubility of barium in most natural waters (Hem, 1992). Barium concentrations inthe water analyzed in this study are relatively high compared to most groundwaterbecause of the low sulfate concentrations. During coalification and methanogenesis,water in contact with the coals is anoxic and reducing. Elements such as iron andmanganese, which are soluble as reduced species (Fe2+ and Mn2+), have concentrationsthat are relatively high compared to surface water values as a result of the reducingenvironment. On contact with oxygen in the atmosphere at the surface, the dissolvedconcentrations of these elements may be expected to decrease significantly.
Trace element concentrations in water from the 47 CBM wells sampled in thisstudy are given in Table 3. Concentrations for most of the elements are at or belowdetection limits. All of the concentrations for elements in Table 3 are below themaximum contaminant level (MCL) given by the Environmental Protection Agency(EPA) in the Drinking Water Standards (EPA, 1996). No noticeable trends in traceelement concentrations are apparent.
ACKNOWLEDGMENTS
This study would not be possible without the cooperation of many of thecompanies and operators in the Powder River Basin who kindly gave permission tosample their coalbed methane wells and provided support in locating well sites andsometimes replumbing wellhead configurations. Thanks to Ocean Energy, BarrettResources, Pennaco Energy, CMS Energy, Hi-Pro Production, Western Gas Resources,and Big Basin Petroleum. Jim Crock of the U. S. Geological Survey Mineral ResourcesTeam kindly provided analyses of mercury in water samples by fluorescencespectroscopy.
REFERENCES
Arbogast, B. F., ed.,1996, Analytical methods manual for the Mineral Resources SurveysProgram, U. S. Geological Survey Open-File Report 96-525, 248 p.
Drever, J. I., Murphy, J. W., and Surdam, R. C., 1977, The distribution of As, Be, Cd, Cu,Hg, Mo, Pb, and U associated with the Wyodak coal seam, Powder River Basin,Wyoming: Contributions to Geology, University of Wyoming, Vol. 15, pp. 93-101.
6
Ellis, M.S., Stricker, G.D., Flores, R.M., and Bader, L.R., 1998, Sulfur and ash inPaleocene Wyodak-Anderson coal in the Powder River Basin, Wyoming andMontana: A non-sequitur to externalities beyond 2000: Proceedings of the 23rd
International Technical Conference on Coal Utilization, Clearwater, FL, March 9-13, 1998.
Flores, R.M. and Bader, L.R., 1999, Fort Union coal in the Powder River Basin,Wyoming and Montana: A synthesis: U.S. Geological Survey Professional Paper1625-A, Chapter PS, 49 p., on CD-ROM.
Flores, R.M., Ochs, A.M., Bader, L.R., Johnson, R.C., and Vogler, Daniel, 1999,Framework geology of the Fort Union coal in the Powder River Basin: U.S.Geological Survey Professional Paper 1625-A, Chapter PF, 17 p., on CD-ROM.
Hem, J. D., 1992, Study and interpretation of the chemical characteristics of naturalwater: U. S. Geological Survey Water Supply Paper 2254, 263 p.
Larson, L. R., 1988, Coal-spoil and ground-water chemical data from two coal mines;Hanna Basin and Powder River Basin, Wyoming: U.S. Geological Survey Open-file report 88-481, 18 p.
Larson, L. R. and Daddow, R. L., 1984, Ground-water-quality data from the PowderRiver structural basin and adjacent areas, northeastern Wyoming: U.S.Geological Survey Open-file report 83-939, 56 p.
Lico, M. S., Kharaka, Y. K., Carothers, W. W., and Wright, V. A., 1988, Methods forcollection and analysis of geopressured geothermal and oil field waters:Geological Survey Water Supply Paper 2194, 21 p.
Swanson, R. B., Mason, J. P., and Miller, D. T., eds., 1999, Water Resources Data,Wyoming, Water Year 1999, Volume 2, Groundwater: U. S. Geological SurveyWater-Data Report WY-99-2, 125 p.
Wyoming Oil and Gas Conservation Commission (WOGCC), 2000, On-line databaseaccessible at http://wogcc.state.wy.us.
43
Powder RiverBasin
o
44o
46o
45o
106o108 o 104 o
Sheridan
Johnson
Campbell
Converse
Big HornMT
WY
Cook
Washaki
NiobraraNatrona
Powder River
Rosebud
Weston
Custer
Carter
Fallon
Musselshell
Treasure
Miles
Tftl
Tft
Tft
Tftr
Tfu
Tw
Tw
Qal
Twr
0 20 Miles
Tertiary Wasatch FormationTertiary Tongue River Member of the Fort Union FormationTertiary Tongue River and Lebo Shale Members of the Fort Union Formationundifferentiated
Tertiary Tullock Memberof the Fort Union FormationUndifferentiatedFort Union Formation
Twr
Tftl
Tft
Tftr
Tfu
Tw
Quaternary alluvium
Tertiary White River Formation
Qal
Approximate extent of the study areaBasin axis
Cross section location
Glenrock
Sheridan
Buffalo
Kaycee
Gillette
Figure 1. Generalized geologic map of the Powder River Basin,Wyoming and Montana showing the basin axis, counties, major cities, location of cross section (fig. 2), and approximate extent of the study area (modified from Flores and Bader, 1999).
7
Coa
lSa
nds
ton
eM
udst
one
Un
diff
eren
tiat
ed s
ands
ton
e, s
ilts
ton
e,m
udst
one
and
lim
esto
ne
No
reco
rd
Wes
tEa
st5
2.6
0 M
iles
Elev
atio
n(f
eet)
3700
3100
2500
1900
1300
4900
4300
Elev
atio
n(f
eet)
3700
3100
2500
1900
1300
4900
4300
Dat
um =
Sea
Lev
el
Figu
re 2
. C
ross
sec
tion
sho
win
g an
exa
mpl
e of
the
com
plex
str
atig
raph
ic r
elat
ions
hip
of c
oal b
eds
in p
art
of t
he T
ongu
e R
iver
Mem
ber
of t
he F
ort
Un
ion
For
mat
ion
. T
his
cros
s se
ctio
n i
s in
the
cen
tral
par
t of
the
Pow
der
Riv
er B
asin
,Wyo
min
g n
ear
the
city
of
Gil
lett
e. (
Mod
ifie
d fr
om F
lore
s an
d ot
hers
, 199
9).
8
Conglomerate
Sandstone
Sandstone, siltstone,mudstone, and limestoneCoal and carbonaceousshale
0 0
1000feet
300meters
EoceneWasatch
Formation
Pale
ocen
e
Fort
Un
ion
For
mat
ion
Ton
gue
Riv
er
Mem
ber
Lebo
Sha
le
Mem
ber
Tull
ock
Mem
ber
Upper Cretaceous Lance Formation
(part)
Wyodak-Andersoncoal zone
Knoblochcoal zone
Sawyer coal
Wall coalPawnee coal
Terret coalBroadus coal
Rosebud coal zoneBrewster-Arnold coal
Burley coal
Smith (Swartz) coalAnderson (Dietz 1, 2, & 3, Big George, Sussex) coalCanyon (Monarch) coalWerner (Cook) coal
Figure 3. Composite stratigraphic column showing the Upper Cretaceous Lance Formation (part), and Tertiary Fort Union and Wasatch Formations in the Powder River Basin, Wyomingand Montana. Major coal beds and zones in the Fort Union Formation are identified. Coal zones or beds targeted for coalbed methane are bold. (Modified from Flores and Bader, 1999)
9
43
44
46
45
106108 104
0 20 Miles
Figure 4. Map showing the Powder River Basin, counties, and location of well sites sampled for this study.
Powder River Basin
MT
WY
Well sample location
Johnson
Campbell
Converse
Sheridan
Powder River
Custer
Rosebud
Big Horn
10
11
Figure 6. Distribution of total dissolved solids in water co-produced with coalbed methane from the Wyodak-Anderson coal zone. Composition of selected samples indicated by Stiff diagrams.