90
W Eff Ha Ident to inc efficie buildi in the Wate fici and ifying o crease w ency in ings, an e Arab er enc dbo opportu water u indust nd agric world cy ook unities use ry, culture k
WEffHa
Identto incefficiebuildiin the
Watefficiand
ifying ocrease wency in ings, ane Arab
er enc
dbo
opportuwater u indust
nd agricworld
cy ook
unities use ry,
culture
k

Contents FOREWORD
3
CHAPTER 1: Introduction
4
CHAPTER 2: Steps to improve water efficiency
9
CHAPTER 3: Water use efficiency in industry
29
CHAPTER 4: Water use efficiency in buildings
38
CHAPTER 5: Water use efficiency in agriculture
60
APPENDIX A: Case studies in water efficiency
71
APPENDIX B: Additional resources
83
APPENDIX C:
References 86

2
Arab Forum for Environment and Development (AFED) is a not-for-profit organization, which brings the business community together with experts, civil society and media, to promote prudent environmental policies and programmes across the Arab region. One of the main goals of AFED is propagating environmental awareness by means of supporting the role of environmental education and information and of non-governmental organizations active in the field of environment. The main product of AFED is a periodic expert report on Arab environment, tracking developments and proposing policy measures. Other initiatives include a regional Corporate Environmental Responsibility (CER) program, capacity building for Arab civil society organizations, public awareness and environmental education. This Handbook is intended for use as a water use efficiency guide for industrial, residential, and agricultural water users across the Arab region. Prepared for AFED by: Dr. Murat Mirata and Dr. Tareq Emtairah © 2010 Arab Forum for Environment and Development (AFED) P.O. Box 113-5474, Beirut, Lebanon Tel: (+961) 1 321800 Fax: (+961) 1 321900 [email protected] www.afedonline.org Published in cooperation with Technical Publications/ Al-Bia Wal Tanmia magazine. All rights reserved. No part of this book may be reproduced in any form by any electronic or mechanical means without permission in writing from AFED. ISBN: 978-9953-437-33-0
3
Foreword Water in the Arab world is a precious and limited resource. The well-being of the region’s populations and their prosperity are linked tightly to water availability and quality. In a region known for its arid climate and sparse rainfall, prudent water use is everyone’s business. There are a number of strategies to achieve water security in a sustainable manner, but none is more significant than improving water efficiency.
Despite increased stress on water resources, many water users and managers are still unaware of practical, cost-effective water efficiency improvements they can make. Strategies or plans for water efficiency are largely lacking, both in the public and private sectors.
This handbook was developed to assist water users identify and prioritize cost-effective water efficiency opportunities. It targets water use in residential and commercial buildings, industrial plants, and agricultural farms. The handbook offers practical and proven methods to cut water consumption, and water costs, without sacrificing production, reliability, or comfort. By making this handbook available, water consumers at homes and water managers at institutional buildings, industrial sites and farms will be better informed about water efficiency retrofit opportunities, and will, therefore, be better prepared to develop a plan to take advantage of water savings.
Too often, projects to improve water efficiency do not get approval because of the initial capital expenditures required for retrofits, despite the fact that up-front capital costs for financing water efficiency measures are usually recouped quickly through water savings. In fact, the return on investment in many cases is economically profitable, as demonstrated by the case studies in this handbook. In the long-run, the cost of inaction to the economy will be manifested by poor public health outcomes, lower resource productivity and pollution, to name just a few, which will far exceed the investments needed to increase water efficiency.
Making a transition to a water-efficient economy should no longer be viewed as a hard-to-reach, lofty goal. The barriers to a water-efficient economy are not technological or financial. To be sure, innovations and financing structures are indispensible to a water efficiency plan. The main impediment seems to relate to perceived attitudes. What is needed, therefore, is a firm belief in the capacity of every household and every organization to change how they consume water and take small steps to become water-efficient. This handbook expounds on the behavioral changes and practices that can be adopted.
We hope that this handbook will make a contribution to water efficiency in the Arab world, while improving the performance of its economies and institutions. Our ultimate goal is nothing short of fostering a new ethic of care and responsibility for water. Our health depends on it. Our economy depends on it. Our future depends on it. And it is the right thing to do.
Najib W. Saab Secretary General Arab Forum for Environment and Development

4
CHAPTER 1
Introduction Water stress is a global problem with far-reaching economic and social implications. At its roots lies a very basic supply-demand mismatch. While the demand for water is rising in all sectors, the quantity of good quality water that can be accessed with ease and low cost is declining. This decline is particularly rapid in the Middle East and North Africa (MENA). The MENA region is the driest region in the world. The average rainfall in Arab countries varies between 0 to 1800 mm, while the average evaporation is around 2000 mm.1 Renewable fresh water availability is already below 1000 cubic meter per person per year, compared to over 6000 worldwide. Seven countries in the region are using more water every year than is available to them, mainly by over-pumping aquifers.
Figure 1.1: Freshwater availability in Arab countries
As can also be seen in Figure 1.1, a great majority of MENA countries are already experiencing severe water scarcity and half of the people in the region already live under conditions of water stress.
1 AFED (2009). Impact of climate change on Arab countries.
5
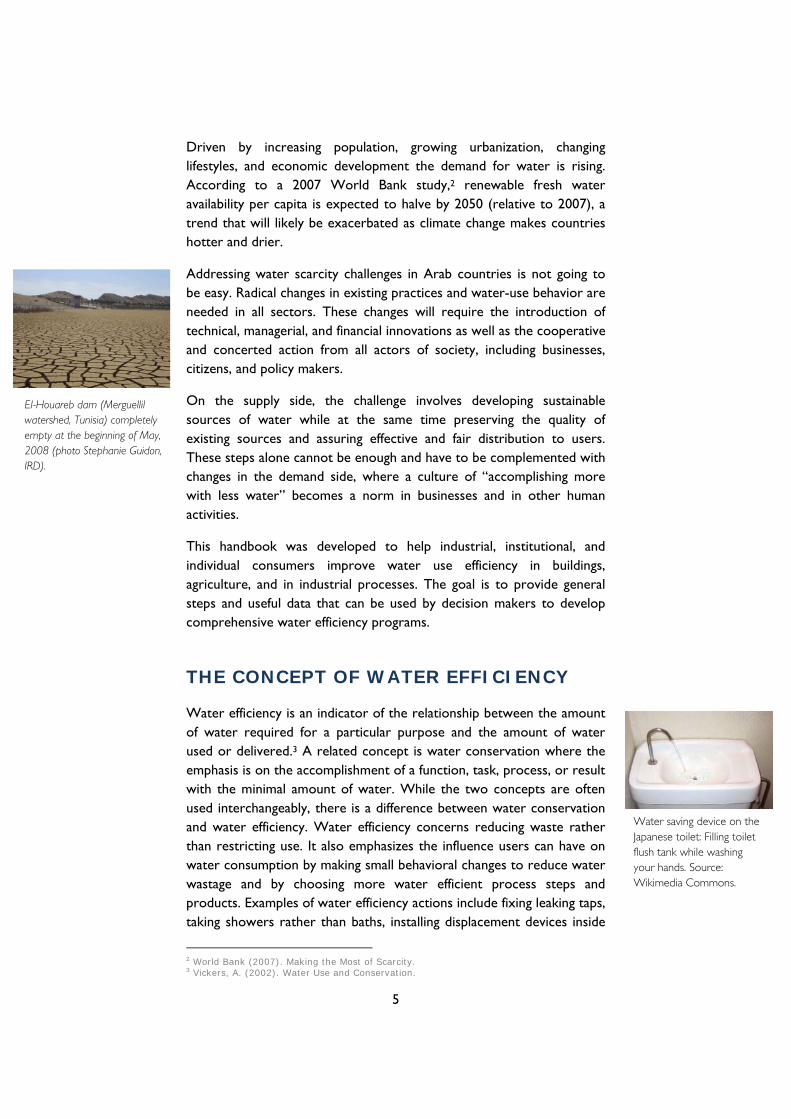
Driven by increasing population, growing urbanization, changing lifestyles, and economic development the demand for water is rising. According to a 2007 World Bank study,2 renewable fresh water availability per capita is expected to halve by 2050 (relative to 2007), a trend that will likely be exacerbated as climate change makes countries hotter and drier.
Addressing water scarcity challenges in Arab countries is not going to be easy. Radical changes in existing practices and water-use behavior are needed in all sectors. These changes will require the introduction of technical, managerial, and financial innovations as well as the cooperative and concerted action from all actors of society, including businesses, citizens, and policy makers.
On the supply side, the challenge involves developing sustainable sources of water while at the same time preserving the quality of existing sources and assuring effective and fair distribution to users. These steps alone cannot be enough and have to be complemented with changes in the demand side, where a culture of “accomplishing more with less water” becomes a norm in businesses and in other human activities.
This handbook was developed to help industrial, institutional, and individual consumers improve water use efficiency in buildings, agriculture, and in industrial processes. The goal is to provide general steps and useful data that can be used by decision makers to develop comprehensive water efficiency programs.
THE CONCEPT OF WATER EFFICIENCY
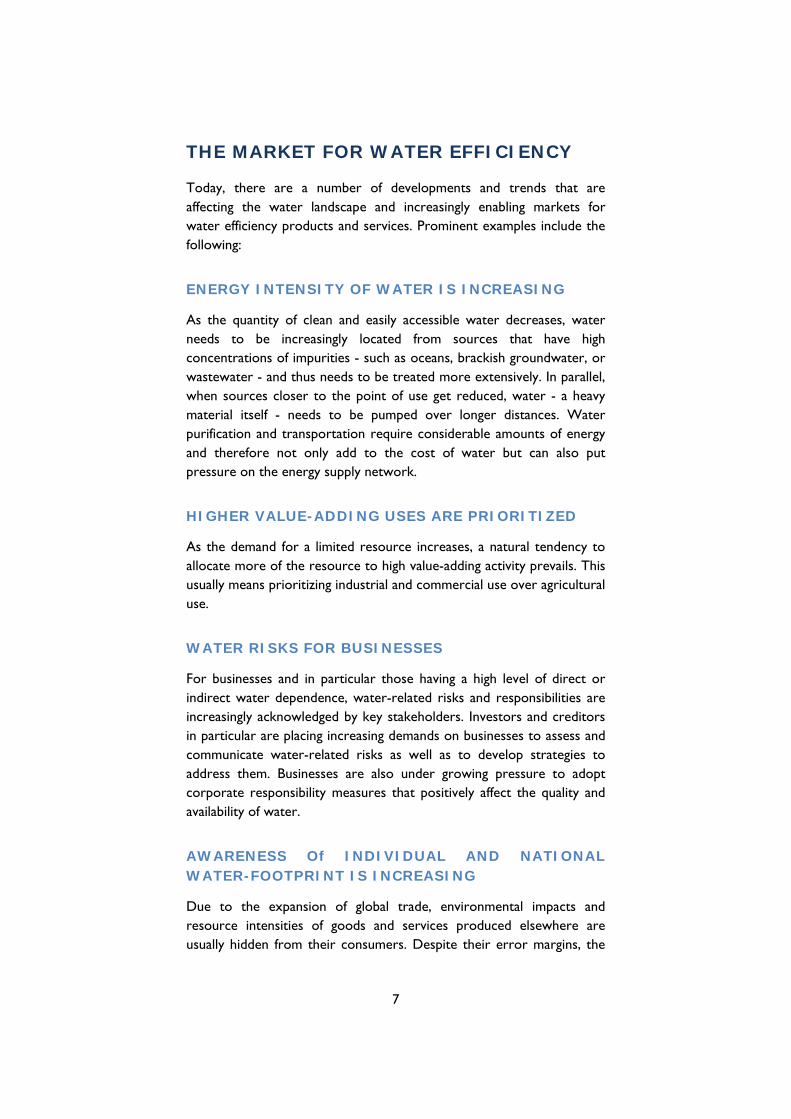
Water efficiency is an indicator of the relationship between the amount of water required for a particular purpose and the amount of water used or delivered.3 A related concept is water conservation where the emphasis is on the accomplishment of a function, task, process, or result with the minimal amount of water. While the two concepts are often used interchangeably, there is a difference between water conservation and water efficiency. Water efficiency concerns reducing waste rather than restricting use. It also emphasizes the influence users can have on water consumption by making small behavioral changes to reduce water wastage and by choosing more water efficient process steps and products. Examples of water efficiency actions include fixing leaking taps, taking showers rather than baths, installing displacement devices inside
2 World Bank (2007). Making the Most of Scarcity. 3 Vickers, A. (2002). Water Use and Conservation.
El-Houareb dam (Merguellil watershed, Tunisia) completely empty at the beginning of May, 2008 (photo Stephanie Guidon, IRD).
Water saving device on the Japanese toilet: Filling toilet flush tank while washing your hands. Source: Wikimedia Commons.

6
toilet cisterns, and using dishwashers and washing machines with full loads.
Another important dimension to water efficiency is the emphasis on closing the water cycle through recycle and reuse. For example, water discharged from one activity can be reused for the same or a similar activity. In other cases, water may not be fit to be reused in the same activity but it can be reused for another one that can tolerate lower quality water, after applying some treatment if necessary. In such cases, reuse and recycling improve water efficiency at a system level. Collectively, all these steps fall under the definition of water efficiency,
as their purpose is to obtain the desired result or level of service with the least necessary water.
RELATED CONCEPTS
Water Productivity
Water productivity is another useful measure of the amount of water used to generate an amount (or value) of product. It is typically used in assessing improvements in agricultural water productivity (water productivity in crop, livestock, and aquaculture production). However, the term is increasingly being used to measure water productivity in industrial output. For instance, we speak of the amount of water used per tons of product in comparing industrial water productivity across companies or countries. For additional information on this concept see The Stockholm Environmental Institute: www.sei.se
Water Footprint
The water footprint is an indicator of water use that incorporates a life cycle perspective in the accounting of water use by a consumer or a producer. The water footprint of an individual, community, or business is defined as the total volume of freshwater that is used to produce the goods and services consumed by the individual or community or produced by the business. For businesses, the water footprint is useful when a company wants to consider not only water use in its operations but also in the company’s supply-chain. This persepctive can be very helpful in assessing water risk for businesses. For additional information on this concept see The Water Footprint Network: www.waterfootprint.org
Virtual footprints of three common products (Source: www.fao.org).
7
THE MARKET FOR WATER EFFICIENCY
Today, there are a number of developments and trends that are affecting the water landscape and increasingly enabling markets for water efficiency products and services. Prominent examples include the following:
ENERGY INTENSITY OF WATER IS INCREASING
As the quantity of clean and easily accessible water decreases, water needs to be increasingly located from sources that have high concentrations of impurities - such as oceans, brackish groundwater, or wastewater - and thus needs to be treated more extensively. In parallel, when sources closer to the point of use get reduced, water - a heavy material itself - needs to be pumped over longer distances. Water purification and transportation require considerable amounts of energy and therefore not only add to the cost of water but can also put pressure on the energy supply network.
HIGHER VALUE-ADDING USES ARE PRIORITIZED
As the demand for a limited resource increases, a natural tendency to allocate more of the resource to high value-adding activity prevails. This usually means prioritizing industrial and commercial use over agricultural use.
WATER RISKS FOR BUSINESSES
For businesses and in particular those having a high level of direct or indirect water dependence, water-related risks and responsibilities are increasingly acknowledged by key stakeholders. Investors and creditors in particular are placing increasing demands on businesses to assess and communicate water-related risks as well as to develop strategies to address them. Businesses are also under growing pressure to adopt corporate responsibility measures that positively affect the quality and availability of water.
AWARENESS Of INDIVIDUAL AND NATIONAL WATER-FOOTPRINT IS INCREASING
Due to the expansion of global trade, environmental impacts and resource intensities of goods and services produced elsewhere are usually hidden from their consumers. Despite their error margins, the
8
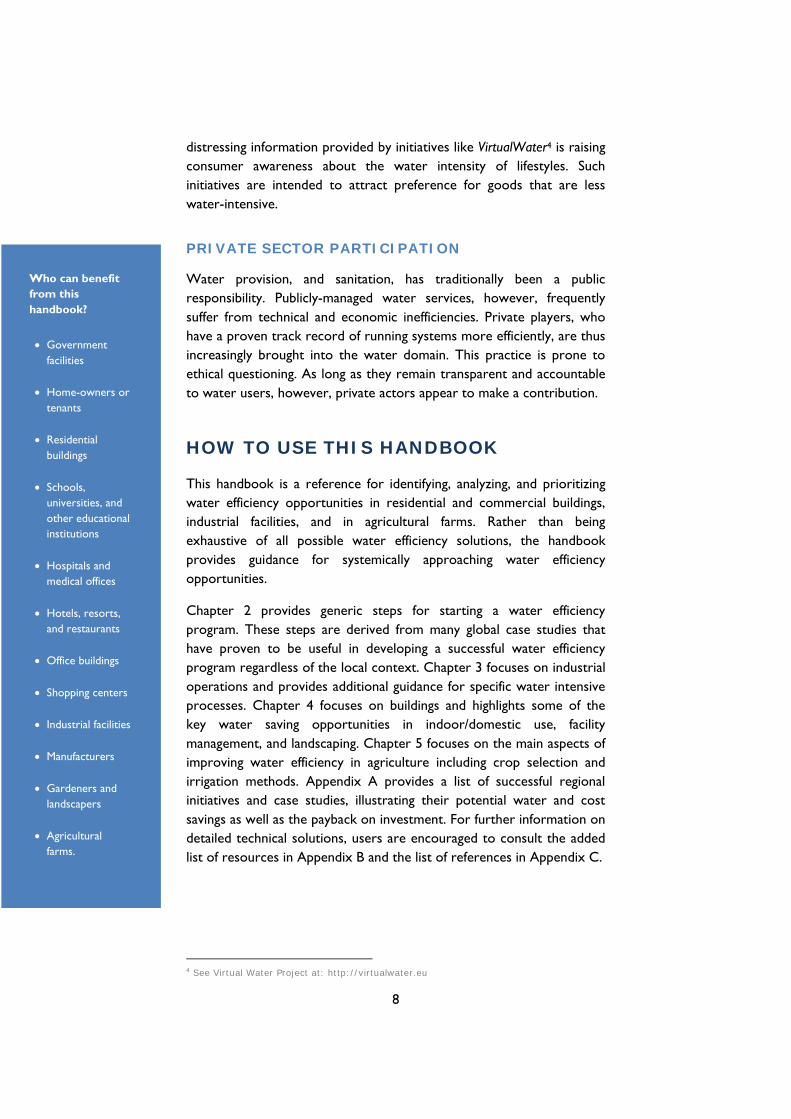
distressing information provided by initiatives like VirtualWater4 is raising consumer awareness about the water intensity of lifestyles. Such initiatives are intended to attract preference for goods that are less water-intensive.
PRIVATE SECTOR PARTICIPATION
Water provision, and sanitation, has traditionally been a public responsibility. Publicly-managed water services, however, frequently suffer from technical and economic inefficiencies. Private players, who have a proven track record of running systems more efficiently, are thus increasingly brought into the water domain. This practice is prone to ethical questioning. As long as they remain transparent and accountable to water users, however, private actors appear to make a contribution.
HOW TO USE THIS HANDBOOK
This handbook is a reference for identifying, analyzing, and prioritizing water efficiency opportunities in residential and commercial buildings, industrial facilities, and in agricultural farms. Rather than being exhaustive of all possible water efficiency solutions, the handbook provides guidance for systemically approaching water efficiency opportunities.
Chapter 2 provides generic steps for starting a water efficiency program. These steps are derived from many global case studies that have proven to be useful in developing a successful water efficiency program regardless of the local context. Chapter 3 focuses on industrial operations and provides additional guidance for specific water intensive processes. Chapter 4 focuses on buildings and highlights some of the key water saving opportunities in indoor/domestic use, facility management, and landscaping. Chapter 5 focuses on the main aspects of improving water efficiency in agriculture including crop selection and irrigation methods. Appendix A provides a list of successful regional initiatives and case studies, illustrating their potential water and cost savings as well as the payback on investment. For further information on detailed technical solutions, users are encouraged to consult the added list of resources in Appendix B and the list of references in Appendix C.
4 See Virtual Water Project at: http://virtualwater.eu
Who can benefit from this handbook? • Government
facilities • Home-owners or
tenants • Residential
buildings • Schools,
universities, and other educational institutions
• Hospitals and
medical offices • Hotels, resorts,
and restaurants • Office buildings • Shopping centers • Industrial facilities • Manufacturers • Gardeners and
landscapers • Agricultural
farms.
9
CHAPTER 2
Steps to improve water efficiency
MOTIVATE FOR CHANGE
Water efficiency is a cost-effective component of good facility management. Studies have shown that water savings can result in additional resource and cost savings in areas that include wastewater treatment, energy use, and chemical consumption. 1 However, a comprehensive water efficiency program requires managerial and financial backing from top management. Without senior management support, it is often difficult to mobilize the necessary resources and initial investments needed to kick start a water efficiency program.
A convincing case for top management support requires clear presentation of context-specific risks and opportunities associated with water use. The drivers for these risks and opportunities can vary from one country to another; however, they tend to group around regulatory conditions for water and waste regime, water supply and costs, competing demands, consumer awareness, and competitive pressures. Understanding these drivers and elaborating them can elicit and motivate top management support:
1. Cost Savings
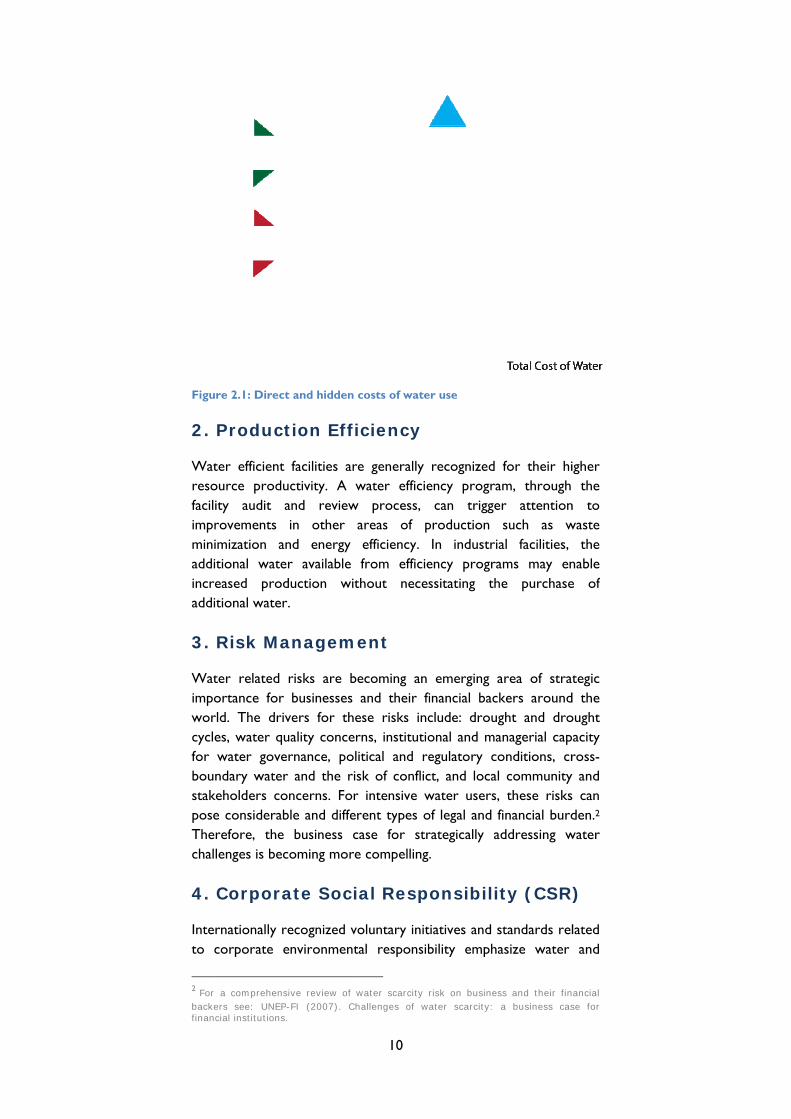
Throughout the MENA region, tariffs on water vary widely. There is no correlation between the availability of freshwater and its price. While tariffs on water constitute an important factor in determining the cost saving potential, there are other factors that make the cost saving potential more evident. In industrial and commercial facilities there can be hidden costs associated with water use such as charges on effluent water, energy costs associated with treatment or filtration, and costs related to additives and chemicals used in certain processes. Direct and hidden costs are illustrated in Figure 2.1.
1 Schultz (1999). A water conservation guide for commercial, institutional, and industrial users.
The primary reasons for management to support a water efficiency program:
1. Achieve cost savings
2. Increase resource
productivity 3. Manage risks 4. Cultivate
corporate social responsibility (CSR) practices.
Figu
2.
Watresofacilimprminiaddiincraddi
3.
Watimpoworcyclfor boustakposeThechal
4.
Inteto c
2 Forbackefinan
ure 2.1: Direct
Product
ter efficient ource produity audit arovements imization anitional wateeased proditional water
Risk Ma
ter related ortance for rld. The drives, water quwater govendary water
keholders coe considerabrefore, the lenges is bec
Corpora
rnationally rcorporate e
a comprehensers see: UNEPcial institutions
t and hidden
tion Effi
facilities aructivity. A wand reviewin other a
nd energy er available duction witr.
anagem
risks are be businesses vers for theuality concerernance, polr and the risoncerns. Forble and differ business ccoming more
ate Soci
recognized voenvironment
sive review of wP-FI (2007). Ch.
10
costs of wate
iciency
e generally water efficie
w process, areas of pefficiency. from efficie
thout neces
ent
ecoming an and their fi
ese risks incrns, institutioitical and resk of conflicr intensive wrent types ocase for stre compelling
al Resp
oluntary inittal responsib
water scarcity hallenges of w
er use
recognized ency progra
can triggeproduction In industria
ency prograssitating th
emerging ainancial backclude: drougonal and maegulatory coct, and local water users, of legal and frategically a.
onsibilit
tiatives and sbility empha
risk on businesater scarcity:
for their hiam, through r attentionsuch as w
al facilities, ams may ene purchase
area of stratkers aroundght and droanagerial caponditions, cr community these risksfinancial burdddressing w
ty (CSR
standards relasize water
ss and their fina business cas
igher the
n to waste the nable e of
tegic d the ought pacity ross- y and s can den.2
water
R)
lated and
ancial se for

resopracGloneedmanthe corp
AD
Thecomapprappreffic
Theafteract. regioinitia
ource conserctices. For inbal Reportind to providnagement in developmen
porate respo
DOPTIN
re are manymmercial androaches can roach is necciency initiati
systematic r Deming's c Some of theonal conditioating and exe
P
Iden
In
rvation as a nstance, reging Initiative (de a compre their facilitint of relevanonsibility com
NG A SY
y options and industrial f lead to sub-cessary in orve and to ac
approach wcontinual ime details in tons. The folecuting a wa
Monitor
Prioritize
ntify Imp
Secure
itial Rev
11
key dimensiional compa(GRI) guideliehensive acies. A waternt key perfommunication
YSTEMA
nd ways to facilities. Ho-optimal resrder to ensuchieve maxim
we present inprovement cthe various slowing chart
ater efficiency
Step 5
r and Im
Step 4
and Imp
Step 3
proveme
Step 2
Commite
Step 1
iew and
ion of responies attemptnes for annucounting of r efficiency pormance inds.
ATIC AP
improve waowever, unoults. Therefo
ure the succemum return o
n this handbcycle of planstages were t outlines thy program.
prove
plement
nt Option
ement
Planning
onsible corpoting to applyual reporting water use program enaicators (KPI
PROAC
ater efficiencrganized, adore, a systemess of the won investmen
book is modn, do, check,remodeled te basic steps
ns
g
orate y the g will and ables s) in
H
cy in d-hoc matic water nts.
deled , and to fit s for
WaSoncencom
ater Related KPInae Sierra, a shonter managemenmpany.
s used by opping nt
12
STEP 1
INITIAL REVIEW AND PLANNING
The main purpose of the initial review and planning is to develop a base-line understanding of water use and to draft a plan for program implementation. The findings from this stage often serve as a roadmap for subsequent stages. Keeping in mind that the success and continuity of the efficiency program greatly depends on the support and commitment of top management and employees, this stage is necessary for communicating the benefits and costs of water efficiency programs in the organization or facility. In the following we present generic activities for the initial review, while recognizing that the resources invested into these activities must be considered in light of the size and type of facility.
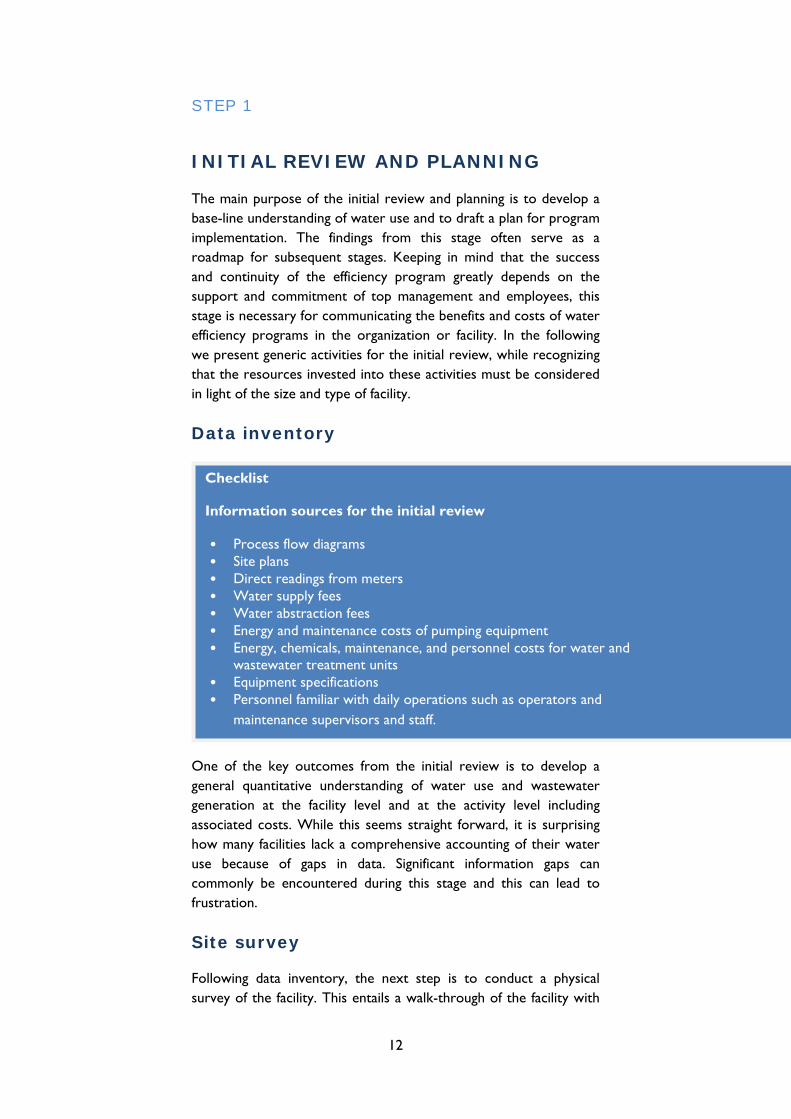
Data inventory
One of the key outcomes from the initial review is to develop a general quantitative understanding of water use and wastewater generation at the facility level and at the activity level including associated costs. While this seems straight forward, it is surprising how many facilities lack a comprehensive accounting of their water use because of gaps in data. Significant information gaps can commonly be encountered during this stage and this can lead to frustration.
Site survey
Following data inventory, the next step is to conduct a physical survey of the facility. This entails a walk-through of the facility with
Checklist
Information sources for the initial review
• Process flow diagrams • Site plans • Direct readings from meters • Water supply fees • Water abstraction fees • Energy and maintenance costs of pumping equipment • Energy, chemicals, maintenance, and personnel costs for water and
wastewater treatment units • Equipment specifications • Personnel familiar with daily operations such as operators and
maintenance supervisors and staff.

13
operations and maintenance supervisors to understand how water is used in various activities within the facility. The site survey, or water audit as referred to by some practitioners, can also generate immediate water saving opportunities such as leak detection and repair. The following is a checklist of issues to consider during a site survey.3
Initial review report
Upon completion of data inventory and site survey, it is time to collate the data into a baseline report. This report should provide a comprehensive understanding of the water cycle in the facility and associated costs. Existing data and the site survey may not provide all the necessary information to develop an accurate water balance for the facility including a breakdown of water use by activity. For these cases, there are additional instruction sheets (Sheets A-D) at the end of this chapter to assist with filling gaps in data. The instruction sheets address alternative monitoring and measurement techniques, total cost accounting, visual presentation of data, and water quality assessment.
Typically, a good baseline report should include the following:
Description of the facility, number of staff, production volumes or users (for a building), process flow diagrams for industrial facilities and functional maps for buildings.
3 Adapted from Schultz Communications (1999).
Checklist
Things to look for in a site survey
• Check how water is supplied to the site, e.g. mains, tankers, and/or borehole. Record volumes and flow rates
• On-site water storage (if any). Record storage capacity • On-site treatment (if any). Record treatment capacity • List of all equipment that uses water, including process equipment,
cooling towers, boilers, membranes, rinsing tanks, kitchen equipment, toilets, and showerheads, among others
• Check surveyed water-using equipment against your inventory data • Compare floor plans, plumbing drawings, and schematics with actual
conditions on site. Note discrepancies • Calibrate all existing water meters to ensure accuracy • Measure or estimate water use at the activity/process level including
hours of operation/use, input water, lost water, in-product water and effluents
• Involve staff who are familiar with each water-use process by asking for suggestions for improvement.

14
A water flowchart that depicts the flow of water from the facility entry point to the point of discharge, including any reuse and recycle flows (see Instruction Sheet C for visual representation of data).
Water use figures (total facility as well as a breakdown by operating areas or processes) and temporal variations (see Instruction Sheet A for filling gaps in data).
Qualitative aspects of water flow in various areas (tap water, treated, greywater).
Total cost accounting of water use in the facility (see Instruction Sheet B on how to calculate total costs).
Summary of high volume/high cost water use activities or processes.
Any additional water use observations revealed by the site survey, operations, or maintenance staff.
Plan of action with preliminary efficiency goals, responsibilities, and resources required.

15
STEP 2
SECURE COMMITEMENT & ENGAGEMENT
Achieving water efficiency requires a collective effort and demands support from within the organization. Top management, building owners, functional managers, and employees are particularly important.
Particularly in industrial facilities, getting TOP MANAGEMENT to have a good understanding of the objectives of water efficiency programs is key to securing high-level commitment. Top management should demonstrate support for the implementation plan by explicitly communicating its commitment to the program − by issuing a water productivity policy or including water use among the key performance indicators − and assigning direct responsibilities for the implementation of the plan.
Water efficiency work may have implications on other functions − production, maintenance, research and development (R&D), purchasing, and even marketing − and will demand their cooperation. Thus, it is also important to inform and engage LINE
MANAGERS in water productivity work.
Finally, EMPLOYEES AND MAINTAINCE STAFF are a crucial group whose involvement in the program is crucial. For one, employees will be counted on to incorporate and implement water efficiency measures in their daily routines. Equally important, however, is the fact that employees often act as an important source of useful ideas for efficiency gains. Therefore, starting from the early stages of conception, employees should be tightly involved in the program. Incentive schemes that reward employees for their contributions to water-saving measures are often highly effective in keeping their engagement level high.
ST
ID
Oncorgaimpriden
Wa
Themeaopti
Figu
In achecefficalterques
EP 3
DENTIFY
ce the quantanization arerovements.
ntifying and r
aste min
hierarchy asures and oons based o
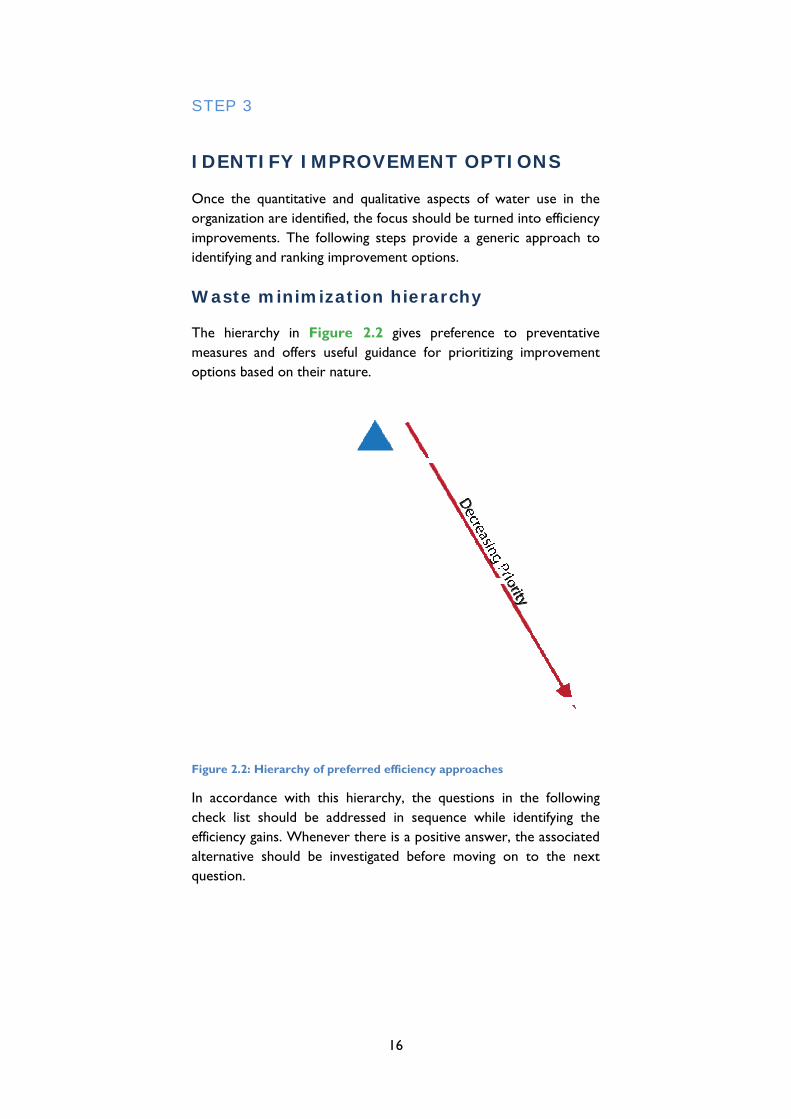
ure 2.2: Hiera
accordance wck list shouciency gains. rnative shoustion.
Y IMPR
titative and e identified, tThe followin
ranking impro
nimizati
in Figure offers usefuln their natur
rchy of prefer
with this hield be addreWhenever t
uld be inves
16
OVEME
qualitative athe focus shong steps proovement opt
ion hier
2.2 gives guidance fore.
rred efficienc
erarchy, theessed in seqthere is a postigated befo
NT OPT
aspects of would be turneovide a genetions.
archy
preference or prioritizin
cy approaches
e questions quence whileositive answeore moving
TIONS
water use ined into efficieric approac
to preventng improvem
s
in the folloe identifyinger, the associ
on to the
n the ency
ch to
ative ment
wing g the iated next
17
Knowledge of best practices
In identifying the improvement options, reviewing best practices
applicable to water intensive areas can be very useful in the early stages. A resource list is available at the end of the handbook and examples of good practices are presented in chapters 3, 4, and 5, and in Appendix A.
Inventory of improvement options
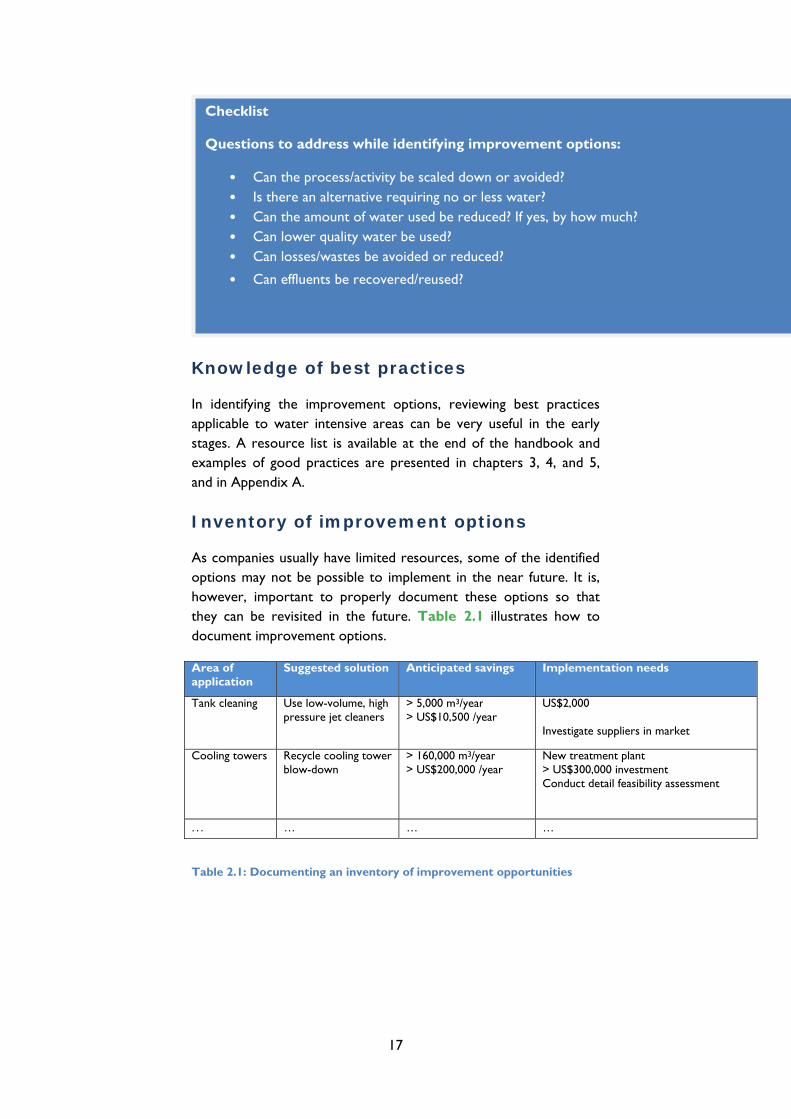
As companies usually have limited resources, some of the identified options may not be possible to implement in the near future. It is, however, important to properly document these options so that they can be revisited in the future. Table 2.1 illustrates how to document improvement options.
Area of application
Suggested solution Anticipated savings Implementation needs
Tank cleaning Use low-volume, high pressure jet cleaners
> 5,000 m3/year > US$10,500 /year
US$2,000 Investigate suppliers in market
Cooling towers Recycle cooling tower blow-down
> 160,000 m3/year > US$200,000 /year
New treatment plant > US$300,000 investment Conduct detail feasibility assessment
... … … …
Table 2.1: Documenting an inventory of improvement opportunities
Checklist
Questions to address while identifying improvement options:
• Can the process/activity be scaled down or avoided? • Is there an alternative requiring no or less water? • Can the amount of water used be reduced? If yes, by how much? • Can lower quality water be used? • Can losses/wastes be avoided or reduced?
• Can effluents be recovered/reused?

18
STEP 4
PRIORITIZE AND IMPLEMENT
More often, the resources available for efficiency improvements are limited. Therefore, the best cost to benefit ratio needs to be identified prior to implementation of measures.
In such assessments, financial outlook of the options tend to be the overriding factor. The concept of “return on investment” can be used to assess the financial performance.
Clearly, those options that offer a higher RoI need to be prioritized for implementation. In making these assessments, direct and hidden benefits of water savings should be calculated as discussed earlier (see Figure 2.1). In other words, in addition to savings in purchase and effluent discharge costs, reduced costs of energy, chemicals use, maintenance, and labor requirements need to be taken into consideration.
In industrial facilities, there are other aspects that can significantly affect the costs and benefits linked to water efficiency investments. These aspects have to be carefully assessed at this stage. Examples of these include:
Product quality, safety, and process stability Proposed improvement options may have a positive or negative impact on product quality, process stability, and workplace or user safety. While positive influences can result in additional benefits, negative ones may be linked to prohibitively large risks. After all, as important as water saving might be, it should not override product quality or safety concerns.
Effect on long-term risks In some cases identified improvements can be highly important for avoiding future risks − linked to, for example, anticipated regulations or conflicts with business partners or customers. These are important to take into consideration and can tilt the decision in
Return on Investment (RoI)
Return on Investment (RoI) = Benefits − Costs*
Investment
* All benefits and costs over the service life of investment.

19
their favor, particularly if their benefits can be expressed in monetary terms.
Internal Competencies The implementation of efficiency improvement projects adds to the learning capabilities of organizations. These projects provide opportunities for employees to acquire new competencies and develop new skills. In this sense, disruption to work flow should be welcomed as an avenue for professional development and employee retention.
Checklist
Priority categorization of improvement opportunities:
• Measures to implement as quickly as possible because they are cost-neutral or have a quick payback
• Measures to be further evaluated before a decision is taken • Measures that are currently not cost-effective but should be re-
considered in a one-year time.
20
STEP 5
MONITOR AND IMPORVE
Once efficiency improvements are installed, staff should have in-place monitoring measures to assess whether or not the planned performance targets are met. If the observed performance is below target, staff should conduct investigations to explain the mismatch before taking corrective measures.
It is important to point out that water efficiency programs should not be treated as a one-time product or event. Rather efficiency should become an integral part of the culture inside the organization. Cultivating and nurturing this mindset in operations takes time. Communicating the results of the first set of improvement measures can create a leverage to initiate the next set of measures, which will slowly and surely put the organization on the path to becoming a water efficient entity.
WIDER ADOPTION OF THE SYSTEMIC APPROACH
Although some individual companies, motivated by economic incentives, apply a systemic approach to water efficiency, a large-scale adoption usually needs to be stimulated. Some factors that have proven to be effective in stimulating water efficiency in Western countries include:
• Stricter effluent discharge standards • Demands from clients and business partners • Informational and educational programs by governments • Mandated water efficiency audits for facility and operational
permits.
INS
MOFL
Thedeveneedline ampdeclregaprog
WhneceINDI
MOB
use mengooHendata
Indir
Dir
For monOnctemin thnot US$be num
STRUCTI
ONITORLOWS
initial revieelop a good d to introdu with ’WHAT
ple evidenceline in watearded by mogress.
ere requiredessary to peIRECTLY. DirBILE WATER of simple e
ntioned that d decisions
nce, it is impa generation
rect determi
Calculat Estimati Using m Studying
rect me
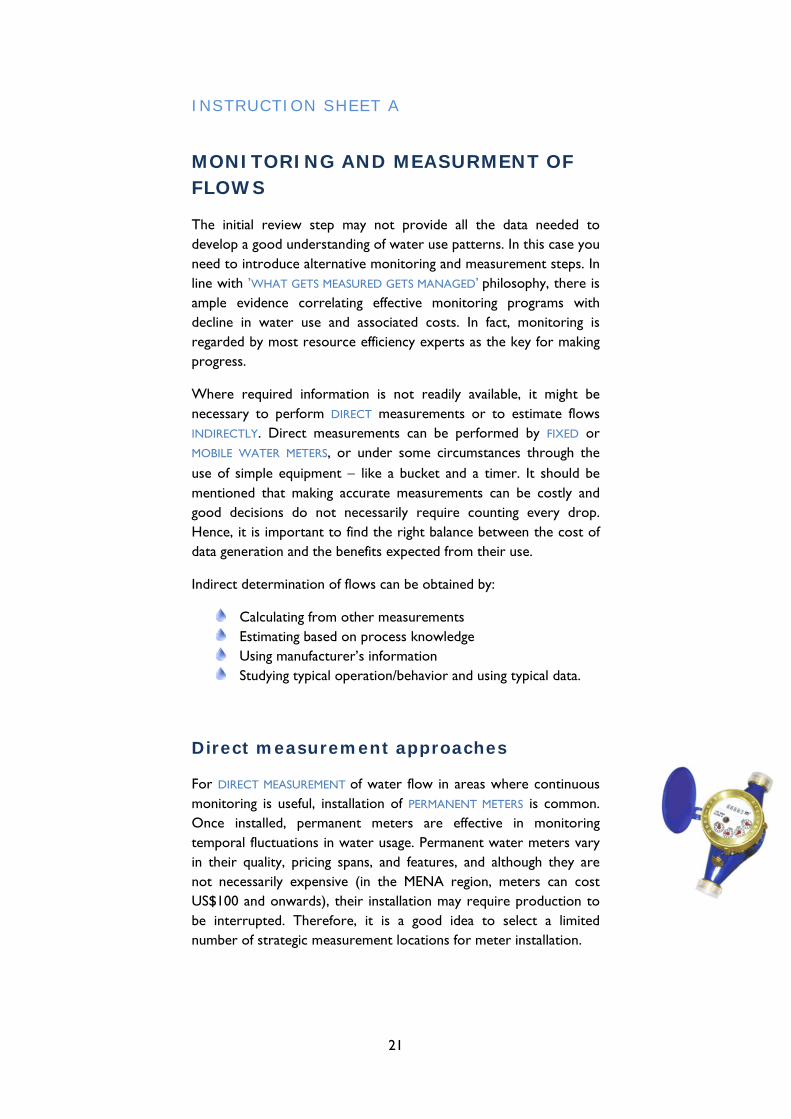
DIRECT MEA
nitoring is usce installed,poral fluctuaheir quality, necessarily $100 and onwinterrupted.
mber of strate
ION SHE
RING A
ew step maunderstandince alternativ
T GETS MEASU
e correlatinger use and ost resource
d informatioerform DIREC
rect measureMETERS, or quipment − making acc do not ne
portant to fin and the ben
ination of flo
ting from othng based on
manufacturer’g typical ope
asurem
ASUREMENT oseful, installa permanentations in wat pricing spaexpensive (
wards), thei Therefore, egic measure
21
EET A
ND MEA
ay not provng of water uve monitorinURED GETS MA
g effective associated c efficiency ex
on is not reCT measureements can under some like a buckecurate measuecessarily rend the right efits expecte
ows can be o
her measure process kno’s informatioration/behav
ent app
of water flowation of PERM
t meters ater usage. Pens, and feat(in the MENr installation it is a gooement locati
ASURME
vide all the use patternsg and measuANAGED’ phimonitoring
costs. In facxperts as the
eadily availaments or to be performe circumstanet and a timurements caquire countbalance betwed from thei
obtained by:
ments owledge on vior and usin
proaches
w in areas wMANENT MET
are effectiveermanent waures, and al
NA region, mn may requirod idea to ons for mete
ENT OF
data needes. In this caseurement steplosophy, theprograms
ct, monitorine key for ma
ble, it migho estimate fmed by FIXED
nces throughmer. It shoulan be costlyting every dween the cor use.
g typical data
s
where continTERS is comme in monitoater meters though theymeters can re productioselect a lim
er installatio
F
d to e you ps. In ere is with
ng is aking
t be flows D or h the d be
y and drop. ost of
a.
uous mon. oring vary y are cost
on to mited n.
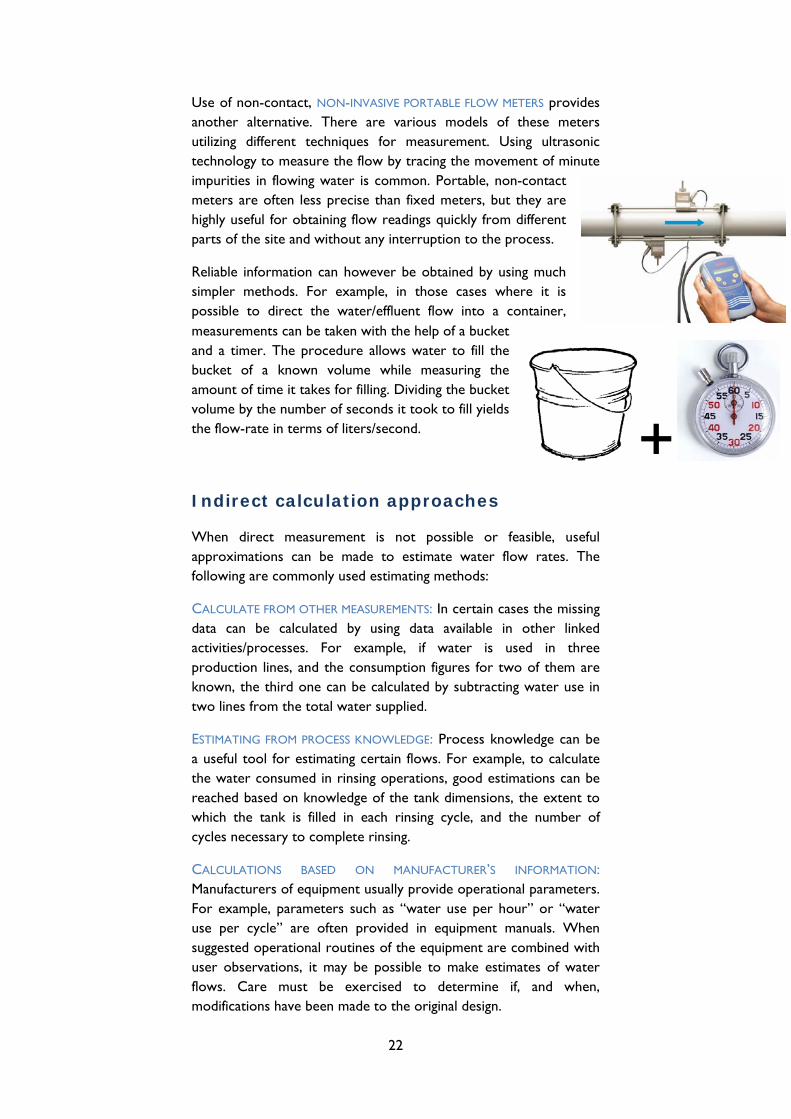
Useanotutiliztechimpumethighpart
Reliasimppossmeaand buckamovoluthe
Ind
Whapprfollo
CAL
dataactivprodknowtwo
ESTI
a usthe reacwhiccycl
CAL
ManFor use sugguserflowmod
of non-contther alternazing differenhnology to murities in floters are oftehly useful forts of the site
able informapler methodsible to direasurements c a timer. Thket of a knount of time ume by the nflow-rate in
direct c
en direct mroximations owing are co
LCULATE FRO
a can be cavities/procesduction lineswn, the thir
o lines from t
MATING FRO
seful tool forwater consu
ched based och the tank es necessary
LCULATIONS
nufacturers o example, paper cycle”
gested operar observatio
ws. Care mdifications ha
tact, NON-INative. There nt technique
measure the owing water en less precisr obtaining fl and without
ation can hods. For examect the watcan be taken he procedurenown volum it takes for fnumber of se terms of lite
alculati
measuremen can be ma
ommonly use
M OTHER MEA
alculated bysses. For es, and the cod one can bthe total wat
OM PROCESS K
r estimating umed in rinson knowledg is filled in y to complet
BASED O
of equipmentarameters suare often p
ational routinns, it may b
must be exave been mad
22
NVASIVE PORT
are varioues for meaflow by tracis common.se than fixedow readingst any interru
owever be omple, in thoter/effluent f with the hee allows watme while mfilling. Dividi
econds it tooers/second.
on appr
nt is not pade to estimed estimating
ASUREMENTS
y using dataexample, if onsumption be calculatedter supplied.
KNOWLEDGE
certain flowsing operatioge of the taneach rinsinge rinsing.
ON MANU
t usually prouch as “wateprovided in nes of the eqbe possible txercised to de to the or
TABLE FLOW
us models oasurement. Uing the mov. Portable, nd meters, bus quickly froption to the
obtained by uose cases wflow into a lp of a bucketer to fill th
measuring thng the bucke
ok to fill yield
roaches
possible or mate water g methods:
: In certain ca available
water is figures for t by subtract
E: Process knws. For examons, good estnk dimensiong cycle, and
FACTURER’S
vide operatier use per h equipment quipment areto make est
determine iginal design.
METERS provof these meUsing ultrasement of mi
non-contact ut they are m different process.
using much where it is container, et he he et ds
feasible, uflow rates.
cases the miin other linused in t
two of themting water us
nowledge cample, to calcutimations cans, the extend the numbe
INFORMAT
onal paramehour” or “wmanuals. W
e combined timates of w if, and w.
vides eters sonic inute
seful The
ssing nked three m are se in
an be ulate
an be nt to er of
TION: eters. water When with
water when,
++

23
STUDYING TYPICAL OPERATION/BEHAVIOR AND USING TYPICAL DATA: This method can be particularly useful in estimating flows for distributed uses - such as water consumed for toilets and showers. Based on average number of utilization and average specific consumption figures, reasonable approximations can be made. For example, if there are 120 employees working in three shifts, and two thirds of the employees are taking a shower for five minutes after their shift, and if the installed showers consume about 15 liters per minute, daily water consumption for showers is likely to be around 6,000 liters/day.
24
INSTRUCTION SHEET B
TOTAL WATER COST ACCOUNTING
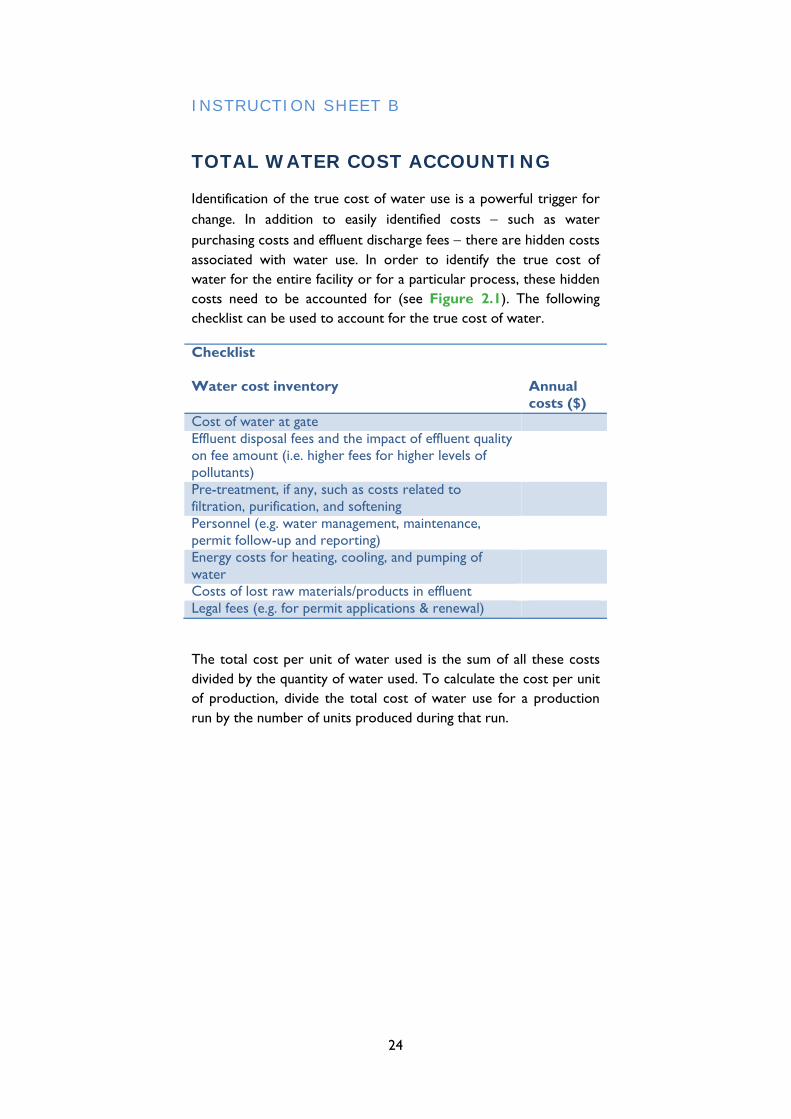
Identification of the true cost of water use is a powerful trigger for change. In addition to easily identified costs − such as water purchasing costs and effluent discharge fees − there are hidden costs associated with water use. In order to identify the true cost of water for the entire facility or for a particular process, these hidden costs need to be accounted for (see Figure 2.1). The following checklist can be used to account for the true cost of water.
Checklist Water cost inventory
Annual costs ($)
Cost of water at gate Effluent disposal fees and the impact of effluent quality on fee amount (i.e. higher fees for higher levels of pollutants)
Pre-treatment, if any, such as costs related to filtration, purification, and softening
Personnel (e.g. water management, maintenance, permit follow-up and reporting)
Energy costs for heating, cooling, and pumping of water
Costs of lost raw materials/products in effluent Legal fees (e.g. for permit applications & renewal)
The total cost per unit of water used is the sum of all these costs divided by the quantity of water used. To calculate the cost per unit of production, divide the total cost of water use for a production run by the number of units produced during that run.
INS
VIUS
MondailyTheundefacilofteThisaddirele
It iseasygrappart
Tim
Figucons
GraFigu
23
4
5(m
STRUCTI
ISUAL CSE DATA
nitoring meay, weekly, an purpose iser different ity. The opt
en collections data needsition, water vant data to
s often desiry-to-understaphs over a titicularly usef
me serie
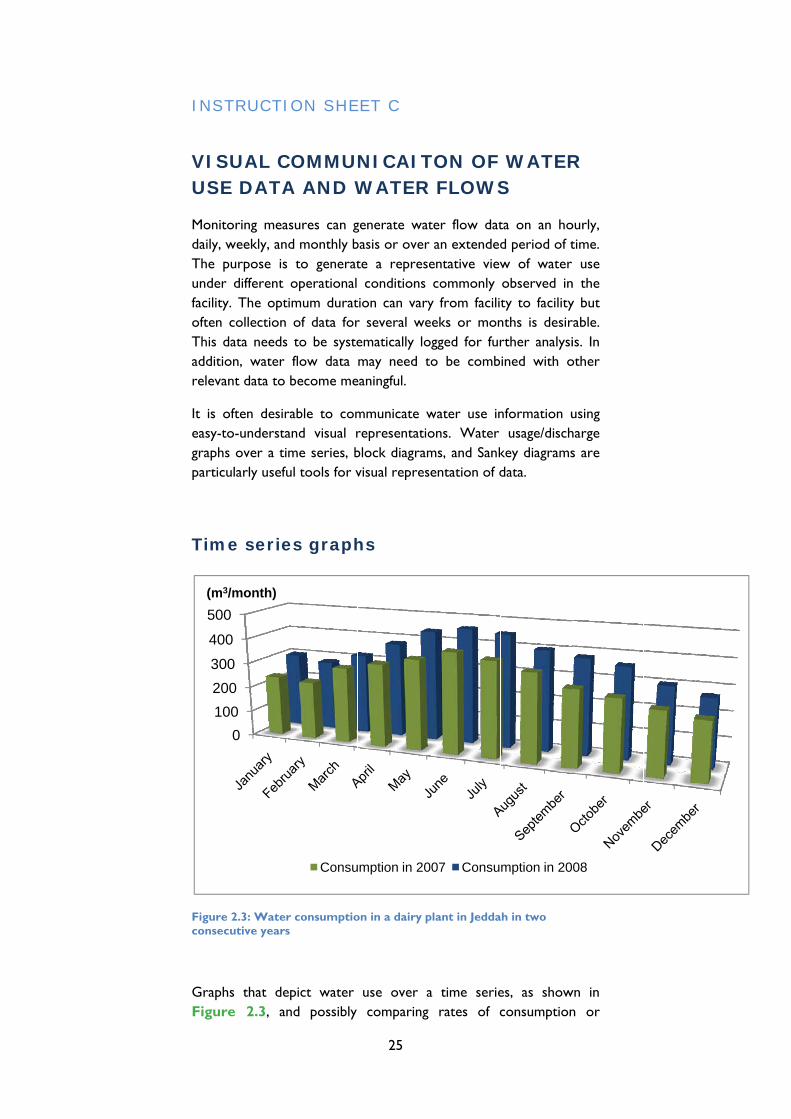
ure 2.3: Watesecutive years
phs that deure 2.3, a
0100200300
400
500m3/month)
ION SHE
COMMUA AND W
asures can gnd monthly bs to generat operationaltimum durat of data for
s to be syste flow data become me
rable to comand visual rime series, bul tools for v
es graph
r consumptios
epict water nd possibly
Consu
25
EET C
NICAITWATER
generate watbasis or overte a represe conditions
tion can varyr several weematically lomay need t
eaningful.
mmunicate wrepresentatioblock diagramvisual repres
hs
on in a dairy p
use over a comparing
umption in 20
TON OF R FLOWS
ter flow datr an extendedentative viewcommonly
y from facilieeks or monogged for furto be comb
water use inons. Water ms, and Sanksentation of d
plant in Jedda
a time serie rates of c
007 Consu
WATERS
ta on an hod period of tw of waterobserved inty to facilitynths is desirrther analysiined with o
nformation u usage/dischkey diagramsdata.
ah in two
es, as showconsumption
mption in 20
R
ourly, time. r use n the y but rable. is. In other
using harge s are
wn in n or
08
26
effluent generation over time, help to visually understand fluctuations. This data often needs to be combined with other information − such as production volume, product type, number of employees/operators, or ambient air temperature − to enable a meaningful analysis.
Block diagrams
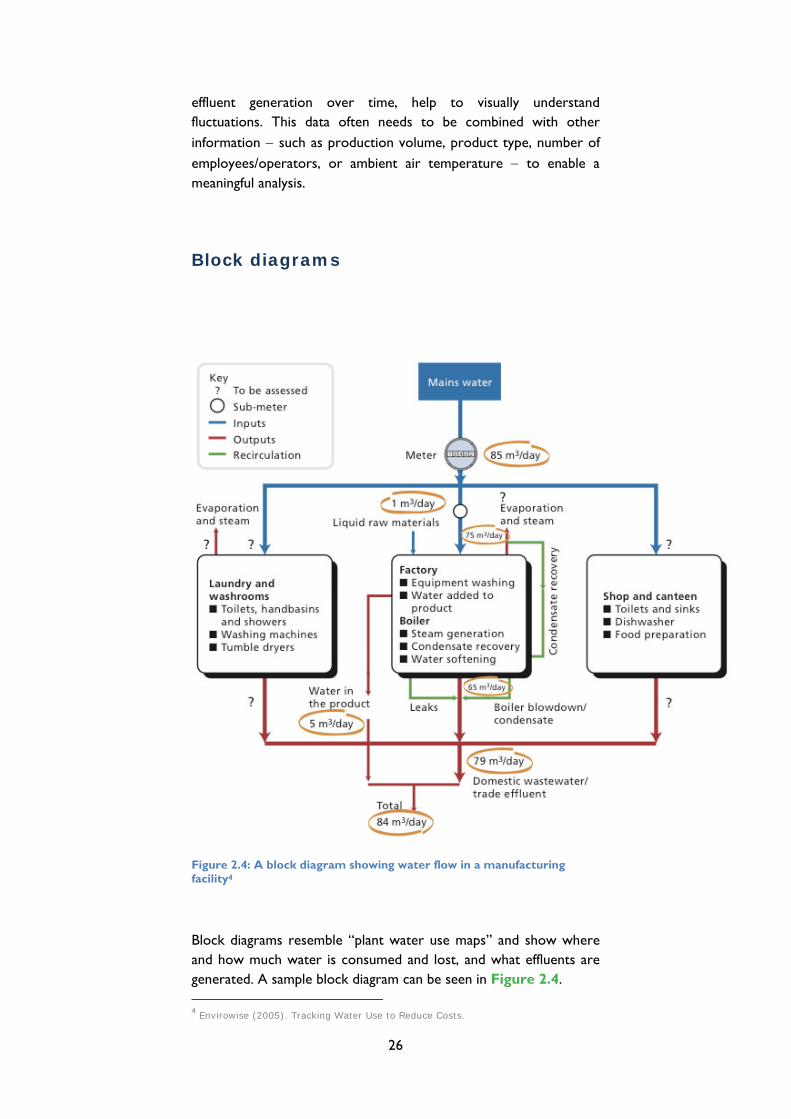
Figure 2.4: A block diagram showing water flow in a manufacturing facility4
Block diagrams resemble “plant water use maps” and show where and how much water is consumed and lost, and what effluents are generated. A sample block diagram can be seen in Figure 2.4. 4 Envirowise (2005). Tracking Water Use to Reduce Costs.
27
Sankey diagrams
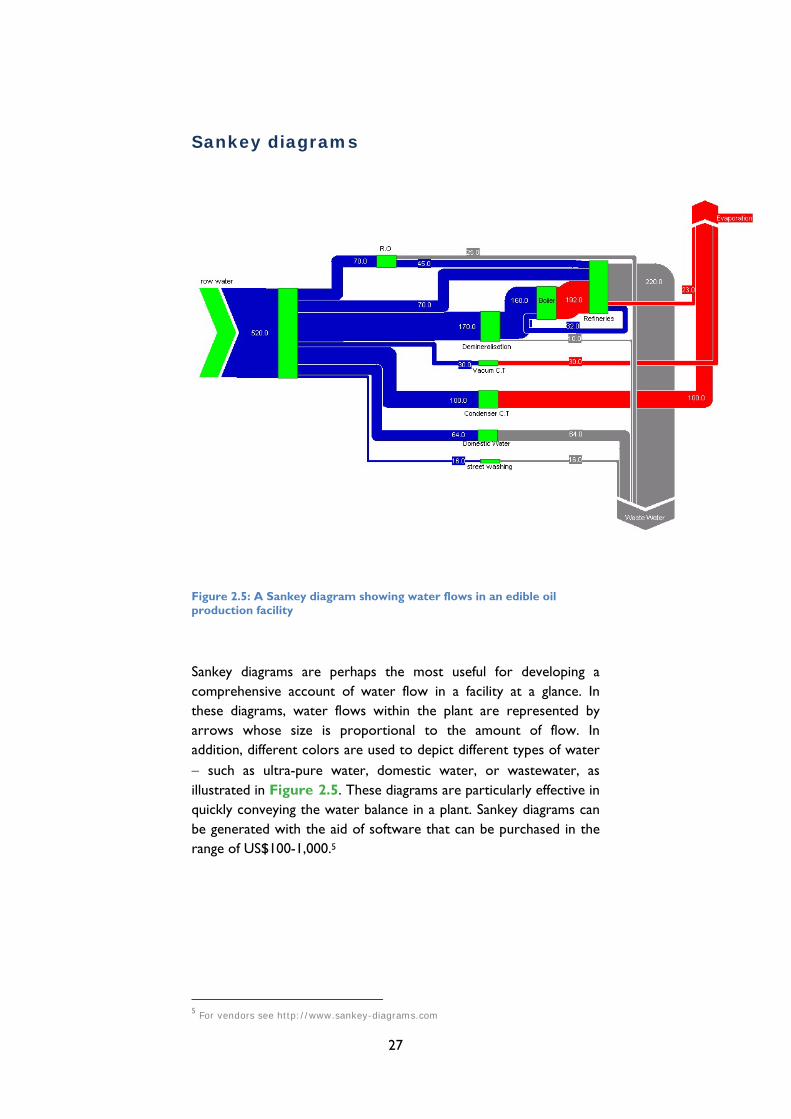
Figure 2.5: A Sankey diagram showing water flows in an edible oil production facility
Sankey diagrams are perhaps the most useful for developing a comprehensive account of water flow in a facility at a glance. In these diagrams, water flows within the plant are represented by arrows whose size is proportional to the amount of flow. In addition, different colors are used to depict different types of water − such as ultra-pure water, domestic water, or wastewater, as illustrated in Figure 2.5. These diagrams are particularly effective in quickly conveying the water balance in a plant. Sankey diagrams can be generated with the aid of software that can be purchased in the range of US$100-1,000.5
5 For vendors see http://www.sankey-diagrams.com
28
INSTRUCTION SHEET D
WATER QUALITY ASSESSMENT FOR RECYCLING AND REUSE
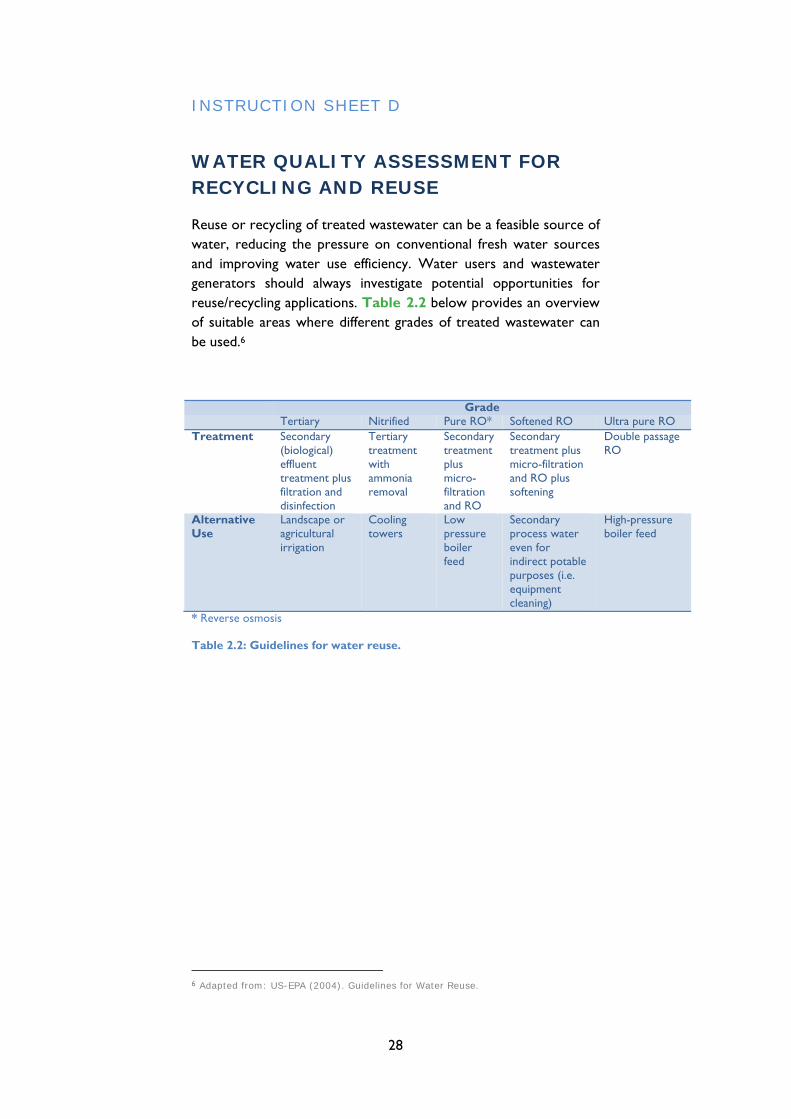
Reuse or recycling of treated wastewater can be a feasible source of water, reducing the pressure on conventional fresh water sources and improving water use efficiency. Water users and wastewater generators should always investigate potential opportunities for reuse/recycling applications. Table 2.2 below provides an overview of suitable areas where different grades of treated wastewater can be used.6
Grade Tertiary Nitrified Pure RO* Softened RO Ultra pure RO Treatment Secondary
(biological) effluent treatment plus filtration and disinfection
Tertiary treatment with ammonia removal
Secondary treatment plus micro- filtration and RO
Secondary treatment plus micro-filtration and RO plus softening
Double passage RO
Alternative Use
Landscape or agricultural irrigation
Cooling towers
Low pressure boiler feed
Secondary process water even for indirect potable purposes (i.e. equipment cleaning)
High-pressure boiler feed
* Reverse osmosis
Table 2.2: Guidelines for water reuse.
6 Adapted from: US-EPA (2004). Guidelines for Water Reuse.

29
CHAPTER 3
Water use efficiency in industry
THE WATER SAVING POTENTIAL
Industry’s share of overall water use in the Arab world is relatively small. However, following similar trends in the agricultural and municipal sectors, industrial demand for water is also rising. In parallel, there is an increased understanding of the negative impact of industrial pollution on water resources. Consequently, the industrial sector will be competing for access to water while pressures on the sector to protect water resources from pollution are mounting. The consequences of responsible or irresponsible use of water resources are increasingly becoming strategically important.
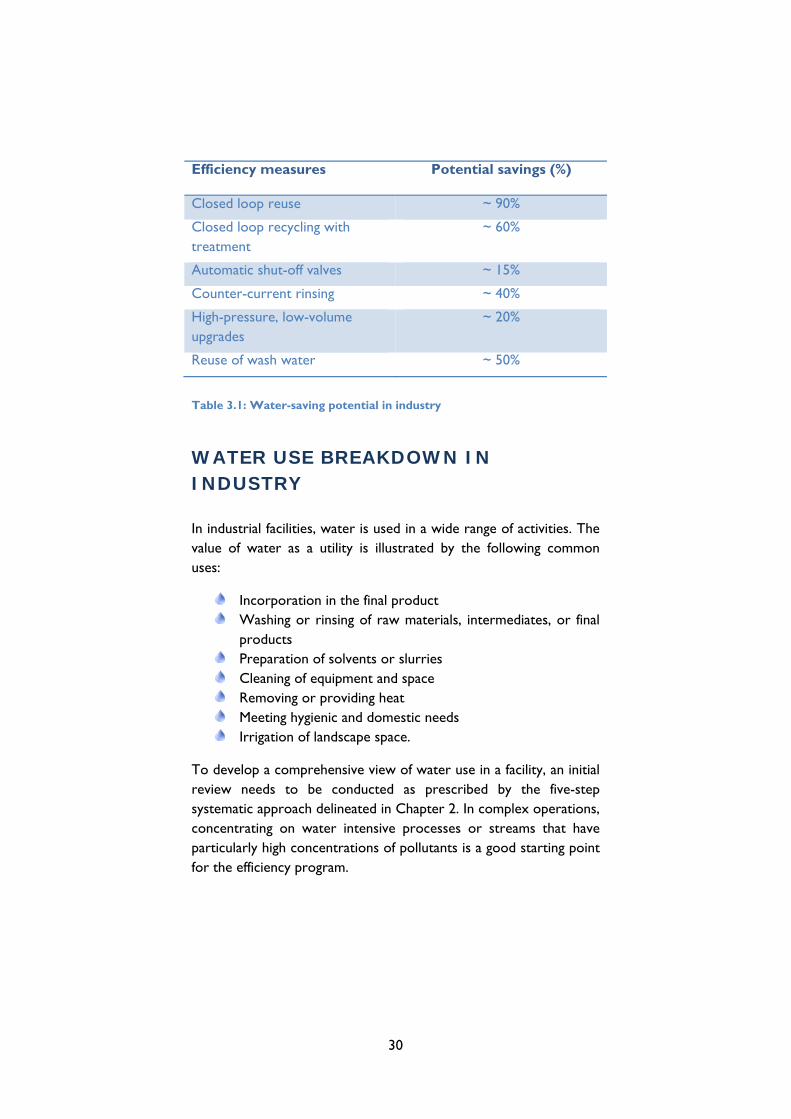
Industrial facilities have a good potential for raising their water efficiency rates. Experience from around the world shows that adopting a systematic approach to water efficiency often results in reduced water consumption by 20-50%, and up to 90% when more advanced measures are implemented. Table 3.1 lists a number of industrial efficiency measures and their associated water-saving potential.
Although there is a growing awareness of the strategic importance of water, the number of industries in the MENA region that manage water in a systemic and holistic way is limited. Water management in the majority of industries is limited to ensuring the provision of water. In some instances there are efforts to control or treat effluents. In rare cases where water efficiency efforts are implemented, they tend to be unorganized and ad hoc, often leading to sub-optimal results. These disappointing results may make management more inclined to withhold its support for any future efficiency projects. In short, potential exists within the industrial sector in the Arab region to substantially boost water productivity.
By improving water efficiency, industry can:
• Safeguard its license to operate
• Reduce
purchasing, treatment, and discharge costs
• Avoid disruptions
in production • Demonstrate
social responsibility.
30
Efficiency measures Potential savings (%)
Closed loop reuse ~ 90%
Closed loop recycling with treatment
~ 60%
Automatic shut-off valves ~ 15%
Counter-current rinsing ~ 40%
High-pressure, low-volume upgrades
~ 20%
Reuse of wash water ~ 50%
Table 3.1: Water-saving potential in industry
WATER USE BREAKDOWN IN INDUSTRY
In industrial facilities, water is used in a wide range of activities. The value of water as a utility is illustrated by the following common uses:
Incorporation in the final product Washing or rinsing of raw materials, intermediates, or final
products Preparation of solvents or slurries Cleaning of equipment and space Removing or providing heat Meeting hygienic and domestic needs Irrigation of landscape space.
To develop a comprehensive view of water use in a facility, an initial review needs to be conducted as prescribed by the five-step systematic approach delineated in Chapter 2. In complex operations, concentrating on water intensive processes or streams that have particularly high concentrations of pollutants is a good starting point for the efficiency program.

31
Figure 3.1: Water use in industry
Figure 3.1 is a diagram of water use typical for an industrial facility. The breakdown of water flows by process steps requires identifying and measuring quantitative and qualitative parameters for water used and lost as well as for any effluents generated. The following checklist suggests a number of questions to consider during the initial review and monitoring steps.
Checklist
Find answers to the following questions for every major water-using process or area:
• How much water is entering the process/area? • What is the quality of the water at the point of entry? • What is the cost of bringing the water to this process/area? • How much of the water entering the process/area is being incorporated into the final product? How much is rejected with effluent streams? • What are water losses to air and soil? • What are the characteristics of the effluent streams?
• What is the cost of managing the effluents?
32
COMMON APPROACHES TO WATER EFFICIENCY IN INDUSTRY
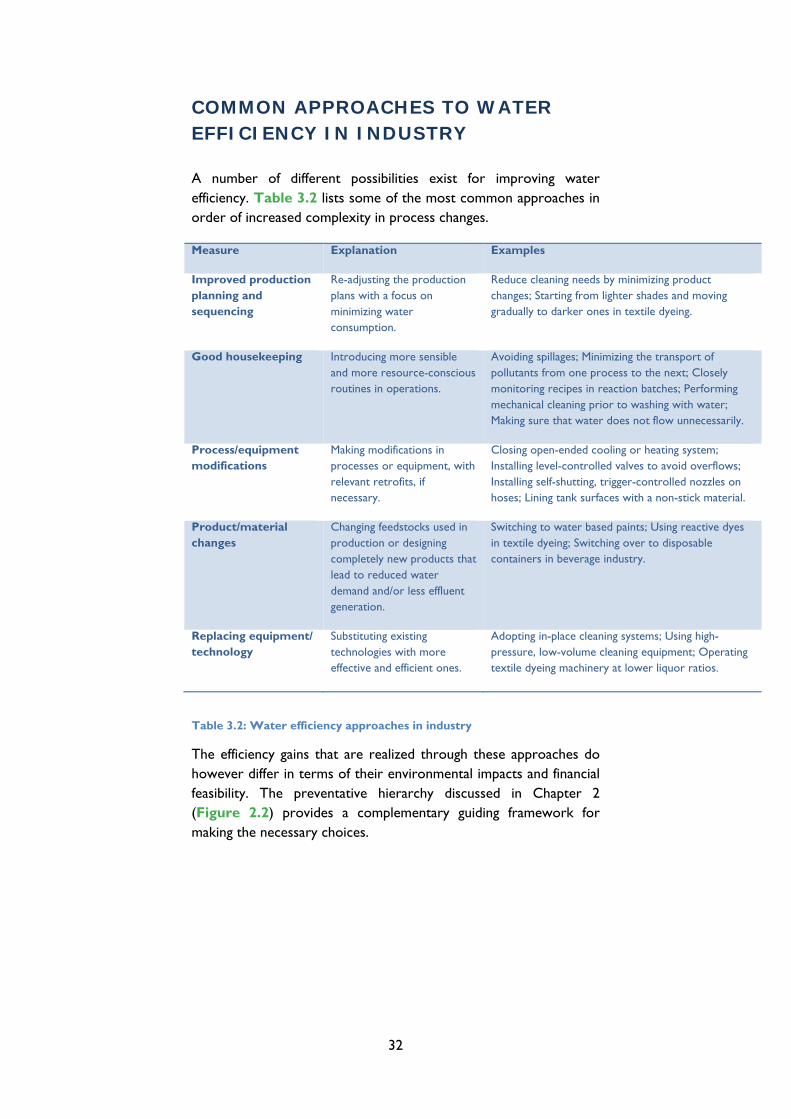
A number of different possibilities exist for improving water efficiency. Table 3.2 lists some of the most common approaches in order of increased complexity in process changes.
Measure Explanation Examples
Improved production planning and sequencing
Re-adjusting the production plans with a focus on minimizing water consumption.
Reduce cleaning needs by minimizing product changes; Starting from lighter shades and moving gradually to darker ones in textile dyeing.
Good housekeeping Introducing more sensible and more resource-conscious routines in operations.
Avoiding spillages; Minimizing the transport of pollutants from one process to the next; Closely monitoring recipes in reaction batches; Performing mechanical cleaning prior to washing with water; Making sure that water does not flow unnecessarily.
Process/equipment modifications
Making modifications in processes or equipment, with relevant retrofits, if necessary.
Closing open-ended cooling or heating system; Installing level-controlled valves to avoid overflows; Installing self-shutting, trigger-controlled nozzles on hoses; Lining tank surfaces with a non-stick material.
Product/material changes
Changing feedstocks used in production or designing completely new products that lead to reduced water demand and/or less effluent generation.
Switching to water based paints; Using reactive dyes in textile dyeing; Switching over to disposable containers in beverage industry.
Replacing equipment/ technology
Substituting existing technologies with more effective and efficient ones.
Adopting in-place cleaning systems; Using high-pressure, low-volume cleaning equipment; Operating textile dyeing machinery at lower liquor ratios.
Table 3.2: Water efficiency approaches in industry
The efficiency gains that are realized through these approaches do however differ in terms of their environmental impacts and financial feasibility. The preventative hierarchy discussed in Chapter 2 (Figure 2.2) provides a complementary guiding framework for making the necessary choices.
33
GOOD PRACTICE GUIDE FOR WATER INTENSIVE OPERATIONS
Heating and Cooling
Providing heat to or removing heat from different processes is a common practice in industrial systems. Cooling needs are particularly important in the Arab region due to the soaring temperatures of the summer months. Heat exchange systems often use water as an energy carrier. The following measures can assist saving water used for heating or cooling purposes.
Optimizing heating and cooling needs
Providing more cooling or heating than necessary is wasteful. Thus, one simple but often overlooked measure in cooling and heating systems involves performing the right level of heat transfer. There may also be possibilities to use the same water for multiple cooling or heating effects. These possibilities can be identified through proper energy assessments, such a pinch analysis.
Water-free systems
In certain applications, air, mineral oils, or specialty chemicals can be used to transfer heat effectively and economically, thereby eliminating the need to use water. Air-cooled compressors, industrial chillers, and oil based drying units are examples of water-free heating and cooling systems. Applicability and feasibility of using these systems should be investigated.
Re-circulating systems
In single-pass heat transfer systems water or steam usually gets lost − through drainage, evaporation, or condensation. In re-circulating systems heating and cooling take place in a heat exchanger designed to permit water to re-circulate in a closed system that includes either cooling towers or chillers for cooling purposes and a boiler for heating. The fraction of water that can potentially be saved by adopting re-circulating systems can be as high as 90%.
Effective water monitoring and maintenance program
In re-circulating systems water gradually gets enriched in impurities, which cause corrosion, scale formation, deposition, and biological growth on heat transfer surfaces. As a result, the heat transfer rate

34
becomes less effective, requiring additional water and energy. To control the level of impurities, certain fraction of the water circulating in the system is regularly taken out (or blown down) and replaced with fresh (makeup) water. At the same time, chemicals designed to reduce scale formation, corrosion, and biological growth can be added to the circulating water to improve effective heat transfer and reduce the need for blow-down.
By properly monitoring the concentration of undesired impurities and adjusting blow-down rates accordingly, it is possible to generate major savings. A conductivity meter is highly desirable for this purpose. In cooling systems, considerable amounts of water can get wasted due to overflow if there is wear in the seal and float valve unit of the make-up line, or when this unit is not properly adjusted. By regularly checking the condition of this unit and making sure that it is properly adjusted, water consumption can be reduced.
Recycling of blow-down
Blow-down from re-circulating units can be returned to acceptable quality by applying an appropriate treatment to remove the impurities. For large heating and cooling systems, treatment and reuse of the blow-down could be a feasible alternative.
Central heating or cooling
Where industrial plants are adjacently located in a particular area − as commonly the case in industrial districts or parks − centralized heating or cooling serving clustered plants can be a sensible option as opposed to each plant owning its own heating and cooling system. These plants have better potential to operate more efficiently since the savings may enable them to employ more advanced and efficient technologies.
Leak detection
For heating systems, leak avoidance plays an important role. Particularly in heating systems operated with a high-pressure steam, leaks can be common. The losses from individual leaking spots may
Good practice
Blow-down recycling in steel production - Jeddah
In a steel plant in Jeddah, blow-down from cooling towers is treated with the use of chemical precipitation and rapid sand filters. Treated water is then put back to the cooling system. With this practice, the company saves
800 m3 of water on a daily basis.

35
appear small, however, leaks can add up to substantial amounts in larger plants. By following a proper monitoring and maintenance program, leaks can be minimized and thereby both water and energy can be saved.
Cooling Towers
Controlled evaporation with variable speed fans Evaporation is the main mechanism for cooling the water, but it is also the main source of water loss. Using variable speed drives for cooling water fans allows the cooling effect to be adjusted according to the load requirements resulting in minimum losses due to evaporation and reduced water use.
Minimizing splash losses
Splash losses occur when the water accidentally escapes from the sides of the cooling tower due to bad design, damaged or missing louvers, or strong wind. Splash-out together with drift can account for up to 7% of total water losses from cooling towers. Splash can be reduced by proper maintenance of the side panels, with the use of anti-splash louvers, splash mats, or wind breaks. While minimizing water losses, these installations will reduce the contamination of cooling water by dust, which is a common problem in desert environments.
Minimizing drift losses
Small droplets of water escape the cooling tower in the form of drift. Drift losses can typically account for 0.02% of the re-circulation rate. By installing drift eliminators or arrestors, drift losses can be reduced. Besides saving water, reducing drift also reduces chemical use.
Use of alternative water sources
Water used for cooling purposes does not need to be of the highest quality. For example, treated wastewater can be acceptable for cooling purposes – either directly or after simple treatment. Moreover, the blow-down from cooling towers can also find alternative uses − such as pass-through cooling water or fire water.
Washing and Rinsing
In some process operations considerable amounts of water might be needed for washing or rinsing of the final or intermediate products.
Besides wasting water splash, losses can be a source of pollution.

36
In such cases, the following measures can be effective for improving water efficiency.
Counter-current rinsing
Conventional rinsing systems are based on a single-flow arrangement and use large amounts of water. Often, products to be rinsed are immersed completely in fresh water, after which the contents of the tank are drained. Alternative configurations that are more efficient while also being as effective should be explored. In counter-current rinsing systems, water flows through a series of connected rinse tanks, in opposite direction to the flow of the product to be rinsed, as demonstrated in Figure 3.2. With a sufficient number of tanks and a proper flow rate, counter-current rinsing systems use substantially less water, while also being as effective as single-flow systems.
Figure 3.2: Counter current rinsing
Mechanical pre-rinsing
When rinsing is necessary in order to remove a solution from the product – such as in electroplating or in textile dyeing - certain measures can be taken to reduce the carry-over of excess solution. These may include allowing the solution to drip away by gravity, or assisting its removal through vacuum, blown-air, or centrifugation. Since such methods reduce the amount of solution carried over to the rinsing tanks, the same rinsing water can be used for a larger volume of product. While saving rinsing water, these measures can also reduce unnecessary chemical waste and prolong the usable time of reaction baths.
Using chemicals and heat
In certain rinsing operations, the process of removing unwanted substances from the product can be assisted with the use of chemicals or energy, thereby saving water. In such cases, water saving benefits need to be weighed against the cost of introducing chemicals and/or energy.
Counter-current rinsing can typically be used in electroplating operations.

37
Equipment and Space Cleaning
Mechanical pre-cleaning
In equipment and space cleaning, the amount of required water can be substantially reduced by removing as much of the substances as possible by mechanical means – such as brushes, scrappers, rubber wipes, or pucks (for pipes). While reducing the water consumption, in certain cases the use of mechanical cleaning methods can also allow for the recovery of products that would otherwise be washed away by cleaning water.
Cleaning in Place (CiP)
CiP is a method used for cleaning the interior surfaces of pipes, vessels, process equipment, and associated fittings, without disassembly. It is particularly useful for industries requiring high levels of hygiene and therefore frequent cleaning – such as beverages, dairy, processed foods, cosmetics, and so on. In such systems, a sequence of acidic and basic solutions and rinsing water is passed through the equipment to be cleaned. Because it allows different number of re-circulations for different solution and rinsing batches, CiP consumes significantly less water compared to conventional once-through cleaning systems. In addition, CiP systems are faster, less labor intensive, and pose less chemical exposure risk to people.
High-pressure, low-volume systems
These systems usually apply a pressurized stream of water, or an air-water mixture, flowing at a high velocity through a specially designed nozzle. Commonly applied for equipment and space cleaning, these systems can provide the same, or even better, cleaning effect by using as much as 50% less water.
Use of triggered, self shut-off nozzles
In space and equipment cleaning using ordinary hoses, significant amounts of water can be lost as the “on-off” valve is often fitted on an outlet far away from the place of use. Fitting triggered self shut-off nozzles at the discharge ends of hoses offers effective and low-cost alternative for reducing water use.
Use of steam or hot water
Similar to product rinsing, equipment and space cleaning can be assisted by the use of chemical detergents or higher temperature water. Again, the additional costs of chemicals and/or energy need to be weighed against the benefits of reduced water use.
38
CHAPTER 4
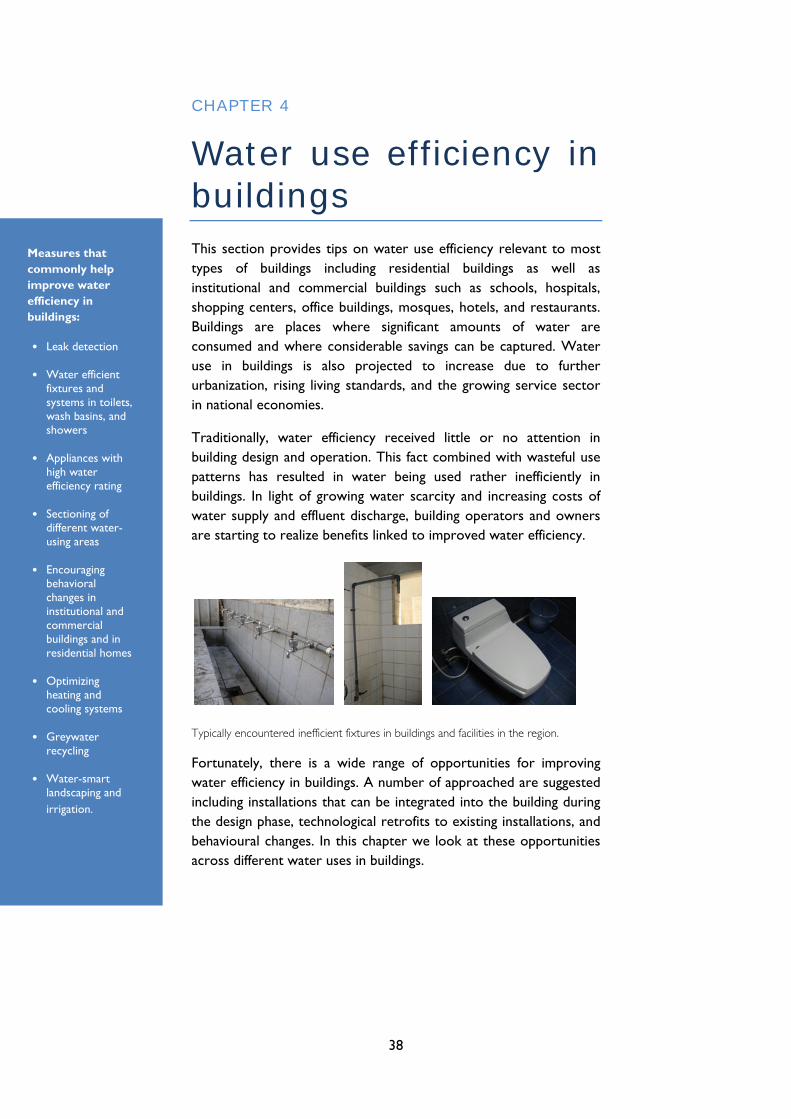
Water use efficiency in buildings This section provides tips on water use efficiency relevant to most types of buildings including residential buildings as well as institutional and commercial buildings such as schools, hospitals, shopping centers, office buildings, mosques, hotels, and restaurants. Buildings are places where significant amounts of water are consumed and where considerable savings can be captured. Water use in buildings is also projected to increase due to further urbanization, rising living standards, and the growing service sector in national economies.
Traditionally, water efficiency received little or no attention in building design and operation. This fact combined with wasteful use patterns has resulted in water being used rather inefficiently in buildings. In light of growing water scarcity and increasing costs of water supply and effluent discharge, building operators and owners are starting to realize benefits linked to improved water efficiency.
Typically encountered inefficient fixtures in buildings and facilities in the region.
Fortunately, there is a wide range of opportunities for improving water efficiency in buildings. A number of approached are suggested including installations that can be integrated into the building during the design phase, technological retrofits to existing installations, and behavioural changes. In this chapter we look at these opportunities across different water uses in buildings.
Measures that commonly help improve water efficiency in buildings:
• Leak detection
• Water efficient fixtures and systems in toilets, wash basins, and showers
• Appliances with
high water efficiency rating
• Sectioning of
different water- using areas
• Encouraging
behavioral changes in institutional and commercial buildings and in residential homes
• Optimizing
heating and cooling systems
• Greywater
recycling • Water-smart
landscaping and irrigation.
39
WATER USE BREAKDOWN IN BUILDINGS
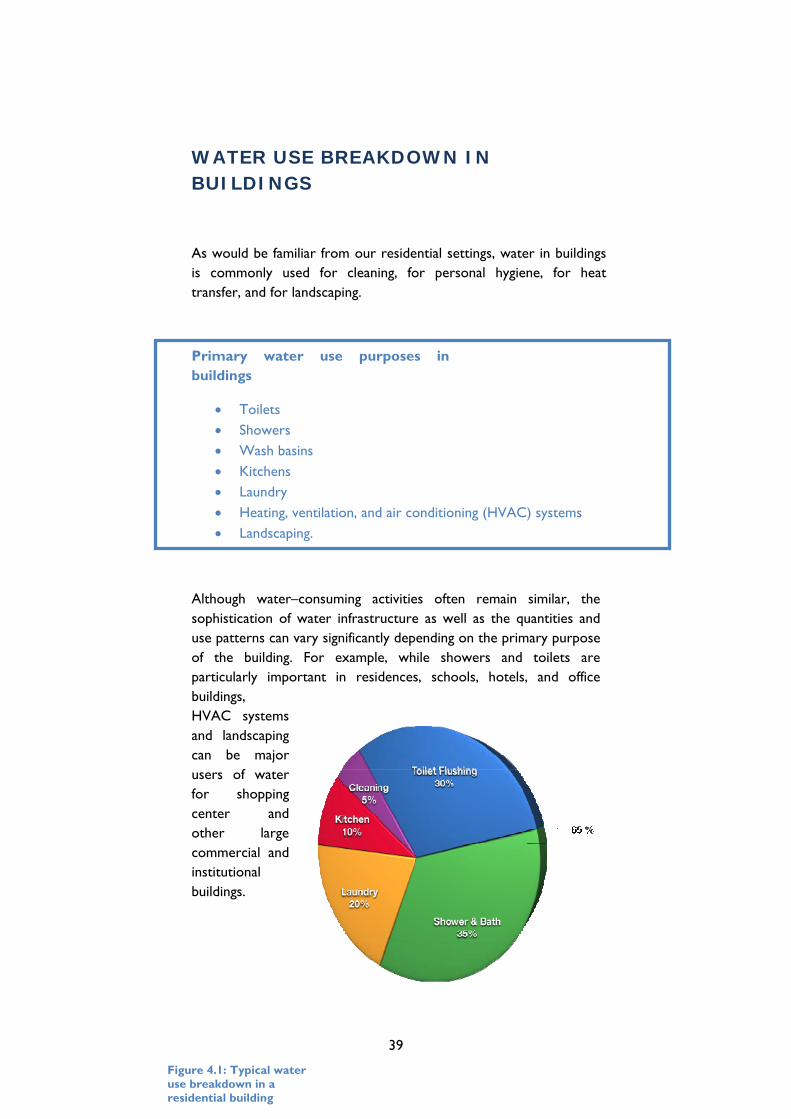
As would be familiar from our residential settings, water in buildings is commonly used for cleaning, for personal hygiene, for heat transfer, and for landscaping.
Primary water use purposes in buildings
• Toilets • Showers • Wash basins • Kitchens • Laundry • Heating, ventilation, and air conditioning (HVAC) systems • Landscaping.
Although water–consuming activities often remain similar, the sophistication of water infrastructure as well as the quantities and use patterns can vary significantly depending on the primary purpose of the building. For example, while showers and toilets are particularly important in residences, schools, hotels, and office buildings, HVAC systems and landscaping can be major users of water for shopping center and other large commercial and institutional buildings.
Figure 4.1: Typical water use breakdown in a residential building

40
SYSTEMICALLY IMPROVING WATER EFFICIENCY IN BUILDINGS
In order to improve water efficiency in buildings, a systematic approach should be adopted, as outlined in Chapter 2. However, as mentioned earlier, buildings can show significant differences in their water use characteristics and in the utilization of their water-related infrastructure. Buildings also have different service life spans. A major difference can be observed between residential buildings on one hand and commercial and institutional buildings on the other hand, in terms of water systems complexity, the lifetime of fixtures and equipments, and the resources and organisational capabilities of their owners, users, or operators. Consequently, monitoring strategies and improvement options have to be adjusted and tailored to these variations. This guide tries to remain cognizant of these differences.
PREPARATION AND PLANNING
As in industrial facilities, water efficiency programs in buildings require preparation and planning including conducting a facility survey, monitoring use, determining performance targets, identifying saving options, informing and engaging building users, and allocating resources. In single-family homes or apartments, the steps can be organised informally and the process logic remains the same. The following is a checklist of questions to consider during a site survey for an institutional or commercial building.
Water sectioning system used in a shopping center.
41
UNDERSTANDING WATER USE DYNAMICS
Residential buildings often have a relatively simple distribution structure with limited number of outlets and relatively lower consumption volumes. In these settings, performing a detailed monitoring would neither be feasible nor necessary. An awareness of the overall water consumption of the building together with an average water use breakdown benchmark (Figure 4.1) would be sufficient to kick start an effort to identify water-saving opportunities.
In commercial and institutional buildings, the monitoring activities will have to become more detailed to match the growing size and complexity of the water system. A more thorough and exhaustive effort is needed in order to develop a more useful level of understanding.
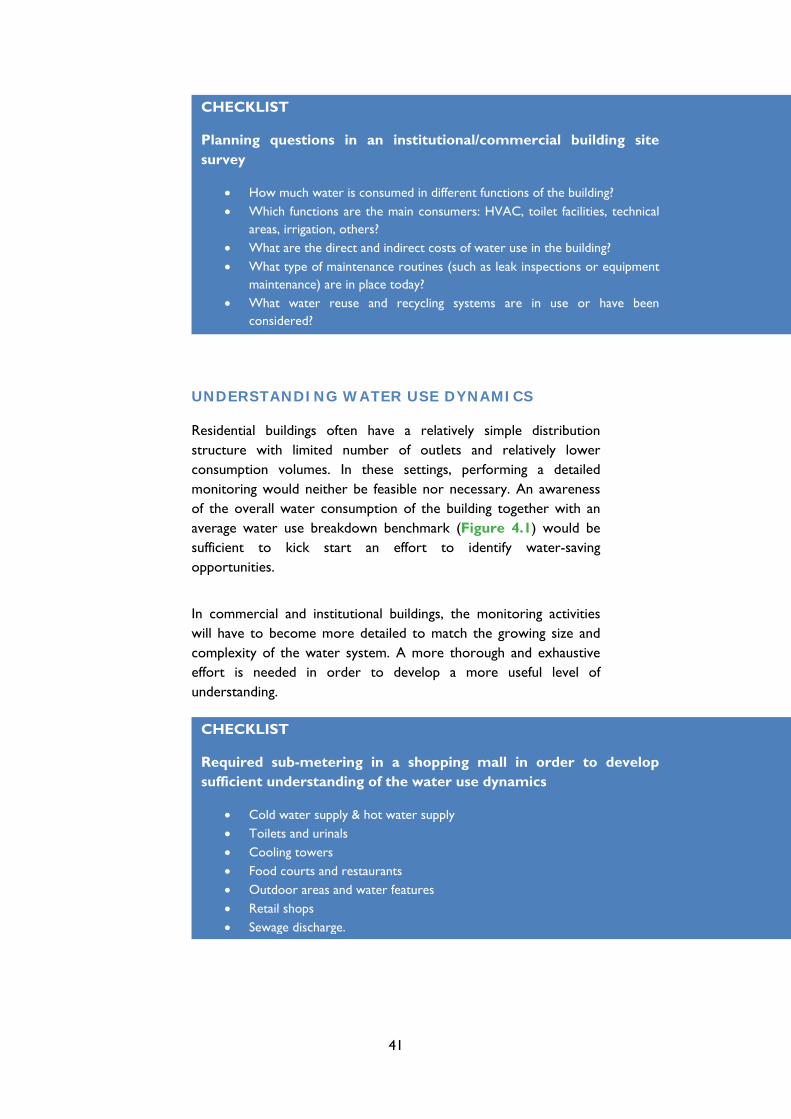
CHECKLIST
Required sub-metering in a shopping mall in order to develop sufficient understanding of the water use dynamics
• Cold water supply & hot water supply • Toilets and urinals • Cooling towers • Food courts and restaurants • Outdoor areas and water features • Retail shops • Sewage discharge.
CHECKLIST
Planning questions in an institutional/commercial building site survey
• How much water is consumed in different functions of the building? • Which functions are the main consumers: HVAC, toilet facilities, technical
areas, irrigation, others? • What are the direct and indirect costs of water use in the building? • What type of maintenance routines (such as leak inspections or equipment
maintenance) are in place today? • What water reuse and recycling systems are in use or have been
considered?

42
The next step after monitoring is to develop water balances – for the entire building or for key water using activities – and usage patterns over time. Figure 4.2 shows an example of water use breakdown in a hotel.
IDENTIFYING IMPROVEMENT OPTIONS
Improvement measures need to be investigated with an eye on selecting from a set of areas or activities those that have the greatest potential for improvement. This will be a function of the type of building in question. Table 4.1 provides a summary of key areas for different building types.
Building Type
Areas with main improvement potential
Toile
ts
Show
ers
Sin
ks
Laundry
Kitch
en
Hea
ting/C
oolin
g
Landsc
apin
g
Pools
Ste
riliz
atio
n
Residential X X X
Hotels X X X X X X X X
Hospitals X X X X X X X
Schools X X X X
Offices X X X X
Shopping centres X X X X X X
Table 4.1: Areas of main improvement potential in different types of buildings
PRIORITISATION AND IMPLEMENTATION
Once they are identified, the improvement possibilities need to be assessed based on their lifetime benefits and costs. For such assessments, knowledge of the true cost of water is needed. This step requires the quantification of both direct and hidden costs, as described by the following checklist.
Figure 4.2: Water use breakdown in a five-star hotel in Hong Kong.
43
In addition to a benefit-cost analysis, the effect of identified options on the service quality, applicability, suitability, and availability of support need to be assessed.
Experience from European and North American countries shows that residential users are often better positioned to change water use patterns. However, such users may not have the resources for detailed monitoring or for replacing existing fixtures or equipment with more efficient ones, thereby limiting their options primarily to retrofits.
ASSURING CONTINUATION
One of the key virtues of a systematic water efficiency program is to assure that the process of improvement does not halt following the first set of gains, but instead becomes embedded as an integral part of normal routines. At a minimum, this entails continuous monitoring of water use patterns in key areas and taking corrective actions to handle irregularities or to meet defined targets. It also includes continuously looking for new approaches that can reduce water consumption in the building and swiftly adopting those that prove to be feasible.
CHECKLIST
Hidden water use costs in buildings can often be linked to:
• Costs for heating and cooling the water • Pumping costs for transporting water • Treatment costs • Cost of chemicals.

44
COMMON WATER EFFICIENCY MEASURES FOR BUILDINGS
There are numerous measures that can successfully improve water use efficiency in buildings. The improvements can be achieved through a combination of behavioral changes and technological fixes. A description of some common measures follows.
USE-BASED CHARGING
A common problem hindering water efficiency improvements in buildings is linked to the tariff system. In many parts of the world, considerable segments of water users – whether they are house owners, occupants of flats in apartment buildings, or tenants at a commercial center – are still not charged for water according to their actual consumption. Instead, their water tariffs are based on a fixed cost, sometimes incorporated as part of a set monthly rent. This practice is a major hurdle to water efficiency because it removes incentives for lowering water consumption. Therefore, a key step in water efficiency in buildings requires installing water meters for individual users and introducing a fee accounting system based on actual consumption. The incentive for cost savings can only be realised by making water users aware of their consuming habits and linking their water bills to actual rates of consumption.
DETECTING LEAKS
Water leakage from toilets, faucets, or plumbing fixtures can be responsible for as much as 10 to 30% of water losses.1 Therefore, detecting and repairing leaking fixtures forms a good starting point for efficiency improvements. By conducting regular checks and routine maintenance, considerable amounts of water can potentially be saved.
Detecting leaks in residential buildings, where the number of outlets and water users is limited and concentrated, can be accomplished relatively easy as demonstrated by the tips box below. In commercial and institutional buildings, more complex measures such as continuous monitoring, overnight monitoring, and water balances may need to be used to determine the extent of leakage.
1 Environment Canada. http://www.ec.gc.ca/eau-water/default.asp?lang=en&n=E85F9FC8-1 and Sydney Water.
45
Once the magnitude of leakage is determined, the leaking fixture must be located and identified. A description of common leaking areas or fixtures that are relatively easy to identify and fix follows.
Dripping taps, faucets, and shower heads
A dripping tap can waste between 4,000 to 10,000 liters of water every year. This is enough water for 40 to 100 showers. Worn out plastic seals often cause leakage in taps. Damaged seals can be easily and inexpensively replaced, thereby saving thousands of liters of water.
Leakage in toilet flushes
A toilet flush system that leaks water in the form of a constant flow can result in the loss of substantial amounts of water. Leaks from toilets can also be harder to detect. Two of the problems that are common and that can be fixed relatively easily are:
A misplaced or broken flap causes water to continuously flow into the toilet bowl. A quick inspection of the flap mechanism to ensure that the flap is well–aligned with the flush-gate and that there are no obstructions can fix the problem. If the flap, or its seal, is damaged, it will need to be replaced.
Continuous overflow happens when the shut-off level is not properly adjusted or when the movement of the float arm is obstructed. By adjusting the shut-off level correctly and making sure that the float arm moves freely, overflow can be avoided.
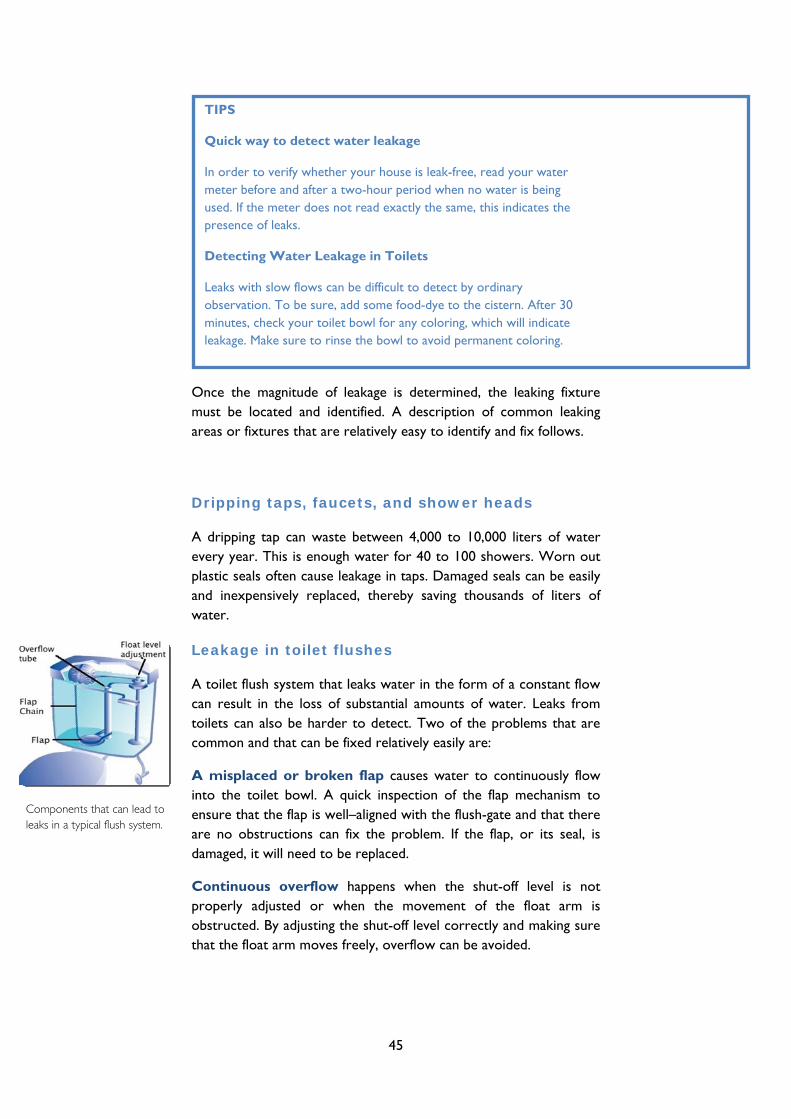
TIPS
Quick way to detect water leakage
In order to verify whether your house is leak-free, read your water meter before and after a two-hour period when no water is being used. If the meter does not read exactly the same, this indicates the presence of leaks.
Detecting Water Leakage in Toilets
Leaks with slow flows can be difficult to detect by ordinary observation. To be sure, add some food-dye to the cistern. After 30 minutes, check your toilet bowl for any coloring, which will indicate leakage. Make sure to rinse the bowl to avoid permanent coloring.
Components that can lead to leaks in a typical flush system.
46
Storage tanks
In commercial and institutional buildings, water supplied by the main is often stored in tanks prior to its use. The structural stability of storage tanks can deteriorate over time due to various reasons leading to leaks. This can be detected by monitoring the water level in the tank during a period when no water is being extracted from the tank. A drop in water level will indicate leakage.
Cooling towers
Overflow from cooling tower basins, as covered in Chapter 3, can also be seen as a form of leakage in institutional and commercial buildings and can lead to considerable wastage. Measures discussed earlier will also be applicable to buildings.
Pipes, joints, and valves
Old pipes, junctions, and valves with worn-out sealing are potential sources of water losses in buildings. These can be more difficult to detect, particularly if the leaking water is finding its way to effluent discharge channels. Leakage in the piping system may be indicated if leakage persists after all the visible leakage points have been repaired. In these cases, assistance from a professional may be necessary.
TOILETS AND URINALS
In many buildings, toilets account for one-third of water use, making them an attractive target for water efficiency improvements. These can be achieved through behavioral changes, low cost retrofits, or replacing older toilets with newer and more water-efficient models. In this section we present several of those options. It is important to examine closely the payback period when considering replacement options.
47
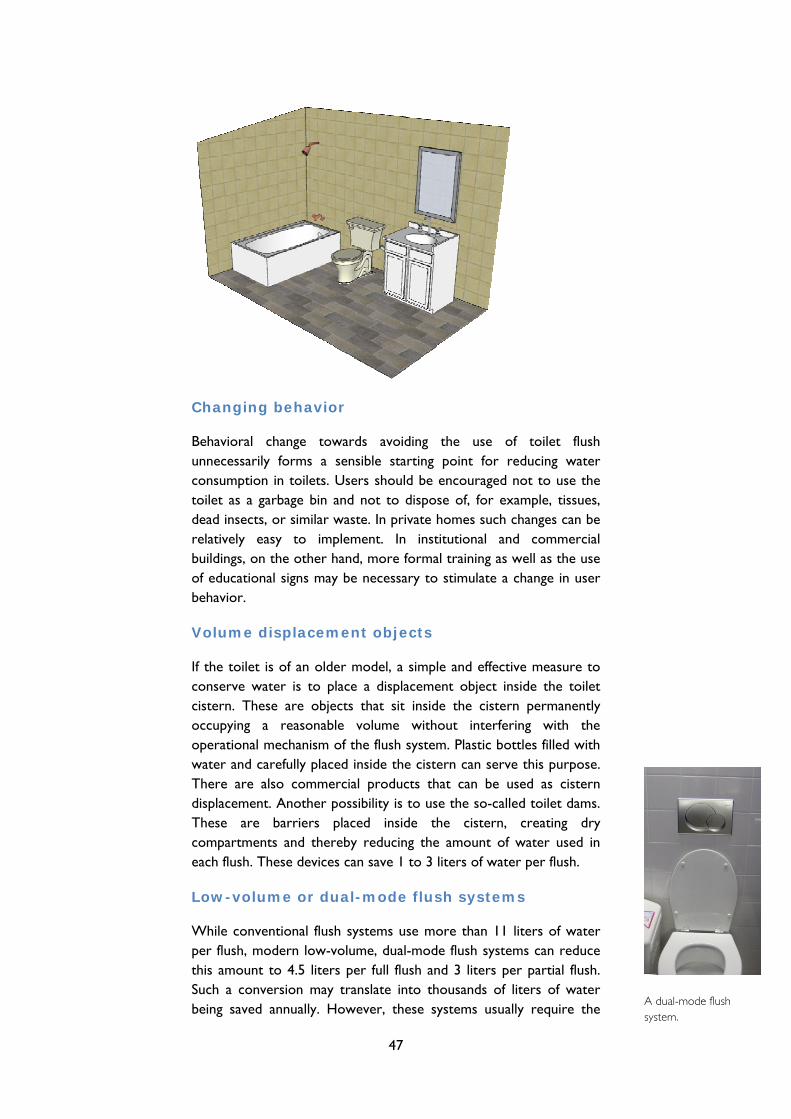
Changing behavior
Behavioral change towards avoiding the use of toilet flush unnecessarily forms a sensible starting point for reducing water consumption in toilets. Users should be encouraged not to use the toilet as a garbage bin and not to dispose of, for example, tissues, dead insects, or similar waste. In private homes such changes can be relatively easy to implement. In institutional and commercial buildings, on the other hand, more formal training as well as the use of educational signs may be necessary to stimulate a change in user behavior.
Volume displacement objects
If the toilet is of an older model, a simple and effective measure to conserve water is to place a displacement object inside the toilet cistern. These are objects that sit inside the cistern permanently occupying a reasonable volume without interfering with the operational mechanism of the flush system. Plastic bottles filled with water and carefully placed inside the cistern can serve this purpose. There are also commercial products that can be used as cistern displacement. Another possibility is to use the so-called toilet dams. These are barriers placed inside the cistern, creating dry compartments and thereby reducing the amount of water used in each flush. These devices can save 1 to 3 liters of water per flush.
Low-volume or dual-mode flush systems
While conventional flush systems use more than 11 liters of water per flush, modern low-volume, dual-mode flush systems can reduce this amount to 4.5 liters per full flush and 3 liters per partial flush. Such a conversion may translate into thousands of liters of water being saved annually. However, these systems usually require the
A dual-mode flush system.
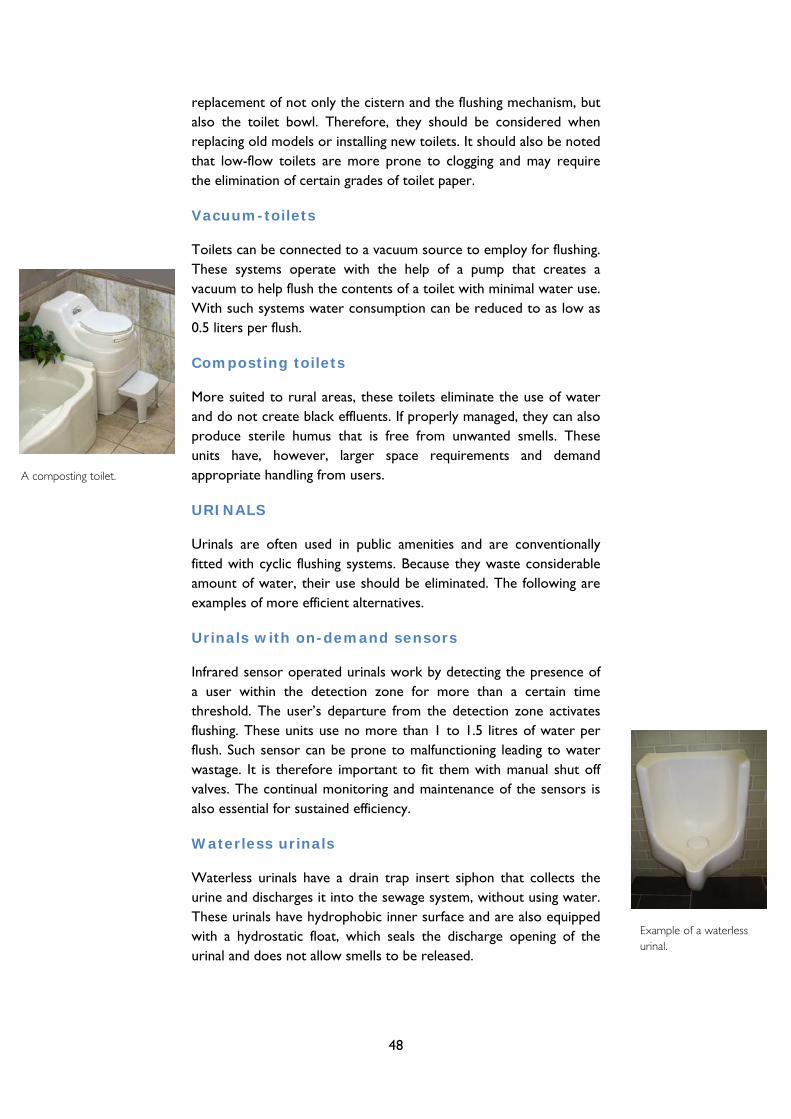
48
replacement of not only the cistern and the flushing mechanism, but also the toilet bowl. Therefore, they should be considered when replacing old models or installing new toilets. It should also be noted that low-flow toilets are more prone to clogging and may require the elimination of certain grades of toilet paper.
Vacuum-toilets
Toilets can be connected to a vacuum source to employ for flushing. These systems operate with the help of a pump that creates a vacuum to help flush the contents of a toilet with minimal water use. With such systems water consumption can be reduced to as low as 0.5 liters per flush.
Composting toilets
More suited to rural areas, these toilets eliminate the use of water and do not create black effluents. If properly managed, they can also produce sterile humus that is free from unwanted smells. These units have, however, larger space requirements and demand appropriate handling from users.
URINALS
Urinals are often used in public amenities and are conventionally fitted with cyclic flushing systems. Because they waste considerable amount of water, their use should be eliminated. The following are examples of more efficient alternatives.
Urinals with on-demand sensors
Infrared sensor operated urinals work by detecting the presence of a user within the detection zone for more than a certain time threshold. The user’s departure from the detection zone activates flushing. These units use no more than 1 to 1.5 litres of water per flush. Such sensor can be prone to malfunctioning leading to water wastage. It is therefore important to fit them with manual shut off valves. The continual monitoring and maintenance of the sensors is also essential for sustained efficiency.
Waterless urinals
Waterless urinals have a drain trap insert siphon that collects the urine and discharges it into the sewage system, without using water. These urinals have hydrophobic inner surface and are also equipped with a hydrostatic float, which seals the discharge opening of the urinal and does not allow smells to be released.
Example of a waterless urinal.
A composting toilet.
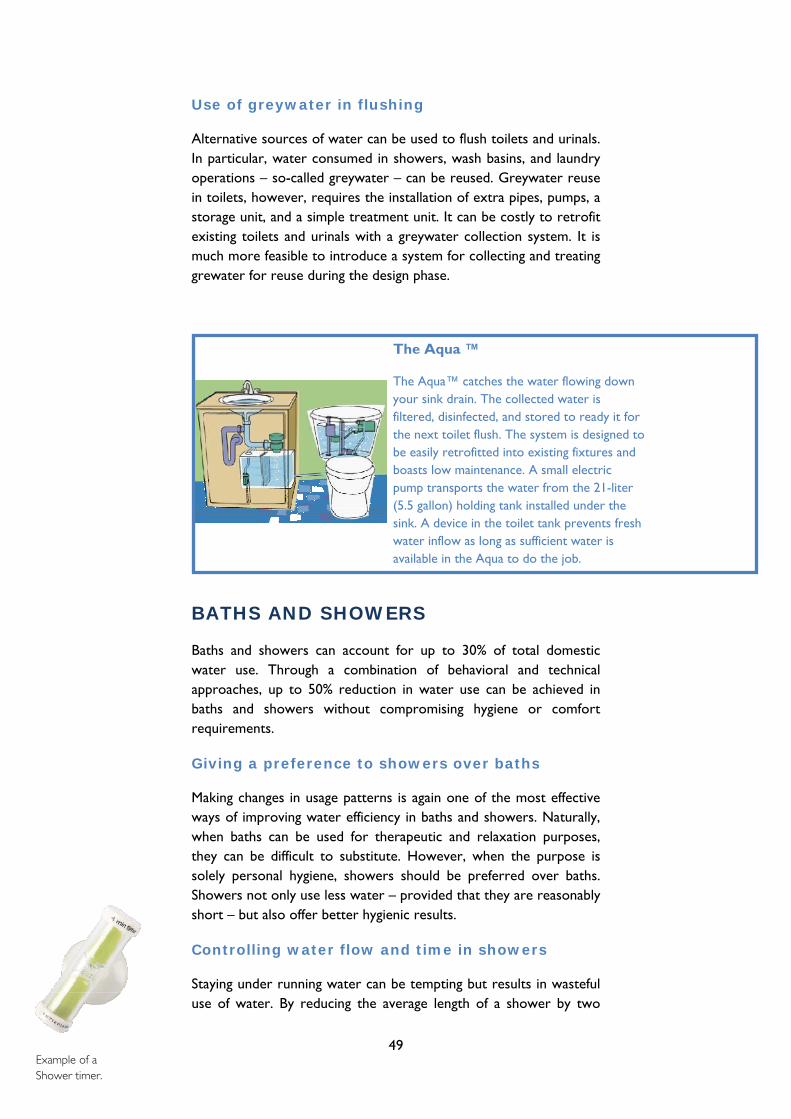
49
Use of greywater in flushing
Alternative sources of water can be used to flush toilets and urinals. In particular, water consumed in showers, wash basins, and laundry operations – so-called greywater – can be reused. Greywater reuse in toilets, however, requires the installation of extra pipes, pumps, a storage unit, and a simple treatment unit. It can be costly to retrofit existing toilets and urinals with a greywater collection system. It is much more feasible to introduce a system for collecting and treating grewater for reuse during the design phase.
BATHS AND SHOWERS
Baths and showers can account for up to 30% of total domestic water use. Through a combination of behavioral and technical approaches, up to 50% reduction in water use can be achieved in baths and showers without compromising hygiene or comfort requirements.
Giving a preference to showers over baths
Making changes in usage patterns is again one of the most effective ways of improving water efficiency in baths and showers. Naturally, when baths can be used for therapeutic and relaxation purposes, they can be difficult to substitute. However, when the purpose is solely personal hygiene, showers should be preferred over baths. Showers not only use less water – provided that they are reasonably short – but also offer better hygienic results.
Controlling water flow and time in showers
Staying under running water can be tempting but results in wasteful use of water. By reducing the average length of a shower by two
The Aqua ™
The Aqua™ catches the water flowing down your sink drain. The collected water is filtered, disinfected, and stored to ready it for the next toilet flush. The system is designed to be easily retrofitted into existing fixtures and boasts low maintenance. A small electric pump transports the water from the 21-liter (5.5 gallon) holding tank installed under the sink. A device in the toilet tank prevents fresh water inflow as long as sufficient water is available in the Aqua to do the job.
Example of a Shower timer.
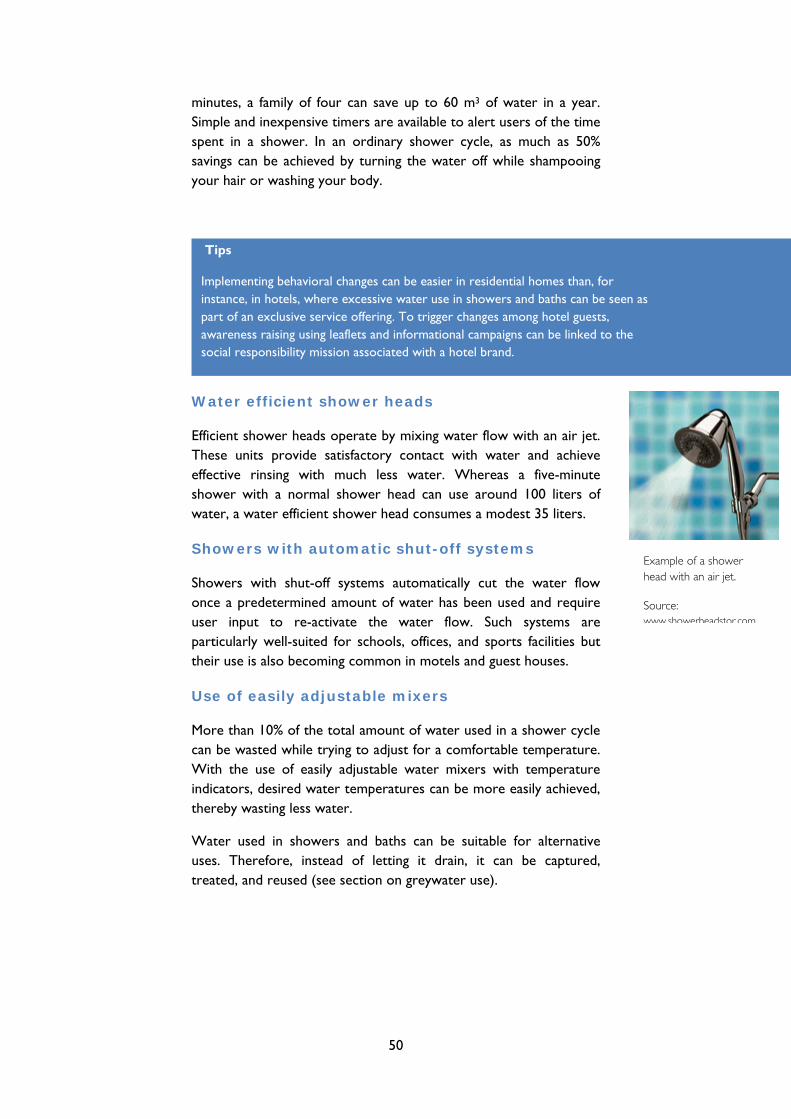
50
minutes, a family of four can save up to 60 m3 of water in a year. Simple and inexpensive timers are available to alert users of the time spent in a shower. In an ordinary shower cycle, as much as 50% savings can be achieved by turning the water off while shampooing your hair or washing your body.
Water efficient shower heads
Efficient shower heads operate by mixing water flow with an air jet. These units provide satisfactory contact with water and achieve effective rinsing with much less water. Whereas a five-minute shower with a normal shower head can use around 100 liters of water, a water efficient shower head consumes a modest 35 liters.
Showers with automatic shut-off systems
Showers with shut-off systems automatically cut the water flow once a predetermined amount of water has been used and require user input to re-activate the water flow. Such systems are particularly well-suited for schools, offices, and sports facilities but their use is also becoming common in motels and guest houses.
Use of easily adjustable mixers
More than 10% of the total amount of water used in a shower cycle can be wasted while trying to adjust for a comfortable temperature. With the use of easily adjustable water mixers with temperature indicators, desired water temperatures can be more easily achieved, thereby wasting less water.
Water used in showers and baths can be suitable for alternative uses. Therefore, instead of letting it drain, it can be captured, treated, and reused (see section on greywater use).
Tips
Implementing behavioral changes can be easier in residential homes than, for instance, in hotels, where excessive water use in showers and baths can be seen as part of an exclusive service offering. To trigger changes among hotel guests, awareness raising using leaflets and informational campaigns can be linked to the social responsibility mission associated with a hotel brand.
Example of a shower head with an air jet.
Source: www.showerheadstor.com
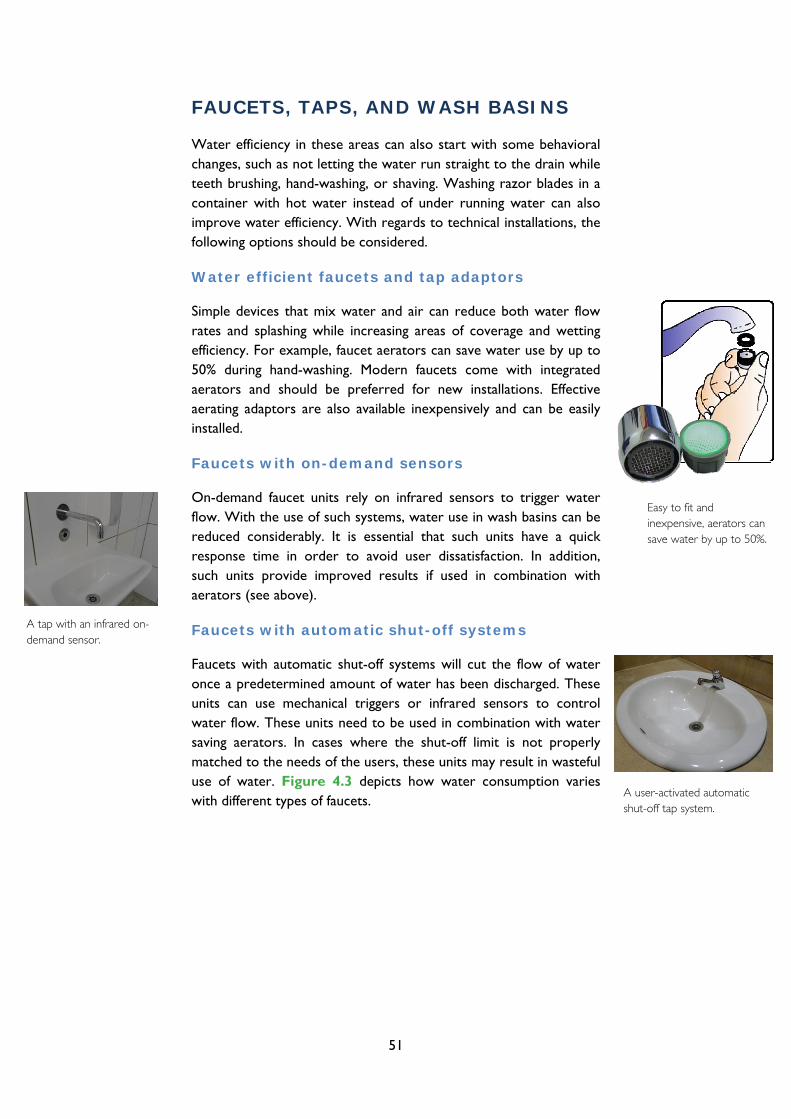
51
FAUCETS, TAPS, AND WASH BASINS
Water efficiency in these areas can also start with some behavioral changes, such as not letting the water run straight to the drain while teeth brushing, hand-washing, or shaving. Washing razor blades in a container with hot water instead of under running water can also improve water efficiency. With regards to technical installations, the following options should be considered.
Water efficient faucets and tap adaptors
Simple devices that mix water and air can reduce both water flow rates and splashing while increasing areas of coverage and wetting efficiency. For example, faucet aerators can save water use by up to 50% during hand-washing. Modern faucets come with integrated aerators and should be preferred for new installations. Effective aerating adaptors are also available inexpensively and can be easily installed.
Faucets with on-demand sensors
On-demand faucet units rely on infrared sensors to trigger water flow. With the use of such systems, water use in wash basins can be reduced considerably. It is essential that such units have a quick response time in order to avoid user dissatisfaction. In addition, such units provide improved results if used in combination with aerators (see above).
Faucets with automatic shut-off systems
Faucets with automatic shut-off systems will cut the flow of water once a predetermined amount of water has been discharged. These units can use mechanical triggers or infrared sensors to control water flow. These units need to be used in combination with water saving aerators. In cases where the shut-off limit is not properly matched to the needs of the users, these units may result in wasteful use of water. Figure 4.3 depicts how water consumption varies with different types of faucets.
A tap with an infrared on-demand sensor.
A user-activated automatic shut-off tap system.
Easy to fit and inexpensive, aerators can save water by up to 50%.
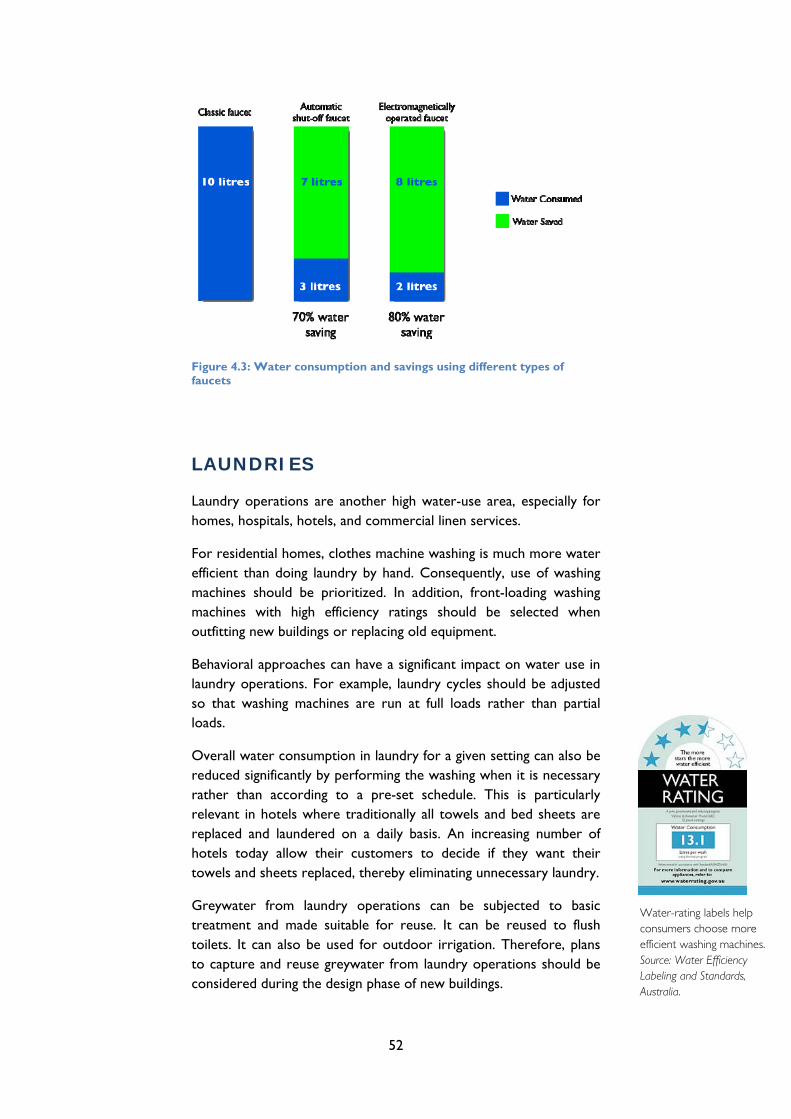
52
Figure 4.3: Water consumption and savings using different types of faucets
LAUNDRIES
Laundry operations are another high water-use area, especially for homes, hospitals, hotels, and commercial linen services.
For residential homes, clothes machine washing is much more water efficient than doing laundry by hand. Consequently, use of washing machines should be prioritized. In addition, front-loading washing machines with high efficiency ratings should be selected when outfitting new buildings or replacing old equipment.
Behavioral approaches can have a significant impact on water use in laundry operations. For example, laundry cycles should be adjusted so that washing machines are run at full loads rather than partial loads.
Overall water consumption in laundry for a given setting can also be reduced significantly by performing the washing when it is necessary rather than according to a pre-set schedule. This is particularly relevant in hotels where traditionally all towels and bed sheets are replaced and laundered on a daily basis. An increasing number of hotels today allow their customers to decide if they want their towels and sheets replaced, thereby eliminating unnecessary laundry.
Greywater from laundry operations can be subjected to basic treatment and made suitable for reuse. It can be reused to flush toilets. It can also be used for outdoor irrigation. Therefore, plans to capture and reuse greywater from laundry operations should be considered during the design phase of new buildings.
Water-rating labels help consumers choose more efficient washing machines. Source: Water Efficiency Labeling and Standards, Australia.
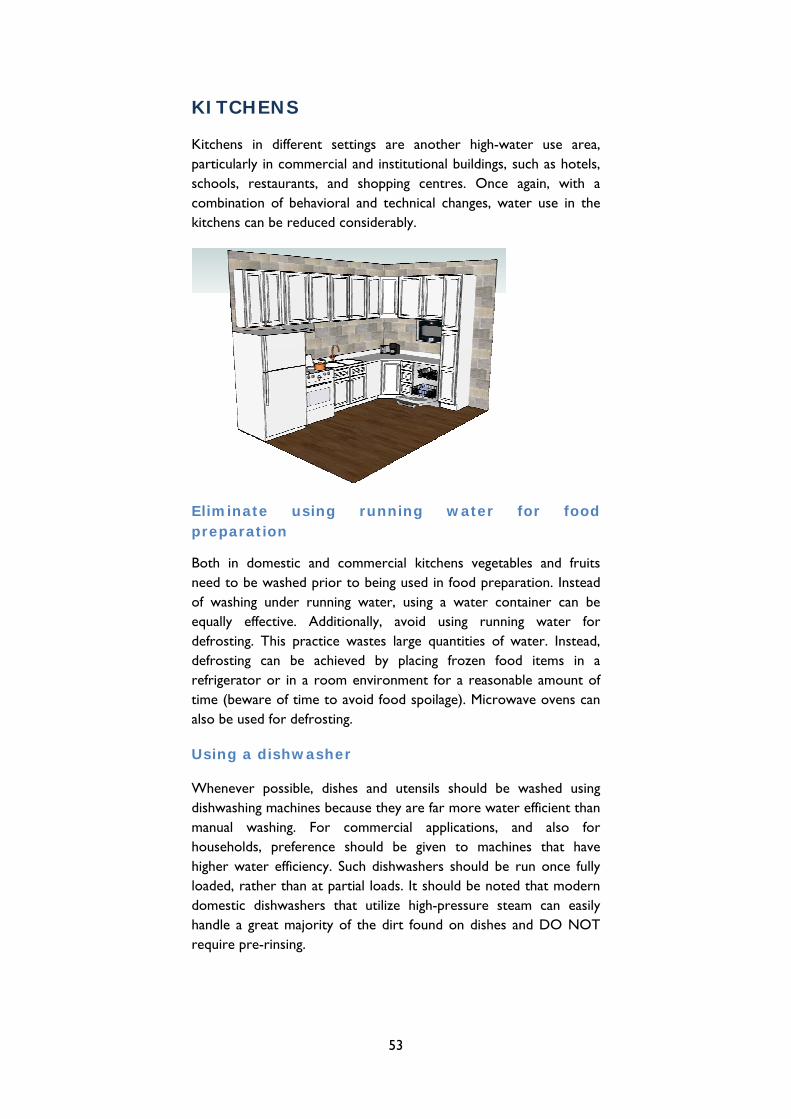
53
KITCHENS
Kitchens in different settings are another high-water use area, particularly in commercial and institutional buildings, such as hotels, schools, restaurants, and shopping centres. Once again, with a combination of behavioral and technical changes, water use in the kitchens can be reduced considerably.
Eliminate using running water for food preparation
Both in domestic and commercial kitchens vegetables and fruits need to be washed prior to being used in food preparation. Instead of washing under running water, using a water container can be equally effective. Additionally, avoid using running water for defrosting. This practice wastes large quantities of water. Instead, defrosting can be achieved by placing frozen food items in a refrigerator or in a room environment for a reasonable amount of time (beware of time to avoid food spoilage). Microwave ovens can also be used for defrosting.
Using a dishwasher
Whenever possible, dishes and utensils should be washed using dishwashing machines because they are far more water efficient than manual washing. For commercial applications, and also for households, preference should be given to machines that have higher water efficiency. Such dishwashers should be run once fully loaded, rather than at partial loads. It should be noted that modern domestic dishwashers that utilize high-pressure steam can easily handle a great majority of the dirt found on dishes and DO NOT require pre-rinsing.

54
Mechanical pre-rinse for manual washing
Where manual washing is the only option, priority should be given to removing food residues from dishes by mechanical means, such as with the help of a used napkin or a brush, over using running water. If necessary, dishes could be soaked in a container to allow the residues to soften. Actual washing and rinsing should also be performed using batches of water placed in containers instead of running water.
Triggered spray nozzles
In commercial kitchens, pre-rinsing of the dishes is common in order to reduce water and chemical consumption in quick-cycle dishwashers. In such activities, use of high-pressure nozzles with a hand-held trigger can result in substantial water savings.
Use of hot water
Hot water is much more effective in removing food remains from dishes and therefore provides equal or better cleaning with much lower volumes than cold water. However, the energy costs of water heating need to be taken into consideration.
Ice makers
Commonly found in restaurants and hotels, ice makers can use considerable amounts of water. Air cooled machines, which require only about 1.9 liters of water per kilogram of ice, should be preferred over water cooled machines, which may use as high as seven times more water.
Space cleaning
Commercial kitchens need to be frequently cleaned for hygienic purposes. A number of measures can be adopted to reduce water use. Sectioning the areas according to cleaning needs, utilizing mechanical cleaning to the extent possible, and using high-pressure, low-volume systems can collectively help reduce water consumption for space cleaning.
LANDSCAPING
Water use for landscaping can consume considerable amounts of water and usually holds a good potential for efficiency gains. Three main approaches are effective in reducing the amount of water used in landscaping:
A tap with a triggered spray nozzle can save a lot of water in kitchens. Picture: Superb Lifestyle products.
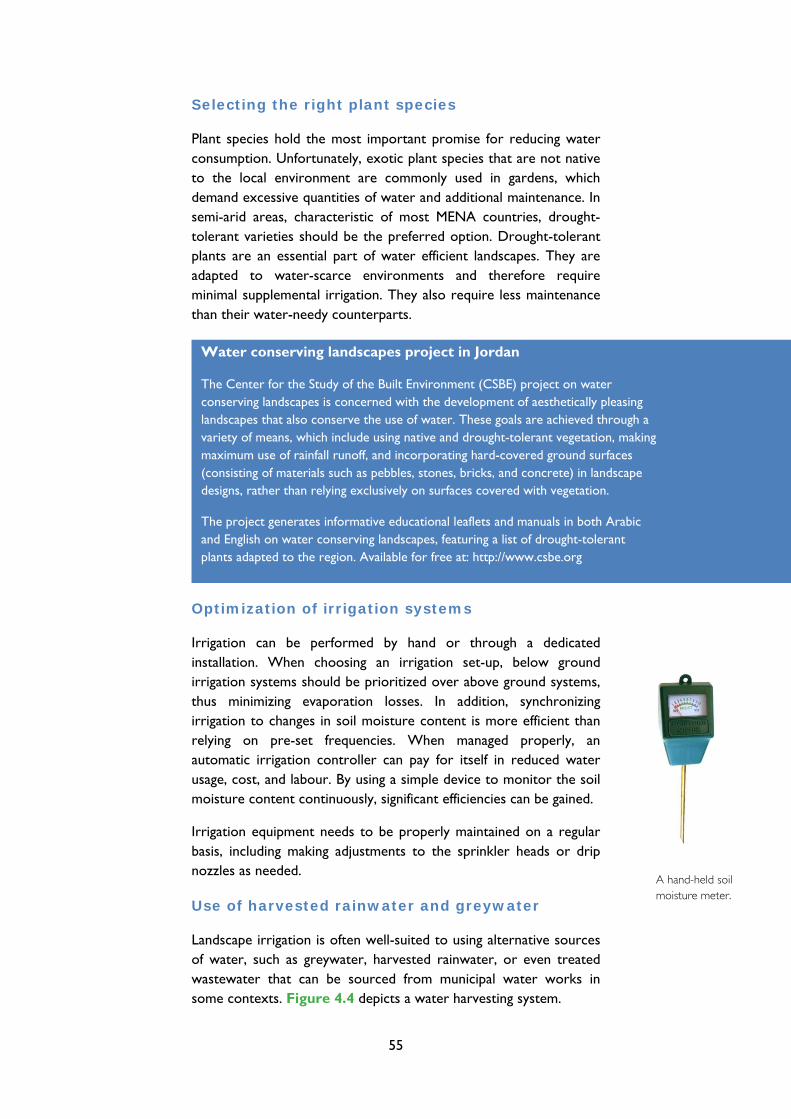
55
Selecting the right plant species
Plant species hold the most important promise for reducing water consumption. Unfortunately, exotic plant species that are not native to the local environment are commonly used in gardens, which demand excessive quantities of water and additional maintenance. In semi-arid areas, characteristic of most MENA countries, drought-tolerant varieties should be the preferred option. Drought-tolerant plants are an essential part of water efficient landscapes. They are adapted to water-scarce environments and therefore require minimal supplemental irrigation. They also require less maintenance than their water-needy counterparts.
Optimization of irrigation systems
Irrigation can be performed by hand or through a dedicated installation. When choosing an irrigation set-up, below ground irrigation systems should be prioritized over above ground systems, thus minimizing evaporation losses. In addition, synchronizing irrigation to changes in soil moisture content is more efficient than relying on pre-set frequencies. When managed properly, an automatic irrigation controller can pay for itself in reduced water usage, cost, and labour. By using a simple device to monitor the soil moisture content continuously, significant efficiencies can be gained.
Irrigation equipment needs to be properly maintained on a regular basis, including making adjustments to the sprinkler heads or drip nozzles as needed.
Use of harvested rainwater and greywater
Landscape irrigation is often well-suited to using alternative sources of water, such as greywater, harvested rainwater, or even treated wastewater that can be sourced from municipal water works in some contexts. Figure 4.4 depicts a water harvesting system.
Water conserving landscapes project in Jordan
The Center for the Study of the Built Environment (CSBE) project on water conserving landscapes is concerned with the development of aesthetically pleasing landscapes that also conserve the use of water. These goals are achieved through a variety of means, which include using native and drought-tolerant vegetation, making maximum use of rainfall runoff, and incorporating hard-covered ground surfaces (consisting of materials such as pebbles, stones, bricks, and concrete) in landscape designs, rather than relying exclusively on surfaces covered with vegetation.
The project generates informative educational leaflets and manuals in both Arabic and English on water conserving landscapes, featuring a list of drought-tolerant plants adapted to the region. Available for free at: http://www.csbe.org
A hand-held soil moisture meter.

56
Figure 4.4: An active water harvesting system2
HEATING AND COOLING
In commercial and institutional buildings with large floor areas, centralised heating, ventilation, and air conditioning (HVAC) systems are frequently used. These systems are highly similar to heating and cooling systems described in chapter 3 (Water efficiency in industrial facilities), and can benefit from the same efficiency measures.
2 Source: CSBE, Water Conserving Landscapes Manual
Checklist
Water efficiency measures for HVAC systems
• Adjusting the heating and cooling loads to actual demand • Replacing once-through systems with re-circulating systems • Reducing bleeding through close monitoring of impurities and use of
appropriate chemicals • Properly maintaining the system components • Reducing drift and splash losses from cooling towers • Reducing excessive overflow by properly adjusting the level of float valves
in cooling tower storage tanks • Consider use of alternative water sources.

57
EARLY DESIGN MEASURES
Water efficiency should be integrated early on in the design and construction phase of buildings. The feasibility of certain efficiency measures can be enhanced by re-considering certain design features related to the water distribution network, water storage tanks, and other water supporting systems. In the following are examples of three systems.
Water storage tanks
Commercial and institutional buildings are usually equipped with water storage tanks, which serve two functions. It is an available, if temporary, source of water when regular supply from the water distribution network is interrupted. Stored water can also be used for fire-fighting purposes. For maintenance reasons, these tanks need to be emptied at certain intervals and their contents are usually drained.
To save water, the water storage tank should be designed with two independent cells, each occupying a 50% capacity of the total tank volume. With a two-compartment tank, water from one cell can be circulated to the other cell during maintenance, precluding the need to drain the entire water content of the tank. Therefore, the two water cells should be connected to each other, allowing water circulation and ensuring water quality maintenance. Water cells should also be designed to allow them to be emptied independently (for washing or maintenance purposes).
Water distribution networks
Another approach that can result in water efficiency gains in commercial and institutional buildings is to design the internal water distribution network with clearly independent sectors, defined by both the area of the building and the type of water consumption. In the following box are examples of independent water sectors that can be considered for commercial buildings. Each sector should be equipped with a water flow meter measuring the specific water consumption in that sector independent of others.
58
Independent monitoring of the sectors helps gain an understanding of water use patterns in different sectors as well as identify and isolate possible water leaks in the building.
Infrastructure for water re-use
As mentioned earlier, greywater produced by certain uses in buildings – such as showers, wash basins, and laundry rooms – can be of suited for use in toilet systems or in landscaping. To facilitate the use of greywater, it is key to include in the early design phase a system for collecting, treating, and storing treated greywater. This system may include a separate drainage network, an on-site simple treatment unit using sand filters, a storage tank, and a dedicated distribution network.
Similarly with rainwater harvesting, a collection and storage infrastructure is needed. Rainwater collected from roofs or paved areas – such as streets or parking lots – can be used to flush toilets or to irrigate landscapes after passing through a simple filtration step.
Checklist
Independent water sectors in a commercial building
• One sector per floor • One sector for the common areas (corridors, technical areas, others) • One sector for the HVAC system • One sector for the irrigation system
• One sector for ornamental fountains, when available.
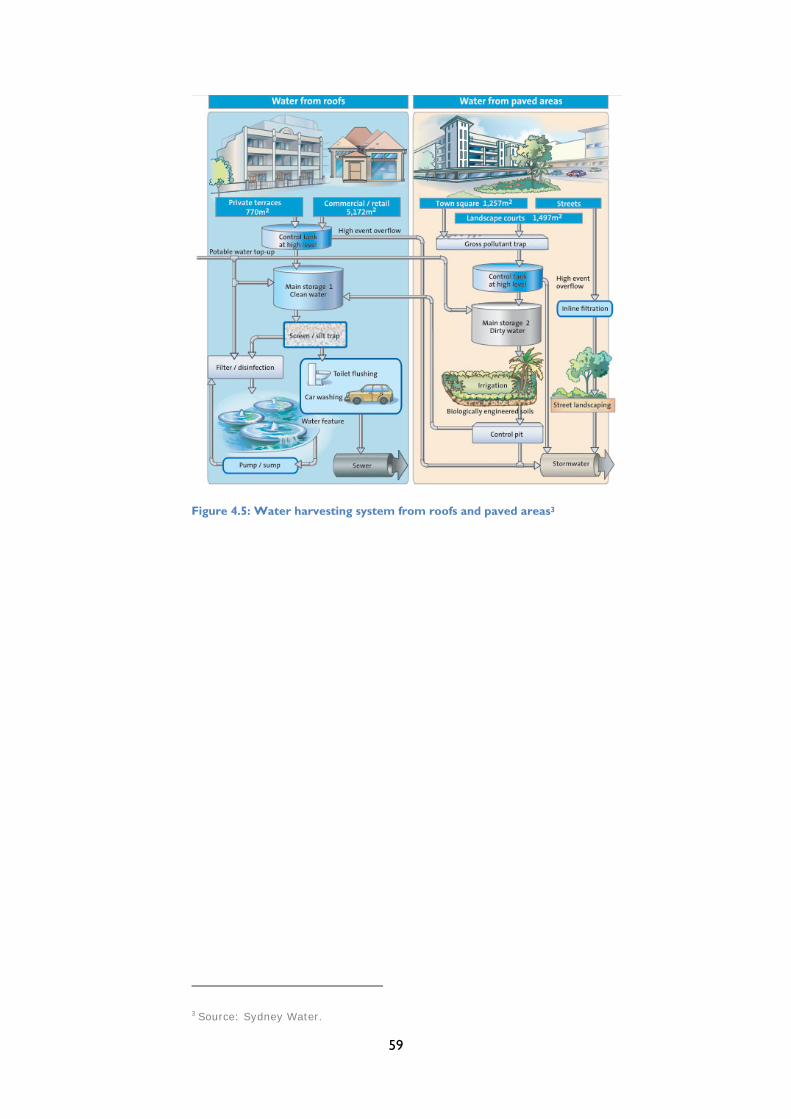
59
Figure 4.5: Water harvesting system from roofs and paved areas3
3 Source: Sydney Water.
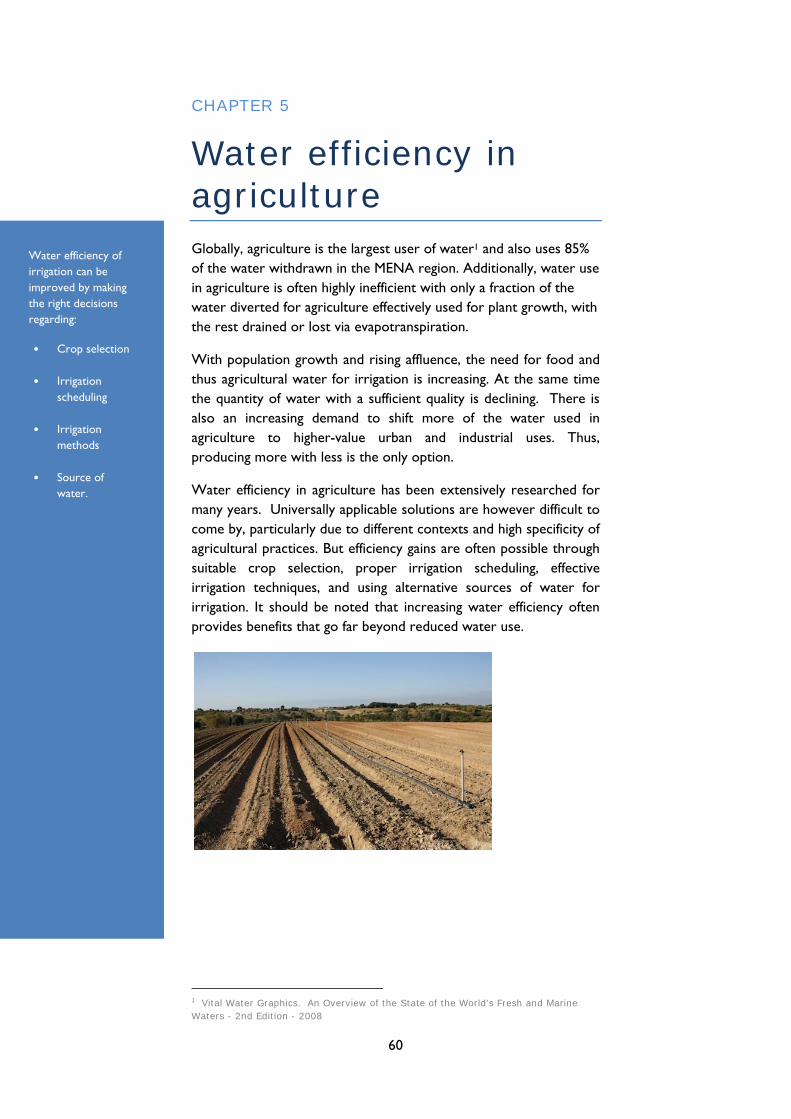
60
CHAPTER 5
Water efficiency in agriculture Globally, agriculture is the largest user of water1 and also uses 85% of the water withdrawn in the MENA region. Additionally, water use in agriculture is often highly inefficient with only a fraction of the water diverted for agriculture effectively used for plant growth, with the rest drained or lost via evapotranspiration.
With population growth and rising affluence, the need for food and thus agricultural water for irrigation is increasing. At the same time the quantity of water with a sufficient quality is declining. There is also an increasing demand to shift more of the water used in agriculture to higher-value urban and industrial uses. Thus, producing more with less is the only option.
Water efficiency in agriculture has been extensively researched for many years. Universally applicable solutions are however difficult to come by, particularly due to different contexts and high specificity of agricultural practices. But efficiency gains are often possible through suitable crop selection, proper irrigation scheduling, effective irrigation techniques, and using alternative sources of water for irrigation. It should be noted that increasing water efficiency often provides benefits that go far beyond reduced water use.
1 Vital Water Graphics. An Overview of the State of the World’s Fresh and Marine Waters - 2nd Edition - 2008
Water efficiency of irrigation can be improved by making the right decisions regarding:
• Crop selection
• Irrigation scheduling
• Irrigation methods
• Source of water.
61
IMPROVING WATER EFFICIENCY IN IRRIGATION
Irrigation is necessary when plants cannot satisfy all their water needs through natural precipitation – this practice is also called deficit irrigation. Therefore, an ideal irrigation effort aims to cover the deficit between a crop’s optimal water needs and what it can take up through natural means. Because arid, semi-arid, and desert climatic conditions prevail in the Arab region, irrigation is indispensible.
Climatic conditions, soil type and structure, plant type, and the irrigation techniques applied are among the main factors that influence the efficiency and effectiveness of irrigation practices. For a given location and climatic and soil conditions, the efficiency of water irrigation practices can be improved by making the right decisions regarding:
Crop type Irrigation scheduling Irrigation method Soil enhancement measures Source of water.
CROP WATER NEEDS Crops differ both in terms of their daily water needs and the duration of their total growing period. Consequently, crop type is a chief factor influencing irrigation water needs. Crops with high daily needs and a long total growing season require much more water than those with relatively lower daily needs and shorter growing seasons. Therefore, a key step towards reducing irrigation water needs is selecting those crop varieties that have a lower water demand but that still provide sufficient added value.
Improving Irrigation practices can:
• Reduce water and pumping costs • Reduce costs for fertilizers and other agricultural chemicals • Maintain a higher soil quality • Increase crop yields − by as much as 100%.

62
In Tables 5.1, 5.2, and 5.3, values of typical water needs, average length of growing season, and the total water demand for different crops are given.
Water requirement as compared to ordinary grass 30% less 10% less Same 10% more 30% more
Citrus Cucumber Carrots Barley Paddy rice Olives Radishes Crucifers
(Cabbage, Cauliflower, Broccoli, etc.)
Beans Sugarcane Grapes Squash Maize Banana Flax Nuts and fruit
trees with cover crops
Small grains Lettuce Cotton Mellons Tomato Onions Eggplant Peanuts Lentils Peppers Millet Spinach Oats Tea Peas Grass
Cacao Coffee
Potatoes Safflower Sorghum Clean
cultivated nuts & fruit trees
Soybeans Sugarbeet Sunflower Tobacco Table 5.1: Water needs of field crops in peak period as compared to standard grass2
Crop Total growing
period (days) Crop Total growing
period (days) Alfalfa 100 − 365 Millet 105 − 140 Banana 300 − 365 Onion green 70 − 95 Barley/Oats/Wheat 120 − 150 Onion dry 150 − 210 Bean green 75 − 90 Peanut 130 − 140 Bean dry 95 − 110 Pea 90 − 100 Cabbage 120 − 140 Pepper 120 − 210 Carrot 100 − 150 Potato 105 − 145 Citrus 240 − 365 Radish 35 − 45 Cotton 180 − 195 Rice 90 − 150 Cucumber 105 − 130 Sorghum 120 − 130 Eggplant 130 − 140 Soybean 135 − 150 Flax 150 − 220 Spinach 60 − 100 Grain/small 150 − 165 Squash 95 − 120 Lentil 150 − 170 Sugarbeet 160 − 230 Lettuce 75 − 140 Sugarcane 270 − 365 Maize sweet 80 − 110 Sunflower 125 − 130 Maize grain 125 − 180 Tobacco 130 − 160 Mellon 120 − 160 Tomato 135 − 180 Table 5.2: Indicative values of the total growing period for different crops3 2 FAO, 1986. Irrigation Water Management: Irrigation Water needs.
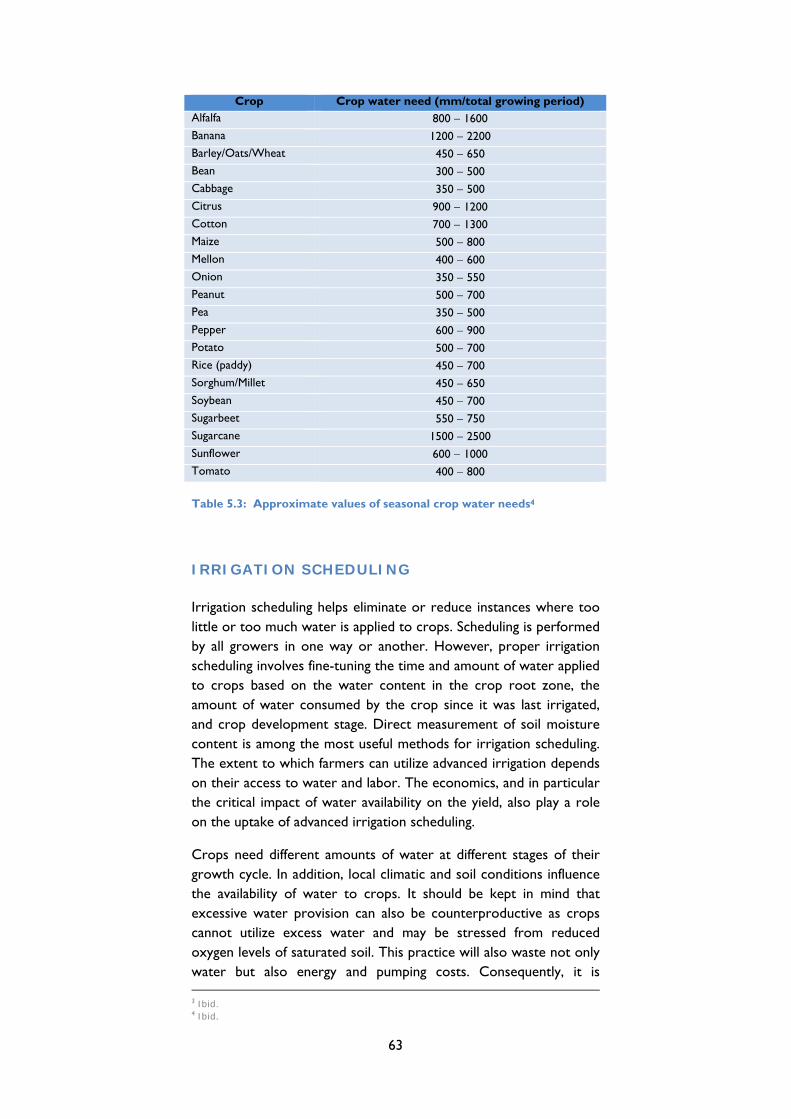
63
Crop Crop water need (mm/total growing period) Alfalfa 800 − 1600 Banana 1200 − 2200 Barley/Oats/Wheat 450 − 650 Bean 300 − 500 Cabbage 350 − 500 Citrus 900 − 1200 Cotton 700 − 1300 Maize 500 − 800 Mellon 400 − 600 Onion 350 − 550 Peanut 500 − 700 Pea 350 − 500 Pepper 600 − 900 Potato 500 − 700 Rice (paddy) 450 − 700 Sorghum/Millet 450 − 650 Soybean 450 − 700 Sugarbeet 550 − 750 Sugarcane 1500 − 2500 Sunflower 600 − 1000 Tomato 400 − 800 Table 5.3: Approximate values of seasonal crop water needs4
IRRIGATION SCHEDULING Irrigation scheduling helps eliminate or reduce instances where too little or too much water is applied to crops. Scheduling is performed by all growers in one way or another. However, proper irrigation scheduling involves fine-tuning the time and amount of water applied to crops based on the water content in the crop root zone, the amount of water consumed by the crop since it was last irrigated, and crop development stage. Direct measurement of soil moisture content is among the most useful methods for irrigation scheduling. The extent to which farmers can utilize advanced irrigation depends on their access to water and labor. The economics, and in particular the critical impact of water availability on the yield, also play a role on the uptake of advanced irrigation scheduling.
Crops need different amounts of water at different stages of their growth cycle. In addition, local climatic and soil conditions influence the availability of water to crops. It should be kept in mind that excessive water provision can also be counterproductive as crops cannot utilize excess water and may be stressed from reduced oxygen levels of saturated soil. This practice will also waste not only water but also energy and pumping costs. Consequently, it is 3 Ibid. 4 Ibid.

64
essential to plan for irrigation properly and match the amount of water provided to a crop’s water needs – both for yield optimization and for water efficiency. With proper irrigation scheduling, soil reservoir is managed such that optimum amount of water is available when the plants need it. Good irrigation scheduling requires knowledge of:
• Crop water demand at different growth cycles • Moisture content of the soil and soil water capacity • Weather conditions.
During the early season planting stage, the water requirement is usually about 50% less than what is required at the mid-season stage, when the crop has fully developed and reached its peak water need. The late season demand, on the other hand, is as high as the peak demand for crops harvested fresh, and can be as much as 75% less for those plants harvested dry. It is essential for growers to be attentive to this irrigation schedule and for the irrigation system to be adaptable to such changing demands.
Although overall water needs of different crops can be approximated using the typical values given in Tables 5.1, 5.2, and 5.3 above, determination of these values at different growth stages is more complicated because water needs can show significant variations based on local climatic and soil conditions and crop variety. It is therefore important to consult competent authorities – e.g. Agricultural Ministries or local Irrigation Departments – to obtain relevant information.
Monitoring of soil moisture content provides a good assessment of the crop’s water needs. A wide range of methods offering varying accuracy levels is available for monitoring soil moisture, each having its respective strengths and shortcomings. Some of the common methods are summarized in Table 5.4.
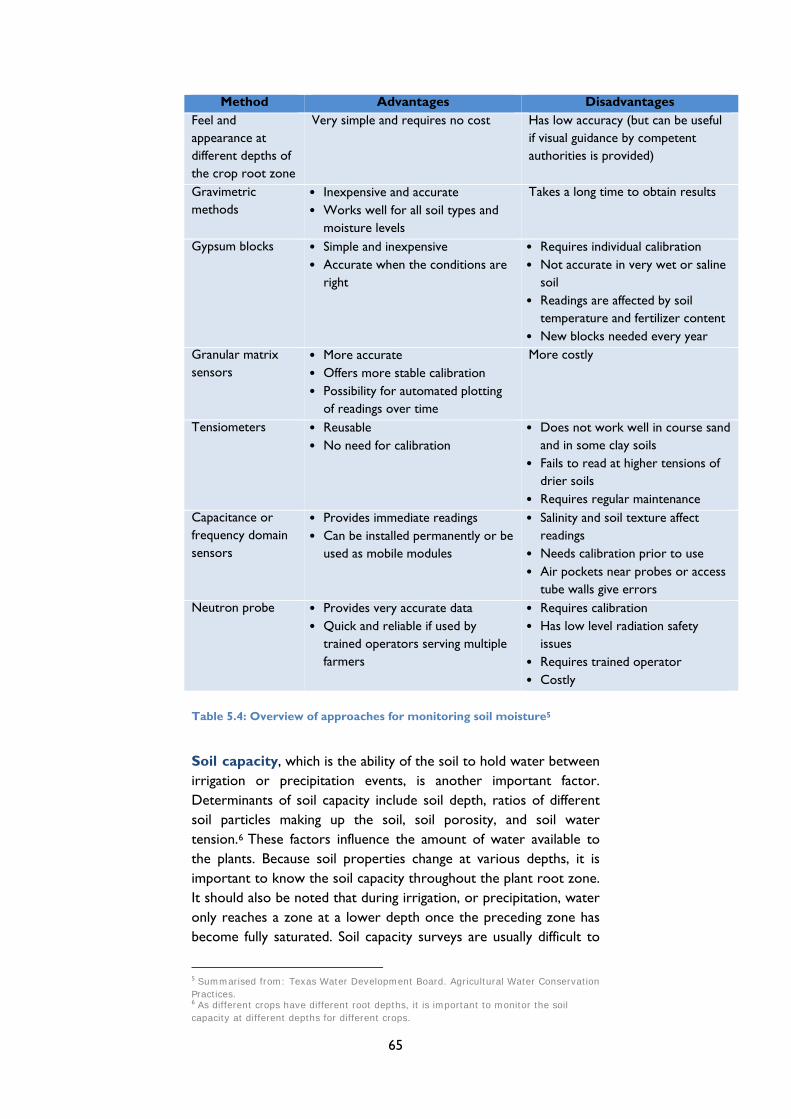
65
Method Advantages Disadvantages Feel and appearance at different depths of the crop root zone
Very simple and requires no cost Has low accuracy (but can be useful if visual guidance by competent authorities is provided)
Gravimetric methods
• Inexpensive and accurate • Works well for all soil types and
moisture levels
Takes a long time to obtain results
Gypsum blocks • Simple and inexpensive • Accurate when the conditions are
right
• Requires individual calibration • Not accurate in very wet or saline
soil • Readings are affected by soil
temperature and fertilizer content • New blocks needed every year
Granular matrix sensors
• More accurate • Offers more stable calibration • Possibility for automated plotting
of readings over time
More costly
Tensiometers • Reusable • No need for calibration
• Does not work well in course sand and in some clay soils
• Fails to read at higher tensions of drier soils
• Requires regular maintenance Capacitance or frequency domain sensors
• Provides immediate readings • Can be installed permanently or be
used as mobile modules
• Salinity and soil texture affect readings
• Needs calibration prior to use • Air pockets near probes or access
tube walls give errors Neutron probe • Provides very accurate data
• Quick and reliable if used by trained operators serving multiple farmers
• Requires calibration • Has low level radiation safety
issues • Requires trained operator • Costly
Table 5.4: Overview of approaches for monitoring soil moisture5
Soil capacity, which is the ability of the soil to hold water between irrigation or precipitation events, is another important factor. Determinants of soil capacity include soil depth, ratios of different soil particles making up the soil, soil porosity, and soil water tension.6 These factors influence the amount of water available to the plants. Because soil properties change at various depths, it is important to know the soil capacity throughout the plant root zone. It should also be noted that during irrigation, or precipitation, water only reaches a zone at a lower depth once the preceding zone has become fully saturated. Soil capacity surveys are usually difficult to
5 Summarised from: Texas Water Development Board. Agricultural Water Conservation Practices. 6 As different crops have different root depths, it is important to monitor the soil capacity at different depths for different crops.

66
perform by individual farmers, but can be performed by competent authorities and the information can be made available for different regions.
The prevailing climatic conditions, such as average ambient temperature, intensity of solar radiation, humidity, and wind-speed also affect both the moisture retained in the soil and the speed by which plants lose water through transpiration. The highest crop water needs are found in areas that are hot, sunny, dry, and windy. Thus, climatic conditions also need to be taken into consideration for proper irrigation scheduling.
Accurate monitoring of water used in irrigation is an essential part of irrigation scheduling and helps reach optimal performance, saving water while enhancing yields. Accurate readings can be obtained through different direct measurement methods available for pipes and closed conduits (propeller meters; orifice, venturi, or differential pressure meters; magnetic flux meters; ultrasonic meters) and for open channels (weirs and flumes; stage discharge rating tables; area/point velocity measurements; ultrasonic methods). Indirectly measuring irrigation water use can also provide sufficiently accurate approximations at lower costs. Common methods used include:
Measurement of energy used by irrigation pumps End-pressure measurements in sprinkler irrigation Elevation differences in irrigation reservoirs or tanks Measurement of irrigation time and size of irrigation
delivery system.
IRRIGATION METHODS Once the quantitative and temporal characteristics of optimal water demand have been determined, a method that can make such water available in the most effective way should be selected. There are three main irrigation methods, namely:
Surface (or gravity) irrigation Sprinkler irrigation Drip irrigation.
These methods, and their respective advantages and disadvantages are summarized.

67
Surface irrigation Surface irrigation involves the application of water by gravity flow to the surface of the field. Surface irrigation can have different forms. In basin irrigation, the whole field is flooded with water. Alternatively, furrow or border irrigation can be used where water can be fed into small channels or strips of land. Surface irrigation is the easiest and least costly method, but is usually highly inefficient – only less than 10% of the water is taken up by the plant. Unfortunately, this is also the widely most used method in the Arab region.
Sprinkler irrigation Sprinkler irrigation systems imitate natural rainfall. Water is pumped through pipes and then sprayed onto the crops through rotating sprinkler heads. These systems are more efficient than surface irrigation, however, they are more costly to install and operate because of the need for pressurized water. Conventional sprinkler systems spray the water into the air, losing considerable amounts to evaporation. Low energy precision application (LEPA) offers a more efficient alternative. In this system the water is delivered to the crops from drop tubes that extend from the sprinkler's arm. When applied together with appropriate water-saving farming techniques, LEPA can achieve efficiencies as high as 95%. Since this method operates at low pressure, it also saves as much as 20 to 50% in energy costs compared with conventional systems.
Different sprinkler irrigation systems − conventional (left) and low energy precision (right) systems.
Drip irrigation Drip irrigation delivers water through the use of pressurized pipes and drippers that run close to the plants and that can be placed on the soil surface or below ground. This method is highly efficient because only the immediate root zone of each plant is wetted. This system also allows precise application of water-soluble fertilizers and other agricultural chemicals. Drip irrigation is reported to help achieve yield gains of up to 100%, water savings of up to 40-80%,

68
and associated fertilizer, pesticide, and labor savings over conventional irrigation systems.7 Drip irrigation systems can have different levels of sophistication and costs. Drip irrigation systems that are operated by solar-driven pumps are a particularly promising alternative for the MENA region. Figure 5.1 shows a layout of a drip irrigation system.
Figure 5.1: Drip Irrigation System (Wikimedia – Courtesy of Jain Irrigation)
The variations in soil moisture content usually achieved with different irrigation methods are depicted in Figure 5.2.
Figure 5.2: Comparision of different irrigation systems8
With the exception of Saudi Arabia and the United Arab Emirates (UAE), surface irrigation is predominantly used in more than 90% of irrigated agricultural land in the MENA region.9
7 Burney, et al. (2009). Solar-powered drip irrigation enhances food security in the Sudano–Sahel. 8 Texas Water Development Board: Agricultural Water Conservation Practices. 9 AQUASTAT Survey 2008. Irrigation in the Middle East Region in Figures.
Saturated soil
Optimum moisture content
Zero moisture
Drip Irrigation Sprinkler Irrigation Furrow Irrigation
69
SOIL ENHANCEMENT MEASURES In addition to the inherent efficiencies of different irrigation methods, a number of additional soil enhancement approaches can be considered to improve the efficiency of irrigation practices.
Proper field leveling, in order to allow the water to travel in an optimum speed, is an approach that assists uniform distribution of water and reduces runoff, particularly in surface and sprinkler irrigation. Furrow diking, which allows the capture of irrigation or precipitation water in small earthen dams within furrows, is another approach that can reduce runoff and increase the effectiveness of irrigation.
Further water savings can be achieved through residue management and conservation tillage, where the amount, orientation, and distribution of crop and plant residue on the soil surface are managed. These practices improve the ability of the soil to hold moisture, reduces water run-off from the field, and reduces surface evaporation. Because conservation tillage can cause disturbances in furrow irrigation systems, they are better suited for fields using sprinkler or drip irrigation.
Further efficiency gains are possible through appropriate measures in water distribution systems. Where water is delivered to fields by canals, for example, lining of the canal surface – by compacted clay or concrete – can drastically reduce water seepage. Covering the canals or putting them underground can further decrease evaporation losses.
ALTERNATIVE WATER SOURCES Further efficiency gains at the local or regional levels, and even at the farm level, can be achieved through the use of alternative sources of water for irrigation. Two major approaches dominate.
Rainwater harvesting is an increasingly popular approach in those parts of the world where short periods of heavy precipitation are often followed by long stretches of dry periods. In these locations, impermeable surfaces covering sufficiently large areas are created to reduce the infiltration of rainfall into the soil. By controlling the run-off of the harvested rain, water is diverted to tanks, underground aquifers, or dedicated surface ponds (though this is the least costly alternative, it results in excessive water loss via evaporation), from where water can be extracted and used for irrigation. Rainwater harvesting is successfully used in parts of India co-habited by multiple small-scale farmers.

70
Utilizing treated wastewater is another approach that can provide a feasible alternative source for irrigation water. With the use of modern technology, domestic wastewater can be treated to meet strict health and environmental guidelines, allowing safe use in irrigation. Conventionally, however, use of treated wastewater in irrigation practices has only been possible in farms located in close proximity to cities or towns that are large enough to operate an effective wastewater treatment system. Treated wastewater is already used in irrigation in Jordan and Tunisia and in landscaping in member countries of the Gulf Cooperation Council. With advancements in wastewater treatment technologies, use of treated wastewater on a smaller scale and in a distributed mode is becoming feasible.
Other innovations, such as micro-scale solar desalination units that can convert brackish water to low salinity water suitable for irrigation, are developments that hold a promise for the future.
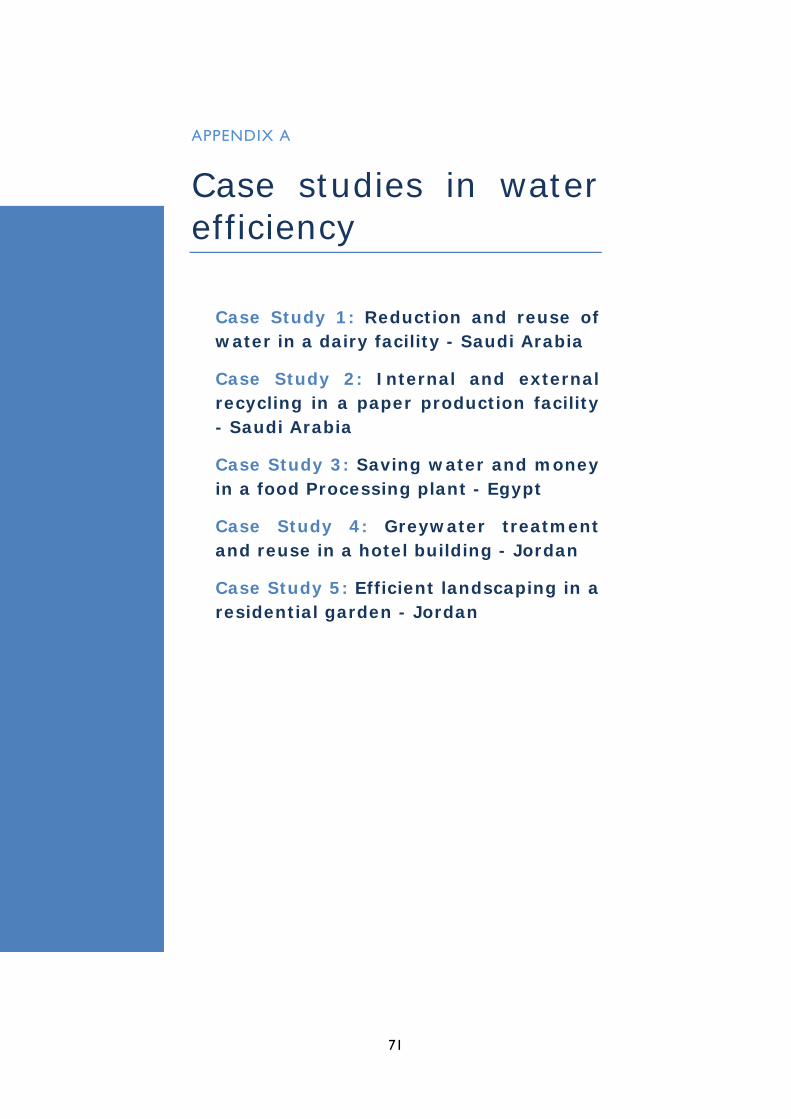
71
APPENDIX A
Case studies in water efficiency
Case Study 1: Reduction and reuse of water in a dairy facility - Saudi Arabia
Case Study 2: Internal and external recycling in a paper production facility - Saudi Arabia
Case Study 3: Saving water and money in a food Processing plant - Egypt
Case Study 4: Greywater treatment and reuse in a hotel building - Jordan
Case Study 5: Efficient landscaping in a residential garden - Jordan
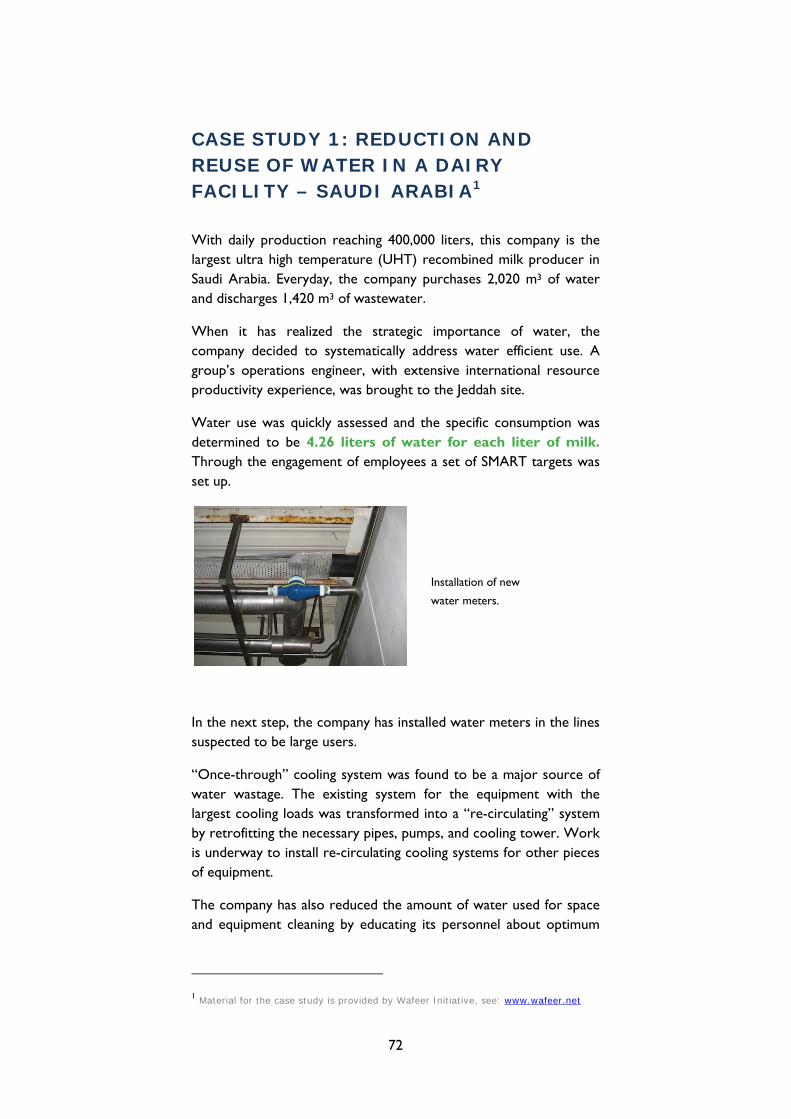
72
CASE STUDY 1: REDUCTION AND REUSE OF WATER IN A DAIRY FACILITY – SAUDI ARABIA1
With daily production reaching 400,000 liters, this company is the largest ultra high temperature (UHT) recombined milk producer in Saudi Arabia. Everyday, the company purchases 2,020 m3 of water and discharges 1,420 m3 of wastewater.
When it has realized the strategic importance of water, the company decided to systematically address water efficient use. A group’s operations engineer, with extensive international resource productivity experience, was brought to the Jeddah site.
Water use was quickly assessed and the specific consumption was determined to be 4.26 liters of water for each liter of milk.
Through the engagement of employees a set of SMART targets was set up.
In the next step, the company has installed water meters in the lines suspected to be large users.
“Once-through” cooling system was found to be a major source of water wastage. The existing system for the equipment with the largest cooling loads was transformed into a “re-circulating” system by retrofitting the necessary pipes, pumps, and cooling tower. Work is underway to install re-circulating cooling systems for other pieces of equipment.
The company has also reduced the amount of water used for space and equipment cleaning by educating its personnel about optimum
1 Material for the case study is provided by Wafeer Initiative, see: www.wafeer.net
Installation of new
water meters.
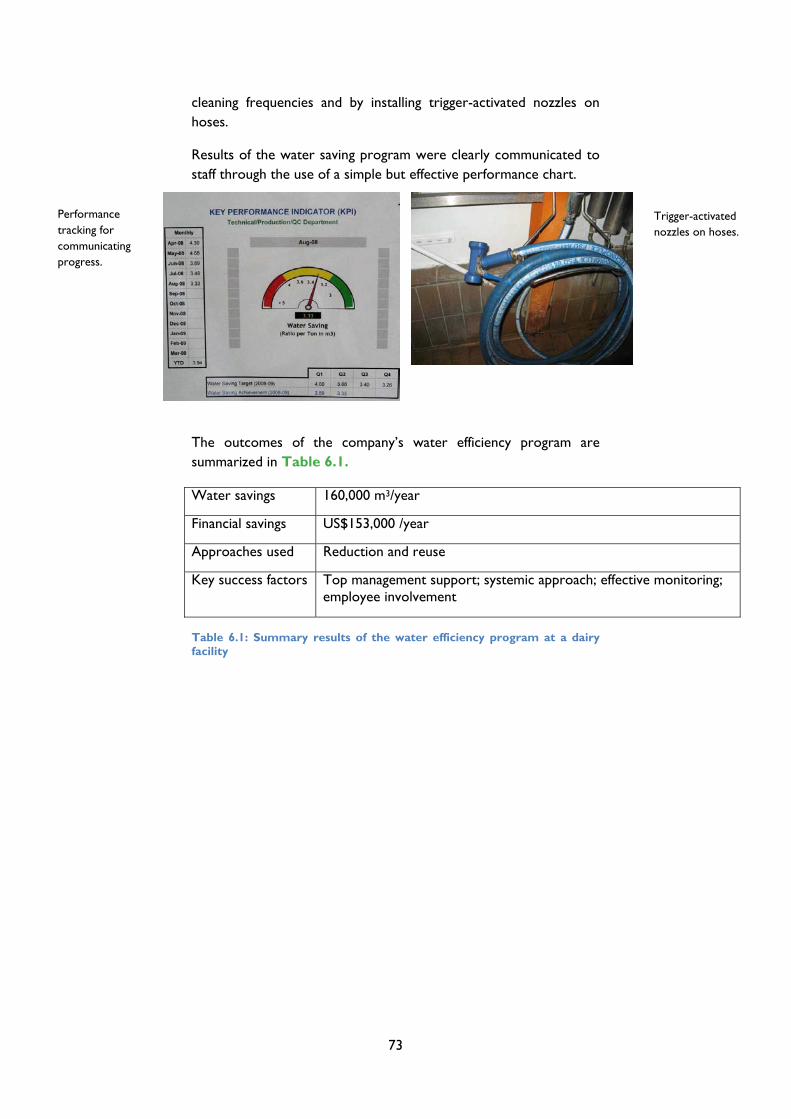
73
cleaning frequencies and by installing trigger-activated nozzles on hoses.
Results of the water saving program were clearly communicated to staff through the use of a simple but effective performance chart.
The outcomes of the company’s water efficiency program are summarized in Table 6.1.
Water savings 160,000 m3/year
Financial savings US$153,000 /year
Approaches used Reduction and reuse
Key success factors Top management support; systemic approach; effective monitoring; employee involvement
Table 6.1: Summary results of the water efficiency program at a dairy facility
Trigger-activated nozzles on hoses.
Performance tracking for communicating progress.

74
CASE STUDY 2: INTERNAL AND EXTERNAL RECYCLING IN A PAPER PORDUCTION FACILITY- JEDDAH, SAUDI ARABIA2
Running a water intensive process like paper production in Saudi Arabia, a water-scarce country, is a challenging task. The management of the paper production company was highly aware of this challenge and decided to meet it with strong commitment and continuous innovation. First, the company reached an agreement with the nearby municipal wastewater treatment plant to permit reuse of treated domestic wastewater in the company’s operations. This has already enabled significant water productivity gains. However, the innovations didn’t stop there.
When it started operations, the plant used 20 m3 of water for every ton of product. Convinced about the possibilities to reduce this ratio, the company’s management aggressively searched for options. With input from the general manager, trained as an environmental engineer, the company systematically screened all water inefficiencies in the plant and thoroughly assessed all effluent streams for their recycling potential. Based on these assessments, a treatment unit consisting of screens, drum filters, two dissolved-air floatation units, and gravity filters was installed to treat effluent streams. Treated effluents are now fed back into the process for reuse.
2 Material for the case study is provided by Wafeer Initiative, see: www.wafeer.net
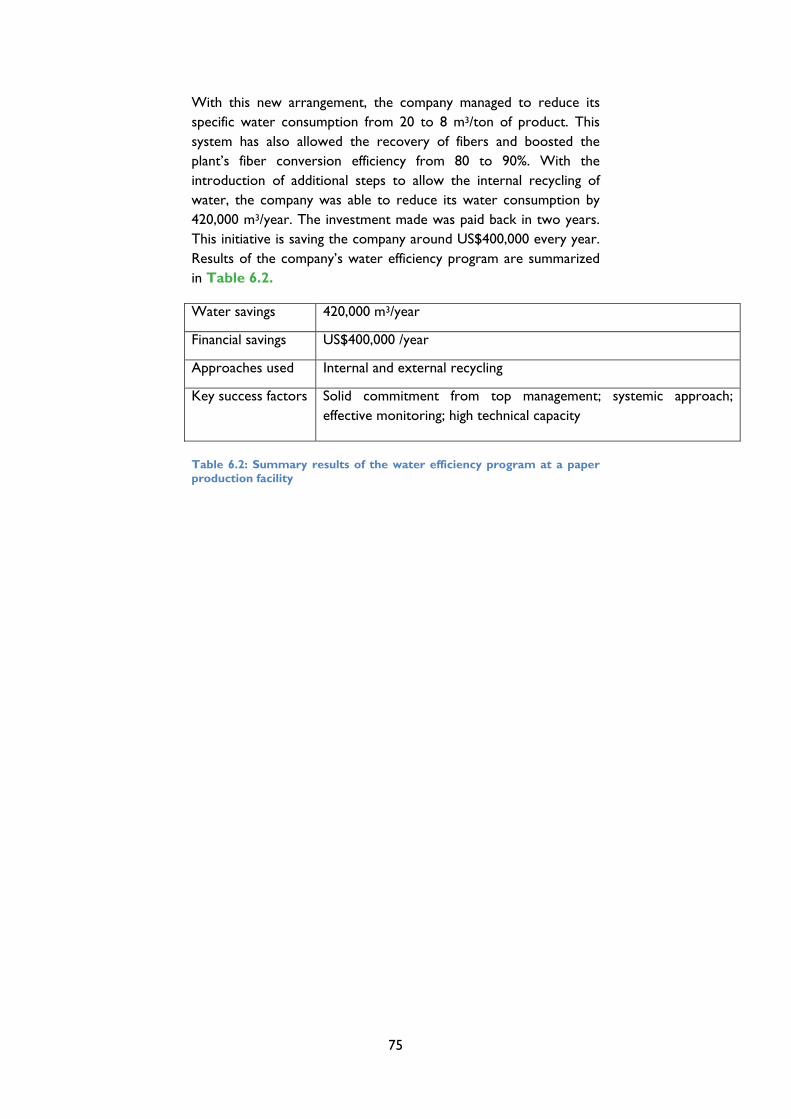
75
With this new arrangement, the company managed to reduce its specific water consumption from 20 to 8 m3/ton of product. This system has also allowed the recovery of fibers and boosted the plant’s fiber conversion efficiency from 80 to 90%. With the introduction of additional steps to allow the internal recycling of water, the company was able to reduce its water consumption by 420,000 m3/year. The investment made was paid back in two years. This initiative is saving the company around US$400,000 every year. Results of the company’s water efficiency program are summarized in Table 6.2.
Water savings 420,000 m3/year
Financial savings US$400,000 /year
Approaches used Internal and external recycling
Key success factors Solid commitment from top management; systemic approach; effective monitoring; high technical capacity
Table 6.2: Summary results of the water efficiency program at a paper production facility

76
CASE STUDY 3: SAVING WATER AND MONEY IN A FOOD PROCESSING FACILITY – EGYPT3
Excessive water use at a food processing facility, a major producer of frozen potatoes and vegetables, was forcing the company to bear additional costs. Where the facility is located, there was an excess pressure on water resources and on the sewer network in the area. Moreover, the food plant’s high rates of wastewater generation were having negative impacts on the surrounding environment. When the company realized the strategic importance of reducing water consumption, it decided to address the efficient use of water in the company’s operations.
Originally, the company’s average water consumption was about 5.1 m3/ton of product while the industry norm is averaging about 4 m3/ton. Process operations in the food facility were re-analyzed in order to identify opportunities for reducing water consumption. This analysis has prompted the company to implement projects to repair water leaks and to reuse water.
Water leaks in the cooling towers area were repaired, leading to reduced water use by about 26,000 m3/year and cost savings on the order of US$6,000 /year.
Water reuse projects were implemented throughout the plant at an investment cost of about US$10,500, resulting in water savings of
3 Material for this case was provided by the Egypt National Cleaner Production Center (www.encpc.org), which is affiliated with the Ministry of Trade and Industry (MTI) in close cooperation with the United Nations Industrial Development Organization (UNIDO).

77
about 120,000 m3/year and US$27,000 /year in cost savings. The payback period, after electricity and maintenance costs were factored in, was about 4.3 months.
As a result of implementing these water efficiency projects, the company’s new water consumption average was about 3.04 m3/ton of product, which is below the world average standard for this industry. The outcomes of the company’s water efficiency program are summarized in Table 6.3.
Water savings 146,000 m3/year
Financial savings US$33,000 /year
Approaches used Reuse, leak repairs
Key success factors Top management support; effective monitoring; good practical training
Table 6.3: Summary results of the water efficiency program at a food processing facility
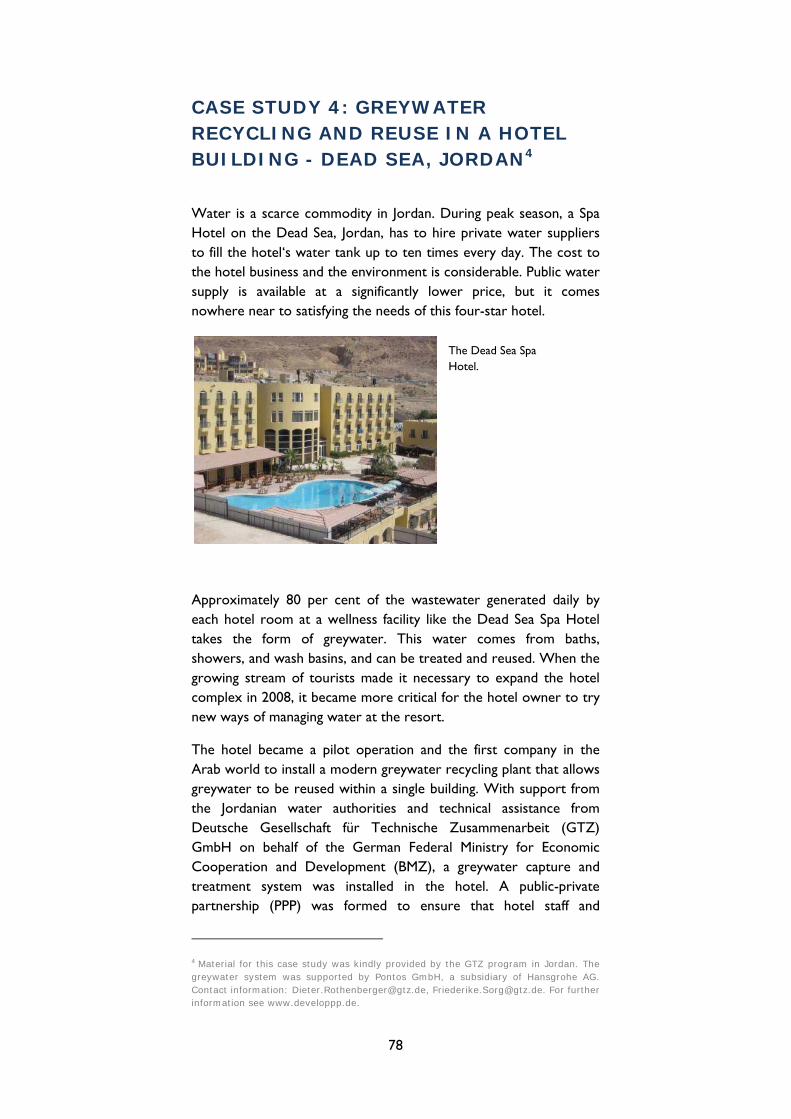
78
CASE STUDY 4: GREYWATER RECYCLING AND REUSE IN A HOTEL BUILDING - DEAD SEA, JORDAN4
Water is a scarce commodity in Jordan. During peak season, a Spa Hotel on the Dead Sea, Jordan, has to hire private water suppliers to fill the hotel‘s water tank up to ten times every day. The cost to the hotel business and the environment is considerable. Public water supply is available at a significantly lower price, but it comes nowhere near to satisfying the needs of this four-star hotel.
Approximately 80 per cent of the wastewater generated daily by each hotel room at a wellness facility like the Dead Sea Spa Hotel takes the form of greywater. This water comes from baths, showers, and wash basins, and can be treated and reused. When the growing stream of tourists made it necessary to expand the hotel complex in 2008, it became more critical for the hotel owner to try new ways of managing water at the resort.
The hotel became a pilot operation and the first company in the Arab world to install a modern greywater recycling plant that allows greywater to be reused within a single building. With support from the Jordanian water authorities and technical assistance from Deutsche Gesellschaft für Technische Zusammenarbeit (GTZ) GmbH on behalf of the German Federal Ministry for Economic Cooperation and Development (BMZ), a greywater capture and treatment system was installed in the hotel. A public-private partnership (PPP) was formed to ensure that hotel staff and
4 Material for this case study was kindly provided by the GTZ program in Jordan. The greywater system was supported by Pontos GmbH, a subsidiary of Hansgrohe AG. Contact information: [email protected], [email protected]. For further information see www.developpp.de.
The Dead Sea Spa Hotel.
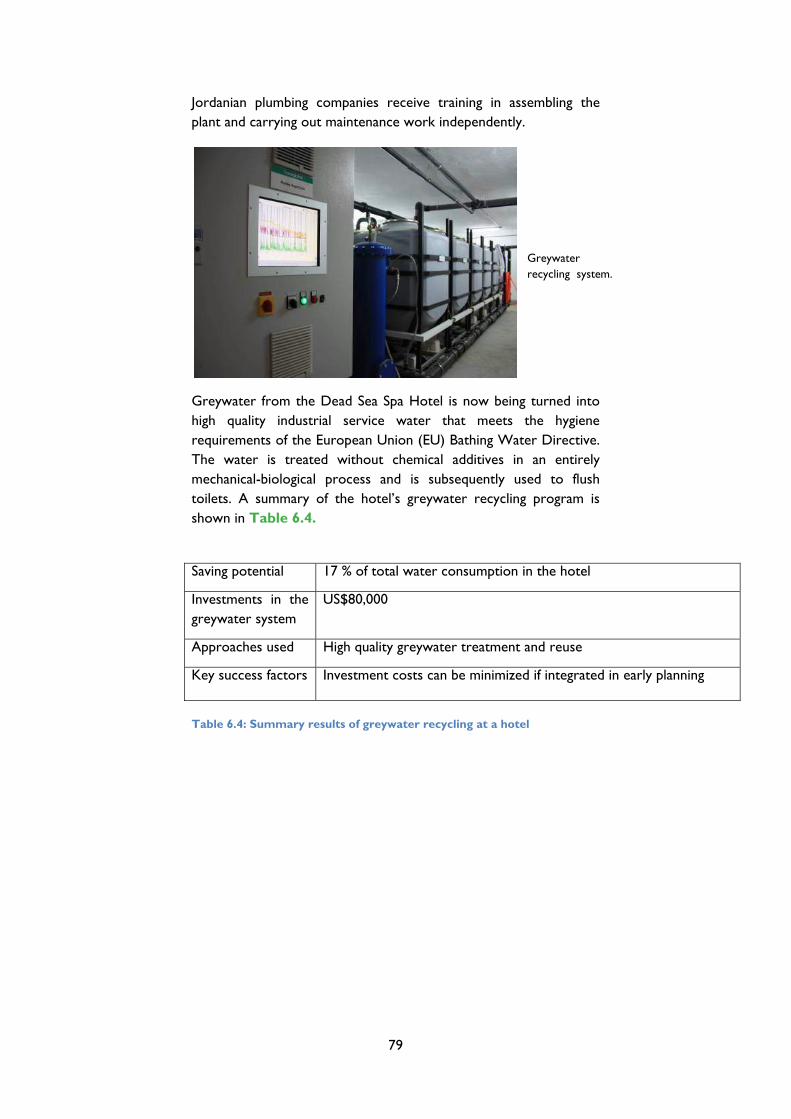
79
Jordanian plumbing companies receive training in assembling the plant and carrying out maintenance work independently.
Greywater from the Dead Sea Spa Hotel is now being turned into high quality industrial service water that meets the hygiene requirements of the European Union (EU) Bathing Water Directive. The water is treated without chemical additives in an entirely mechanical-biological process and is subsequently used to flush toilets. A summary of the hotel’s greywater recycling program is shown in Table 6.4.
Saving potential 17 % of total water consumption in the hotel
Investments in the greywater system
US$80,000
Approaches used High quality greywater treatment and reuse
Key success factors Investment costs can be minimized if integrated in early planning
Table 6.4: Summary results of greywater recycling at a hotel
Greywater recycling system.
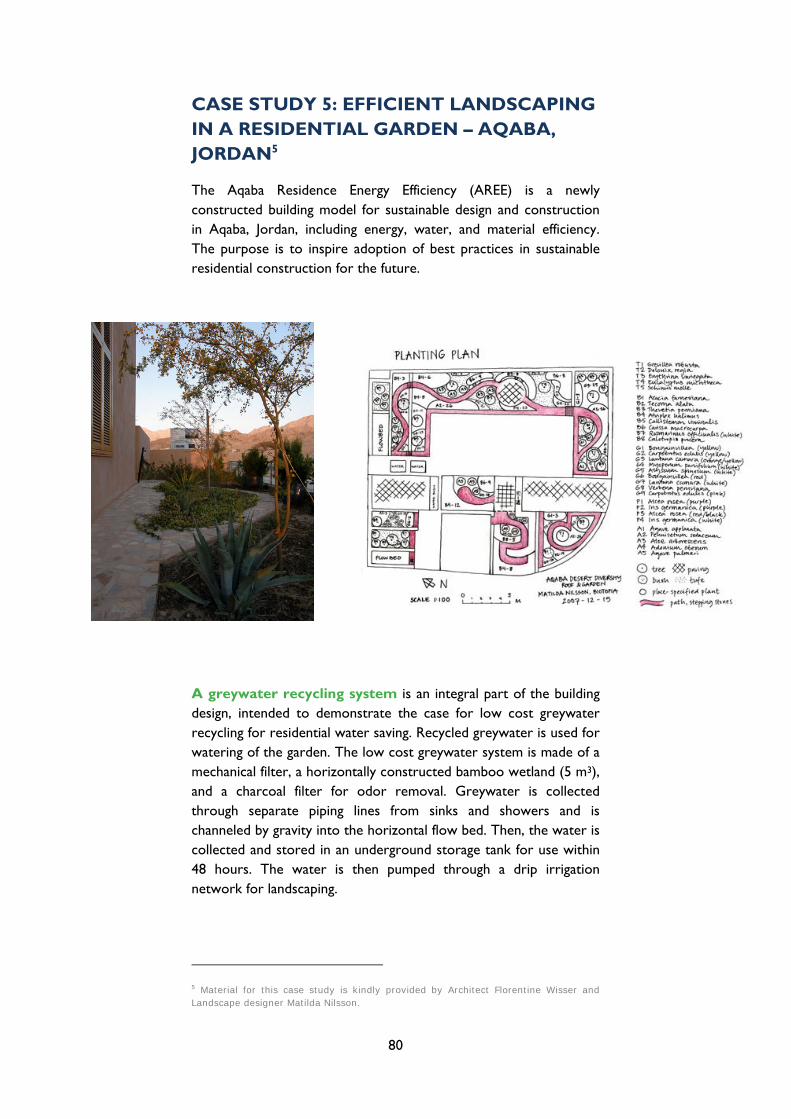
80
CASE STUDY 5: EFFICIENT LANDSCAPING IN A RESIDENTIAL GARDEN – AQABA, JORDAN5
The Aqaba Residence Energy Efficiency (AREE) is a newly constructed building model for sustainable design and construction in Aqaba, Jordan, including energy, water, and material efficiency. The purpose is to inspire adoption of best practices in sustainable residential construction for the future.
A greywater recycling system is an integral part of the building design, intended to demonstrate the case for low cost greywater recycling for residential water saving. Recycled greywater is used for watering of the garden. The low cost greywater system is made of a mechanical filter, a horizontally constructed bamboo wetland (5 m3), and a charcoal filter for odor removal. Greywater is collected through separate piping lines from sinks and showers and is channeled by gravity into the horizontal flow bed. Then, the water is collected and stored in an underground storage tank for use within 48 hours. The water is then pumped through a drip irrigation network for landscaping.
5 Material for this case study is kindly provided by Architect Florentine Wisser and Landscape designer Matilda Nilsson.
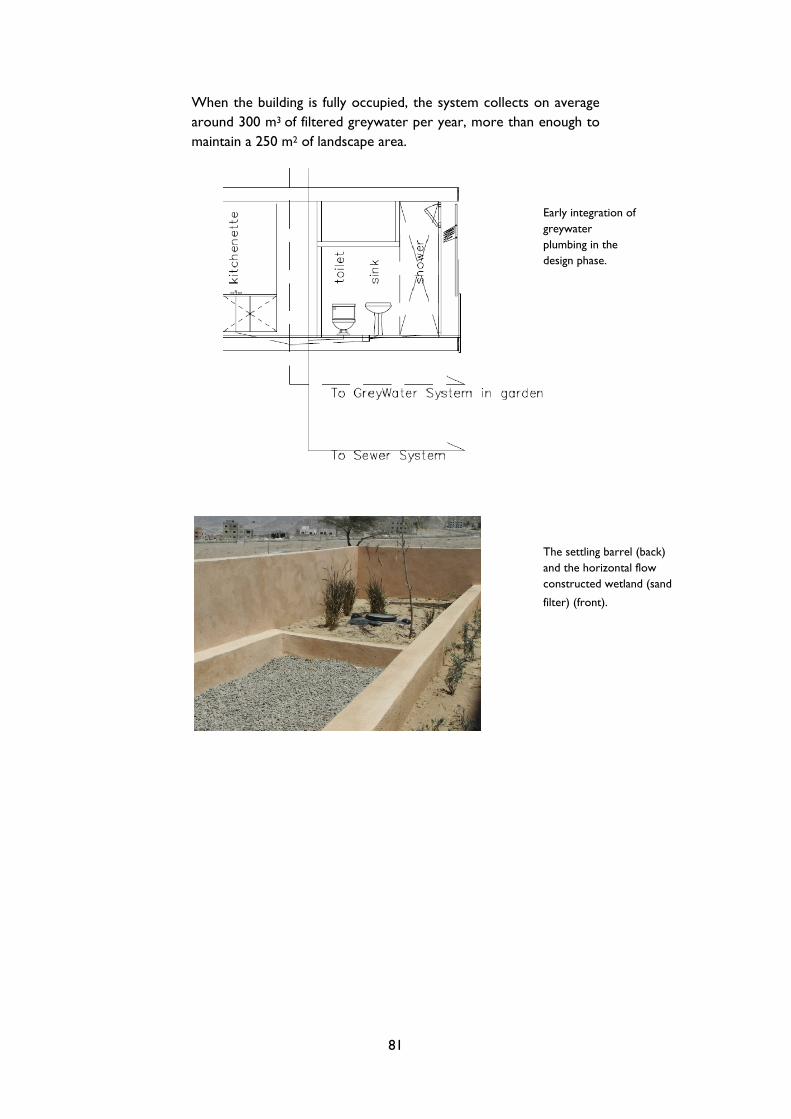
81
When the building is fully occupied, the system collects on average around 300 m3 of filtered greywater per year, more than enough to maintain a 250 m2 of landscape area.
Early integration of greywater plumbing in the design phase.
The settling barrel (back) and the horizontal flow constructed wetland (sand
filter) (front).
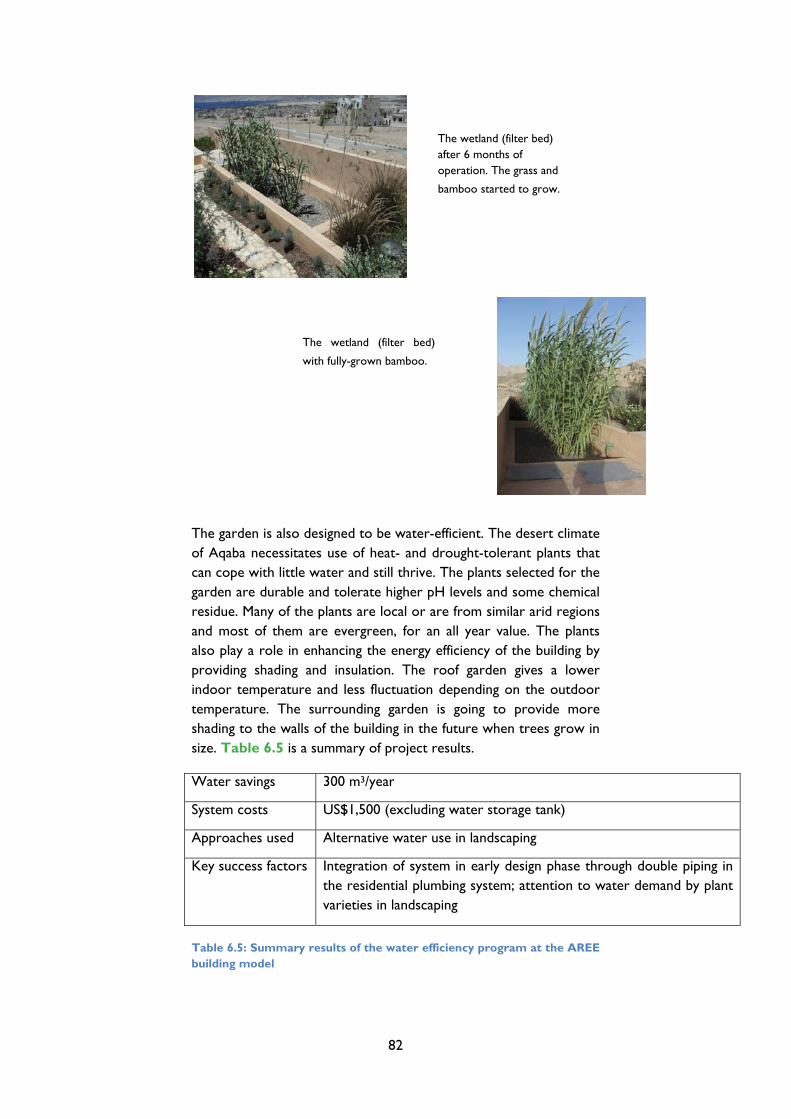
82
The garden is also designed to be water-efficient. The desert climate of Aqaba necessitates use of heat- and drought-tolerant plants that can cope with little water and still thrive. The plants selected for the garden are durable and tolerate higher pH levels and some chemical residue. Many of the plants are local or are from similar arid regions and most of them are evergreen, for an all year value. The plants also play a role in enhancing the energy efficiency of the building by providing shading and insulation. The roof garden gives a lower indoor temperature and less fluctuation depending on the outdoor temperature. The surrounding garden is going to provide more shading to the walls of the building in the future when trees grow in size. Table 6.5 is a summary of project results.
Water savings 300 m3/year
System costs US$1,500 (excluding water storage tank)
Approaches used Alternative water use in landscaping
Key success factors Integration of system in early design phase through double piping in the residential plumbing system; attention to water demand by plant varieties in landscaping
Table 6.5: Summary results of the water efficiency program at the AREE building model
The wetland (filter bed) after 6 months of operation. The grass and
bamboo started to grow.
The wetland (filter bed)
with fully-grown bamboo.

83
APPENDIX B
Additional resources
For further information on detailed technical solutions, users are encouraged to consult the added list of resources in this appendix.
For more information on water efficiency in buildings, consult:
The New Mexico Office of the State Engineer offers a comprehensive water efficiency guide for commercial, institutional, and industrial users. The guide can be downloaded from: http://www.ose.state.nm.us/water-info/conservation/pdf-manuals/cii-users-guide.pdf
Sydney Water from Australia provides a wealth of information for best practices of water efficiency in institutional and commercial buildings. The documentation includes specific guidance on cooling systems and has a diverse set of case studies. The material can be obtained from: http://www.sydneywater.com.au/Water4Life/InYourBusiness/Publications.cfm
Waterwise from the United Kingdom (UK) offers a wide range of tips and guidance for improving water use efficiency in residential buildings. The material can be reached from http://www.waterwise.org.uk/
The Rocky Mountain Institute has prepared a simple but comprehensive handbook for water use efficiency at homes. The handbook can be downloaded from: http://www.rainharvest.com/more/Rocky%20Mtn%20Water%20Efficiency%20in%20Homes.pdf
The US Geological Survey (USGS) website provides simple tools to calculate how much water you might be wasting due to dripping taps and faucets. Available at: http://ga.water.usgs.gov/edu/sc4.html
84
For more information on water efficiency in industrial facilities, consult:
Envirowise provides various methodological support materials and a number of sector specific water saving measures. Available at: http://envirowise.wrap.org.uk/uk/Topics-and-Issues/Water.html
The World Bank publishes the Pollution Prevention and Abatement Handbook, which Provides a wealth of sector-specific guidance for water productivity. Available at: http://smap.ew.eea.europa.eu/test1/fol083237/poll_abatement_hanbook.pdf/
European Commission – Institute for Prospective Technological Studies produces sector- specific Reference Documents for Best Available Techniques. Available at: http://eippcb.jrc.es/reference/
North Carolina Department of Environment and Natural Resources produces a Water Efficiency Manual for Commercial, Institutional, and Industrial Facilities. Available at: http://www.p2pays.org/ref/01/00692.pdf
Wafeer Initiative - Saudi Arabia offers case studies and training materials on starting water efficiency programs in industrial facilities. Available at: http://www.wafeer.net
For more information on water efficiency in agriculture and landscaping, consult:
Food and Agricultural Organisation (FAO) of the United Nations provides a wealth of information on water efficient irrigation practices, irrigation scheduling, irrigation techniques, water pricing, and transfer of water management responsibilities. The material is freely available for downloading at: http://www.fao.org/publications/en/
AQUASTAT (Crop Water Requirements) at FAO provides useful information and methodologies for calculating water requirements for different crops in different countries. Available at: http://www.fao.org/nr/water/aquastat/water_use/index4.stm

85
The Center for the Study of the Built Environment (CSBE) provides a comprehensive guide for water efficient gardens and landscapes as well as a list of drought-resistant plants. Available at: http://www.csbe.org

86
APPENDIX C
References
AFED (2008). Arab environment: Future Challenges. Arab Forum for the Environment and Development (AFED), Beirut.
AFED (2009). Arab environment: Climate Change. Arab Forum for Environment and Development (AFED), Beirut.
AQUASTAT (2008). Irrigation in the Middle East Region in Figures. Food and Agricultural Organization (FAO), Rome.
Burney, J., Woltering, L., Burke, M., Naylor, R., and Pasternak, D. “Solar-powered drip irrigation enhances food security in the Sudano–Sahel.” Proceedings of the National Academy of Sciences (PNAS), 107, 5, 2010: 1848-1853.
Environment Canada (2009). Water Conservation – Every Drop Counts. Available at: http://www.ec.gc.ca/eau-water/default.asp?lang=en&n=E85F9FC8-1
Envirowise (2005). Tracking water use to reduce costs. Envirowise. Available at: http://envirowise.wrap.org.uk/uk/Our-Services/Publications/GG152R--Tracking-Water-Use-to-Cut-Costs.html
FAO (1986). Irrigation water management: irrigation water needs. Food and Agricultural Organization (FAO), Rome.
Kijne, J., Barron, J., Hoff, H., Rockstöm, J., Karlberg, L., Gowing, J., Wani, S.P., and Wichelns, D. (2009). Opportunities to increase water productivity in agriculture with special reference to Africa and South Asia. Stockholm Environmental Institute, Stockholm.
Schultz Communications (1999). A Water Conservation Guide for Commercial, Institutional and Industrial Users. New Mexico Office of the State Engineer, Albuquerue, New Mexico. Available at: http://www.ose.state.nm.us/water-info/conservation/pdf-manuals/cii-users-guide.pdf
Texas Water Development Board (2008). Agricultural Water Conservation Practices. Texas Water Development Board, Austin, TX. Available at:

87
http://www.twdb.state.tx.us/assistance/conservation/conservationpublications/agbrochure.pdf
UNEP-FI (2007). Challenges of water scarcity: a business case for financial institutions. United Nations Development Program-Finance Initiative (UNEP-FI), Geneva.
UNEP (2008). Vital Water Graphics - An Overview of the State of the World’s Fresh and Marine Waters. 2nd Edition. United Nations Development Program (UNEP), Nairobi, Kenya. Available at: http://www.unep.org/dewa/vitalwater/index.html
USEPA (2004). Guidelines for Water Reuse. United States Environmental Protection Agency (USEPA), Washington, DC.
Vickers, A. (2002). Water use and conservation. Waterplow Press, Amherst, MA.
World Bank (2007). Making the Most of Scarcity: Accountability for Better Water Management Results in the Middle East and North Africa. The World Bank, Washington, DC.

About The Authors MURAT MIRATA
An international consultant who has received his M.Sc. in environmental engineering from Middle East Technical University, Turkey, and his Ph.D. in environmental management and policy from Lund University, Sweden. Since 1996, he has worked with numerous water efficiency programs both at the industrial and regional levels in different parts of the world. In the MENA region, he has helped with the formulation of strategic approaches for the sustainable management of water resources and infrastructure in
Aqaba, Jordan. He is also one of the key contributors to the first industrial water efficiency program (Wafeer) in Saudi Arabia. Primarily working as an international consultant, Dr. Mirata is an associate professor at Lund University where he delivers training programs, among others, on cleaner technologies and industrial resource efficiency both for students and professionals. TAREQ EMTAIRAH
A senior researcher at the International Institute for Industrial Environmental Economics (IIIEE) at Lund University, Sweden, where he carries out applied research and training on resource efficiency, cleaner production, and industrial environmental management. Dr. Emtairah was the developer and coordinator of Wafeer, a public-private initiative for efficient water management in the industrial estate of Jeddah, Saudi Arabia. He played a lead role in the development and implementation of the first water and energy efficient
model building in Aqaba, Jordan. He was the lead researcher and author for the UNEP report on water scarcity risks and project finance in emerging economies. In 2008 and 2009, Dr. Emtairah provided executive training to companies in member countries of the Gulf Cooperation Council (GCC) on corporate environmental and social responsibility including resource efficiency. Revised by: - BASHAR ZEITOON, Program Manager, AFED. - BOGHOS GHOUGASSIAN, Manager of Research and Training, Al-Bia Wal-Tanmia (Environment & Development) magazine.

P.O. Box 113-5474, Beirut, Lebanon Tel: (+961) 1 321800 Fax: (+961) 1 321900 [email protected]
www.afedonline.org


