Water-Energy-Carbon Nexus in Cities: Cases from Bangkok, New Delhi, Tokyo Presentation: Dr. Sangam Shrestha Water Engineering and Management Asian Institute of Technology (AIT) Collaborators: Dr. Shobhakar Dhakal, AIT Dr. Sangam Shrestha, AIT Mr. Ashish Shrestha, AIT Prof. Shinji Kaneko, Hiroshima University Prof. Arun Kansal, TERI Workshop on “Water Energy Food Nexus: International Cooperation and Technology Transfer” 18 March, 2015 Paris
Transcript
Water-Energy-Carbon Nexus in Cities: Cases from Bangkok, New Delhi, Tokyo
Presentation: Dr. Sangam Shrestha Water Engineering and Management Asian Institute of Technology (AIT)
Collaborators: Dr. Shobhakar Dhakal, AIT Dr. Sangam Shrestha, AIT Mr. Ashish Shrestha, AIT Prof. Shinji Kaneko, Hiroshima University Prof. Arun Kansal, TERI
Workshop on “Water Energy Food Nexus: International Cooperation and Technology Transfer” 18 March, 2015
Paris
Outline
• Introduction
• Water, Energy, Carbon Nexus in Cities
• Case studies – Key Findings
• Conclusions (preliminary)
0
3000
6000
9000
1950 1970 1990 2010 2030 2050 2070 2090 2110
World GEA-H urb World GEA-H rur World GEA-M urb World GEA_M rur
World GEA-L urb World GEA_L rur World UN urb World UN rur
World HIST urb World HIST rur
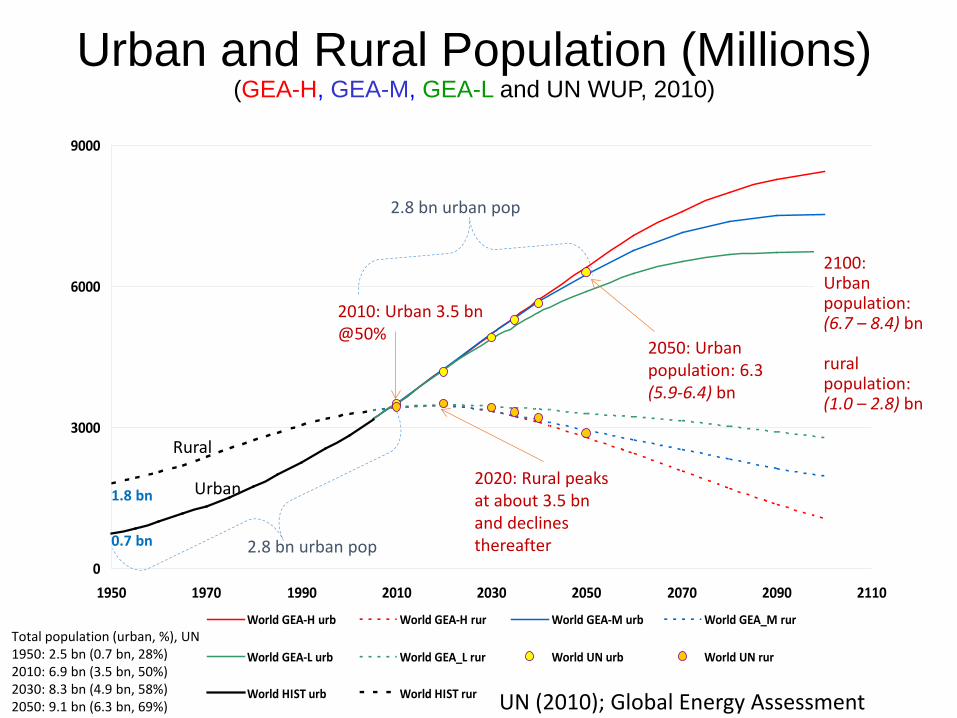
Urban and Rural Population (Millions) (GEA-H, GEA-M, GEA-L and UN WUP, 2010)
2020: Rural peaks at about 3.5 bn and declines thereafter
2.8 bn urban pop
Total population (urban, %), UN 1950: 2.5 bn (0.7 bn, 28%) 2010: 6.9 bn (3.5 bn, 50%) 2030: 8.3 bn (4.9 bn, 58%) 2050: 9.1 bn (6.3 bn, 69%)
1.8 bn
0.7 bn 2.8 bn urban pop
1. Energy use in water sector is growing to meet increasing water demand
2. Water use in energy production is also growing
3. This nexus contribute to the emission of GHGs
WEC Nexus
Why WEC nexus is important in Cities? • WEC nexus directly influences three key contemporary
policy issues i.e. water security, energy security and climate change mitigation. Usually decision makers are acting on them separately but an integrated knowledge as well as considerations is immensely useful.
• Past research and our understanding on drivers, processes and implications of this nexus is limited for cities.
• Improving this nexus in cities will greatly aid sustainability efforts by city governments.
Urban Water & Energy System
Case Studies
• Cover total area of 7,761.50 km² • Population: 10.5 million • Management: Municipal Waterworks Authority (MWA) and
Provincial Waterworks Authority (PWA) • Piped systems established in 1909.
• Cover total area of total area of 621.81 km2 • Population: 13 million • Management: Bureau of Waterworks and Bureau of Sewerage -
Tokyo Metropolitan Government.
• Cover total area of total area of 1,486 km2 • Population: 16.7 million • Management: Delhi Water Board
Bangkok Metropolitan Region
Tokyo
National Capital Territory, Delhi
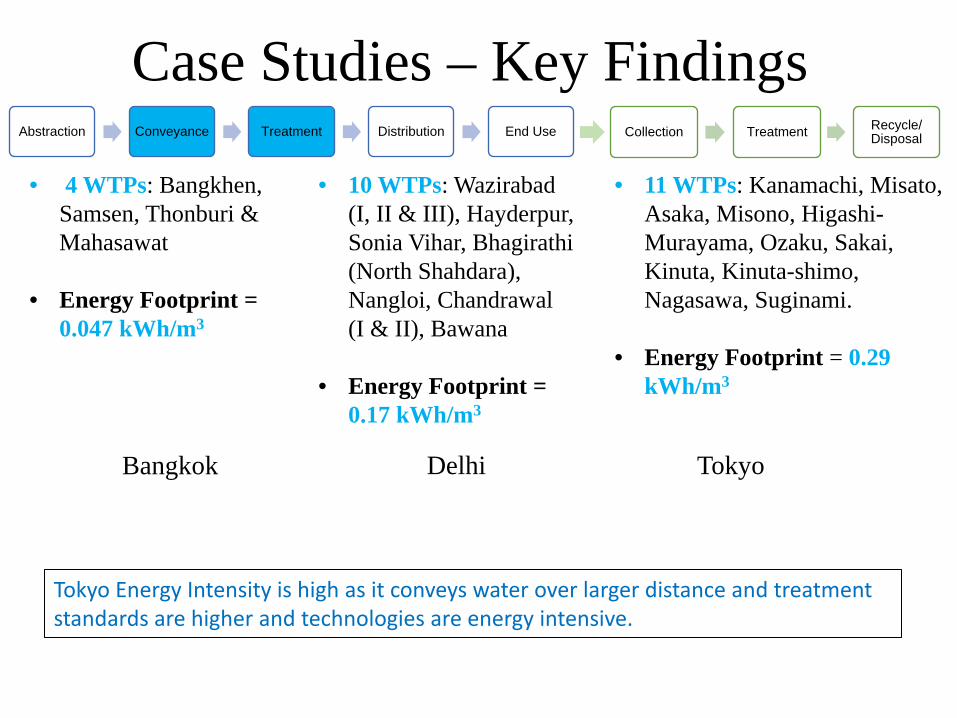
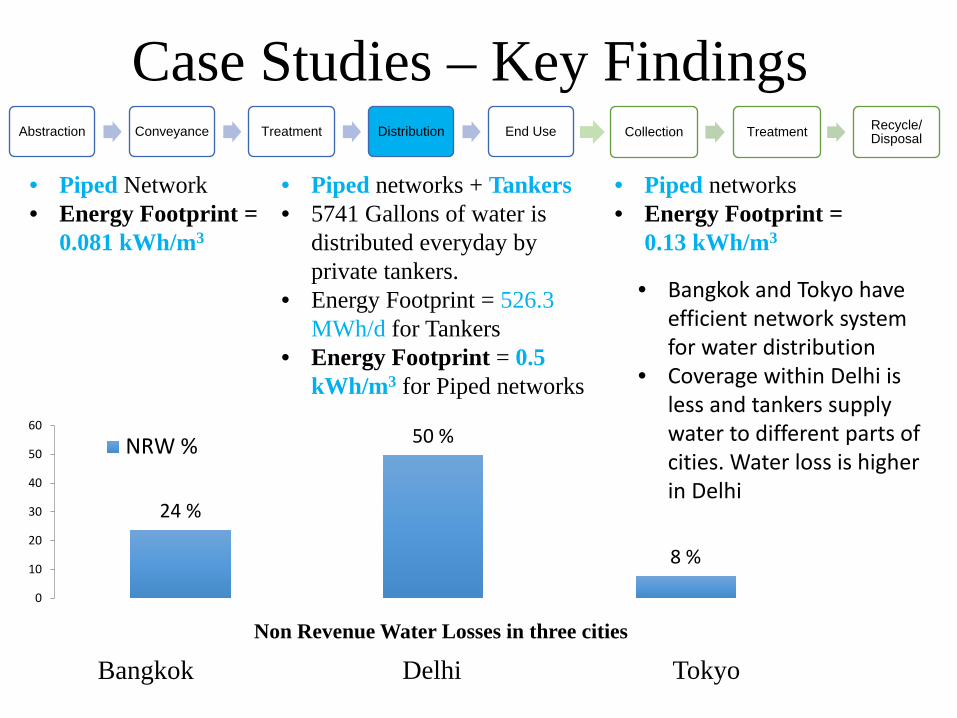
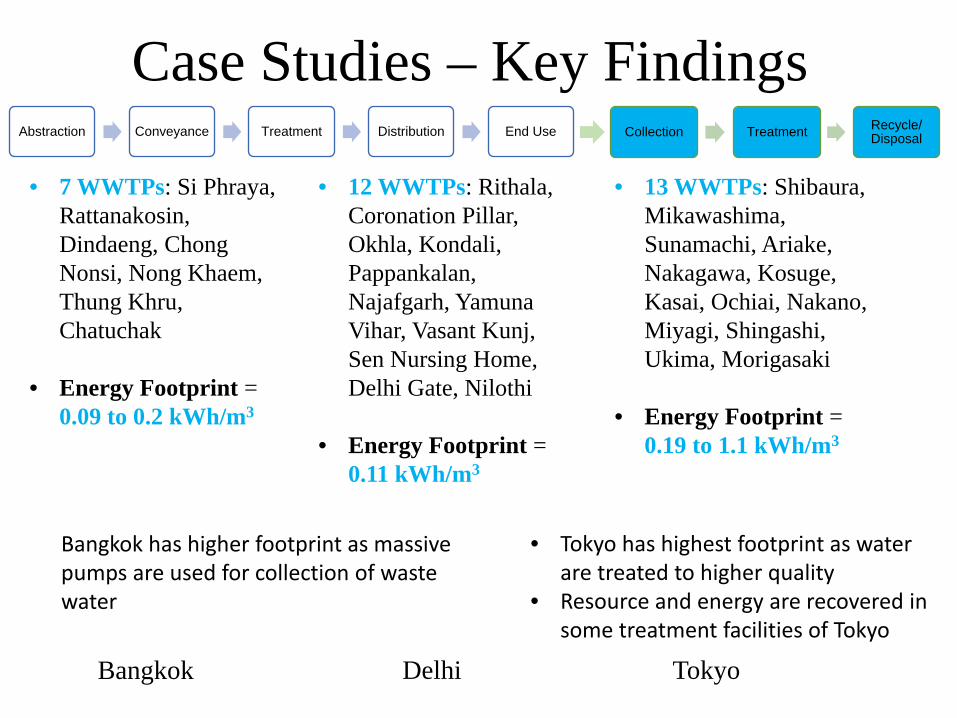
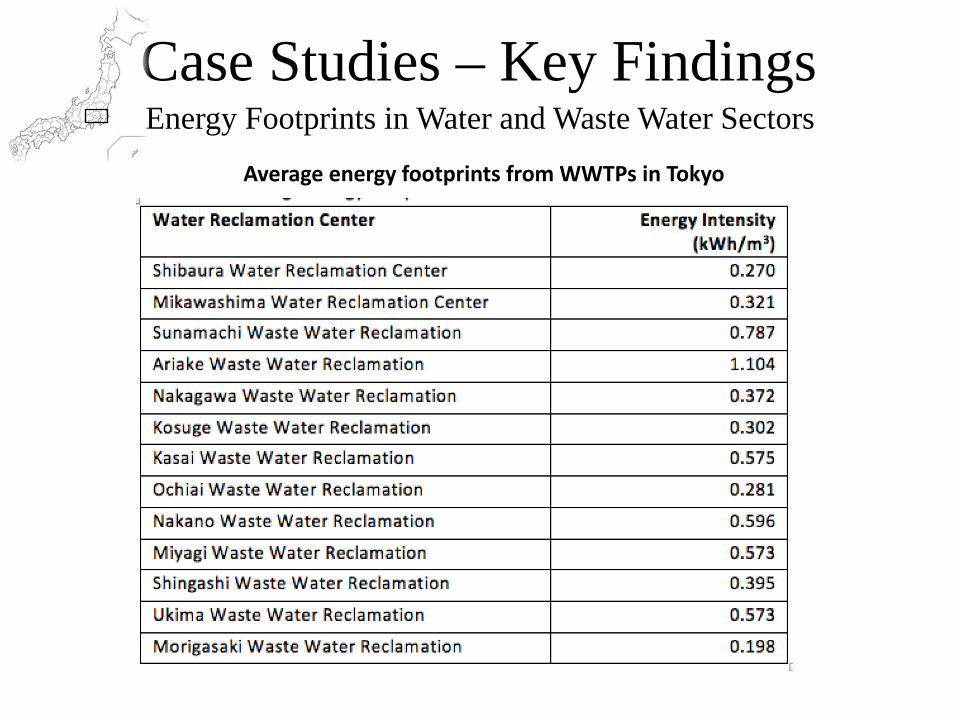
Case Studies – Key Findings
Bangkok Delhi Tokyo
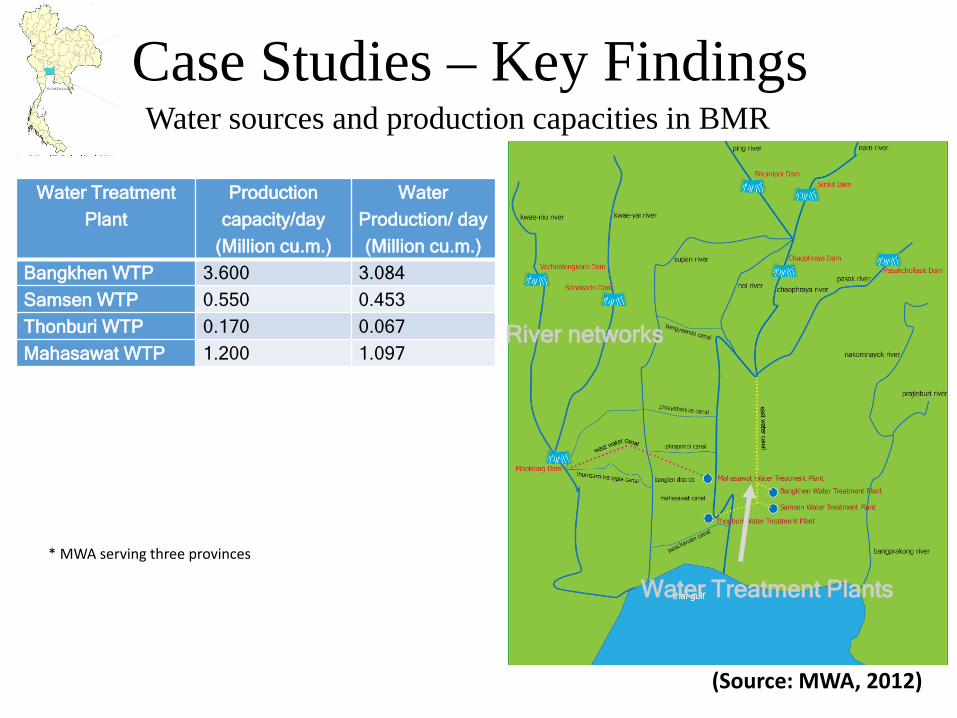
• Source: Surface Water from Chao Phraya river and Mae Klong river.
• Ground water extraction is prohibited since 1983.
• Energy Intensity for water abstraction = 0.009 kWh/m3
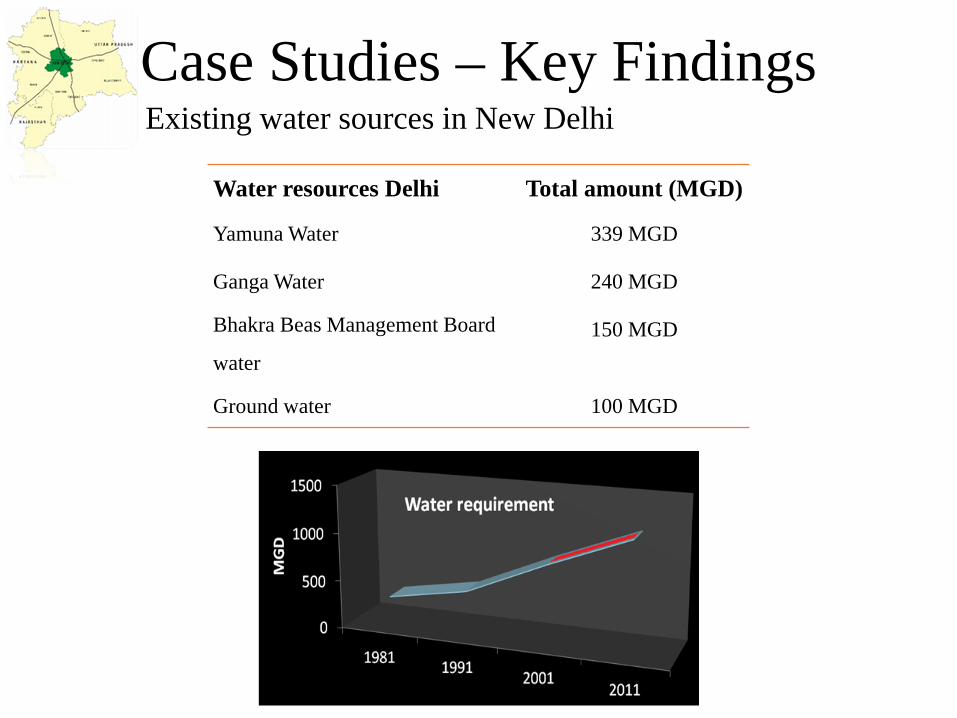
• Source of water: Surface Water from Yamuna and Ganga River; & Ground water.
• Energy Intensity for water abstraction = 0.3 kWh/m3
• Source : Surface Water from Edogawa, Tonegawa, Tamagawa, Sagamigawa rivers.
• Small portion from confined groundwater aquifers.
• Energy Intensity for water abstraction = 0.19 kWh/m3
Abstraction Conveyance Treatment Distribution End Use Recycle/ Disposal Treatment Collection
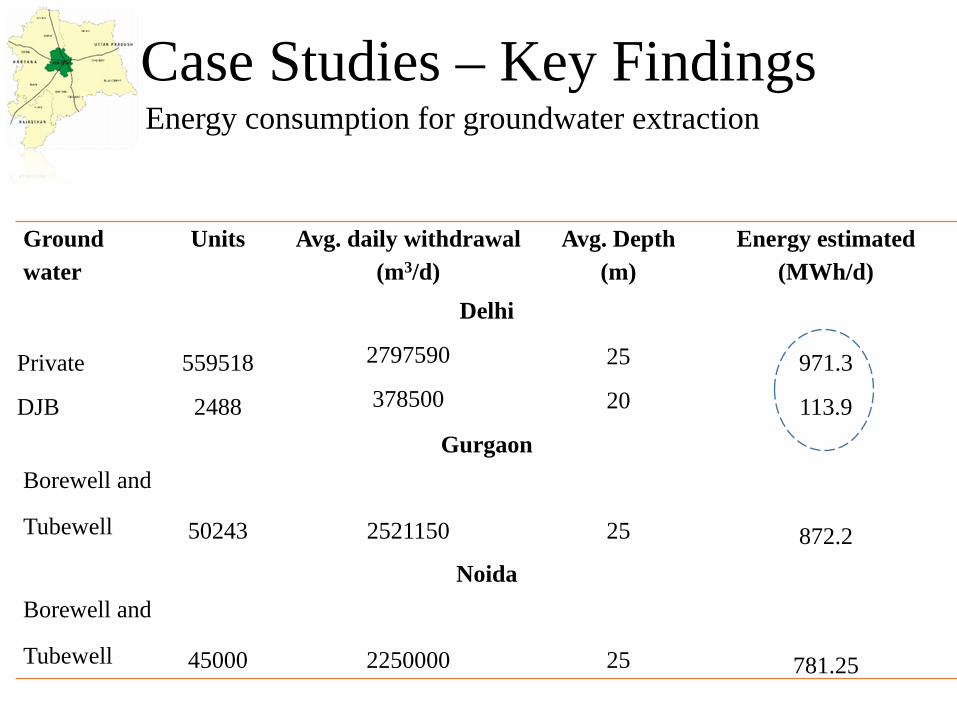
In Delhi EI is high due to excessive abstraction of Groundwater
Case Studies – Key Findings Water sources and production capacities in BMR
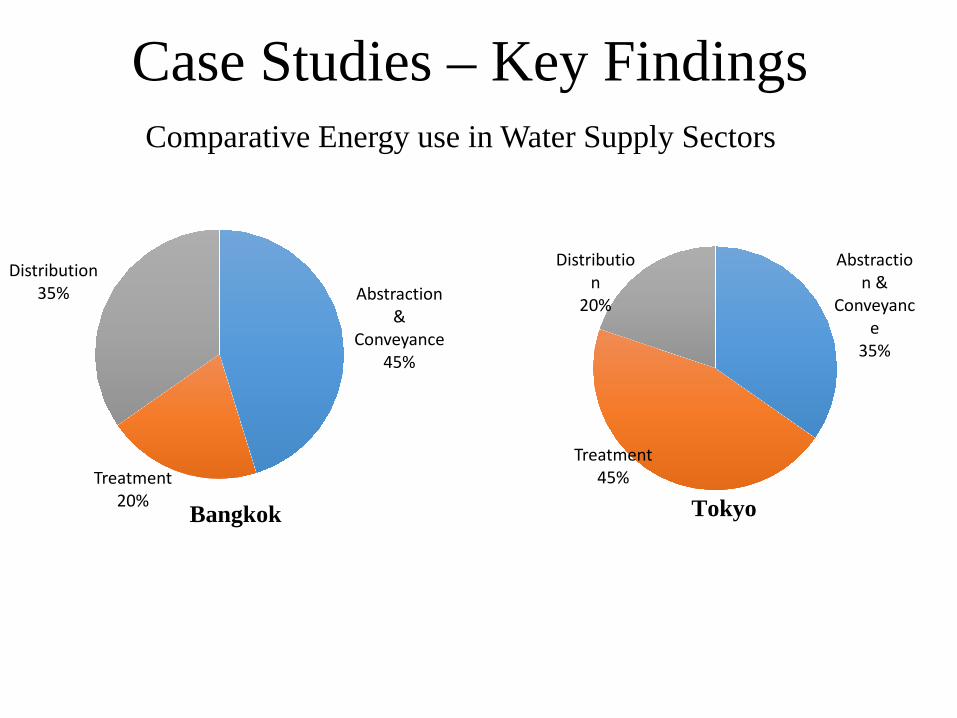
Case Studies – Key Findings Comparative Energy use in Water Supply Sectors
Bangkok
Abstraction &
Conveyance
35%
Treatment 45%
Distribution
20%
Tokyo
Abstraction &
Conveyance 45%
Treatment 20%
Distribution 35%
Conclusion
• Energy footprint of urban water cycle depends on characteristics of urban water cycle including nature of water sources, distances, nature/extent of infrastructure, choice of technologies, losses and management practices.
• Better understanding of drivers and quantification of energy/carbon footprint assist for policies since energy security, climate change mitigation and water security are three key contemporary policy agenda and must be integrated and optimized locally.
• We hope to provide a comprehensive report and understanding three cities in comparative fashion by the end of this year.
Thank you!!
http://wec-nexus.ait.asia/
Case Studies – Key Findings Key Policies
• 1967- MWA was established and in 1978- PWA. • Several acts for pollution regulation: Conservation of Public
Water Supply Canals Act of 1913 (amended in 1983). • Water quality management: Factories Act (1992), Hazardous
Substances Act (1992) and Public Health Act (1992, amended in 2007).
• Groundwater Act of 1977 (amended in 1992 and 2003) regulates abstraction of groundwater.
• Prohibition of ground water extraction from 2003. • Policies to increase capacities, connections and reduce NRW. • Policies & measures to optimize energy use in water sectors.
Case Studies – Key Findings Key Policies
• Ministry of Environment coordinates action plans on environment and water.
• Delhi Water Board Act, 1998 establish Board to discharge the functions of water supply & sewage disposal.
• Reduction in water losses by constructing lined canals. • Rehabilitation/upgrading of old infrastructures & technologies. • Increase sewerage coverage (from current 55%) & capacity
utilization to increase energy efficiency.
Case Studies – Key Findings Key Policies
• Formulation of ISO has led Japan Water Works Association (JWWA) to formulate the “Waterworks Guideline”
• Bureau of Waterworks conduct performance assessment which also address total power consumption in water treatment, “Tokyo Waterworks Management Plan 2013” was prepared for water supply management.
• TMG aims to reduce GHG emitted by the sewerage industry by 25% or more by 2020 and 18% or more by 2014, based on 2000 levels.
• Early discovery of water leakage & prompt maintenance. • Promoting efficiency of pumping systems & upgrading existing facilities to
conserve energy. • Utilization of sludge as the resources by reusing its chemical energy. • Plan to use of sludge gasification incinerators and reuse heat generated from
the sludge incineration for air conditioning and Ash materials as the byproduct for producing construction materials.
• Heat generated (about 120,000 GJ per year) by gas produced from sludge gasification is the equivalent to the amount of city gas used by 8,500 households during an entire year.
Understanding driving forces Urbanization
In 2012, Asia’s urban population was 44 percent which is expected to reach 64 percent at the middle of the century (UN, 2012). For developing world, it is expected that by 2030, 56 % of their population will live in cities. Tokyo -1st Largest City: 1955 (13.71 mil.), 2010 (36.83 mil.), 2020 (38.32 mil.), 2030 (37.19 mil) Delhi – 2nd Largest City: 2010 (21.94 mil.), 2020 (29.35 mil.), 2030 (36.06 mil.)
Case Studies – Key Findings Water sources in New Delhi
Hathnikund barrage Western Yamuna Canal, 113 km, 100MGD
Bhakra-Nangal storage/Sutlej river, 230 km, 140 MGD
Nangloi waterworks
Bawana waterworks
Dwarka waterworks
Haiderpur waterworks I
Najafgarh drain
Supplementary drain
Eastern Yamuna Canal, 25 km, 240 MGD
Chandrawal waterworks, 3 km
Wazirabad waterworks, 3 km
Bhagirathi waterworks
Sonia vihar waterworks
Shahdara Drain
Okhla Agra Canal
Hindon Cut
228km
231km Haiderpur waterworks II
20 km
25 km
112.4 km
Wazirabad barrage (210 MGD)
Data Sources: DHI, 2010; http://www.urbanindia.nic.in/programme/uwss/uiww
/PPT_4th_Meeting/DJB_Water_PPT.pdf
Thermal Power Plant
Tehri Dam/Upper Ganga Canal, 226 km, 240 MGD
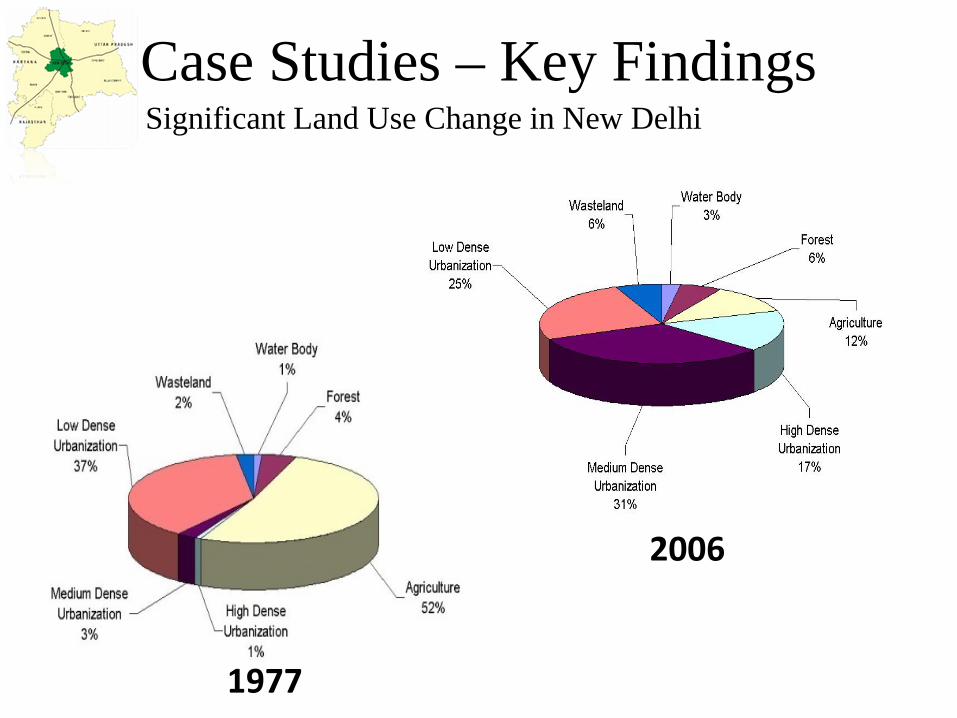
Case Studies – Key Findings Significant Land Use Change in New Delhi
1977
2006
Case Studies – Key Findings Treatment Technologies
Water Treatment Technologies
Supply Systems
Waste Water Treatment
Technologies
Water & Sludge Reuse
Energy & Carbon Implications
Bangkok
Rapid/Slow sand filtration, Advanced water treatment
Piped networks
Activated Sludge System
No reuse High, Carbon footprints
New Delhi
Rapid/Slow sand filtration, Membrane filtration in new systems, RO & UV filters are used in end-use side
Piped networks + Tankers
Activated Sludge, New system include Membrane bio reactor
Small portion of water is reused for gardening
High energy, carbon footprints due to use of fossil fuels
Tokyo Rapid/Slow sand filtration, Partially Advanced water treatment, Membrane filtration
Piped networks
Activated Sludge System, semi advanced, advanced wastewater process
Use of reclaimed water and recovery of energy from waste water byproducts
High energy, carbon footprints Comparatively best management practices.