Water Environmental Management in Asia Challenges, Opportunities and Expected Role of WEPA Water Environmental Management in Asia Challenges, Opportunities and Expected Role of WEPA Motoyuki Suzuki WEPA Special Advisor [email protected]Motoyuki Suzuki WEPA Special Advisor [email protected]2015.02.11 10 th Annual Meeting @ Colombo, Sri Lanka 2015.02.11 10 th Annual Meeting @ Colombo, Sri Lanka • Activities/documents • Dialogues with member countries for Information Sharing • Linkage with WWFs • Annual Meetings and Workshops • Database http://www.wepa‐db.net/index.htm State of water / Organizational arrangement /Legislative framework / Background / Law enforcement / Cases Database of technologies in operation / Information on appropriate technologies Activities by NGOs and CBOs / Governmental activities Various sources of water‐related information, Global level / Asia regional level / National level First Phase (2004‐2008)
Transcript
Water Environmental Management in Asia
Challenges, Opportunities andExpected Role of WEPA
Water Environmental Management in Asia
Challenges, Opportunities andExpected Role of WEPA
2015.02.11 10th Annual Meeting@ Colombo, Sri Lanka
2015.02.11 10th Annual Meeting@ Colombo, Sri Lanka
• Activities/documents• Dialogues with member countries for Information Sharing
• Linkage with WWFs
• Annual Meetings
and Workshops
• Database
http://www.wepa‐db.net/index.htm
State of water / Organizational arrangement /Legislative framework / Background / Law enforcement / Cases
Database of technologies in operation / Information on appropriate technologies
Activities by NGOs and CBOs / Governmental activities
Various sources of water‐related information, Global level / Asia regional level / National level
First Phase (2004‐2008)
‐‐‐ Knowledge Sharing for Solutions ‐‐‐• 2009‐11
• Review of Water Environmental Management • Starting with Two Fields of Topics
• Domestic Wastewater Treatment• Climate Change and Water Environment
• Identification of Specific Issues to be discussed
• 2012‐13• Experiences Sharing and Knowledge Sharing among Member
Countries through Solution Findings through:• Workshops, Bilateral meetings, Annual meetings etc.• Development of Twinning Programmes for Capacity
Empowerment etc.
Second Phase (2009‐2013)
Common Challenges :Some of the Issues identified by WEPA Partner Countries
Common Challenges :Some of the Issues identified by WEPA Partner Countries
‐ Legislation and Organization: Detailed systems and capacity development required in order to implement a legislative framework‐ Identification of proper paths for a new form of development, leap frog approaches
‐ Ensuring implementation of proper monitoring and data management‐ Adequate settings of water quality standards/effluent standards
‐ Coordination among relevant water organizations and regulations‐ Partnership among NGOs, GOs and various stakeholders, Cooperation between member countries, etc.
‐ Water quality management at the basin level‐ Integrated management?, upstream/downstream relations, diversified stakeholders, multiphase problems, long range optimization, etc.
‐ Legislation and Organization: Detailed systems and capacity development required in order to implement a legislative framework‐ Identification of proper paths for a new form of development, leap frog approaches
‐ Ensuring implementation of proper monitoring and data management‐ Adequate settings of water quality standards/effluent standards
‐ Coordination among relevant water organizations and regulations‐ Partnership among NGOs, GOs and various stakeholders, Cooperation between member countries, etc.
‐ Water quality management at the basin level‐ Integrated management?, upstream/downstream relations, diversified stakeholders, multiphase problems, long range optimization, etc. D
raft near the End of Second Phase
• Driver (Basic causes)– Increase of human activities: Population increase,
economic development, life style change, industrial development, urbanization, etc.
• Pressure to water environment– Waste water and solid from industry, domestic
activities, excess fertilizer, land use change, etc.
• State change– Algal broom, chemical and biochemical
contamination, biodiversity loss, drinking water deterioration
• Impact to human activities– Health effects, degraded living environment,
deteriorated ecosystems, lowering of property values, etc.
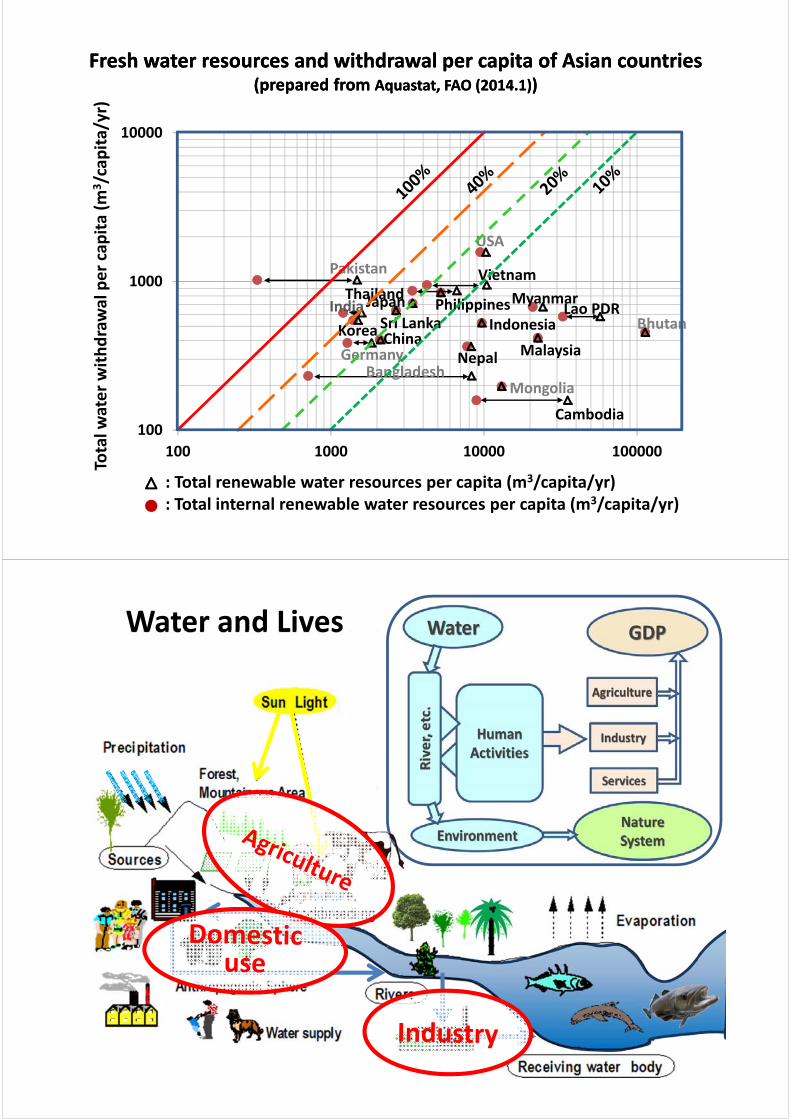
Southeast Asian countries have enjoyed the benefit of precipitation driven by the Monsoon.
The amount of withdrawal per capita is quite varied from country to country. Water resources may limit further development in some areas.
Agricultural water use is not a strong function of GDP but fertilizer consumption should be carefully controlled for excess application to be avoided.
Countries moving into industrialization and/or urbanization must be prepared for the increase of water demands. Development of policies related to water management becomes one of the essential factors for achieving sustainability in the future.
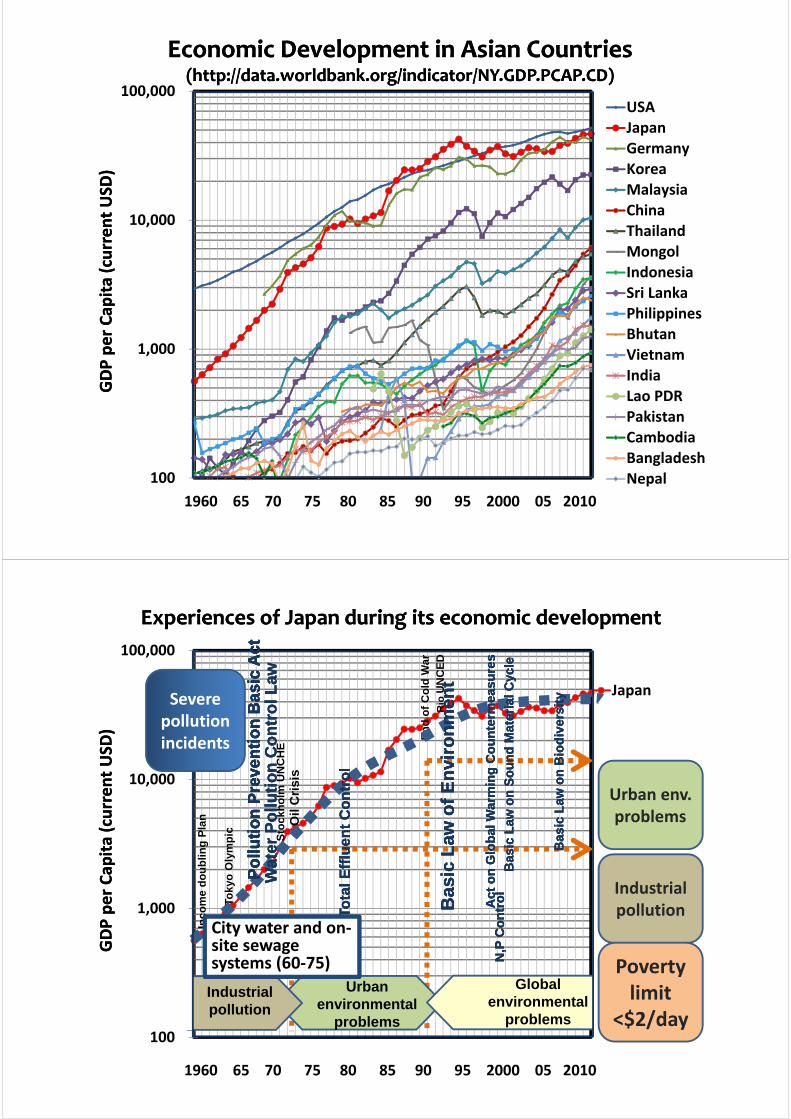
Coverage of Domestic Water Systems in Japan,1960‐2000
Coverage of Domestic Water Systems in Japan,1960‐2000
• The Nippon Chisso Co. had been producing ammonia sulfate fertilizer since 1932.
• Its Minamata complex was also the top manufacturer of acetylene‐derived acetaldehyde (1953‐) which was a valuable raw material for producing DOP, a plasticizer for PVC (polyvinyl chloride).– Mercury was used as a catalyst for acetaldehyde production, often
released to the Minamata Bay with other wastes from the production processes.
– Tiny fraction of mercury discharged to the sea was gradually converted into toxic methyl compounds by biomes in the sea.
• In 1968, the government officially recognized that the mercury discharge from Chisso company was the cause of the Minamata disease.– Number of designated victims is around 5,000 so far.
Simplified Picture of the Minamata EventsSimplified Picture of the Minamata Events
The Minamata Disease: a neurological syndrome caused by severe mercury poisoning. Symptoms include ataxia, numbness in the hands and feet, general muscle weakness, narrowing of the field of vision and damage to hearing and speech. In extreme cases, insanity, paralysis, coma and finally death follows.
Statistics of the Minamata Disease日本の公害経験(1991)より
1. The Nippon Chisso Co. had been spending 1.2 million USD/year (average) for investment for pollution prevention.2. The compensation for the damages
Item Average Annual Expenditure
Compensation for the victims 76.7 million dollar
Recovery for the polluted Minamata land area
42.7 million dollar
Compensation for local fishery damage
6.9 million dollar
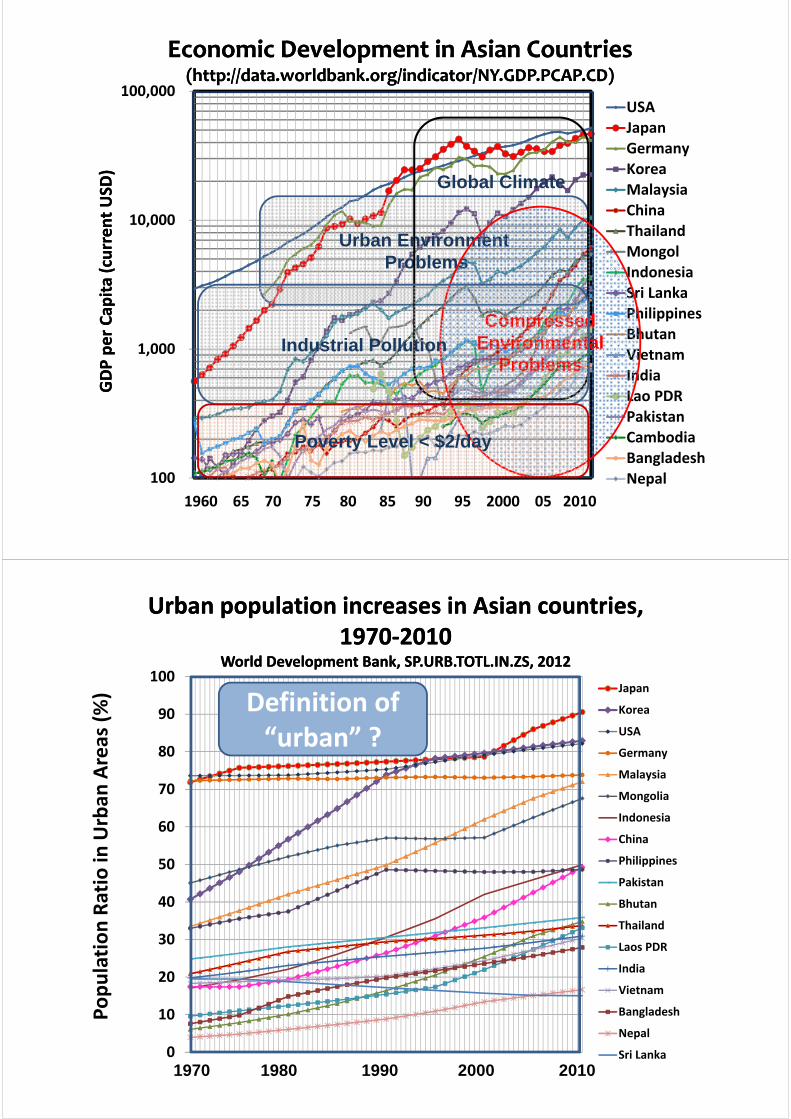
1. Diversity of development stages and natural conditions among member countries.
2. Economic development is roughly linked with industrialization and urbanization.
3. Treatment of both industrial and domestic wastewaters becomes significant in most countries.
4. Distributed rather than centralized collection and treatment methods might give sustainable water cycle systems.
5. Challenging tasks are to find comprehensive solutions to compressed environmental problems
Basic matters to be considered:Basic matters to be considered:Third Phase (2014‐2018)
26
Voyage without the chart‐‐‐‐Learning by doing‐‐‐‐Voyage without the chart‐‐‐‐Learning by doing‐‐‐‐