Page 1
Water Flow in Carbon Nanotubes:
Transition to Subcontinuum Transport
John A. Thomas and Alan J. H. McGaughey∗
Department of Mechanical Engineering
Carnegie Mellon University
Pittsburgh, PA 15213 USA
March 27, 2009
Abstract
The structure and flow of water inside 75 nm- and 150 nm-long carbon nanotubes
with diameters ranging from 0.83 nm to 1.66 nm are examined using molecular dy-
namics simulation. The flow rate enhancement, defined as the ratio of the observed
flow rate to that predicted from the no-slip Poiseuille relation, is calculated for each
tube and the liquid structure is examined using an axial distribution function. The
relationship between the intermolecular water structure and water flow is quantified
and differences between continuum and subcontinuum flow are discussed.
∗[email protected]
Page 2
An important step towards understanding liquid flow in nanoscale systems is to pre-
dict the transition from continuum to subcontinuum transport as the flow area decreases.
In a continuum system, the behavior of a liquid can be described in terms of infinitesi-
mal volumetric elements that are small compared to the flow domain but have well-defined
thermophysical properties. Applying Newton’s second law to a system of volumetric ele-
ments gives rise to the Cauchy and Navier-Stokes equations, which can be used to derive
the Poiseuille and other continuum-level flow relations [1]. In a system where the size of a
liquid molecule is comparable to the size of the flow domain, however, the notion of a repre-
sentative volumetric element is invalid and the applicability of continuum-based relations is
questionable. Within such “subcontinuum” systems, the movement of individual molecules
must be considered when predicting mass and momentum transport [2].
In this work, we use molecular dynamics (MD) simulation to examine pressure-driven
water flow through carbon nanotubes (CNTs) with diameters ranging from 0.83 nm to 1.66
nm, where a transition from continuum to subcontinuum flow with decreasing CNT diameter
is expected [3, 4]. We examine flow through 75-nm and 150-nm long CNTs, which are much
longer than the 1-3 nm long CNTs examined in a previous investigation [4]. We begin by
quantifying the relationship between pressure gradient and average flow velocity for each
CNT and then identify the transition to subcontinuum water flow. Next, we predict the
liquid structure inside each CNT and correlate the structure to molecular transport. For
subcontinuum systems we find that the liquid structure relaxation time, which we define
as the time required for a water molecule to become uncorrelated from an initial structural
arrangement, exceeds a time scale characteristic of the flow. This behavior leads to coordi-
nated molecular transport inside the CNT and a non-monotonic relationship between CNT
diameter and average flow velocity. We find that the water structure is long-ranged, and
discuss how the relationship between pressure gradient and flow velocity will depend on tube
length for CNT fragments shorter than ten nanometers.
The average flow velocity, v, of a incompressible, creeping liquid (Reynolds number much
less than one) inside a tube with a uniform cross-sectional area is given by the Darcy law,
v = γ(
∆PL
), where ∆P is the pressure difference across the tube, L is its length, and γ is
the hydraulic conductivity [1]. Although the Darcy law is an empirical expression, the hy-
draulic conductivity of a Newtonian liquid in a circular tube subject to the no-slip boundary
condition, γno−slip, can be found directly from the no-slip Poiseuille relation, γno−slip = D2
32µ,
where D is the tube diameter and µ is the liquid viscosity [3].
Liquid slip at the solid-liquid boundary, confinement-induced reductions in the liquid
viscosity, and subcontinuum changes to the liquid structure can all cause the actual hydraulic
conductivity (γactual, as measured from experiment or predicted from MD simulation) to
2
Page 3
exceed that calculated from the Poiseuille relation [2]. This increase in γ has led to the
definition of a flow enhancement factor, ε, given by ε = γactual
γno−slip[3]. For CNTs with diameters
larger than 1.6 nm, the variation in ε with CNT diameter can be understood in terms of
slip at the water/CNT boundary and diameter-related changes to the water viscosity [3].
In CNTs with smaller diameters, however, water molecules have been shown to assemble
into diameter-dependent one-dimensional structures for which neither the slip length nor
the effective viscosity is well-defined [2]. This confinement-induced change to the liquid
structure necessitates a subcontinuum description of the liquid [5, 6].
We simulate pressure-driven water flow through 0.83, 0.97, 1.10, 1.25, 1.39, and 1.66
nm-diameter single-walled armchair CNTs. A snapshot from a typical simulation, which
consists of a water-filled CNT fragment connected to two water-filled reservoirs, is presented
in Fig. 1. All simulations are performed in the NVT ensemble (constant number of particles,
volume, and temperature) at a temperature of 298 K and flow is driven by a reflecting
particle membrane placed between the reservoirs [7]. We use the TIP5P potential to model
interactions between water molecules [8], the Lennard-Jones potential of Werder et al. to
model the interactions between water molecules and carbon atoms [9], and keep the carbon
atoms fixed. We maintain the temperature of the system by applying a Berendsen thermostat
to the velocity components transverse to the flow direction [10]. We note that applying the
thermostat to all three directions does not affect the flow predictions.
We find that fixing the carbon atoms has no effect on the structure of water molecules
inside the CNT. The number of molecules in the system is chosen such that the water
density in the reservoirs is 1000 kg/m3 and the average number of water molecules in the
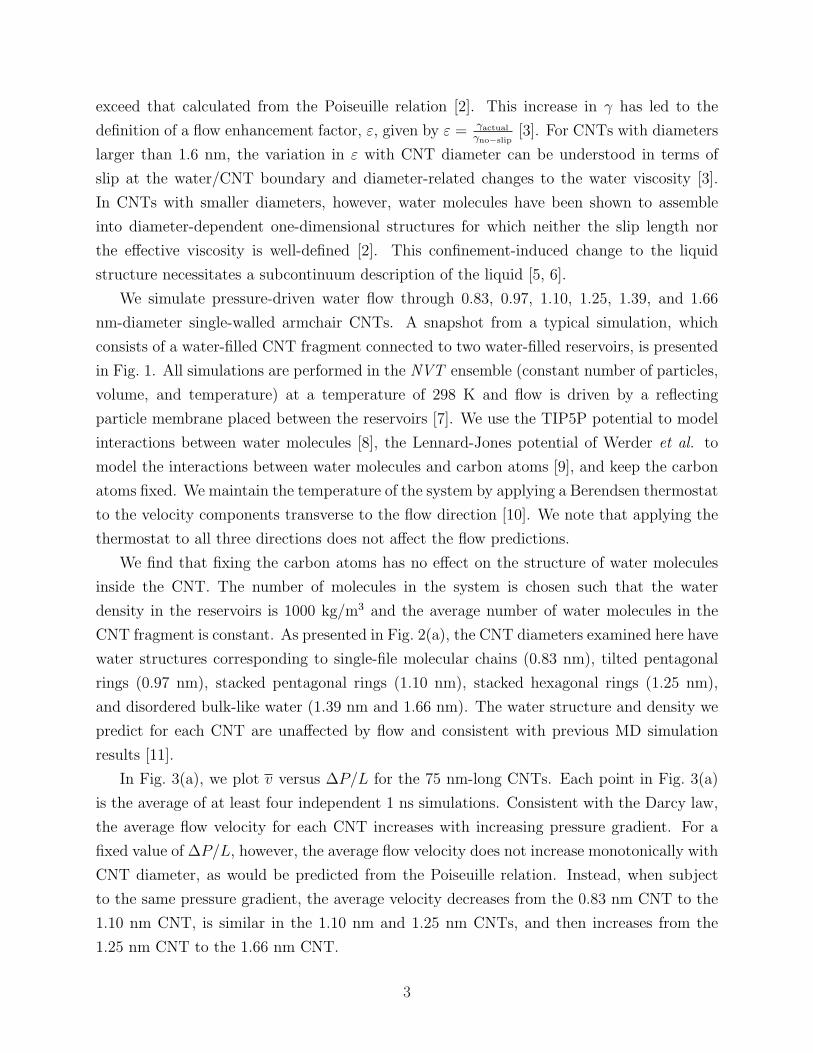
CNT fragment is constant. As presented in Fig. 2(a), the CNT diameters examined here have
water structures corresponding to single-file molecular chains (0.83 nm), tilted pentagonal
rings (0.97 nm), stacked pentagonal rings (1.10 nm), stacked hexagonal rings (1.25 nm),
and disordered bulk-like water (1.39 nm and 1.66 nm). The water structure and density we
predict for each CNT are unaffected by flow and consistent with previous MD simulation
results [11].
In Fig. 3(a), we plot v versus ∆P/L for the 75 nm-long CNTs. Each point in Fig. 3(a)
is the average of at least four independent 1 ns simulations. Consistent with the Darcy law,
the average flow velocity for each CNT increases with increasing pressure gradient. For a
fixed value of ∆P/L, however, the average flow velocity does not increase monotonically with
CNT diameter, as would be predicted from the Poiseuille relation. Instead, when subject
to the same pressure gradient, the average velocity decreases from the 0.83 nm CNT to the
1.10 nm CNT, is similar in the 1.10 nm and 1.25 nm CNTs, and then increases from the
1.25 nm CNT to the 1.66 nm CNT.
3
Page 4
Figure 1: Snapshot from a typical flow simulation for the 0.83 nm-diameter CNT. A constant
pressure difference is established between the reservoirs using a reflecting particle membrane. After
a 0.25 ns initialization period, the mean pressure in each reservoir remains constant over the
duration of the ensuing data collection period and flow through the tube is steady. Periodic
boundary conditions are imposed in the flow direction. The number of molecules inside the CNT
ranges from 310 ± 5 for the 75 nm-long 0.83 nm-diameter CNT to 3676± 20 for the 150 nm-long
1.66 nm-diameter CNT.
The non-linear relationship between v and ∆P/L is the result of inertial losses (i.e.,
minor losses) at the two CNT/reservior boundaries. Inertial losses are velocity-dependent
and caused by sudden expansions, contractions and other obstacles in the flow field. The
penalty associated with such losses, ∆Pm(v), can be incorporated into the Darcy law: v =
γ[
∆P−∆Pm(v)L
][1]. Given that the inertial losses are unknown, the hydraulic conductivity
can be extracted from this modified form of the Darcy law as follows: Consider a long CNT
with length Ll, and a shorter CNT with length Ls, with identical diameters and connected to
identical reservoirs. Let the ratio of length to diameter for both tubes be large such that the
entrance and exit effects are decoupled. If both systems have the same average flow velocity,
the inertial losses in each system will be the same. However, due to additional frictional flow
resistance in the longer CNT, the total pressure drop across it, ∆Pl, will exceed that across
the short CNT, ∆Ps. Applying the modified Darcy law to both systems and eliminating
∆Pm(v) gives γ = v(
Ll−Ls
∆Pl−∆Ps
). For the 1.66 nm-diameter CNT, the hydraulic conductivity
calculated for the systems investigated here is within 17% of the value we predicted in our
previous work, which was free of reservoirs and had no inertial losses. We estimate the
uncertainty in γ to be ±25% from the measured variances in v and ∆Pl − ∆Ps. We find
that, within this prediction uncertainly, γ is invariant over the flow velocities considered.
In Fig. 3(b), we present the variation of ε with CNT diameter. We also include the
enhancement values for the 1.66 nm- to 3.33 nm-diameter CNTs we reported previously [3].
In CNTs with diameters larger than 1.66 nm, where a continuum description of water flow
is valid, we found that ε increased monotonically with decreasing CNT diameter. Here,
we find that this trend extends to the 1.39 nm-diameter CNT. The abrupt reduction in
4
Page 5
Figure 2: (a) Water structures inside the 0.83 nm- to 1.66 nm-diameter CNTs. Carbon atoms
are removed for clarity and the chirality vector for each CNT is provided. (b) Axial distribution
function (ADF), structure relaxation time τ , and extent of the ADF, Lt, for each CNT. (c) P (n, tc),
the probability that n molecules cross the system midplane over the characteristic flow time tc. The
CNT permeability, α, is provided for ∆P/L = 4× 10¹⁴ Pa/m.
flow enhancement between the 1.39 nm- and 1.25 nm-diameter CNT suggests a transition to
subcontinuum transport, which is consistent with the change from disordered bulk-like water
to one-dimensional structures with decreasing CNT diameter [see Fig. 2(a)]. The variation
in flow enhancement within CNTs with diameters smaller than 1.25 nm cannot be described
using continuum relations and, as we will show, is related to the water structure.
In Fig. 2(c), we provide the molecular permeability, α, of each CNT corresponding to a
pressure gradient of 4× 10¹⁴ Pa/m. Despite the decrease in flow velocity from the 0.83 nm-
to the 1.10 nm-diameter CNT, the permeability (which incorporates the effects of diameter-
related changes to the flow area, water density, and velocity) increases monotonically with
CNT diameter for all tubes. This trend arises from the fact that the cross-sectional flow area
5
Page 6
Figure 3: (a) Relationship between average flow velocity, v, and applied pressure gradient, ∆P/L,
for the 75 nm-long CNTs. A similar relationship exists for the 150 nm-long CNTs. We note that
v is well-below the molecular thermal velocity (340 m/s at T = 298 K). For each data point, the
standard deviation in v and ∆P/L are 0.5 m/s and 2× 10¹³ Pa/m, leading to a ±25% uncertainty
in ε. Guidelines are added to highlight the trends. (b) Variation in flow enhancement factor, ε,
with CNT diameter, D. The dashed line between D = 1.25 nm and D = 1.39 nm delineates
continuum and subcontinuum flow regimes. The line in the continuum regime is a model we
developed previously [3].
increases faster with diameter than the structure-related reductions in the flow velocity.
To quantify the variation in liquid structure with tube diameter, in Fig. 2(b) we present
the axial distribution function (ADF) for water molecules inside each CNT. We define the
ADF, a(z), by
∫ z=±L
z=0
a(z)πD2
4dz = Nt−1 ' Nt, where Nt is the number of water molecules
between z = ±L. In CNTs with diameters greater than 1.66 nm, the ADF has a small peak
at z = 0.3 nm and is invariant with CNT diameter. The position of this peak is similar to the
position of the first peak in the radial distribution function of bulk water. The ADF inside
the 1.39 nm-diameter CNT is comparable to that of larger tubes, suggesting that confinement
induced changes to the liquid structure are insignificant in this CNT [12]. Inside the 1.25
nm- to 0.83 nm-diameter CNTs, where the layered and single-file molecular structures are
present, the axial positions of the water molecules are strongly correlated and oscillations
in the ADF extend 4 nm to 10 nm from the origin molecule. Such long-range positional
correlation, which is not present in bulk water, is a distinguishing feature of subcontinuum
liquids [2]. We find no difference between the ADFs in the 75 nm- and 150 nm-long CNTs.
In CNTs with diameters less than 1.39 nm and lengths shorter than about 10 nm, all
the water molecules inside the tube will have correlated positions. Although the distinction
between solid phase water and liquid phase water is unclear for such systems, we expect that
the solid-like molecular structure will limit the mobility of individual molecules and lower
the average flow velocity of water inside such short CNTs. This hypothesis is supported by
6
Page 7
the MD simulation data of Corry [4], who investigated pressure-driven water flow through
CNT membranes with diameters similar to those investigated here, but with lengths of 1.3
nm and 2.6 nm. The positions and movement of water molecules inside the short CNTs were
indeed correlated and transport through the tubes occurred via collective bursts. Moreover,
the flow enhancement factors we calculate from the Corry data are 1 to 10, a range lower
than the 100 to 1000 range we predict here for 75 nm- and 150 nm-long CNTs. This result
suggests that as the CNT length decreases below 10 nm and the molecules at the tube inlet
become increasingly coupled to those at the tube outlet, mass transport will become less like
flow through a pipe and more like coordinated diffusion through a two-dimensional pore.
This transition will reduce the flow rate through the tube and cause a reduction in the flow
enhancement factor.
Although the CNTs investigated here are longer than the oscillations in their ADFs,
the local liquid structure in each tube still governs the molecular transport through it. This
coupling between structure and flow can be elucidated by examining the cumulative midplane
mass flux, n(t). In Fig. 2(c), we present the probability P (n, tc) that n molecules cross the
CNT midplane over a characteristic flow time tc. We define tc from tc = Lc
v, where Lc is
a characteristic length scale. We set Lc equal to the location of the first peak in the ADF
and calculate P (n, tc) for each flow simulation. Since the liquid structure does not vary
with flow velocity (over the range considered here), P (n, tc) for each CNT collapses onto a
velocity-independent distribution. We note that with Lc ∼ 0.17-0.3 nm and v ∼ 1-7 m/s, tc
is O(100 ps).
Inside the 1.66 nm-diameter CNT (where flow can be modeled using continuum-based
relations) P (n, tc) is non-zero over a large range of n. This large range is accessible because
the structure relaxation time, which we estimate to be 0.3 ps from the decay of the velocity
autocorrelation function, is very small compared to tc. The flow is therefore independent of
liquid structure and a random number of molecules, subject to the distribution of P (n, tc),
can cross the midplane during tc. Although the accessible range of n increases with CNT
diameter, we find that the shape of the P (n, tc) distribution in larger CNTs is similar to
what we report here for the 1.66 nm diameter tube and find no appreciable change in the
structure relaxation time. This smooth distribution of P (n, tc) is also present in the 1.39
nm-diameter CNT, further suggesting that the flow in this tube is independent of structure
and a continuum description of mass flow will be appropriate.
Inside the 1.25 nm-diameter CNT, P (n, tc) exhibits peaks at n = 6 and 12. A similar
distribution is present inside the 1.10 nm-diameter CNT, where P (n, tc) exhibits peaks at n
= 5 and 10. These peaks, which are related to the stacked hexagonal and pentagonal rings in
the tubes, indicate a coupling between structure and flow. The relaxation time of the layered
7
Page 8
water structure inside these CNTs, as estimated from MD simulation, is O(10 ns) [5, 6],
indicating that water molecules may travel from the tube inlet to the tube outlet as members
of a single layer. Unlike bulk-like systems, where water molecules can move independently,
the transport of molecules in these structured subcontinuum systems is conditional upon the
movement of nearby layers. A layer of water molecules that fills an energetically stable CNT
surface site can therefore impede the movement of other layers. Such localized limitations on
transport will reduce v and lower the overall flow enhancement (see Fig. 3). This hypothesis
is consistent with the findings Mamontov et al., who demonstrate from neutron scattering
experiments and MD simulation that the water molecules in layered structures have, on
average, less mobility than the molecules in bulk-like water [12].
Between the 1.10 nm- and 0.83 nm-diameter CNTs, the liquid structure transitions from
stacked pentagonal rings to tilted pentagonal rings and finally to a single-file molecular chain.
With decreasing CNT diameter, we find that the effects of layer-by-layer transport become
less prominent, the spatial extent of the ADF decreases [see Fig. 2(b)], and the average flow
velocity increases for a given pressure gradient [see Fig. 3(a)]. Although the mass transport
mechanisms within these tubes are not yet clear, in a previous work we found that water
molecules become less coupled to the CNT surface with decreasing CNT diameter [3]. This
effect will reduce flow friction in smaller CNTs and may contribute to the increase in flow
velocity with decreasing diameter. In the 0.83 nm-diameter CNT, where the single-file water
structure relaxation time has been estimated to be O(0.1 s)[13], the probability of two or
more molecules crossing the midplane in either the positive or negative direction is 0.6. This
behavior is the result of coordinated molecular motion inside the CNT. It confirms that,
although the tube inlet and tube outlet are decoupled in our system, localized bursting still
governs mass transport inside long-length, small-diameter CNTs.
Although this work is focused on water flow through CNTs, several trends can be extrap-
olated to the more general field of subcontinuum liquid transport. First, unlike predictions
from continuum mechanics, the flow enhancement in subcontinuum systems may not increase
monotonically with decreasing flow area. Instead, when the flow area is comparable to the
size of the liquid molecules, confinement-induced changes to the liquid structure may reduce
the flow enhancement and must be considered. Second, if the system length is comparable to
the correlation length, the liquid inlet and outlet are not independent and the hydraulic con-
ductivity may depend on system length. Within short systems, transport may therefore be
less like flow through a pipe and more like coordinated diffusion through a two-dimensional
pore. Third, liquid structure and liquid flow are independent in systems where the char-
acteristic flow time scale is much longer than the structure relaxation time. These scales
must be considered when comparing results from different flow investigations and examining
8
Page 9
flow/structure interactions.
9
Page 10
References
[1] J. Bear, Dynamics of Fluids in Porous Media. American Elsevier, New York (1972).
[2] H. Verweij et al., Small 3 (2007) 1996–2004.
[3] J. A. Thomas and A. J. H. McGaughey, Nano Letters 9 (2008) 2788–2793.
[4] B. Corry, Journal of Physical Chemistry B 112 (2008) 1427–1434.
[5] S. Joseph and N. R. Aluru, Physical Review Letters 101 (2008) 064502.
[6] A. Striolo, Nano Letters 6 (2006) 633–639.
[7] J. Li et al., Physical Review E 57 (1998) 7259–7267.
[8] M. W. Mahoney and W. L. Jorgensen, Journal of Chemical Physics 112 (2000) 8910–8922.
[9] T. Werder et al., Journal of Physical Chemistry B 107 (2003) 1345–1352.
[10] H. J. C. Berendsen et al., Journal of Chemical Physics 81 (1984) 3684–3690.
[11] A. Alexiadis and S. Kassinos, Chemical Reviews 108 (2008) 5014–5034.
[12] E. Mamontov et al., The Journal of Chemical Physics 124 (2006) 194703.
[13] J. K. G. Hummer and C. Dellago, PNAS 105 (2008) 13218.
10