56
Water for Energy World Energy Council
| Date post: | 22-Apr-2018 |
| Category: |
Documents |
| Upload: | truongtruc |
| View: | 217 times |
| Download: | 1 times |

Water for Energy
World Energy Council

Officers of the World Energy Council
Pierre Gadonneix Chair
Francisco Barnés de Castro Vice Chair, North America
Norberto Franco de Medeiros Vice Chair, Latin America/Caribbean
Richard Drouin Vice Chair, Montréal Congress 2010
C.P. Jain Chair, Studies Committee
Younghoon David Kim Vice Chair, Asia Pacific & South Asia
Jorge Ferioli Chair, Programme Committee
Marie-José Nadeau Vice Chair, Communications & Outreach Committee
Abubakar Sambo Vice Chair, Africa
Johannes Teyssen Vice Chair, Europe
Abbas Ali Naqi Vice Chair, Special Responsibility for Middle East & Gulf States
Graham Ward, CBE Vice Chair, Finance
Zhang Guobao Vice Chair, Asia
Christoph Frei Secretary General
Water for Energy World Energy Council
Copyright © 2010 World Energy Council
All rights reserved. All or part of this publication may be used or reproduced as long as the following citation is included on each copy or transmission: ‘Used by permission of the World Energy Council, London, www.worldenergy.org’
Published 2010 by:
World Energy Council Regency House 1-4 Warwick Street London W1B 5LT United Kingdom
ISBN: [978-0-946121-10-6]
Water for Energy
Water for Energy World Energy Council
1
Contents 1
Foreword 2
Executive summary 3
1 Introduction 7
1.1 Water: a new (and complex) vulnerability of the energy system 7
1.2 Linkage between water and energy 9
1.3 A more water-constrained future 10
2 Water requirements in the energy sector 12
2.1 Fuel production 12
2.1.1 Crude oil 13
2.1.2 Natural gas 14
2.1.3 Coal 15
2.1.4 Uranium 15
2.1.5 Biomass 16
2.2 Requirements for electricity production 18
2.2.1 Thermoelectric plants 18
2.2.2 Carbon capture and storage 20
2.2.3 Hydroelectric power plants 20
2.2.4 Electricity from wind and solar 22
3 Water requirements by region 24
3.1 Water for energy in Africa 24
3.2 Water for energy in Asia 25
3.3 Water for energy in Europe 29
3.4 Water for energy in Latin America and the Caribbean 31
3.5 Water for energy in North America 32
4 Water-energy trends and probable tensions 34
5 Conclusions and recommendations 37
References 38
Study Group Membership 40
Annexe1 41
Annex 2 43
Annex 3 49
Contents
Water for Energy World Energy Council
2
Members of the World Energy Council have been concerned about the vulnerability of energy systems in the future to the availability of water, and instituted this study to examine the issues and their potential solutions. Water is absolutely essential to produce, distribute and use energy. Some energy systems require more water, others less. Whether that water will be available for energy systems, or whether competing uses such as agriculture and food production will produce scarcities, and where those problems are most acute, is the subject of this study.
Water will almost certainly be more costly and valuable every year, as value added processes in energy and industries require increasing amounts of water. Paradoxically, water is generally less expensive on a per unit basis in developed societies. Poorer regions pay most for their drinking water. At the same time, developed nations face the need to reduce their carbon footprint, so as to develop a new high-quality standard that is more sustainable, and to inspire and encourage developing regions. All this must be translated in terms of new business opportunities and new technological requirements.
This report looks at the size of the challenge and the steps that need to be taken to assure that water is available for energy requirements. These steps need to be mindful of other users, and of the need to work cooperatively to use the available water most effectively. While looking at specific energy sources and conversion technologies, this report does not pretend that any solution fits all users, nations, or regions.
I wish to thank Thulani Gcabashe, the Chair of the study, and José Luis Fernandez Zayas, who directed the study for their efforts. In addition, the members of the study group, and Sandra Biesel and Robert Schock, Manager and Director of Studies in London, respectively, were all instrumental in seeing it to a successful conclusion.
I believe that all policymakers, in governments and in energy and other businesses, will benefit from this work, and in cooperating with one another to meet the challenges of providing sustainable energy to the people of the world. The Officers of the World Energy Council would always be pleased to receive feedback and suggestions.
C.P. Jain Chair, Studies Committee
Foreword
Water for Energy World Energy Council
3
Human civilization has always rested on access to water, and, more specifically, on its utilization. This report aims to contribute to a better understanding of the critical linkages between water and energy—and the impact on both of climate change. It identifies areas of opportunity where investment and new regulations are needed, to ensure sustainable global development.
Growth, scarcity and stress
Freshwater supplies are unevenly allocated across the globe and, at the same time, countries all over the world face water scarcity and water stress. Currently, the World Health Organization estimates one-third of the Earth’s population lack the necessary quantities of water they need.
Global population will continue to grow. The majority of growth will be in emerging and developing economies already experiencing water and energy security challenges. By 2050, the UN estimates that half the world’s population will live in nations that are short of water. Moving water to people and controlling supply will become even bigger issues in the years to come.
Water is used in energy production and supply, and, in turn, energy is used for pumping, moving and treating water. In recent decades, the combination of more users, with more uses of water has transformed the traditional water-energy ‘ladder’ that underpins all human, social and economic development into an ‘escalator’. As a result, as the linkages between both energy and water systems have grown more complex and interdependent, water must be viewed as a
complex vulnerability of the energy system—and vice versa.
In addition, human-induced climate change is understood to be a key driver for change in energy and water availability, allocation, production and consumption. This carries significant implications for managing water and energy security challenges. Climate change impacts will likely exacerbate water stress in many countries, cities and communities, creating the prospect of greater competition between different uses, as well as individual users of water.
With the threat of water scarcity and water stress, exacerbated by climate change, two challenges have developed:
1) Water for energy
Water is needed throughout the energy sector. It is used in energy production and conversion, as well as in other processes, such as the refining of energy source products. The water requirements for producing different primary energy carriers vary; there are significant differences between different types of electricity generation. However, freshwater is required for each step—energy extraction and production, refining and processing, transportation and storage and electric power generation itself.
2) Energy for water
Modern energy supplies have been harnessed to pump water from increasing deeper groundwater reserves and to divert whole rivers large distances. With global population and global economic growth
Executive Summary
Water for Energy World Energy Council
4
set to continue, and a significant proportion of the current human population lacking access to clean water supply and sewerage services, the ‘energy for water’ challenge has become a significant, global scale concern.
Current needs…
A situational analysis of the current ‘water for energy’ contexts sets out the water needs of Africa, Asia, Europe, Latin America and the Caribbean, and North America in the context of their energy production, water withdrawal, and population. The ‘water footprint’ (the amount of water consumed to produce a unit of energy) of different methods of fuel production shows how water consumption for operations making primary energy carriers available vary from fuel to fuel. Analyses explore the water needs of a range of energy processes, including crude oil, natural gas, coal, uranium, and biomass. Studies of the water requirements of the respective processes for generating electricity show the water needs of different thermoelectric-generating technologies, and geothermal power-generating plants, as well as electricity from hydro, wind and solar.
…and future projections
The data for current needs, along with the WEC's scenario data from 2007 (updated 2009), provides a basis for identifying the future requirements of 'water for energy' of the different regions, for the years 2020, 2035, and 2050.
By examining the growth of global population, changes in final energy consumption and water
requirements needed to produce and generate the necessary amounts of energy over the next decades, the report identifies:
i) the regions that suffer from water stress and/or water scarcity, or will do so soon; and
ii) those regions where total internal renewable water resources seem to be sufficient to meet requirements of water for energy, without competing with other basic water uses.
In light of these developments, the report highlights the impact in terms of water savings of:
i) new technologies in processing primary energy, especially in thermal electricity generation, and
ii) increased use of renewable energy and improved energy efficiency.
Although oil presently accounts for as much as 34% of the global primary production, and decreasing to 22% by 2050, it accounts for only 10% of water consumption in primary energy production now, rising to 18% in 2050. This is mainly due to the increasing share of non-conventional oil in total oil production, from 1% now to 12% in 2050 and its higher water consumption.
While oil production over the next 40 years will rise rather slowly, natural gas production worldwide will almost double, with the biggest increases in Asia, mainly in the Middle East, where it will almost triple and North America, where it will double. Energy
In recent decades, the combination of more users, with more uses of water has transformed the traditional water-energy ‘ladder’ that underpins all human, social and economic development into an ‘escalator’.
Water for Energy World Energy Council
5
from coal production is presently below oil but will likely become higher over the next 30-40 years (WEC Scenarios, 2007, model updated in 2009). Mining and refining coal, where refining includes washing and beneficiation, requires water at various stages as well. Estimates show that approximately 0.164 m³ of water is needed per GJ. Overall the production of coal accounts for about 1% of total water consumption in energy production.
Uranium production presently accounts for approximately 6% of worldwide primary energy production and will rise to 9% over the next 40 years, with the main producers being in Asia, Europe and North America. Africa and South America account for only 1% of the global uranium production. Mining, milling as well as the conversion and processing of uranium requires less water per energy unit than anything else. It is estimated that approximately 0.086 m³ of water is needed per GJ. Overall the production of uranium accounts for less than 0.2% of total water consumption in energy production.
Today almost 90% of freshwater used to produce primary energy is for the production of biomass, which accounts for not even 10% of total primary energy production. This relationship will change over time. In 40 years, the share of freshwater used to produce biomass will decrease to less than 80%, while at the same time the share of biomass in the total primary energy production will diminish to less than 5%.
Water consumption to generate electricity will more than double over the next 40 years. Whereas
today, electricity generation per capita is on average 2.9 MWh/capita annually, ranging from 0.6 MWh/capita in Africa to 12.0 MWh/capita in North America, in 2050 the annual electricity generation per capita will almost double to an average of 5.7 MWh/capita, ranging from 2.0 MWh/capita in Africa to 17.3 MWh/capita in North America. The highest increases will occur in Latin America, where electricity generation per capita will be four times higher than today, followed by Africa and Asia, where it will almost triple. In Europe electricity generation per capita will presumably double, whereas in North America it will increase by only 50%. Although worldwide electricity generation per capita will almost double, the amount of water consumed to generate electricity is due to expected technology improvements and shifts, likely to stay at the same level or increase only slightly on a per capita basis in Africa, Europe and North America, whereas in Asia and Latin America water consumption to generate electricity will almost double on a per-capita basis.
Water for Energy World Energy Council
6
Conclusions and recommendations
1. The future water needs of energy production and conversion can probably be met. However, other uses, in particular agriculture, are stressing the supply of useable water now—and this is likely to increase in the future as populations grow. Governments must ensure that water is available for all these uses, including energy production and conversion.
2. As energy resources are stretched, increasingly unconventional sources become attractive. Many of these (e.g., oil sands, oil shales, deep gas shales) require large amounts of water, further stressing current and projected systems. When setting policies for energy production, policymakers must consider what water supplies are available: they need to consider the needs of these technologies and their impact on other uses. Industry leaders can be sure to include these aspects when discussing projects with policymakers and with the public.
3. The increasingly integrated world of shared resources and trade requires a new paradigm of interregional and international cooperation-between governments (regional and national), between businesses, as well as between governments and businesses. This also applies to water, and especially water for energy production and conversion.
4. Many existing and new technologies show promise for making water more available and its use more efficient. Policymakers in both business and government must carefully examine policy measures and conditions that will accelerate the entry of these technologies and their benefits into common usage.
5. RD&D (Research, Development and Demonstration) efforts regarding water must be increased. This will require cooperation on regional and international levels between the energy industry, governments, and independent institutions.
6. Asia, with its large geographical area and population presents perhaps the largest challenge for water supply in general, and therefore for water in energy use. At the same time the potential of hydropower in Asia is vast and relatively unexploited. The UN is supporting hydropower development and governments in the region and energy industry operating there should actively encourage and support these efforts.
Water for Energy World Energy Council
7
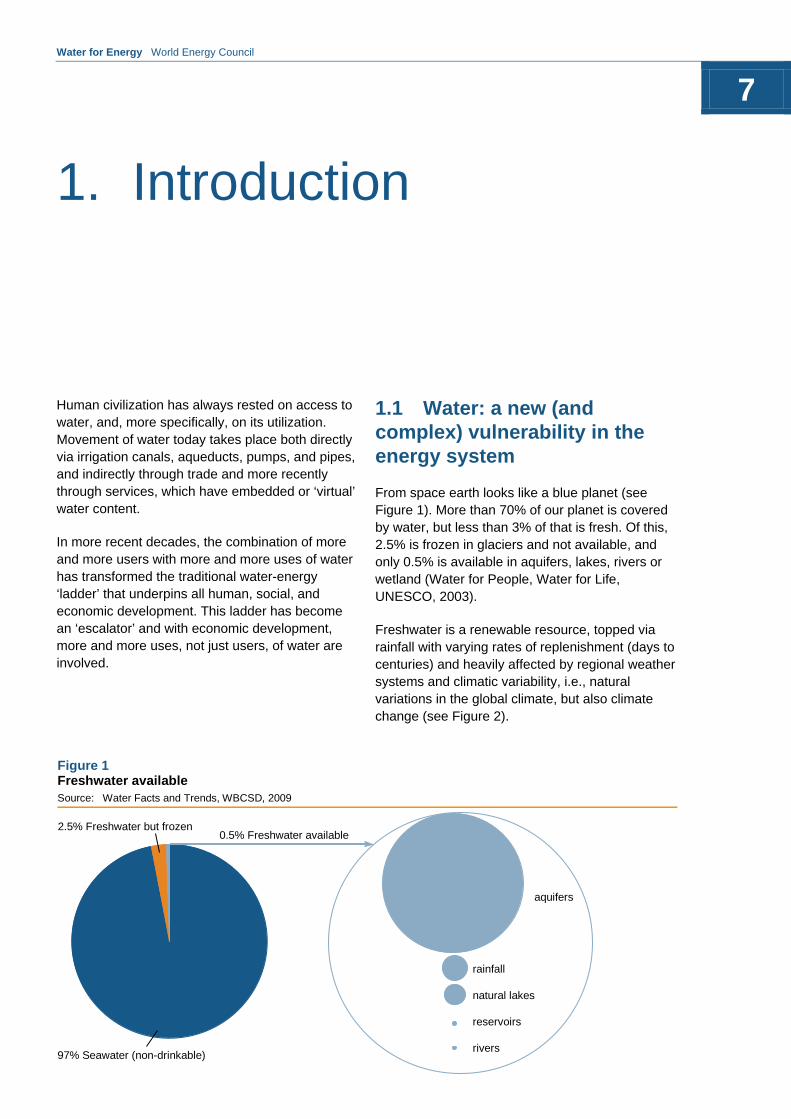
Figure 1 Freshwater available Source: Water Facts and Trends, WBCSD, 2009
97% Seawater (non-drinkable)
rainfall
natural lakes
reservoirs
rivers
aquifers
0.5% Freshwater available2.5% Freshwater but frozen
Human civilization has always rested on access to water, and, more specifically, on its utilization. Movement of water today takes place both directly via irrigation canals, aqueducts, pumps, and pipes, and indirectly through trade and more recently through services, which have embedded or ‘virtual’ water content.
In more recent decades, the combination of more and more users with more and more uses of water has transformed the traditional water-energy ‘ladder’ that underpins all human, social, and economic development. This ladder has become an ‘escalator’ and with economic development, more and more uses, not just users, of water are involved.
1.1 Water: a new (and complex) vulnerability in the energy system
From space earth looks like a blue planet (see Figure 1). More than 70% of our planet is covered by water, but less than 3% of that is fresh. Of this, 2.5% is frozen in glaciers and not available, and only 0.5% is available in aquifers, lakes, rivers or wetland (Water for People, Water for Life, UNESCO, 2003).
Freshwater is a renewable resource, topped via rainfall with varying rates of replenishment (days to centuries) and heavily affected by regional weather systems and climatic variability, i.e., natural variations in the global climate, but also climate change (see Figure 2).
1. Introduction
Water for Energy World Energy Council
8
But as with all natural resources, freshwater supplies are unevenly allocated across the globe. Less than ten countries hold 60% of Earth’s available freshwater: Brazil, Russia, China, Canada, Indonesia, the United States, India, Columbia, and the Democratic Republic of Congo (Water Facts and Trends, WBCSD, 2009). At the same time, countries all over the world face water scarcity or water stress. While water scarcity considers the natural allocation in relation to the number of users, water stress considers the fact that more people live in places characterised by either too much, too little, or the wrong quality of water.
Australia, for example, faces the most acute water scarcity of any developed country. In regard to developing countries, India’s chronic water scarcity problems will become an even bigger challenge over the next few years, as will the Middle East’s and Africa’s. Most countries in the world outside the Arctic zone, developed and undeveloped, and even a small developed country like New Zealand,
face scarcity challenges in different parts of their geographies.
The challenge of ‘water stress’, the ability or lack of the ability to match water demands and needs that vary over time and location, is evident in many countries and regions across the world. In China and the south-western United States, major rivers such as the Yangtze, Yellow, and Colorado, fail to reach the sea for stretches of the year, as water is diverted to meet growing demands by communities upstream. The impact of water stress is being felt in particular at the level of the city—old and new. Saline intrusion of water reservoirs, e.g., costal aquifers, is an increasing problem. A new, high-tech city, Dubai, has been built in a desert and already has the world’s highest per capita rate of water consumption (CIA Factbook).
Historically, water scarcity has been managed through a variety of approaches largely aimed at moving more water to people and controlling supply. In contrast, water stress, perhaps due to its inception during a period of rapid economic
Figure 2 The water cycle Source: Water Facts and Trends, WBCSD, 2009
water vapor inatmosphere 13,000 km
evaporation fromland 70,000 km 3
3
snow and ice29 million km
3
lakes 9.1 million km3rivers 2,120 km 3
run-off from land40,000 km
3
precipitation overland 119,000 km
3precipitation oversea 390,000 km
3
evaporation fromsea 430,000 km3
3oceans1,348 million kmground water
10 million km 3
Water for Energy World Energy Council
9
globalisation, has tended toward market-based approaches and instruments, e.g., water services and pricing.
The World Health Organisation currently estimates that one-third of the Earth’s population lacks the necessary quantities of water they need, the necessary quantity being 100-200 litres a day, when all agriculture, industry, and domestic uses are accounted for (Chenoweth, 2008). By 2050, the United Nations estimates that half of the world will live in nations which are short of water. Moving water to people and controlling supply will become even bigger issues in the years to come.
Today, of the 6.5 billion people on Earth, more than one billion still lack access to fresh drinking water and approximately 2.4 billion lack access to basic sanitation (UN Development Report, 2008). During the last 70 years, global population has tripled, but water withdrawals have increased over six times (UNFPA, 2001). Since 1940, global water withdrawals have increased by an average rate of nearly 3% per year, while population growth averaged 1.5 to 2% (Population Information Program, 1998). Whilst both the consumption of freshwater and the population are rising continuously, the first is doubling every 20 years, more than twice the growth rate of the latter.
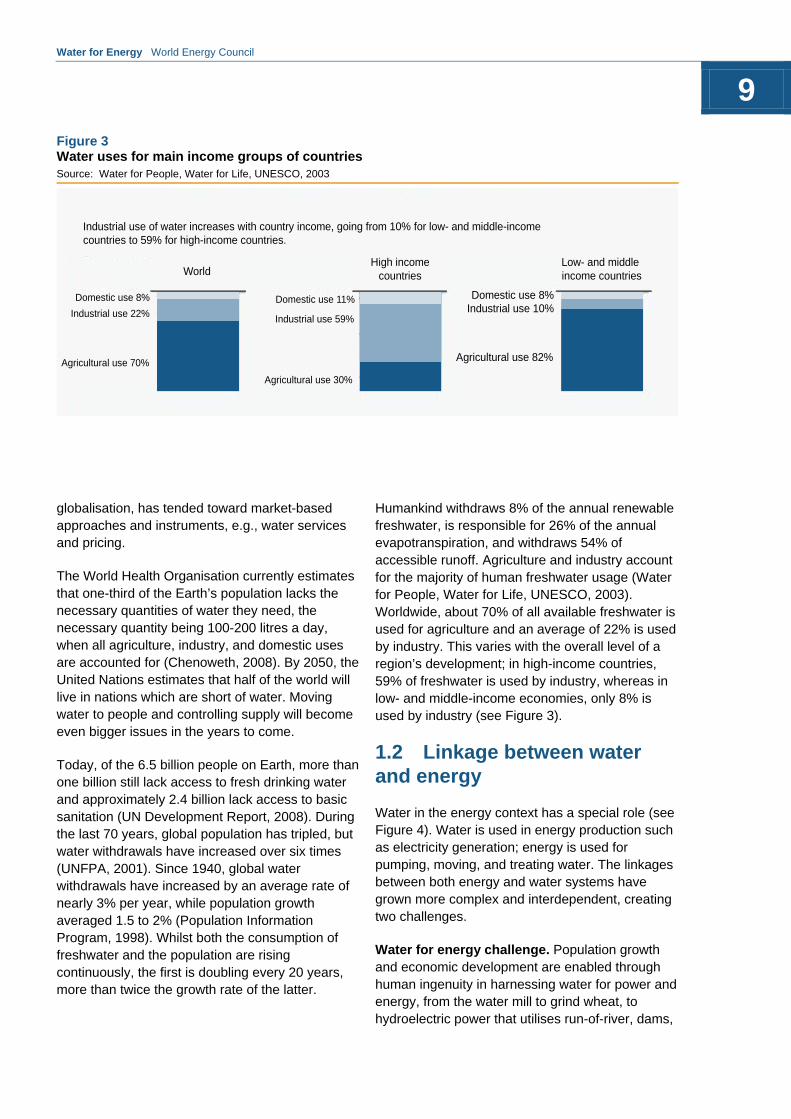
Humankind withdraws 8% of the annual renewable freshwater, is responsible for 26% of the annual evapotranspiration, and withdraws 54% of accessible runoff. Agriculture and industry account for the majority of human freshwater usage (Water for People, Water for Life, UNESCO, 2003). Worldwide, about 70% of all available freshwater is used for agriculture and an average of 22% is used by industry. This varies with the overall level of a region’s development; in high-income countries, 59% of freshwater is used by industry, whereas in low- and middle-income economies, only 8% is used by industry (see Figure 3).
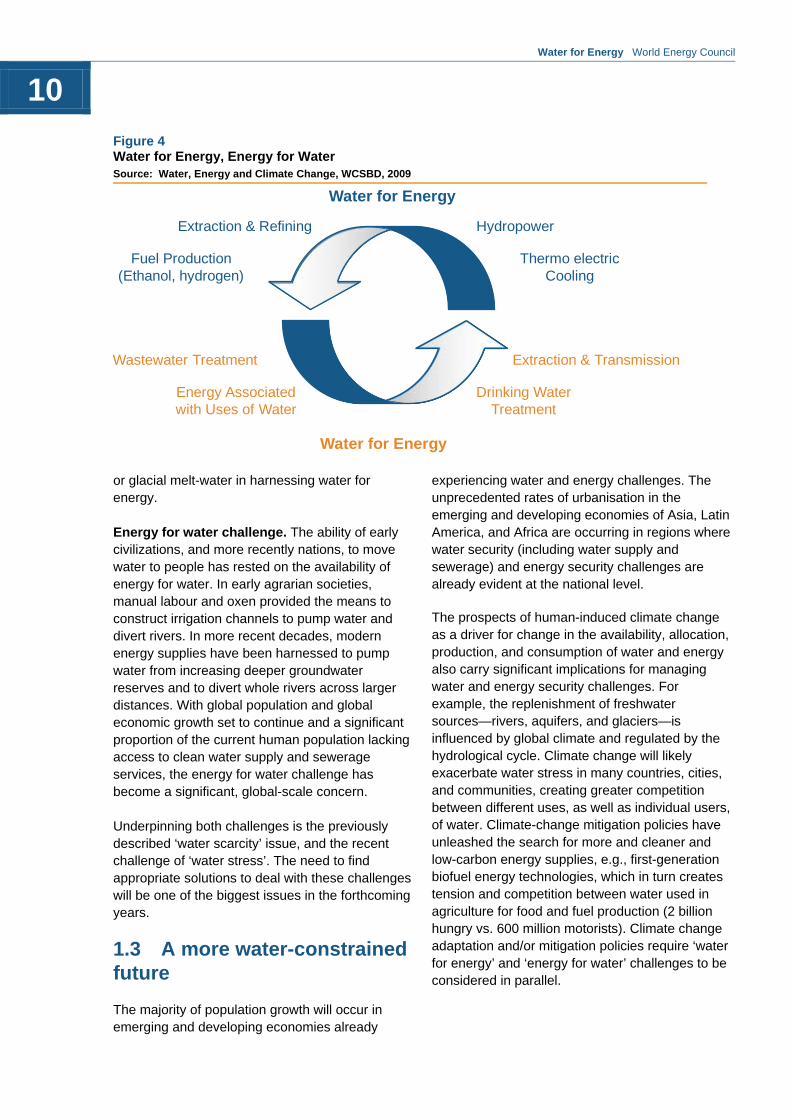
1.2 Linkage between water and energy
Water in the energy context has a special role (see Figure 4). Water is used in energy production such as electricity generation; energy is used for pumping, moving, and treating water. The linkages between both energy and water systems have grown more complex and interdependent, creating two challenges.
Water for energy challenge. Population growth and economic development are enabled through human ingenuity in harnessing water for power and energy, from the water mill to grind wheat, to hydroelectric power that utilises run-of-river, dams,
Figure 3 Water uses for main income groups of countries Source: Water for People, Water for Life, UNESCO, 2003
Industrial use of water increases with country income, going from 10% for low- and middle-incomecountries to 59% for high-income countries.
Industrial use 22%
Domestic use 8%
Agricultural use 70%
Domestic use 11%
Industrial use 59%
Agricultural use 30%
Domestic use 8%Industrial use 10%
Agricultural use 82%
High incomecountries
Low- and middleincome countriesWorld
Water for Energy World Energy Council
10
or glacial melt-water in harnessing water for energy.
Energy for water challenge. The ability of early civilizations, and more recently nations, to move water to people has rested on the availability of energy for water. In early agrarian societies, manual labour and oxen provided the means to construct irrigation channels to pump water and divert rivers. In more recent decades, modern energy supplies have been harnessed to pump water from increasing deeper groundwater reserves and to divert whole rivers across larger distances. With global population and global economic growth set to continue and a significant proportion of the current human population lacking access to clean water supply and sewerage services, the energy for water challenge has become a significant, global-scale concern.
Underpinning both challenges is the previously described ‘water scarcity’ issue, and the recent challenge of ‘water stress’. The need to find appropriate solutions to deal with these challenges will be one of the biggest issues in the forthcoming years.
1.3 A more water-constrained future
The majority of population growth will occur in emerging and developing economies already
experiencing water and energy challenges. The unprecedented rates of urbanisation in the emerging and developing economies of Asia, Latin America, and Africa are occurring in regions where water security (including water supply and sewerage) and energy security challenges are already evident at the national level.
The prospects of human-induced climate change as a driver for change in the availability, allocation, production, and consumption of water and energy also carry significant implications for managing water and energy security challenges. For example, the replenishment of freshwater sources—rivers, aquifers, and glaciers—is influenced by global climate and regulated by the hydrological cycle. Climate change will likely exacerbate water stress in many countries, cities, and communities, creating greater competition between different uses, as well as individual users, of water. Climate-change mitigation policies have unleashed the search for more and cleaner and low-carbon energy supplies, e.g., first-generation biofuel energy technologies, which in turn creates tension and competition between water used in agriculture for food and fuel production (2 billion hungry vs. 600 million motorists). Climate change adaptation and/or mitigation policies require ‘water for energy’ and ‘energy for water’ challenges to be considered in parallel.
Figure 4 Water for Energy, Energy for Water Source: Water, Energy and Climate Change, WCSBD, 2009
Water for Energy
Water for Energy
Extraction & Refining Hydropower
Fuel Production(Ethanol, hydrogen)
Thermo electricCooling
Wastewater Treatment Extraction & Transmission
Energy Associatedwith Uses of Water
Drinking WaterTreatment
Wa
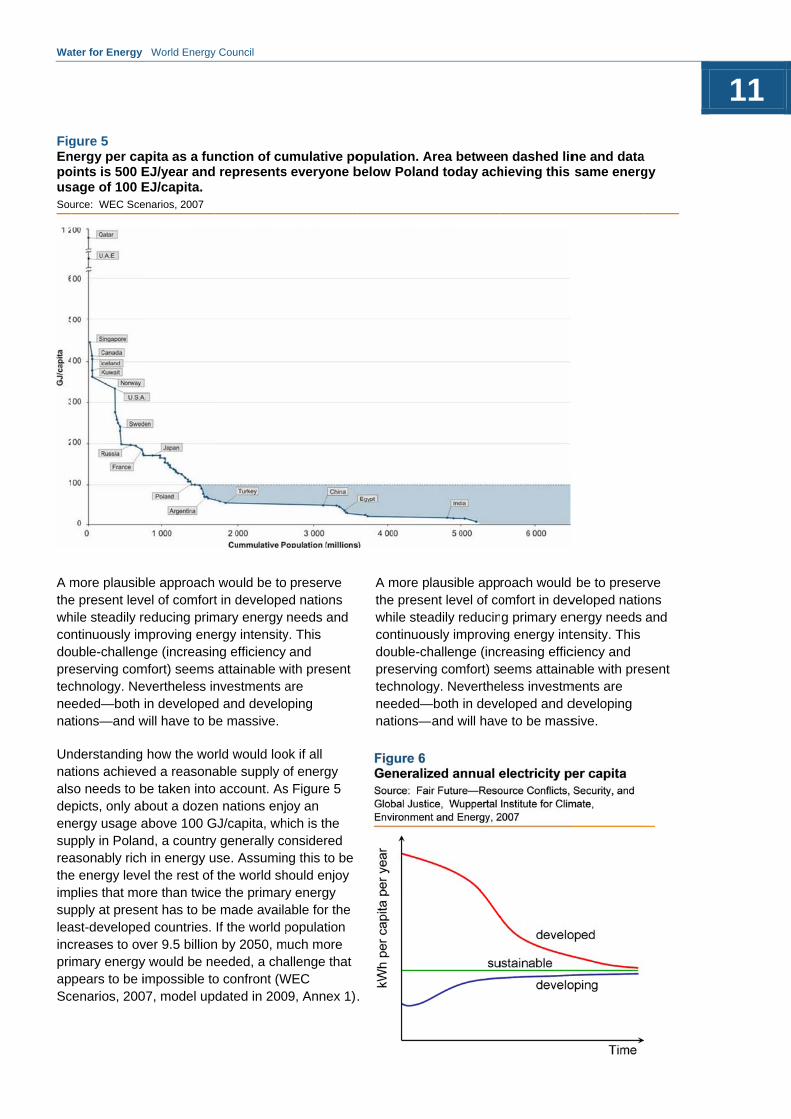
A mthewhcodopretecnena
UnnaalsdeensureatheimsuleaincpriapSc
FigEnpousSou
ater for Energy
more plausibe present levhile steadily rntinuously imuble-challeneserving comchnology. Needed—both tions—and w
nderstanding tions achieve
so needs to bpicts, only abergy usage apply in Polanasonably riche energy leveplies that mopply at prese
ast-developecreases to ovmary energypears to be i
cenarios, 200
gure 5 nergy per caoints is 500 E
age of 100 Eurce: WEC Sce
World Energy
ble approachvel of comfortreducing primmproving enege (increasin
mfort) seems evertheless inin developed
will have to b
how the woed a reasonabe taken intobout a dozenabove 100 Gnd, a countryh in energy uel the rest of ore than twicent has to bed countries. ver 9.5 billiony would be neimpossible to07, model up
apita as a fuEJ/year andEJ/capita. enarios, 2007
y Council
would be tot in develope
mary energy ergy intensityng efficiency attainable w
nvestments ad and develobe massive.
rld would looable supply oo account. Asn nations enj
GJ/capita, why generally couse. Assumin
the world she the primary
e made availaIf the world p
n by 2050, meeded, a chao confront (Wdated in 200
nction of cud represents
preserve ed nations needs and
y. This and
with present are
oping
ok if all of energy s Figure 5 oy an
hich is the onsidered ng this to be hould enjoy y energy able for the population
much more allenge that WEC 09, Annex 1).
umulative pos everyone b
.
A more pthe presewhile steacontinuoudouble-chpreservintechnologneeded—nations—
opulation. Abelow Polan
lausible appent level of coadily reducinusly improvinhallenge (inc
ng comfort) sgy. Neverthe
—both in deve—and will hav
Area betweend today ach
roach would omfort in devg primary en
ng energy intcreasing efficeems attainaless investmeloped and de to be mass
n dashed linhieving this
be to preserveloped nationergy needs tensity. This ciency and able with pre
ments are developing sive.
ne and datasame energ
rve ons and
esent
a gy
11
Water for Energy World Energy Council
12
Water is needed throughout the energy sector. The water requirements for producing the different primary energy carriers vary; also, there are significant differences between the different types of electricity generation. However, freshwater is required for each step—energy extraction and production, refining and processing, transportation and storage, and electric-power generation itself
The changed outlook for water availability affects all forms of energy production and electricity generation and can lead to price volatility in wholesale electricity markets. On-going drought conditions and lower water inflows in some parts of the world have the potential to reduce water reliability and availability to electricity generators; in the longer term, continued growth in electricity demand will require additional investment in power stations that need water for electricity generation.
There is also the need of water for other energy processes, such as the refining of energy products and the production of alternative fuels. A large portion of present-day water use is obtained specifically from water recycling, and in general from increasing the effectiveness of traditional water uses, such as in agriculture. In some parts of the world, some of this water is obtained from seawater desalination. This water demand will continue to grow as both developed nations as well as emerging economies demand more energy products.
For example at present, the North American region consumes about one-fourth of the world’s final energy, with Canada consuming 10%, the US approximately 85%, and Mexico 5%. Over the next
40 years, final energy consumption of the region is expected to increase by not even 5%; North America will be consuming then only 16% of the world’s energy. European consumption is going to drop by approximately 5%. But emerging economies like China, India, and Brazil are about to double their energy consumption over the next 40 years—all three together accounting for almost 30% of the world’s final energy consumption (WEC Scenarios, 2007, model updated in 2009).
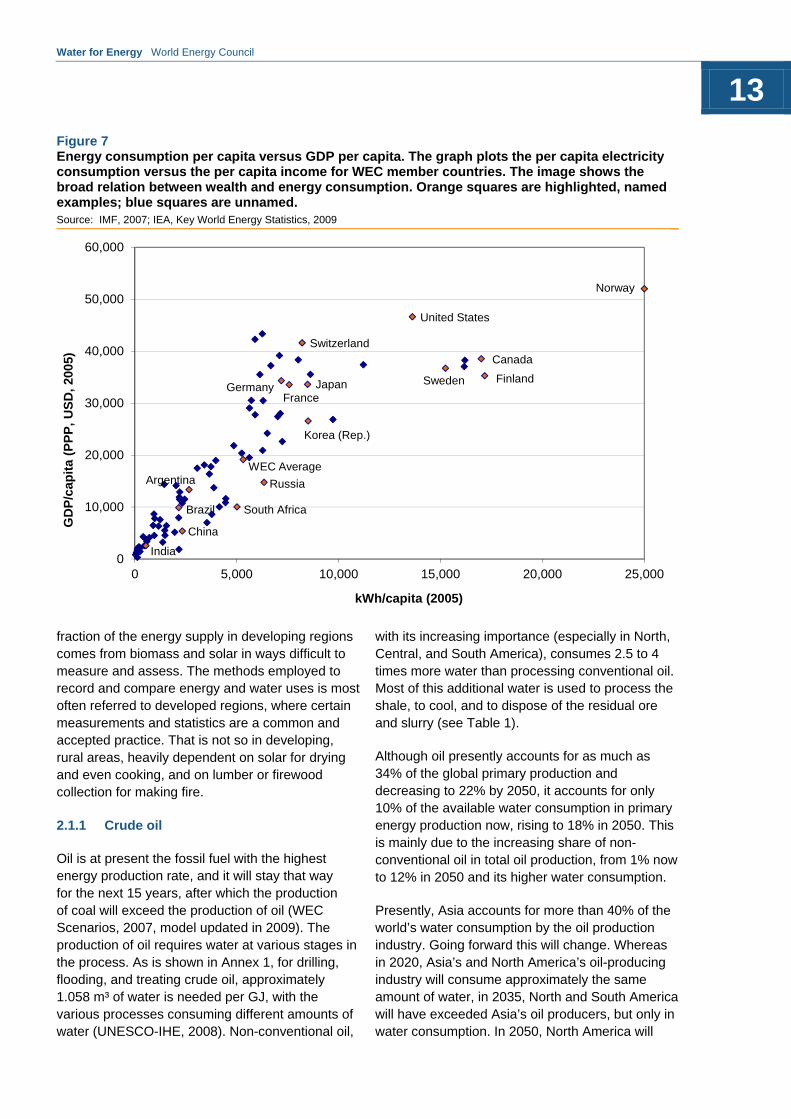
The utilization of energy is generally perceived as a good indicator of the degree of development of a country or region (see Figure 7). This development can be seen in annual gross domestic income per capita (GDP/capita) in comparison with per capita electricity consumption (kW/capita).
There is a general trend toward a higher national degree of development with energy available, but the relationship is far from linear. Japan and Switzerland, for example, are attaining a slightly lower per capita income than the US, with about 60% of the electricity consumed, whereas Russia has a GDP per capita of about one-third of that of Japan using almost the same amount of energy.
2.1 Fuel production
Water consumption for making primary energy carriers vary from fuel to fuel, whether fossil energy or renewable energy. The water footprint—the amount of water consumed to produce a unit of energy (m³/GJ)—of diverse energy carriers has been assessed many times in the past. With improvements in technology, the footprint is being reassessed continuously. However, a very large
2. Water requirements in the energy sector
Water for Energy World Energy Council
13
fraction of the energy supply in developing regions comes from biomass and solar in ways difficult to measure and assess. The methods employed to record and compare energy and water uses is most often referred to developed regions, where certain measurements and statistics are a common and accepted practice. That is not so in developing, rural areas, heavily dependent on solar for drying and even cooking, and on lumber or firewood collection for making fire.
2.1.1 Crude oil
Oil is at present the fossil fuel with the highest energy production rate, and it will stay that way for the next 15 years, after which the production of coal will exceed the production of oil (WEC Scenarios, 2007, model updated in 2009). The production of oil requires water at various stages in the process. As is shown in Annex 1, for drilling, flooding, and treating crude oil, approximately 1.058 m³ of water is needed per GJ, with the various processes consuming different amounts of water (UNESCO-IHE, 2008). Non-conventional oil,
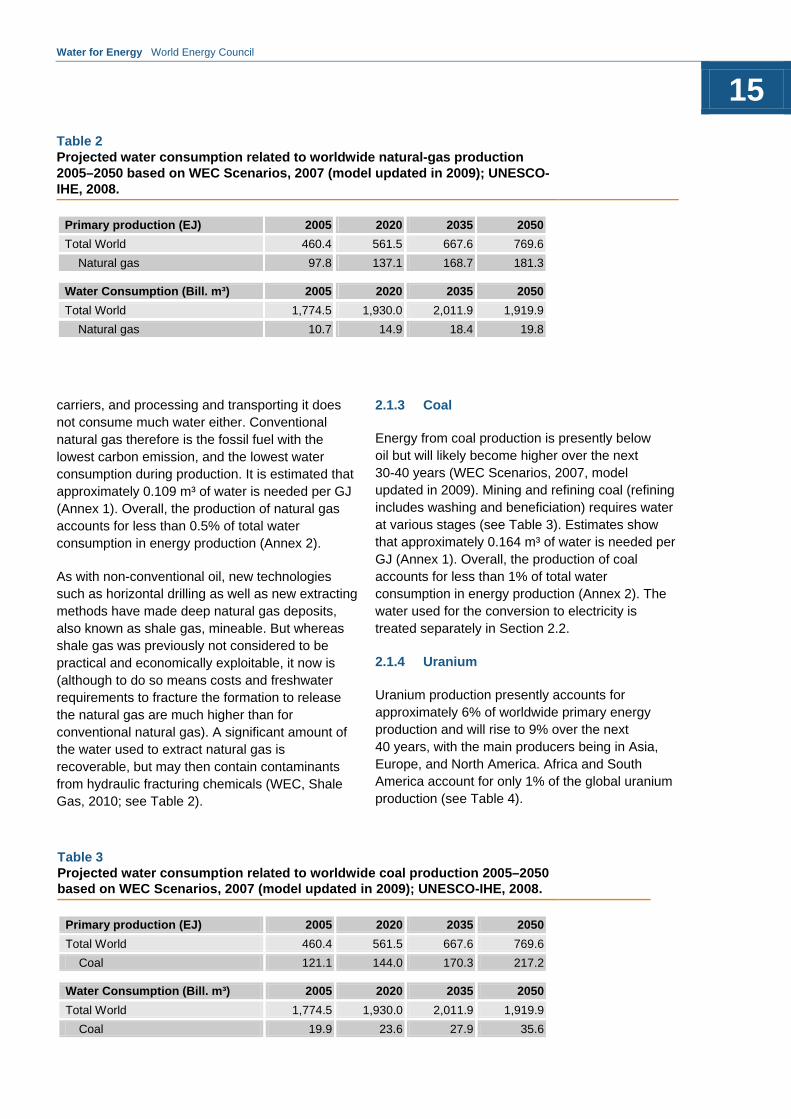
with its increasing importance (especially in North, Central, and South America), consumes 2.5 to 4 times more water than processing conventional oil. Most of this additional water is used to process the shale, to cool, and to dispose of the residual ore and slurry (see Table 1).
Although oil presently accounts for as much as 34% of the global primary production and decreasing to 22% by 2050, it accounts for only 10% of the available water consumption in primary energy production now, rising to 18% in 2050. This is mainly due to the increasing share of non-conventional oil in total oil production, from 1% now to 12% in 2050 and its higher water consumption.
Presently, Asia accounts for more than 40% of the world’s water consumption by the oil production industry. Going forward this will change. Whereas in 2020, Asia’s and North America’s oil-producing industry will consume approximately the same amount of water, in 2035, North and South America will have exceeded Asia’s oil producers, but only in water consumption. In 2050, North America will
Figure 7 Energy consumption per capita versus GDP per capita. The graph plots the per capita electricity consumption versus the per capita income for WEC member countries. The image shows the broad relation between wealth and energy consumption. Orange squares are highlighted, named examples; blue squares are unnamed. Source: IMF, 2007; IEA, Key World Energy Statistics, 2009
0
10,000
20,000
30,000
40,000
50,000
60,000
0 5,000 10,000 15,000 20,000 25,000
GD
P/c
apit
a (P
PP
, U
SD
, 20
05)
kWh/capita (2005)
France
Korea (Rep.)
Germany
Switzerland
Russia
South Africa
Argentina
Brazil
China
India
WEC Average
Norway
United States
Canada
FinlandSwedenJapan
Water for Energy World Energy Council
14
Figure 8 New US gas-supply projections to 2035 Source: US Department of Energy, EIA, Annual Energy Outlook 2010
1990 1995 2000 2005 2010 2015 2020 2025 2030 2035
Tcf
25
20
15
10
5
0
Non-associated offshore
Non-associated onshore
Net imports
Associated with oil
Shale gas
Alaska
Coalbed methane
History Projections
account for close to 50% of world’s water consumption by the oil-producing industry, while Asia will account for not even 20%. Although both regions produce roughly the same amount of oil, North America and South America will generate its oil increasingly from non-conventional oil sources, consuming 2.5 to 4 times more water (Annex 2).
2.1.2 Natural gas
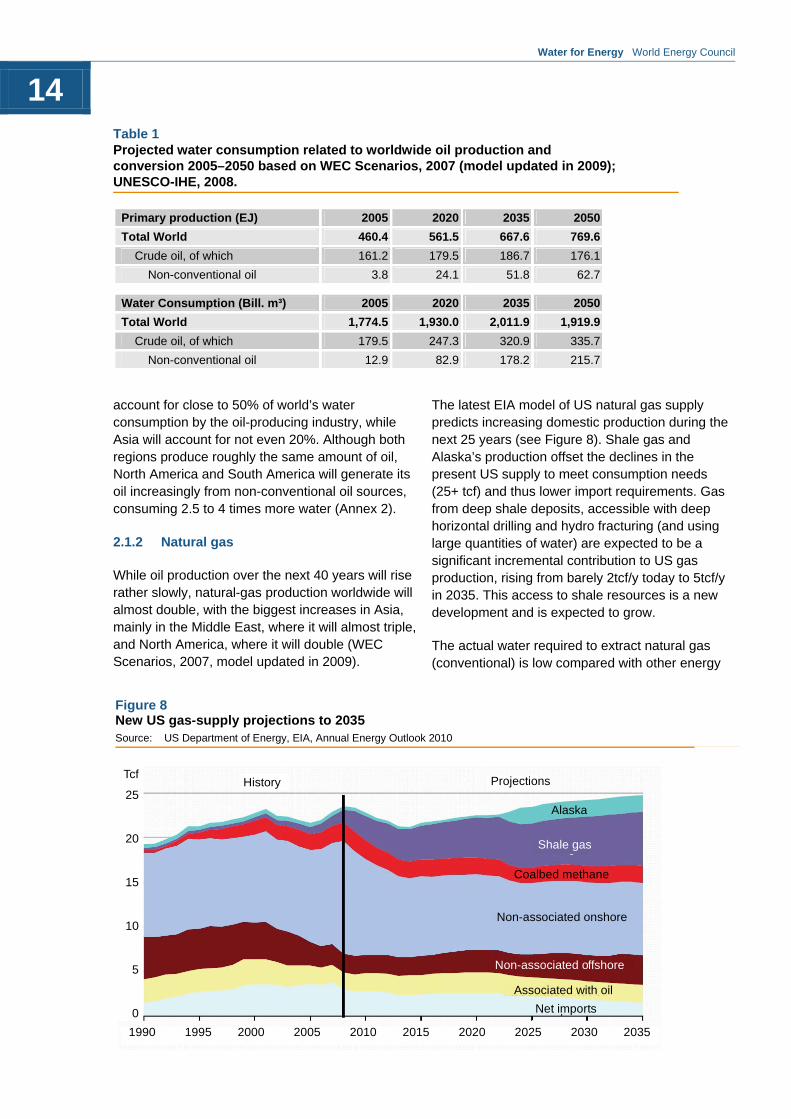
While oil production over the next 40 years will rise rather slowly, natural-gas production worldwide will almost double, with the biggest increases in Asia, mainly in the Middle East, where it will almost triple, and North America, where it will double (WEC Scenarios, 2007, model updated in 2009).
The latest EIA model of US natural gas supply predicts increasing domestic production during the next 25 years (see Figure 8). Shale gas and Alaska’s production offset the declines in the present US supply to meet consumption needs (25+ tcf) and thus lower import requirements. Gas from deep shale deposits, accessible with deep horizontal drilling and hydro fracturing (and using large quantities of water) are expected to be a significant incremental contribution to US gas production, rising from barely 2tcf/y today to 5tcf/y in 2035. This access to shale resources is a new development and is expected to grow.
The actual water required to extract natural gas (conventional) is low compared with other energy
Table 1 Projected water consumption related to worldwide oil production and conversion 2005–2050 based on WEC Scenarios, 2007 (model updated in 2009); UNESCO-IHE, 2008.
Primary production (EJ) 2005 2020 2035 2050
Total World 460.4 561.5 667.6 769.6
Crude oil, of which 161.2 179.5 186.7 176.1
Non-conventional oil 3.8 24.1 51.8 62.7
Water Consumption (Bill. m³) 2005 2020 2035 2050
Total World 1,774.5 1,930.0 2,011.9 1,919.9
Crude oil, of which 179.5 247.3 320.9 335.7
Non-conventional oil 12.9 82.9 178.2 215.7
Water for Energy World Energy Council
15
Table 3 Projected water consumption related to worldwide coal production 2005–2050 based on WEC Scenarios, 2007 (model updated in 2009); UNESCO-IHE, 2008.
Primary production (EJ) 2005 2020 2035 2050
Total World 460.4 561.5 667.6 769.6
Coal 121.1 144.0 170.3 217.2
Water Consumption (Bill. m³) 2005 2020 2035 2050
Total World 1,774.5 1,930.0 2,011.9 1,919.9
Coal 19.9 23.6 27.9 35.6
carriers, and processing and transporting it does not consume much water either. Conventional natural gas therefore is the fossil fuel with the lowest carbon emission, and the lowest water consumption during production. It is estimated that approximately 0.109 m³ of water is needed per GJ (Annex 1). Overall, the production of natural gas accounts for less than 0.5% of total water consumption in energy production (Annex 2).
As with non-conventional oil, new technologies such as horizontal drilling as well as new extracting methods have made deep natural gas deposits, also known as shale gas, mineable. But whereas shale gas was previously not considered to be practical and economically exploitable, it now is (although to do so means costs and freshwater requirements to fracture the formation to release the natural gas are much higher than for conventional natural gas). A significant amount of the water used to extract natural gas is recoverable, but may then contain contaminants from hydraulic fracturing chemicals (WEC, Shale Gas, 2010; see Table 2).
2.1.3 Coal
Energy from coal production is presently below oil but will likely become higher over the next 30-40 years (WEC Scenarios, 2007, model updated in 2009). Mining and refining coal (refining includes washing and beneficiation) requires water at various stages (see Table 3). Estimates show that approximately 0.164 m³ of water is needed per GJ (Annex 1). Overall, the production of coal accounts for less than 1% of total water consumption in energy production (Annex 2). The water used for the conversion to electricity is treated separately in Section 2.2.
2.1.4 Uranium
Uranium production presently accounts for approximately 6% of worldwide primary energy production and will rise to 9% over the next 40 years, with the main producers being in Asia, Europe, and North America. Africa and South America account for only 1% of the global uranium production (see Table 4).
Table 2 Projected water consumption related to worldwide natural-gas production 2005–2050 based on WEC Scenarios, 2007 (model updated in 2009); UNESCO-IHE, 2008.
Primary production (EJ) 2005 2020 2035 2050
Total World 460.4 561.5 667.6 769.6
Natural gas 97.8 137.1 168.7 181.3
Water Consumption (Bill. m³) 2005 2020 2035 2050
Total World 1,774.5 1,930.0 2,011.9 1,919.9
Natural gas 10.7 14.9 18.4 19.8
Water for Energy World Energy Council
16
Figure 9 Correlation between poverty level and traditional biomass use Source: WEC Scenarios, 2007, model updated in 2009; IMF 2007
0
10,000
20,000
30,000
40,000
50,000
60,000
0 2 4 6 8 10
GD
P/c
apit
a (P
PP
, U
SD
, 20
05)
Biomass production (GJ, 2005)
India
Russia
North Africa
Mexico
BrazilChina
United States
Canada
Sub Saharan Africa
Mining, milling as well as the conversion and processing of uranium requires less water per unit energy than other energy source. It is estimated that approximately 0.086 m³ of water is needed per GJ (Annex 1). Overall, the production of uranium accounts for less than 0.2% of total water consumption in energy production (Annex 2).
2.1.5 Biomass
Biomass plays an important role in meeting energy demand in many regions in the world. Considered as the fuel for the poor, it plays a crucial role especially in the energy mix of developing
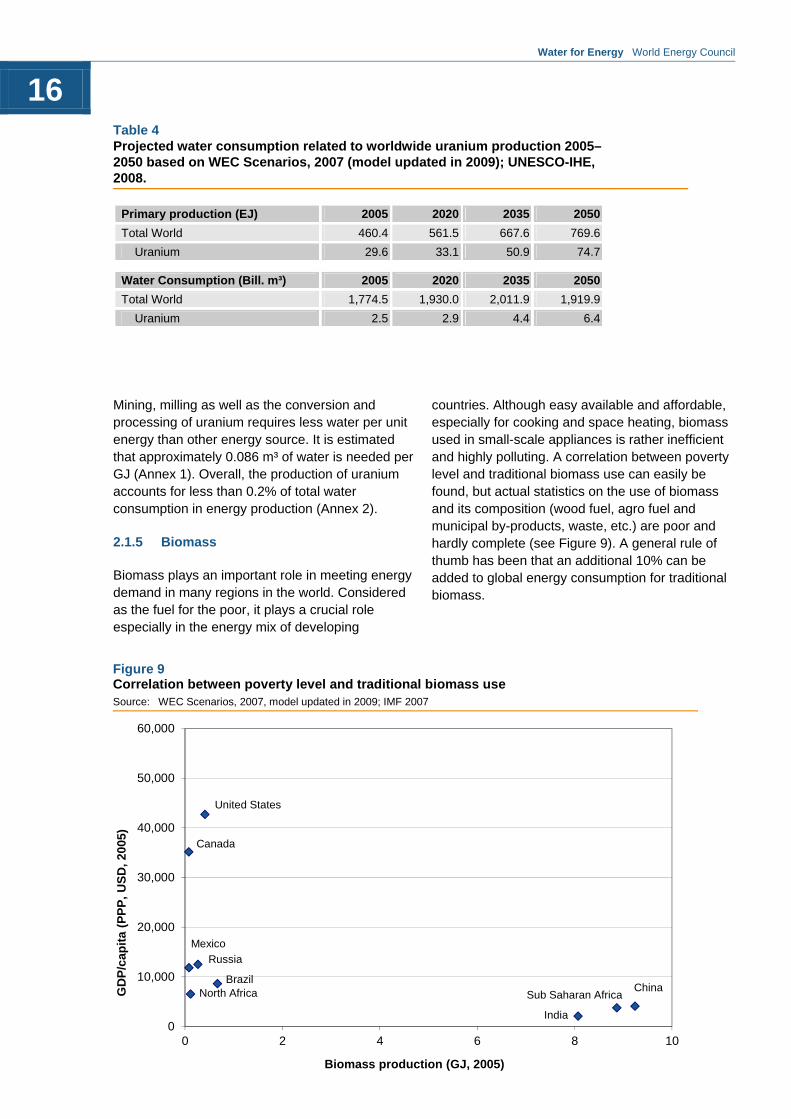
countries. Although easy available and affordable, especially for cooking and space heating, biomass used in small-scale appliances is rather inefficient and highly polluting. A correlation between poverty level and traditional biomass use can easily be found, but actual statistics on the use of biomass and its composition (wood fuel, agro fuel and municipal by-products, waste, etc.) are poor and hardly complete (see Figure 9). A general rule of thumb has been that an additional 10% can be added to global energy consumption for traditional biomass.
Table 4 Projected water consumption related to worldwide uranium production 2005–2050 based on WEC Scenarios, 2007 (model updated in 2009); UNESCO-IHE, 2008.
Primary production (EJ) 2005 2020 2035 2050
Total World 460.4 561.5 667.6 769.6
Uranium 29.6 33.1 50.9 74.7
Water Consumption (Bill. m³) 2005 2020 2035 2050
Total World 1,774.5 1,930.0 2,011.9 1,919.9
Uranium 2.5 2.9 4.4 6.4
Water for Energy World Energy Council
17
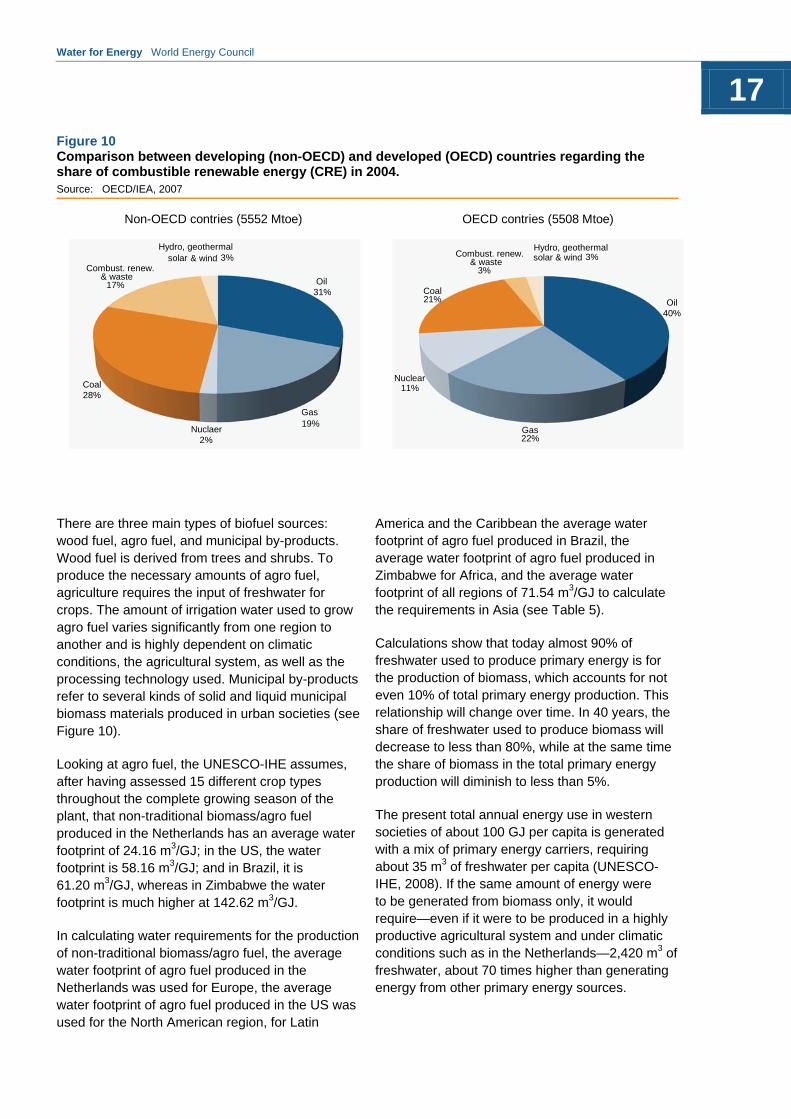
There are three main types of biofuel sources: wood fuel, agro fuel, and municipal by-products. Wood fuel is derived from trees and shrubs. To produce the necessary amounts of agro fuel, agriculture requires the input of freshwater for crops. The amount of irrigation water used to grow agro fuel varies significantly from one region to another and is highly dependent on climatic conditions, the agricultural system, as well as the processing technology used. Municipal by-products refer to several kinds of solid and liquid municipal biomass materials produced in urban societies (see Figure 10).
Looking at agro fuel, the UNESCO-IHE assumes, after having assessed 15 different crop types throughout the complete growing season of the plant, that non-traditional biomass/agro fuel produced in the Netherlands has an average water footprint of 24.16 m3/GJ; in the US, the water footprint is 58.16 m3/GJ; and in Brazil, it is 61.20 m3/GJ, whereas in Zimbabwe the water footprint is much higher at 142.62 m3/GJ.
In calculating water requirements for the production of non-traditional biomass/agro fuel, the average water footprint of agro fuel produced in the Netherlands was used for Europe, the average water footprint of agro fuel produced in the US was used for the North American region, for Latin
America and the Caribbean the average water footprint of agro fuel produced in Brazil, the average water footprint of agro fuel produced in Zimbabwe for Africa, and the average water footprint of all regions of 71.54 m3/GJ to calculate the requirements in Asia (see Table 5).
Calculations show that today almost 90% of freshwater used to produce primary energy is for the production of biomass, which accounts for not even 10% of total primary energy production. This relationship will change over time. In 40 years, the share of freshwater used to produce biomass will decrease to less than 80%, while at the same time the share of biomass in the total primary energy production will diminish to less than 5%.
The present total annual energy use in western societies of about 100 GJ per capita is generated with a mix of primary energy carriers, requiring about 35 m3 of freshwater per capita (UNESCO-IHE, 2008). If the same amount of energy were to be generated from biomass only, it would require—even if it were to be produced in a highly productive agricultural system and under climatic conditions such as in the Netherlands—2,420 m3 of freshwater, about 70 times higher than generating energy from other primary energy sources.
Figure 10 Comparison between developing (non-OECD) and developed (OECD) countries regarding the share of combustible renewable energy (CRE) in 2004. Source: OECD/IEA, 2007
Non-OECD contries (5552 Mtoe) OECD contries (5508 Mtoe)
Oil31%
Gas19%
Nuclaer2%
& waste17%
Hydro, geothermalsolar & wind 3%
Gas
Coal21%
Combust. renew.Hydro, geothermalsolar & wind 3%
Combust. renew.
Coal28%
Nuclear11%
Oil40%
22%
& waste3%
Water for Energy World Energy Council
18
Besides the disproportional amount of water needed to produce biomass, using biomass to generate energy is not in all cases emitting less greenhouse gases. Therefore, it seems to be highly questionable whether the production and usage of biomass adds value.
2.2 Electricity production
As with the water requirements for primary energy production, diverse institutions all over the world have been analysing specific water requirements for electricity generation. These studies have evaluated water requirements of various processes, thereby differentiating between thermoelectric-generating technologies using oil, gas, coal, biomass and biowaste, uranium, and geothermal power-generating plants as well as electricity generated from hydro, wind, and solar. Many utilities cannot measure water consumption, so only estimates exist.
2.2.1 Thermoelectric plants
Thermoelectric power plants, independent of fuel type, need cooling and process water. Whereas the amount of process water is rather minor, cooling
water requirements are higher and depend on the cooling system used. The water used is either wasted or recovered and returned to its source. Cooling systems are differentiated between once-through and recirculating systems; the latter can be classified into wet-cooling systems, such as cooling ponds and cooling towers, and dry- (or air-) cooling systems.
For example, of the existing thermoelectric power plants in the US, about 43% use a once-through cooling water system. The majority of these plants were built before 1969, while the majority of cooling systems installed after 1970 or later use recirculating cooling.
Installing wet recirculating cooling systems is approximately 40% more expensive than once-through cooling systems, while dry cooling systems are 3 to 4 times more expensive than a wet recirculating systems (Water requirements in emerging thermoelectric power plants, DOE-NETL, 2008).
Once-through cooling systems return almost all the freshwater withdrawn to its source, with only a small amount of water, approximately 1%, lost
Table 5 Projected water consumption related to worldwide traditional biomass production 2005–2050 based on WEC Scenarios, 2007 (model updated in 2009); UNESCO-IHE, 2008.
Primary production (EJ) 2005 2020 2035 2050
Total World 460.4 561.5 667.6 769.6
Total Traditional Biomass 36.3 37.1 36.2 33.8
Africa 9.0 10.5 11.3 10.4
Asia 23.2 22.5 21.0 19.3
Europe 1.8 1.8 1.8 1.9
Latin America & Caribbean 1.6 1.6 1.5 1.5
North America 0.8 0.7 0.7 0.6
Water Consumption (Bill. m³) 2005 2020 2035 2050
Total World 1,774.5 1,930.0 2,011.9 1,919.9
Total Traditional Biomass* 1,562.0 1,641.2 1,640.3 1,522.4
Africa 640.4 745.6 802.4 744.2
Asia 829.8 805.6 749.7 690.2
Europe 22.1 22.0 22.3 22.9
Latin America & Caribbean 47.7 47.7 46.7 46.7
North America 21.9 20.4 19.3 18.4
* it is assumed that 50% of the total traditional biomass is produced in the form of wood fuel, with no specific water requirements, the remaining 50% are multiplied with the respective water footprints

Water for Energy World Energy Council
19
through evaporation or leaks in the system. The water discharged as part of the process is either returned to its original source or sent to a water-treatment facility.
For recirculating cooling systems, less water is withdrawn from the source, but 70-90% of the water is lost through evaporation. While a once-through cooling system withdraws much more water than a recirculating system, a recirculating cooling system actually consumes more than 10 times the amount of water of a once-through system (see Table 6).
In the US for example, a major effect of the US Clean Water Act is to regulate the impact of cooling water on aquatic life, and this drives the choice toward recirculating systems over once-through for freshwater. This will increase water consumption unless more expensive and less efficient dry cooling systems are used.
In its 2008 report, DOE-NETL quantified water consumption for different thermoelectric generation platforms:
Subcritical and Supercritical bituminous pulverized coal (PC) plants: Sub- and supercritical PC plants have been examined as the least energy-efficient types of fossil fuel power plants, with subcritical PC plants consuming the most water per energy unit. Ninety percent (90%) of all coal-fired plants in the world are traditional PC plants; in the US, the share is 99%. There are two types of PC plants. Subcritical PC plants are a first-generation technology, with thousands in use all over the world. A large number of supercritical plants are in
use in the United States, Europe, Russia, and Japan, and a limited number in South Africa and China. Ultra-supercritical plants, demonstrating even higher overall energy efficiencies than supercritical plants, have also been constructed in Europe and Japan, but the technology is still considered unproven and a potential technical and economic risk. Installation costs for supercritical plants are only 2% higher than those for subcritical plants, operation costs are comparable, but fuel costs, due to higher efficiency, are lower for supercritical systems.
Integrated Gasification Combined Cycle (IGCC) plants: IGCC is a technology that turns coal into synthetic gas and then uses that gas to heat water, while removing impurities. With lower emissions, significantly less water consumption (see Table 6) and the generation of less solid waste, it seems to be the most promising technology for utilizing coal (EPA, 2006).
Combined Cycle Gas Turbine (CCGT) plant: In a CCGT plant, a gas turbine generates electricity and the waste heat is used to make steam, generating additional electricity via a steam turbine; this last step enhances the efficiency of electricity generation. CCGT plants are usually powered by natural gas, although fuel oil, synthetic gas, or even biofuels can be used. The majority of water consumed in a CCGT plant is used for cooling. In its 2008 report, DOE-NETL does not quantify the water requirements of CCGT plants, but it has been estimated (Gleick, 1994) that the generation of electricity by burning oil or natural gas requires approximately the same amount of water especially
Table 6 Freshwater withdrawal and consumption for different cooling technologies Source: DOE-NETL, 2004
Fuel source Technology Withdrawal (liters/kWh)
Consumption(liters/kWh)
Fossil Once-through 142.5 0.38
Fossil Recirculating 4.5 4.20
Nuclear Once-through 174.6 0.38
Nuclear Recirculating 5.7 5.70
Water for Energy World Energy Council
20
for cooling as coal-fired IGCC plants because the thermal efficiency is comparable.
Natural Gas Combined Cycle (NGCC) plants: A NGCC plant works similarly to a CCGT plant. The majority of water used in a NGCC plant is for cooling. No water is consumed for slurrying or desulfurization. In North America and Europe, most new gas power plants are of this type. Water consumption compared with all other fossil fuel-fired power plants is lowest.
Nuclear plants: Due to limited steam conditions, nuclear plants have a higher cooling tower load relative to their net power generation than fossil energy plants. Limited by metal brittleness effects from the nuclear reactor, efficiency is lower and water consumption is higher than in any fossil fuel-fired power plant.
2.2.2 Carbon capture and storage
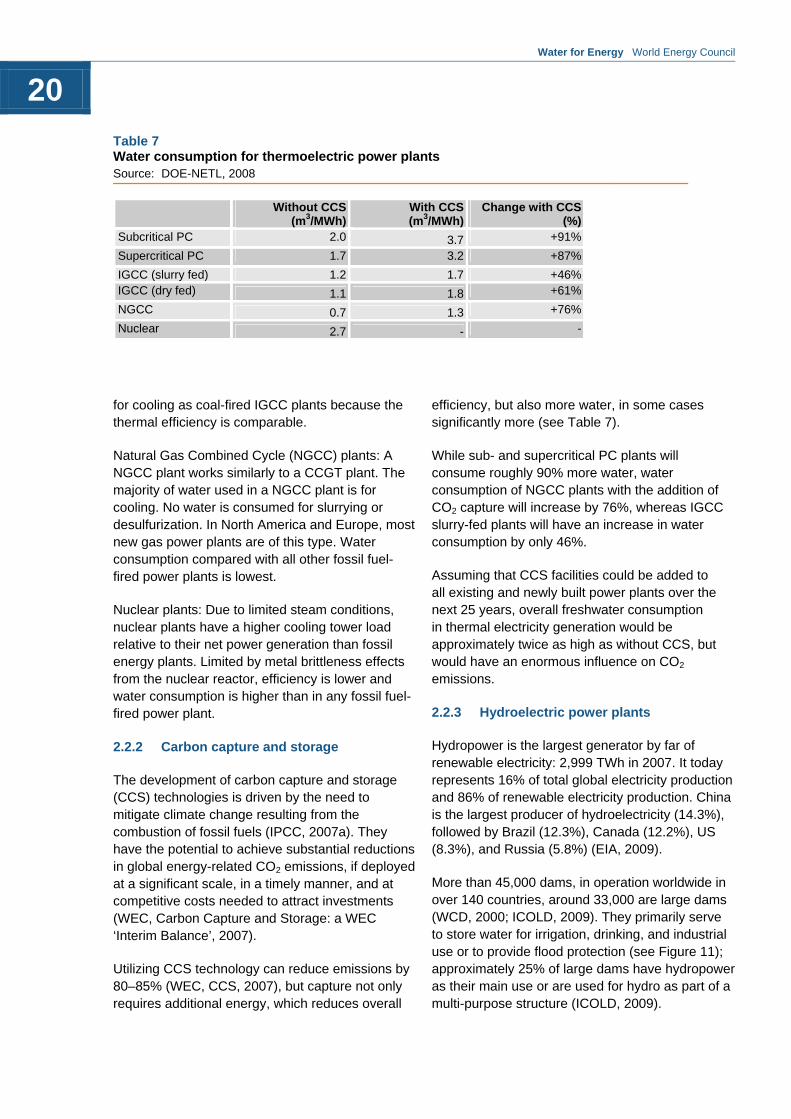
The development of carbon capture and storage (CCS) technologies is driven by the need to mitigate climate change resulting from the combustion of fossil fuels (IPCC, 2007a). They have the potential to achieve substantial reductions in global energy-related CO2 emissions, if deployed at a significant scale, in a timely manner, and at competitive costs needed to attract investments (WEC, Carbon Capture and Storage: a WEC ‘Interim Balance’, 2007).
Utilizing CCS technology can reduce emissions by 80–85% (WEC, CCS, 2007), but capture not only requires additional energy, which reduces overall
efficiency, but also more water, in some cases significantly more (see Table 7).
While sub- and supercritical PC plants will consume roughly 90% more water, water consumption of NGCC plants with the addition of CO2 capture will increase by 76%, whereas IGCC slurry-fed plants will have an increase in water consumption by only 46%.
Assuming that CCS facilities could be added to all existing and newly built power plants over the next 25 years, overall freshwater consumption in thermal electricity generation would be approximately twice as high as without CCS, but would have an enormous influence on CO2 emissions.
2.2.3 Hydroelectric power plants
Hydropower is the largest generator by far of renewable electricity: 2,999 TWh in 2007. It today represents 16% of total global electricity production and 86% of renewable electricity production. China is the largest producer of hydroelectricity (14.3%), followed by Brazil (12.3%), Canada (12.2%), US (8.3%), and Russia (5.8%) (EIA, 2009).
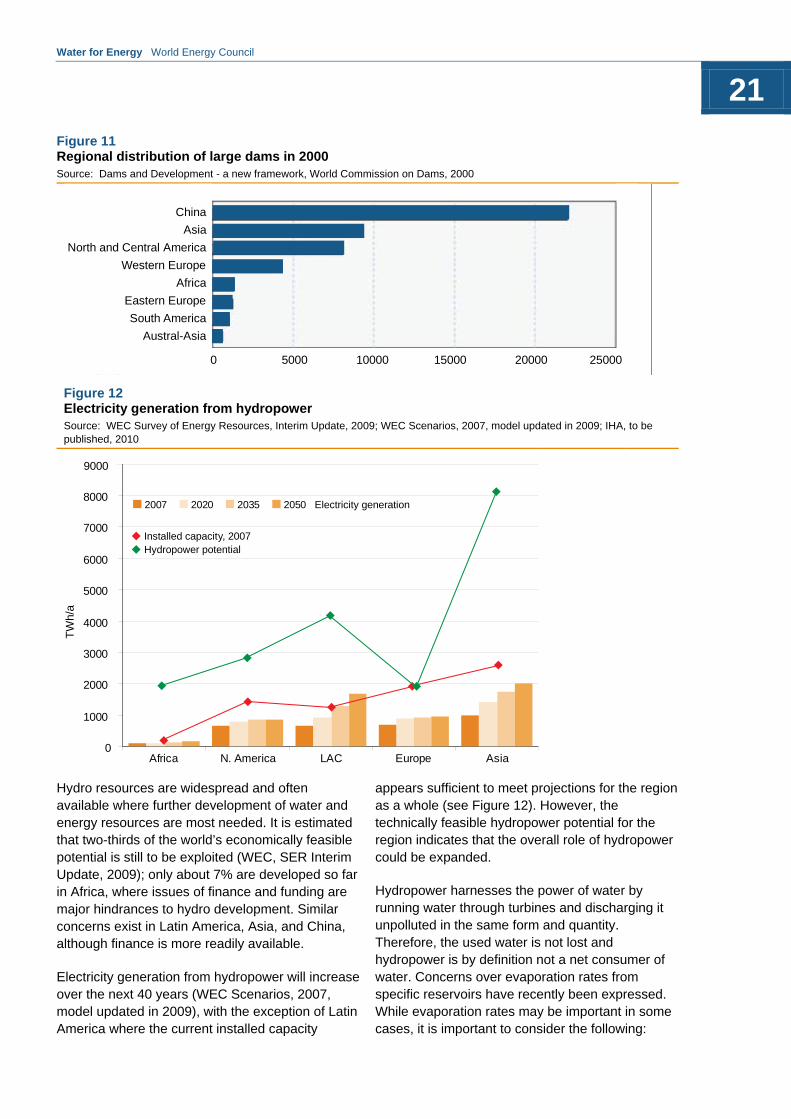
More than 45,000 dams, in operation worldwide in over 140 countries, around 33,000 are large dams (WCD, 2000; ICOLD, 2009). They primarily serve to store water for irrigation, drinking, and industrial use or to provide flood protection (see Figure 11); approximately 25% of large dams have hydropower as their main use or are used for hydro as part of a multi-purpose structure (ICOLD, 2009).
Table 7 Water consumption for thermoelectric power plants Source: DOE-NETL, 2008
Without CCS (m3/MWh)
With CCS(m3/MWh)
Change with CCS (%)
Subcritical PC 2.0 3.7 +91%
Supercritical PC 1.7 3.2 +87%
IGCC (slurry fed) 1.2 1.7 +46% IGCC (dry fed) 1.1 1.8 +61%
NGCC 0.7 1.3 +76%
Nuclear 2.7 - -
Water for Energy World Energy Council
21
Hydro resources are widespread and often available where further development of water and energy resources are most needed. It is estimated that two-thirds of the world’s economically feasible potential is still to be exploited (WEC, SER Interim Update, 2009); only about 7% are developed so far in Africa, where issues of finance and funding are major hindrances to hydro development. Similar concerns exist in Latin America, Asia, and China, although finance is more readily available.
Electricity generation from hydropower will increase over the next 40 years (WEC Scenarios, 2007, model updated in 2009), with the exception of Latin America where the current installed capacity
appears sufficient to meet projections for the region as a whole (see Figure 12). However, the technically feasible hydropower potential for the region indicates that the overall role of hydropower could be expanded.
Hydropower harnesses the power of water by running water through turbines and discharging it unpolluted in the same form and quantity. Therefore, the used water is not lost and hydropower is by definition not a net consumer of water. Concerns over evaporation rates from specific reservoirs have recently been expressed. While evaporation rates may be important in some cases, it is important to consider the following:
Figure 11 Regional distribution of large dams in 2000 Source: Dams and Development - a new framework, World Commission on Dams, 2000
Figure 12 Electricity generation from hydropower Source: WEC Survey of Energy Resources, Interim Update, 2009; WEC Scenarios, 2007, model updated in 2009; IHA, to be published, 2010
China
Asia
North and Central America
Western Europe
Africa
Eastern Europe
South America
Austral-Asia
0 5000 10000 15000 20000 25000
0
1000
2000
3000
4000
5000
6000
7000
8000
Africa N. America LAC Europe Asia
2007 2020 2035 2050 Electricity generation
TW
h/a
Installed capacity, 2007
9000
Hydropower potential
Water for Energy World Energy Council
22
(1) evaporated water is not consumed but re-enters the hydrological cycle as precipitation; (2) evaporation is highest in arid areas, where reservoirs often serve as storage to provide water which would otherwise not be available; (3) consideration or calculation of evaporation rates with regard to hydropower is problematic and can rarely be attributed to hydropower alone but to multiple uses (power, flood control, irrigation, water storage, recreation, and navigation); and (4) the climate which influences evaporation rates varies from and due to great regional differences and because of insufficient research in this area, a global figure for water evaporation from reservoirs cannot be extrapolated from individual data.
To date, most of the research on evaporation rates from hydropower comes from the United States. Current findings vary from 0.04 m3/MWh to 210 m3/MWh, with an expected median between 2.6m3/MWh–5.4m3/MWh (DOE, 2006; Gleick, 1994; UNESCO-IHE, 2009). If the size of the power plant is considered, smaller plants usually face more evaporation per unit of energy generated than larger plants (Gleick, 1994).
2.2.4 Electricity from wind and solar
Solar energy is utilized in three different ways: heat is produced through solar collectors producing hot water; electricity is generated through photovoltaic (PV) cells; and electricity is generated through solar-concentrating thermal steam plants. PV cells are used in rather limited situations for powering small appliances, whereas solar thermal power plants produce much more energy for use on a
widespread basis (consumers, industry, and countries).
Almost no water is needed to produce electricity from PV cells, and only minor amounts are used in their manufacture and periodic cleaning. Water consumption by solar thermal power plants varies highly depending on the type of facility. Water is used for cooling, but also for washing the mirrors. While smaller, more common plants require only a small amount of water per energy unit—0.265 m³ per GJ—larger installations, such as the plant built by LUZ Corporation in southern California with more than 300 MWe, consume up to 4 m³ per MWh (Gleick, 1994).
Wind energy utilizes the kinetic energy in air. Wind farms require only a negligible amount of water, mostly for cleaning, to produce electricity.
Using available information, water requirements for electricity generation over the next 40 years can be estimated (see Table 8). The consumption factors produced by NETL/DOE are based on recirculating cooling systems. For the calculation, it is assumed that 90% of the thermal electricity from coal is produced in PC plants using an estimated mean value of 1.834 m³ per MWh, while 10% is produced in IGCC plants using an estimated mean value of 1.143 m³ per MWh. Assuming that CCGT plants consume as much water per energy unit as IGCC plants, an estimated mean value of 1.143 m³ per MWh for thermal electricity generated from oil, biomass, and waste is applied. NGCC plants need less water than all other fossil fuel-fired power plants. An estimated amount of 0.727 m³ per MWh is used in the calculation going forward concerning
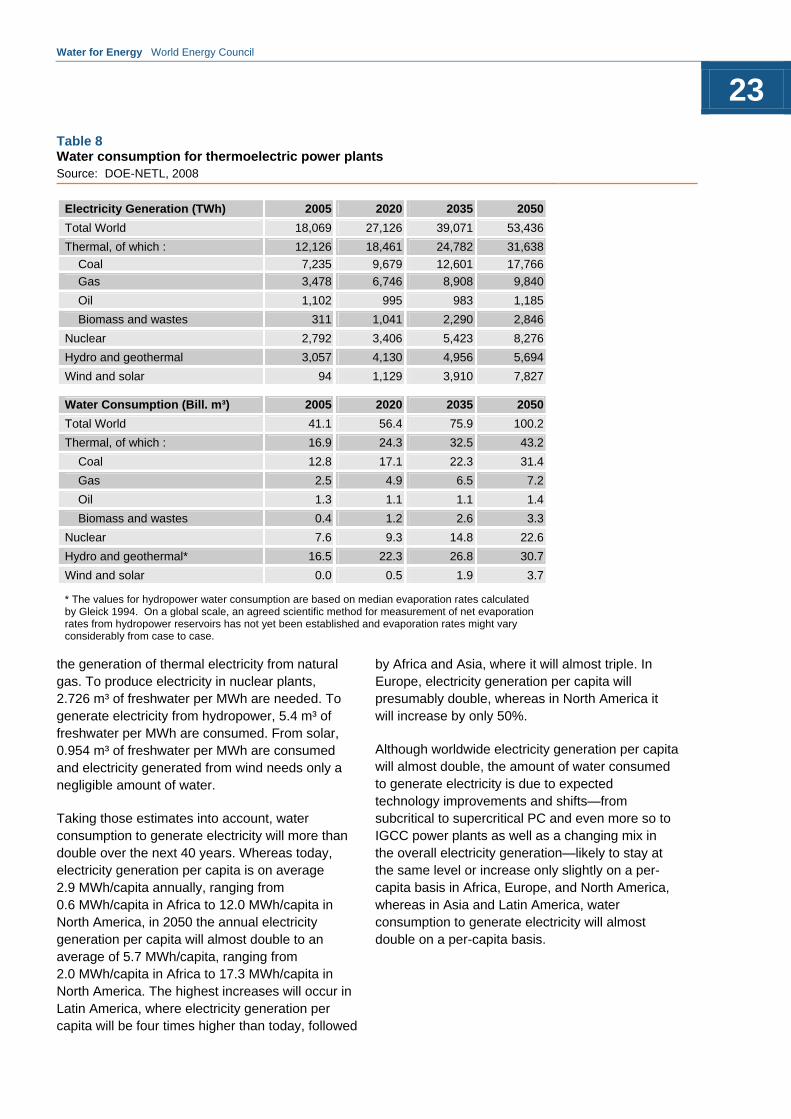
Water for Energy World Energy Council
23
the generation of thermal electricity from natural gas. To produce electricity in nuclear plants, 2.726 m³ of freshwater per MWh are needed. To generate electricity from hydropower, 5.4 m³ of freshwater per MWh are consumed. From solar, 0.954 m³ of freshwater per MWh are consumed and electricity generated from wind needs only a negligible amount of water.
Taking those estimates into account, water consumption to generate electricity will more than double over the next 40 years. Whereas today, electricity generation per capita is on average 2.9 MWh/capita annually, ranging from 0.6 MWh/capita in Africa to 12.0 MWh/capita in North America, in 2050 the annual electricity generation per capita will almost double to an average of 5.7 MWh/capita, ranging from 2.0 MWh/capita in Africa to 17.3 MWh/capita in North America. The highest increases will occur in Latin America, where electricity generation per capita will be four times higher than today, followed
by Africa and Asia, where it will almost triple. In Europe, electricity generation per capita will presumably double, whereas in North America it will increase by only 50%.
Although worldwide electricity generation per capita will almost double, the amount of water consumed to generate electricity is due to expected technology improvements and shifts—from subcritical to supercritical PC and even more so to IGCC power plants as well as a changing mix in the overall electricity generation—likely to stay at the same level or increase only slightly on a per-capita basis in Africa, Europe, and North America, whereas in Asia and Latin America, water consumption to generate electricity will almost double on a per-capita basis.
Table 8 Water consumption for thermoelectric power plants Source: DOE-NETL, 2008
Electricity Generation (TWh) 2005 2020 2035 2050
Total World 18,069 27,126 39,071 53,436
Thermal, of which : 12,126 18,461 24,782 31,638
Coal 7,235 9,679 12,601 17,766
Gas 3,478 6,746 8,908 9,840
Oil 1,102 995 983 1,185
Biomass and wastes 311 1,041 2,290 2,846
Nuclear 2,792 3,406 5,423 8,276
Hydro and geothermal 3,057 4,130 4,956 5,694
Wind and solar 94 1,129 3,910 7,827
Water Consumption (Bill. m³) 2005 2020 2035 2050
Total World 41.1 56.4 75.9 100.2
Thermal, of which : 16.9 24.3 32.5 43.2
Coal 12.8 17.1 22.3 31.4
Gas 2.5 4.9 6.5 7.2
Oil 1.3 1.1 1.1 1.4
Biomass and wastes 0.4 1.2 2.6 3.3
Nuclear 7.6 9.3 14.8 22.6
Hydro and geothermal* 16.5 22.3 26.8 30.7
Wind and solar 0.0 0.5 1.9 3.7
* The values for hydropower water consumption are based on median evaporation rates calculated by Gleick 1994. On a global scale, an agreed scientific method for measurement of net evaporation rates from hydropower reservoirs has not yet been established and evaporation rates might vary considerably from case to case.
Water for Energy World Energy Council
24
In the preceding sections, water needs for fuel production and electricity generation were identified. The projections by WEC can now be employed to look at the water requirements per region in 2020, 2035, and 2050. As stated before, there is no economic activity of importance that does not relate to energy and water availability. Various sectors of the economy require energy and water in many variable degrees, hence establishing overall figures of merit is very eluding. However, a certain effort in attaining them must be done to address the issue of water for energy on regional and world levels.
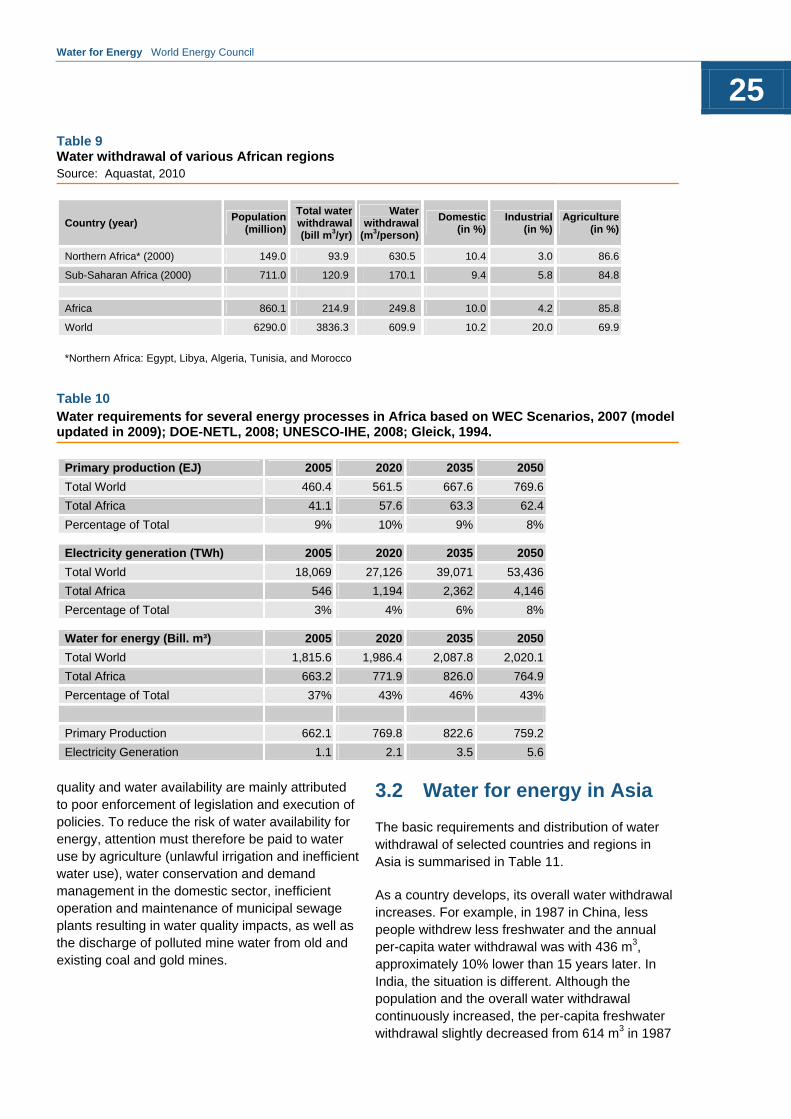
3.1 Water for energy in Africa
Today, almost 14% of world’s population lives in Africa, consuming not even 6% of the total freshwater annually (see Table 9). Compared with other regions of the world, African countries on average consume less water per capita. As a country progresses, such as in the case of Egypt, Libya, South Africa, and Tunisia, the per capita amount of water withdrawn annually increases. The lower income countries of Sub-Saharan Africa have a total amount of annual water withdrawal of less than 50 m3 per capita, with sometimes even less than 2 m3 of water per capita for domestic uses. The more developed countries of North Africa withdraw between 200-1,000 m3 of water per capita annually, with almost 60 m3 of water per capita for domestic uses, just slightly below the world average.
Looking into the future and assuming Africa’s population will continue to increase on an average of 2% per year, 22% of the world’s population will
live in Africa by 2050, withdrawing more water, using more energy, and requiring more water to produce the necessary amount of energy. Besides, programmes to give more people access to electricity (e.g., the South African National Electrification Programme or Egypt’s establishment of a rural electrification authority to implement sub-transmission and distribution networks for rural areas and remote communities) will further accelerate changes in the amount of electricity generated and consumed in Africa. Whereas African primary production is likely to increase by approximately 50%, electricity generation will be 7 times as high as nowadays.
To identify the water needs of the energy sector in Africa over the next few decades, the earlier identified water requirements for fuel production and electricity generation are adapted to the projections made in WEC Scenarios Report, 2007 and updated in 2009 (see Table 10).
Although Africa’s low share in the world’s total primary energy production (9% in 2005, estimated at 8% in 2050), the water used to produce and generate energy accounts for more than one-third of water consumed in the energy sector worldwide. This is mainly due to a relatively high share, about 25%, of traditional biomass in Africa’s energy mix.
Whereas existing legislation and policies to ensure adequate water for energy seem to be in place in South Africa and other more developed African countries, the biggest challenge lies in the implementation, execution, and enforcement of the various pieces of legislation and policies. In South Africa for example, current concerns on water
3. Water requirements by region
Water for Energy World Energy Council
25
quality and water availability are mainly attributed to poor enforcement of legislation and execution of policies. To reduce the risk of water availability for energy, attention must therefore be paid to water use by agriculture (unlawful irrigation and inefficient water use), water conservation and demand management in the domestic sector, inefficient operation and maintenance of municipal sewage plants resulting in water quality impacts, as well as the discharge of polluted mine water from old and existing coal and gold mines.
3.2 Water for energy in Asia
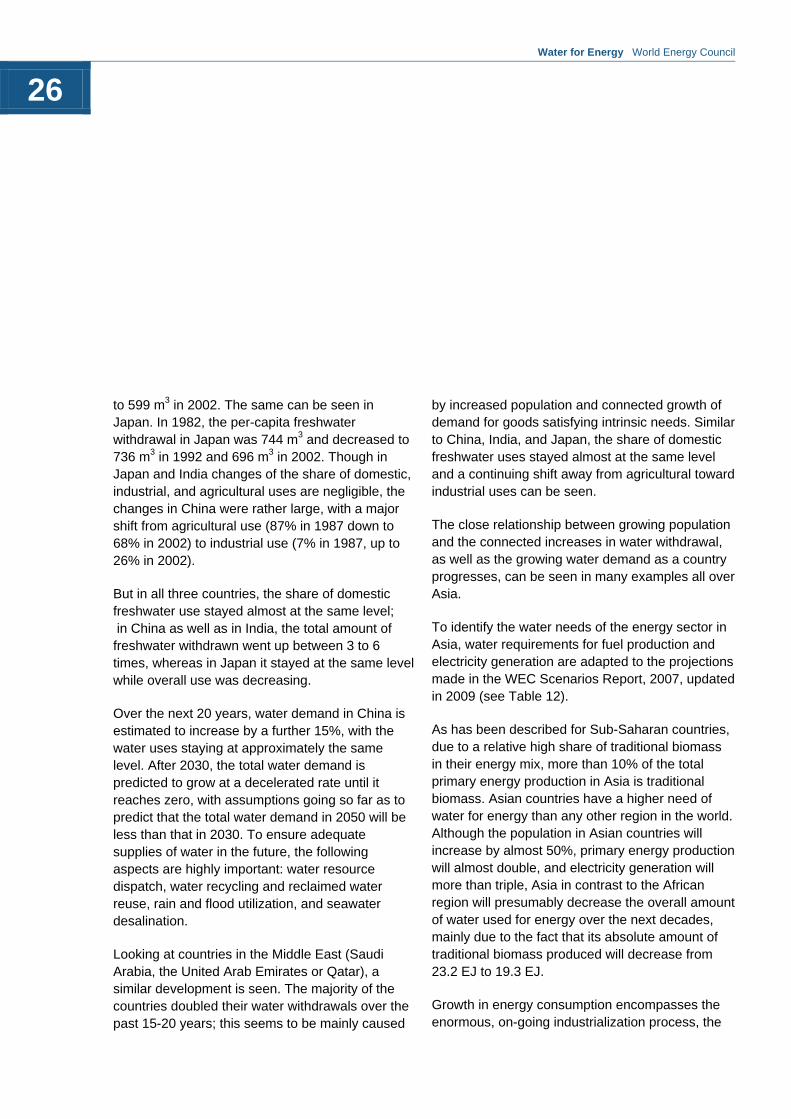
The basic requirements and distribution of water withdrawal of selected countries and regions in Asia is summarised in Table 11.
As a country develops, its overall water withdrawal increases. For example, in 1987 in China, less people withdrew less freshwater and the annual per-capita water withdrawal was with 436 m3, approximately 10% lower than 15 years later. In India, the situation is different. Although the population and the overall water withdrawal continuously increased, the per-capita freshwater withdrawal slightly decreased from 614 m3 in 1987
Table 9 Water withdrawal of various African regions Source: Aquastat, 2010
Country (year) Population
(million)
Total water withdrawal(bill m3/yr)
Water withdrawal
(m3/person)
Domestic(in %)
Industrial(in %)
Agriculture (in %)
Northern Africa* (2000) 149.0 93.9 630.5 10.4 3.0 86.6
Sub-Saharan Africa (2000) 711.0 120.9 170.1 9.4 5.8 84.8
Africa 860.1 214.9 249.8 10.0 4.2 85.8
World 6290.0 3836.3 609.9 10.2 20.0 69.9
*Northern Africa: Egypt, Libya, Algeria, Tunisia, and Morocco
Table 10 Water requirements for several energy processes in Africa based on WEC Scenarios, 2007 (model updated in 2009); DOE-NETL, 2008; UNESCO-IHE, 2008; Gleick, 1994.
Primary production (EJ) 2005 2020 2035 2050
Total World 460.4 561.5 667.6 769.6
Total Africa 41.1 57.6 63.3 62.4
Percentage of Total 9% 10% 9% 8%
Electricity generation (TWh) 2005 2020 2035 2050
Total World 18,069 27,126 39,071 53,436
Total Africa 546 1,194 2,362 4,146
Percentage of Total 3% 4% 6% 8%
Water for energy (Bill. m³) 2005 2020 2035 2050
Total World 1,815.6 1,986.4 2,087.8 2,020.1
Total Africa 663.2 771.9 826.0 764.9
Percentage of Total 37% 43% 46% 43%
Primary Production 662.1 769.8 822.6 759.2
Electricity Generation 1.1 2.1 3.5 5.6
Water for Energy World Energy Council
26
to 599 m3 in 2002. The same can be seen in Japan. In 1982, the per-capita freshwater withdrawal in Japan was 744 m3 and decreased to 736 m3 in 1992 and 696 m3 in 2002. Though in Japan and India changes of the share of domestic, industrial, and agricultural uses are negligible, the changes in China were rather large, with a major shift from agricultural use (87% in 1987 down to 68% in 2002) to industrial use (7% in 1987, up to 26% in 2002).
But in all three countries, the share of domestic freshwater use stayed almost at the same level; in China as well as in India, the total amount of freshwater withdrawn went up between 3 to 6 times, whereas in Japan it stayed at the same level while overall use was decreasing.
Over the next 20 years, water demand in China is estimated to increase by a further 15%, with the water uses staying at approximately the same level. After 2030, the total water demand is predicted to grow at a decelerated rate until it reaches zero, with assumptions going so far as to predict that the total water demand in 2050 will be less than that in 2030. To ensure adequate supplies of water in the future, the following aspects are highly important: water resource dispatch, water recycling and reclaimed water reuse, rain and flood utilization, and seawater desalination.
Looking at countries in the Middle East (Saudi Arabia, the United Arab Emirates or Qatar), a similar development is seen. The majority of the countries doubled their water withdrawals over the past 15-20 years; this seems to be mainly caused
by increased population and connected growth of demand for goods satisfying intrinsic needs. Similar to China, India, and Japan, the share of domestic freshwater uses stayed almost at the same level and a continuing shift away from agricultural toward industrial uses can be seen.
The close relationship between growing population and the connected increases in water withdrawal, as well as the growing water demand as a country progresses, can be seen in many examples all over Asia.
To identify the water needs of the energy sector in Asia, water requirements for fuel production and electricity generation are adapted to the projections made in the WEC Scenarios Report, 2007, updated in 2009 (see Table 12).
As has been described for Sub-Saharan countries, due to a relative high share of traditional biomass in their energy mix, more than 10% of the total primary energy production in Asia is traditional biomass. Asian countries have a higher need of water for energy than any other region in the world. Although the population in Asian countries will increase by almost 50%, primary energy production will almost double, and electricity generation will more than triple, Asia in contrast to the African region will presumably decrease the overall amount of water used for energy over the next decades, mainly due to the fact that its absolute amount of traditional biomass produced will decrease from 23.2 EJ to 19.3 EJ.
Growth in energy consumption encompasses the enormous, on-going industrialization process, the
Water for Energy World Energy Council
27
still on-going relocation of industrial production to Asian countries, the expansion of the transportation infrastructure, and the advancing affluence of a currently small, but fast-growing middle class. Consequently, the demand for consumer goods, like refrigerators, television sets, etc. in this segment of the population will rise, inducing another increase in energy consumption. Besides that, demographic and socio-economic factors will play an important role. The decreasing average household size, especially the rising portion of
single-households in agglomeration areas, and an aging society are advancing in developing countries such as China and India. Changes in consumer habits will appear, influencing energy demand as well. Energy consumption in India, for instance, will almost double in the first half of the 21st century, with the country catching up process to its Asian competitor, China. The reason for this considerably slower development in India is the still-insufficient infrastructure. On the other hand, the growing portion of a comparatively wealthy
Table 11 Water withdrawal of various Asian countries and regions Source: Aquastat, 2010
Country (year) Population
(million)
Total water withdrawal(bill m3/yr)
Water withdrawal
(m3/person)
Domestic(in %)
Industrial(in %)
Agriculture (in %)
China (2000) 1,293.2 630.4 487.44 6.6 25.7 67.7
India (2000) 1,078.1 645.9 599.06 8.1 5.5 86.5
Middle East* (2000-2006) 191.5 214.3 1,119.09 8.0 5.9 86.1
Other Asia* (2000) 1,198.4 916.6 764.84 7.0 6.9 86.1
Asia 3,761.2 2,407.2 640.0 7.3 11.3 81.4
World 6,290.0 3,836.3 609.9 10.2 20.0 69.9
* Middle East: Syria, Iraq, Iran, Lebanon, Israel, Jordan, Saudi Arabia, Yemen, Oman, United Arab Emirates, Bahrain, Qatar, Kuwait. ** Other Asia incl. Australia, New Zealand etc.
Table 10 Water requirements for several energy processes in Asia based on WEC Scenarios, 2007 (model updated in 2009); DOE-NETL, 2008; UNESCO-IHE, 2008; Gleick, 1994
Primary production (EJ) 2005 2015 2035 2050
Total World 460.4 561.5 667.6 769.6
Total Asia 199.8 249.2 299.1 368.9
Percentage of Total 43% 44% 45% 48%
Electricity generation (TWh) 2005 2015 2035 2050
Total World 18,069 27,126 39,071 53,436
Total Asia 6,675 12,015 18,278 26,057
Percentage of Total 37% 44% 47% 49%
Water for energy (Bill. m³) 2005 2015 2035 2050
Total World 1,815.6 1,986.4 2,087.8 2,020.1
Total Asia 931.7 919.1 874.4 832.4
Percentage of Total 51% 51% 48% 46%
Primary Production 918.2 895.7 840.9 785.9
Electricity Generation 13.4 23.4 33.5 46.4
Water for Energy World Energy Council
28
class with Western consumer habits is clearly higher than in China, also having a significant impact on the energy demand.
Hydropower in Asia has a huge potential. The countries of Asia with the most rapidly developing economies have major programs of water resources and renewable energy development underway. International collaboration between many countries in the region is leading to rapid progress and represents a pathway to sustainable, integrated regional development.
Despite those efforts, only a minor share of hydropower potential has been developed in Asia. Many countries have a vast hydroelectric potential waiting to be developed, and there is an urgent need to accelerate the development of projects. Transforming this potential into reality while taking into account sustainability considerations should be a world priority for developmental and environmental reasons.
The great development potential of hydropower is available in some of the countries with the greatest need for increased installed capacity. Also, in some Asian countries, there is no economically feasible alternative source of power available on a realistic scale.
There are many bi-national or multi-national projects currently planned or in construction in the Asian region. The bi-national developments often associate a fast-growing economy with growing energy needs and a country that needs new sources of income to trigger its development. The major Nam Theun project, with Lao-Thai-French
cooperation, is a perfect example: most of the power produced by this 1,080 MW dam will go to Thailand.
There is also a proposal to create a “Hydropower Region” in terms of hydroelectricity production and use between Nepal and India. Nepal has developed only 1.5 % of its hydro potential. Projects like the Pancheshwar hydropower plant could help ease strain on India’s power network, reduce greenhouse-gas emissions, and bring about Nepal’s development through new income. This 6.480-MW project, the largest hydropower project in South Asia, is not meant for Nepal’s domestic consumption but for electricity export to India (NICOH, 2006).
Regarding the environmental and social impact of hydropower, a number of lessons have been learned from past experience. Governments, financing agencies, and industry have developed policies, frameworks, and guidelines to evaluate and mitigate environmental and social impacts, and to address the concerns of vulnerable communities affected by hydropower development.
Asian governments should recognize the need to plan hydropower developments in a river basin context against the background of the full range of alternatives for energy production. Planning should give due weight to environmental and social factors, as well as economic and financial factors. Asia has many internationally shared rivers, like the Mekong, shared between six countries, or the Amure, whose basin covers more than 2 million square kilometers. Accordingly, international

Water for Energy World Energy Council
29
cooperation in the development of the water resources of Asia is critical.
Multilateral and bilateral funding agencies should engage with Asian countries on hydropower development, promoting national and regional project development facilities and innovative funding mechanisms.
Conditions are now ripe for hydropower development in Asia and this is a period of unique opportunities:
International Institutions are encouraging the development of hydropower. The United Nations Symposium on Hydropower and Sustainable Development ended with a strongly worded October 2004 declaration in support of hydropower.
Production costs of hydropower generation are “cheap” and independent of fluctuations in fossil fuel prices, while prices of other energies are generally rising.
Hydropower generation is “clean” and thus forms part of the solution to the problem of climate change, a most important issue during the 21st century.
Hydropower potential in Asia is vast and underexploited.
3.3 Water for energy in Europe
In Europe, the majority of countries over the past 15–20 years has already progressed to a level of development where people can afford more energy
efficient technology and decrease water use. With decreasing population, more efficiency measures, technology improvements as well as a more intensive reuse and recycling of water, further declines are expected (see Table 13).
To identify water needs of the energy sector in Europe over the next 40 years, water requirements for fuel production and electricity generation are adapted to the projections made in WEC Scenarios, 2007, model updated in 2009 (see Table 14).
Although primary production will increase over the next 40 years and electricity generation is expected to almost double, the amount of water consumed to produce primary energy and generate electricity will decrease due to the shift away from coal and oil toward natural gas and nuclear energy. Further savings in energy and additional efficiency measures as demanded by the EU-27 and its 20-20-20 targets could lead to even more declining absolute numbers.
To ensure adequate water for energy, policies in the following areas are proposed by European WEC members:
Require that applications for new power plants include the assessment of the water availability and the plant efficiency;
Grant public or regulatory incentives for implementation of power plant technologies that are less water-intensive than usual systems;
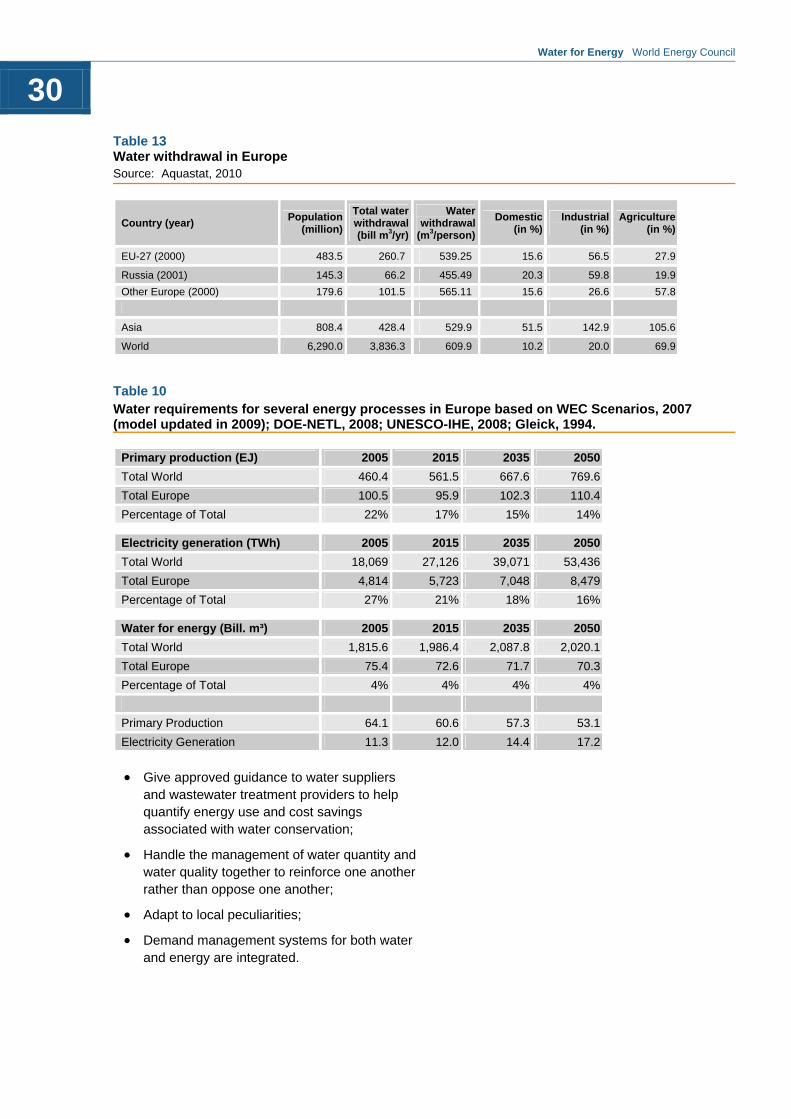
Water for Energy World Energy Council
30
Give approved guidance to water suppliers and wastewater treatment providers to help quantify energy use and cost savings associated with water conservation;
Handle the management of water quantity and water quality together to reinforce one another rather than oppose one another;
Adapt to local peculiarities;
Demand management systems for both water and energy are integrated.
Table 13 Water withdrawal in Europe Source: Aquastat, 2010
Country (year) Population
(million)
Total water withdrawal(bill m3/yr)
Water withdrawal
(m3/person)
Domestic(in %)
Industrial (in %)
Agriculture(in %)
EU-27 (2000) 483.5 260.7 539.25 15.6 56.5 27.9
Russia (2001) 145.3 66.2 455.49 20.3 59.8 19.9
Other Europe (2000) 179.6 101.5 565.11 15.6 26.6 57.8
Asia 808.4 428.4 529.9 51.5 142.9 105.6
World 6,290.0 3,836.3 609.9 10.2 20.0 69.9
Table 10 Water requirements for several energy processes in Europe based on WEC Scenarios, 2007 (model updated in 2009); DOE-NETL, 2008; UNESCO-IHE, 2008; Gleick, 1994.
Primary production (EJ) 2005 2015 2035 2050
Total World 460.4 561.5 667.6 769.6
Total Europe 100.5 95.9 102.3 110.4
Percentage of Total 22% 17% 15% 14%
Electricity generation (TWh) 2005 2015 2035 2050
Total World 18,069 27,126 39,071 53,436
Total Europe 4,814 5,723 7,048 8,479
Percentage of Total 27% 21% 18% 16%
Water for energy (Bill. m³) 2005 2015 2035 2050
Total World 1,815.6 1,986.4 2,087.8 2,020.1
Total Europe 75.4 72.6 71.7 70.3
Percentage of Total 4% 4% 4% 4%
Primary Production 64.1 60.6 57.3 53.1
Electricity Generation 11.3 12.0 14.4 17.2

Water for Energy World Energy Council
31
3.4 Water for energy in Latin America and the Caribbean
The population of Latin America and the Caribbean is likely to increase by at least 40% until 2050, leading to a growing demand for energy and water. Unlike other regions, Latin American countries are not expected to suffer from water stress or scarcity as their total internal renewable water resources seems sufficient to meet future demand (see Table 15).
To meet the growing energy demand, the overall primary production will have to increase, with a large amount likely to come from non-conventional oil and gas sources. With this, water used for
primary energy production will increase by approximately 50%. With the increasing population and socio-economic changes similar to the ones in Asia’s developing countries, the amount of electricity generated is expected to increase fivefold over the next 40 years, whereas the necessary amount of water needed to generate this amount of electricity is presumed to triple (see Table 16). Brazil, for example, is with 2,340 kWh per capita per year compared with 3,793 kWh in Poland, 4,925 kWh in Portugal, or 14,240 kWh in the US, at the moment consuming power at a level well below developed country levels (HDI, 2008).
Meeting the growing energy demand will be one of the biggest challenges for Latin American and
Table 15 Water withdrawal in Latin America and the Caribbean Source: Aquastat, 2010
Country (year) Population
(million)
Total water withdrawal(bill m3/yr)
Water withdrawal
(m3/person)
Domestic(in %)
Industrial(in %)
Agriculture (in %)
Brazil (2000) 179.1 59.3 331.06 20.3 18.0 61.8
Other LAC (2000) 252.4 188.0 509.81 19.9 9.7 70.4
LAC 431.5 188.0 435.6 20.0 12.3 67.7
World 6,290.0 3,836.3 609.9 10.2 20.0 69.9
Table 16 Water requirements for several energy processes in Latin America and the Caribbean based on WEC Scenarios, 2007 (model updated in 2009); DOE/NETL, 2008; UNESCO-IHE, 2008; Gleick, 1994.
Primary production (EJ) 2005 2015 2035 2050
Total World 460.4 561.5 667.6 769.6
Total LAC 25.4 49.5 62.0 59.7
Percentage of Total 6% 9% 9% 8%
Electricity generation (TWh) 2005 2015 2035 2050
Total World 18,069 27,126 39,071 53,436
Total LAC 909 2,014 3,705 5,312
Percentage of Total 5% 7% 9% 10%
Water for energy (Bill. m³) 2005 2015 2035 2050
Total World 1,815.6 1,986.4 2,087.8 2,020.1
Total LAC 70.5 109.9 144.7 150.7
Percentage of Total 4% 6% 8% 8%
Primary Production 66.8 103.6 135.0 137.3
Electricity Generation 3.7 6.3 9.7 13.5
Water for Energy World Energy Council
32
Caribbean countries. Not only will the demand increase, but also the number of people needing access to modern electricity. Many countries like Argentina or Brazil have policies in place that foster access to modern energy and encourage the use of renewable energy. Argentina, for example, has developed and implemented effective energy policies not only to increase and speed up access to modern energy, but also more generally to improve energy countrywide. The Renewable
Energies Project for Rural Markets (PERMER) consists of the development and installation of mini-hydroelectric power plants, wind turbines, diesel, or hybrid power plants operated through diesel/wind or diesel/solar or solar/wind systems in small communities (WEC, World Energy and Climate Policy: 2009 Assessment, 2009).
Brazil’s national electricity-saving program, PROCEL, is promoting energy production and consumer savings by avoiding the waste of energy, reducing costs and increasing investments in the energy sector, establishing energy savings aims, and planning the energy expansion of generation and transmission.
Hydropower in Latin America, presently roughly 70% of total electricity generated, is estimated to triple until 2050, but will then, due to a substantial shift toward thermal electricity generation in the meantime, account for roughly 30% of total electricity generated. But while in developed countries the hydropower potential has been almost exploited, LAC and especially Brazil still have huge potentials, with Brazil using only about 30% of its hydropower potential.
Uncertainties in biomass water consumption in particular and overall water needs for energy in the region can take different technological paths in the future, depending upon policies and agreements adopted to that end. As in other regions, present data on natural resources associated with energy are difficult to gather and are often not internally consistent. The problem of advising decision makers properly is thus harder. This issue is relevant in terms of better planning and education to pave the way for new, better technologies that make more efficient use of finite natural resources.
3.5 Water for energy in North America
Although North America has a continuously growing population, it has stabilized overall water demand over the past 15-20 years. Increasing public awareness and technology improvements have led to a declining per-capita water withdrawal and further reduction is expected in the years to come. The basic requirements and distribution of water withdrawal of North American countries are summarised in Table 17.
To identify the water needs of the energy sector in North America in the coming decades the earlier identified water requirements for fuel production and electricity generation are now adapted to the projections made in WEC Scenarios, 2007, model updated in 2009 (see Table 18).
The enormous potential of energy-efficiency improvements at all stages of energy production and use is widely recognized, but realizing this potential remains a global challenge. If the North
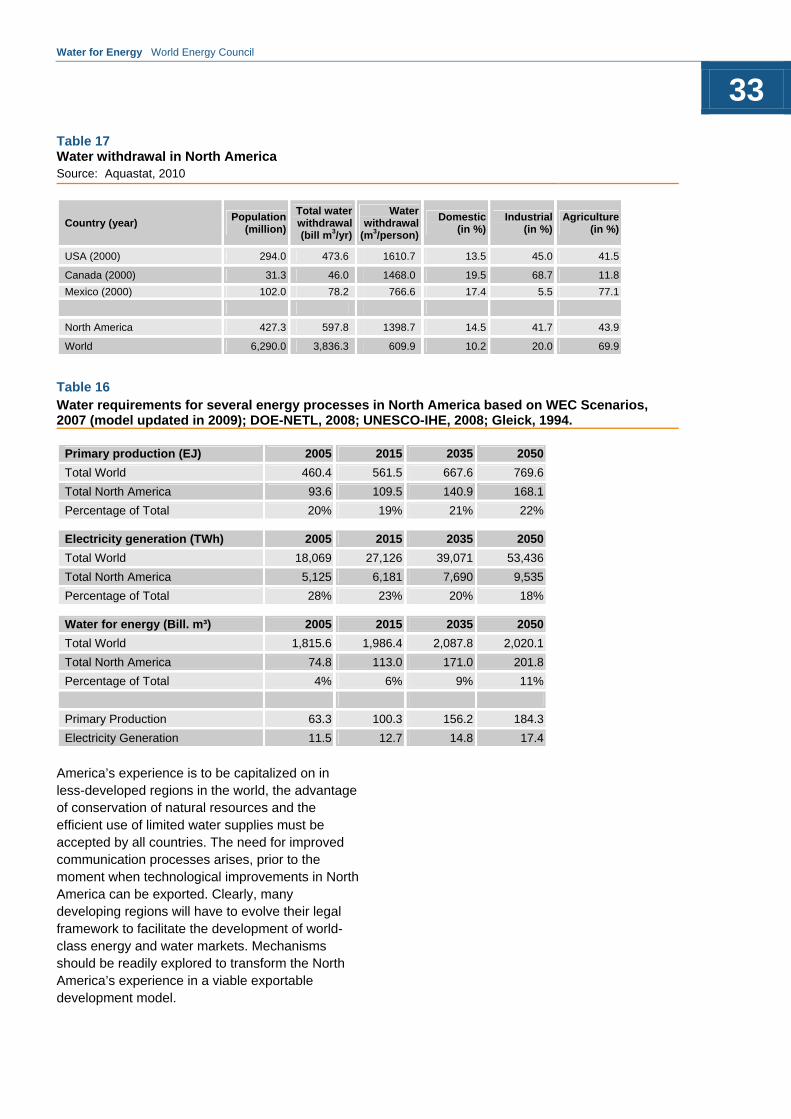
Water for Energy World Energy Council
33
America’s experience is to be capitalized on in less-developed regions in the world, the advantage of conservation of natural resources and the efficient use of limited water supplies must be accepted by all countries. The need for improved communication processes arises, prior to the moment when technological improvements in North America can be exported. Clearly, many developing regions will have to evolve their legal framework to facilitate the development of world-class energy and water markets. Mechanisms should be readily explored to transform the North America’s experience in a viable exportable development model.
Table 17 Water withdrawal in North America Source: Aquastat, 2010
Country (year) Population
(million)
Total water withdrawal(bill m3/yr)
Water withdrawal
(m3/person)
Domestic(in %)
Industrial(in %)
Agriculture (in %)
USA (2000) 294.0 473.6 1610.7 13.5 45.0 41.5
Canada (2000) 31.3 46.0 1468.0 19.5 68.7 11.8
Mexico (2000) 102.0 78.2 766.6 17.4 5.5 77.1
North America 427.3 597.8 1398.7 14.5 41.7 43.9
World 6,290.0 3,836.3 609.9 10.2 20.0 69.9
Table 16 Water requirements for several energy processes in North America based on WEC Scenarios, 2007 (model updated in 2009); DOE-NETL, 2008; UNESCO-IHE, 2008; Gleick, 1994.
Primary production (EJ) 2005 2015 2035 2050
Total World 460.4 561.5 667.6 769.6
Total North America 93.6 109.5 140.9 168.1
Percentage of Total 20% 19% 21% 22%
Electricity generation (TWh) 2005 2015 2035 2050
Total World 18,069 27,126 39,071 53,436
Total North America 5,125 6,181 7,690 9,535
Percentage of Total 28% 23% 20% 18%
Water for energy (Bill. m³) 2005 2015 2035 2050
Total World 1,815.6 1,986.4 2,087.8 2,020.1
Total North America 74.8 113.0 171.0 201.8
Percentage of Total 4% 6% 9% 11%
Primary Production 63.3 100.3 156.2 184.3
Electricity Generation 11.5 12.7 14.8 17.4
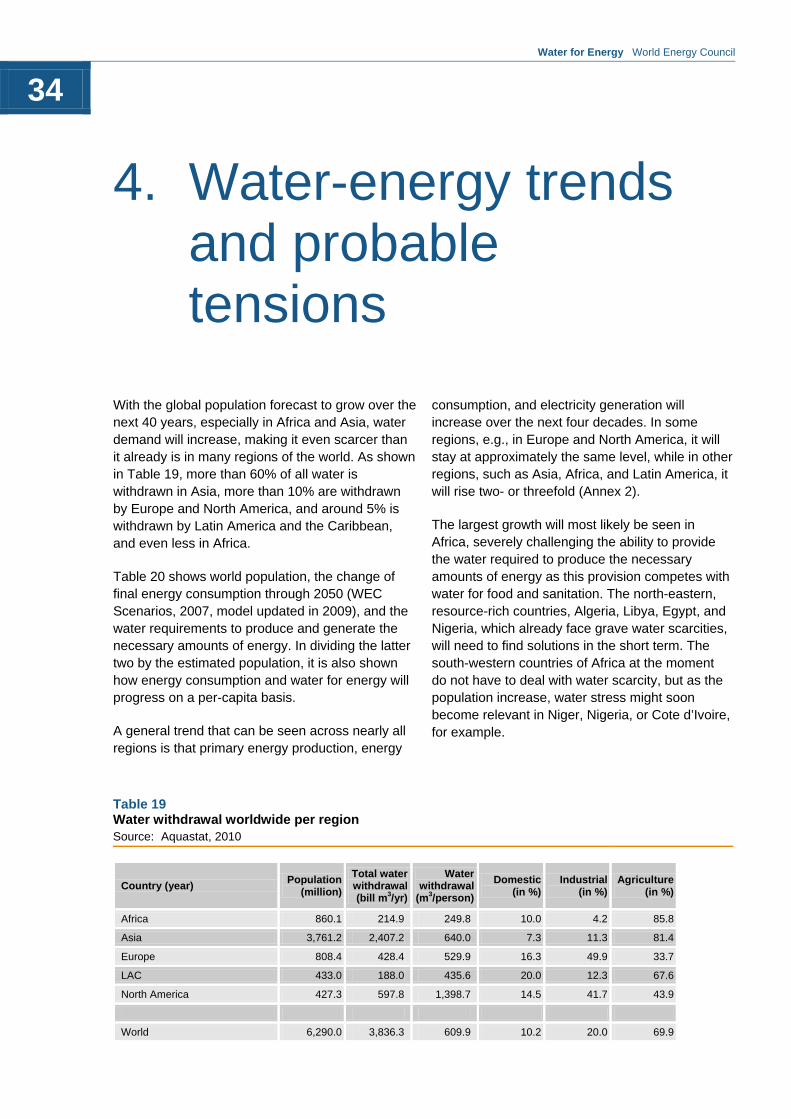
Water for Energy World Energy Council
34
Table 19 Water withdrawal worldwide per region Source: Aquastat, 2010
Country (year) Population
(million)
Total water withdrawal(bill m3/yr)
Water withdrawal
(m3/person)
Domestic(in %)
Industrial (in %)
Agriculture(in %)
Africa 860.1 214.9 249.8 10.0 4.2 85.8
Asia 3,761.2 2,407.2 640.0 7.3 11.3 81.4
Europe 808.4 428.4 529.9 16.3 49.9 33.7
LAC 433.0 188.0 435.6 20.0 12.3 67.6
North America 427.3 597.8 1,398.7 14.5 41.7 43.9
World 6,290.0 3,836.3 609.9 10.2 20.0 69.9
With the global population forecast to grow over the next 40 years, especially in Africa and Asia, water demand will increase, making it even scarcer than it already is in many regions of the world. As shown in Table 19, more than 60% of all water is withdrawn in Asia, more than 10% are withdrawn by Europe and North America, and around 5% is withdrawn by Latin America and the Caribbean, and even less in Africa.
Table 20 shows world population, the change of final energy consumption through 2050 (WEC Scenarios, 2007, model updated in 2009), and the water requirements to produce and generate the necessary amounts of energy. In dividing the latter two by the estimated population, it is also shown how energy consumption and water for energy will progress on a per-capita basis.
A general trend that can be seen across nearly all regions is that primary energy production, energy
consumption, and electricity generation will increase over the next four decades. In some regions, e.g., in Europe and North America, it will stay at approximately the same level, while in other regions, such as Asia, Africa, and Latin America, it will rise two- or threefold (Annex 2).
The largest growth will most likely be seen in Africa, severely challenging the ability to provide the water required to produce the necessary amounts of energy as this provision competes with water for food and sanitation. The north-eastern, resource-rich countries, Algeria, Libya, Egypt, and Nigeria, which already face grave water scarcities, will need to find solutions in the short term. The south-western countries of Africa at the moment do not have to deal with water scarcity, but as the population increase, water stress might soon become relevant in Niger, Nigeria, or Cote d’Ivoire, for example.
4. Water-energy trends and probable tensions
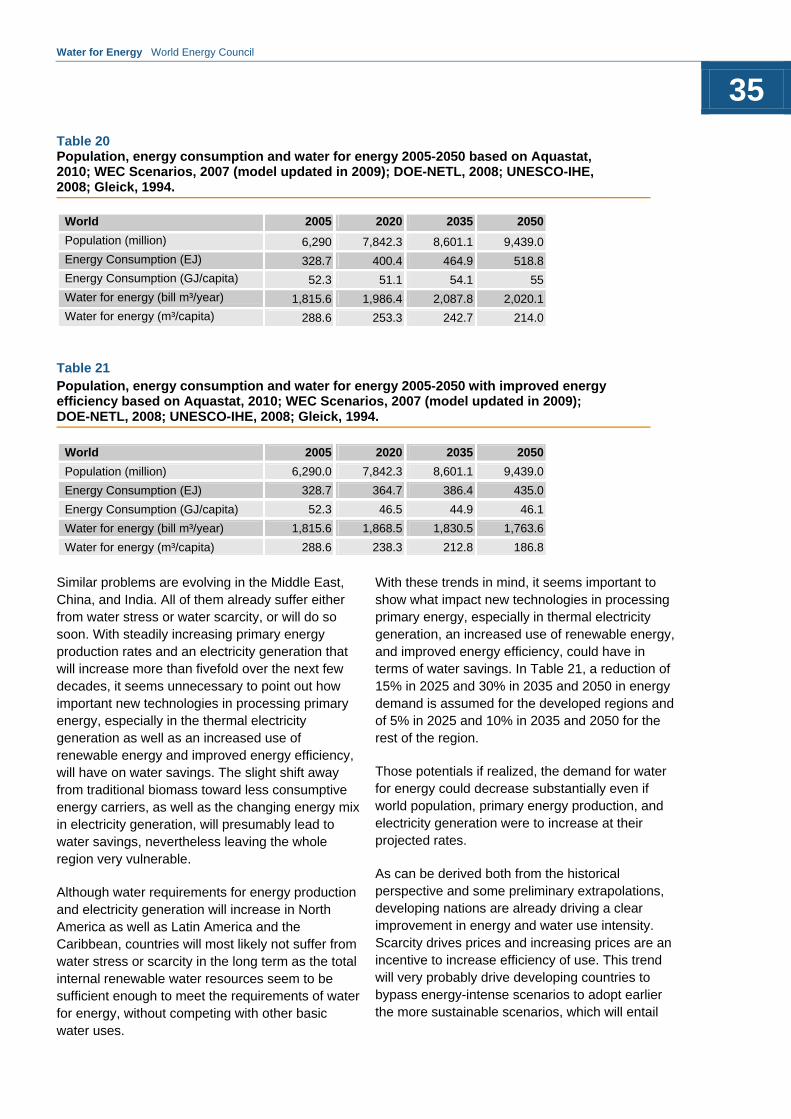
Water for Energy World Energy Council
35
Similar problems are evolving in the Middle East, China, and India. All of them already suffer either from water stress or water scarcity, or will do so soon. With steadily increasing primary energy production rates and an electricity generation that will increase more than fivefold over the next few decades, it seems unnecessary to point out how important new technologies in processing primary energy, especially in the thermal electricity generation as well as an increased use of renewable energy and improved energy efficiency, will have on water savings. The slight shift away from traditional biomass toward less consumptive energy carriers, as well as the changing energy mix in electricity generation, will presumably lead to water savings, nevertheless leaving the whole region very vulnerable.
Although water requirements for energy production and electricity generation will increase in North America as well as Latin America and the Caribbean, countries will most likely not suffer from water stress or scarcity in the long term as the total internal renewable water resources seem to be sufficient enough to meet the requirements of water for energy, without competing with other basic water uses.
With these trends in mind, it seems important to show what impact new technologies in processing primary energy, especially in thermal electricity generation, an increased use of renewable energy, and improved energy efficiency, could have in terms of water savings. In Table 21, a reduction of 15% in 2025 and 30% in 2035 and 2050 in energy demand is assumed for the developed regions and of 5% in 2025 and 10% in 2035 and 2050 for the rest of the region.
Those potentials if realized, the demand for water for energy could decrease substantially even if world population, primary energy production, and electricity generation were to increase at their projected rates.
As can be derived both from the historical perspective and some preliminary extrapolations, developing nations are already driving a clear improvement in energy and water use intensity. Scarcity drives prices and increasing prices are an incentive to increase efficiency of use. This trend will very probably drive developing countries to bypass energy-intense scenarios to adopt earlier the more sustainable scenarios, which will entail
Table 20 Population, energy consumption and water for energy 2005-2050 based on Aquastat, 2010; WEC Scenarios, 2007 (model updated in 2009); DOE-NETL, 2008; UNESCO-IHE, 2008; Gleick, 1994.
World 2005 2020 2035 2050
Population (million) 6,290 7,842.3 8,601.1 9,439.0
Energy Consumption (EJ) 328.7 400.4 464.9 518.8
Energy Consumption (GJ/capita) 52.3 51.1 54.1 55
Water for energy (bill m³/year) 1,815.6 1,986.4 2,087.8 2,020.1
Water for energy (m³/capita) 288.6 253.3 242.7 214.0
Table 21 Population, energy consumption and water for energy 2005-2050 with improved energy efficiency based on Aquastat, 2010; WEC Scenarios, 2007 (model updated in 2009); DOE-NETL, 2008; UNESCO-IHE, 2008; Gleick, 1994.
World 2005 2020 2035 2050
Population (million) 6,290.0 7,842.3 8,601.1 9,439.0
Energy Consumption (EJ) 328.7 364.7 386.4 435.0
Energy Consumption (GJ/capita) 52.3 46.5 44.9 46.1
Water for energy (bill m³/year) 1,815.6 1,868.5 1,830.5 1,763.6
Water for energy (m³/capita) 288.6 238.3 212.8 186.8
Water for Energy World Energy Council
36
better business possibilities and more opportunities for financing.
Increased competition for water is generating new ways of looking at natural resources in a more integrated fashion than ever before. Several analysts addressed the simultaneous management of energy and water by developing a new systematic methodology for targeting and design that minimize the requirements of energy and water at the same time (Chemical Engineering Science, 2005).
Water for Energy World Energy Council
37
1. In this study, while indications from examining future water needs related to energy production and conversion are that energy requirements are not beyond the available supply, other uses—in particular agriculture—are stressing the supply of usable water now, and this stress will increase as increasing populations require more and more food. It is therefore important that governments, in setting policies to make water available for food, ensure that water is also available for energy production and conversion. Without energy to supply the amounts of water needed for all uses, it is important to remember that there can be no production of food or the economies of modern food processing.
2. As energy resources are stretched, more and more unconventional sources become attractive, and many of these (e.g., oil sands, oil shale, and deep gas shale) require large amounts of water, further stressing current and projected systems. Policymakers must consider available water supplies and the needs of these technologies and their impact on other uses when setting policies for energy production. More importantly, industry leaders can include these aspects when discussing projects with policymakers and with the public.
3. The increasingly integrated world of shared resources and trade requires a new paradigm of operation. This applies doubly to water and especially water for energy production and conversion. Gone are the days of each country or region looking out only for itself. Operations are now interregional and international. While industry has been relatively quick to seize opportunities, governments have not always kept pace. These
challenges require unprecedented levels of cooperation, between governments (regional and national), between businesses, as well as between governments and businesses.
4. Many existing and new technologies show promise for making water more available and its use more efficient (e.g., recirculating as opposed to once-through systems, dry cooling, desalination, using rather than wasting water from oil extraction). However, to accelerate the entry of these technologies and their benefits into common usage, policymakers in both business and governments must carefully examine policy measures and conditions that will achieve this. Policies that encourage field trials can increase investor and public confidence and have the long-term benefit of reducing overall costs and implementation times.
5. RD&D (Research, Development and Demonstration) efforts for water in general are in great need of being increased and will require cooperation on regional and international scales. The energy industry, governments, and independent institutions must engage closely to maximize effort and reduce redundancy.
6. Asia, with its large geographical area and population, presents perhaps the largest challenge for water supply in general and therefore for water in energy. At the same time, the potential of hydropower in Asia is vast and relatively unexploited. The United Nations supports hydropower development and governments in the region and the energy industry should actively encourage and support these efforts.
5. Conclusions and recommendations
Water for Energy World Energy Council
38
Chenoweth, J., 2008, Minimum water requirement for social and economic development, Desalination, 229 (1-3), pp245-256
CIA Factbook, https://www.cia.gov/library/publications/the-world-factbook/fields/2202.html
Energy Information Administration (EIA), 2009, International Energy Statistics, http://tonto.eia.doe.gov/cfapps/ipdbproject/IEDIndex3.cfm?tid=2&pid=2&aid=12
Gerbens-Leenes, Hoekstra, van der Meer, 2008, Water footprint of bio-energy and other primary energy carriers, http://www.waterfootprint.org/Reports/Gerbens-Hoekstra-VanderMeer-2008-waterfootprint-bioenergy.pdf
Peter H. Gleick, 1994, Annual Review of Energy and Environment, “Water and Energy”, Volume 19
International Energy Agency (IEA), 2009, Key World Energy Statistics 2009http://www.iea.org/textbase/nppdf/free/2009/key_stats_2009.pdf
IMF, 2007, http://www.imf.org/external/ns/cs.aspx?id=28
Intergovernmental Panel on Climate Change (IPCC), 2007a WG I, Climate Change 2007: The Physical Science Basis, Summary for Policy Makers
IPCC, 2007b, Fourth Assessment Report, Working Group II Report, Impacts, Adaptation and Vulnerability, Chapter 3
Independent Power Producers’ Association Nepal Confederation of Indian Industry, 2006, Nepal India Cooperation on Hydropower (NICOH), http://cii.in/WebCMS/Upload/CII%20-%20Nepal%20India%20Cooperation%20on%20Hydropower.pdf
International Commission on Large Dams (ICOLD), 2009, World Register of Dams Luciana Savulescu, Jin-Kuk Kim, and Robin Smith, Studies on simultaneous energy and water minimization—Part I: Systems with no water re-use, Chemical Engineering Science, Volume 60, Issue 12, June 2005, pp. 3279–3290.
OECD/IEA, 2007, Energy Balances of non-OECD Countries
Population Information Program, Center for Communication Programs, 1998, Population Reports, Volume XXVI, Number 1
Wolfgang Sachs / Tilman Santarius, Wuppertal Institute for Climate, Environment and Energy, 2007, Fair Future: Resource Conflicts, Security and Global Justice
UNESCO, 2003, Water for People, Water for Life - United Nations World Water Development Report (WWDR)
UNFPA (the United Nations Population Fund), 2001, State of World Population, http://www.unfpa.org/public/publications/pid/2582
References

Water for Energy World Energy Council
39
United Nations (UN), 2008, Human Development Report
UN, 2009, Human Development Report
US Department of Energy (DOE), 2006, Energy demands on water resources
US Department of Energy (DOE) – National Energy Technology Laboratory (NETL), 2004, Estimating freshwater needs to meet 2025 electricity generating capacity forecasts
DOE-NETL, 2008, Water requirements for existing and emerging thermoelectric plan technologies
World Business Council for Sustainable Development (WBCSD), 2009, Water Energy and Climate Change
World Business Council for Sustainable Development (WBCSD), 2005, Water Version 2, Facts and Trends
World Energy Council (WEC), Carbon Capture and Storage: a WEC ‘Interim Balance’, 2007, p 5
WEC, Energy Policy Scenarios to 2050, 2007
WEC, 2007, Energy Policy Scenarios to 2050, 2007, model updated March 2009, www.worldenergy.org/documents/scenarios_update_2009.zip
WEC, 2007, Survey of Energy Resources
WEC, 2009, Survey of Energy Resources, Interim Report
WEC, 2009, World Energy and Climate Policy: 2009 Assessment
WEC, 2010, Survey of Energy Resources
WEC, 2010, Survey of Energy Resources: Focus on Shale Gas
World Commission on Dams, 2000, Dams and development - A new framework for decision-making
Water for Energy World Energy Council
40
Vulnerabilities Study Chair
Thulani Gcabashe (South Africa)
Study Chair:
José Luis Fernández Zayas (Mexico)
Members:
Edwin Mongan (Australia) Jinghe Liu (China) Bertrand Castanet (France) Laurent Bellet (France) Charles Addo (Ghana) R.K. Rustagi – alternate (India) C.V.J. Varma (India) A. Bankapur (India) Gerardo Hiriar (Mexico) Issa Soumana (Niger) Guillermo Romero Sáenz (Peru) Traian Oprea (Romania) Edgard Gnansounou (Switzerland) Atilla Ataç (Turkey) Hatem Shoukry (UAE) Cameron Ironside (UK) Kristin Schumann (UK)
Special Advisor:
Angela Wilkinson (UK)
World Energy Council:
Robert Schock, Director of Studies Sandra Biesel, Project Manager
Study Group Membership

Water for Energy World Energy Council
41
Annex 1
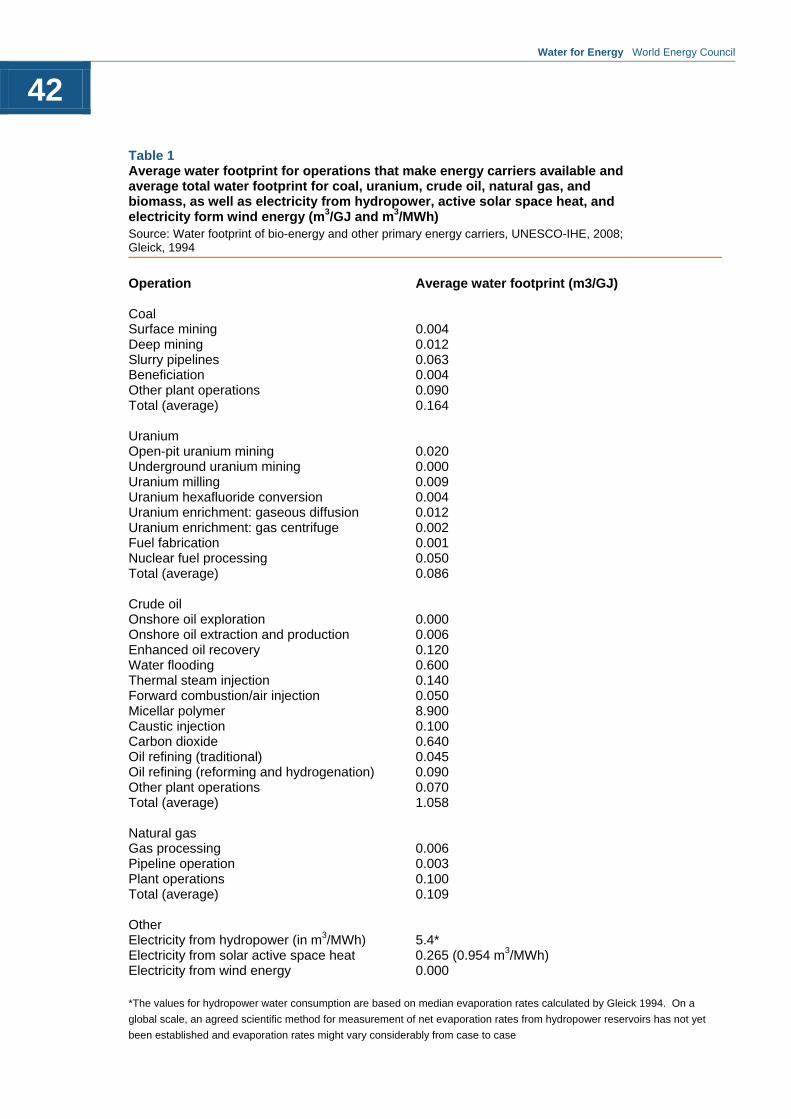
Water for Energy World Energy Council
42
Table 1 Average water footprint for operations that make energy carriers available and average total water footprint for coal, uranium, crude oil, natural gas, and biomass, as well as electricity from hydropower, active solar space heat, and electricity form wind energy (m3/GJ and m3/MWh) Source: Water footprint of bio-energy and other primary energy carriers, UNESCO-IHE, 2008; Gleick, 1994
Operation Average water footprint (m3/GJ) Coal Surface mining 0.004 Deep mining 0.012 Slurry pipelines 0.063 Beneficiation 0.004 Other plant operations 0.090 Total (average) 0.164 Uranium Open-pit uranium mining 0.020 Underground uranium mining 0.000 Uranium milling 0.009 Uranium hexafluoride conversion 0.004 Uranium enrichment: gaseous diffusion 0.012 Uranium enrichment: gas centrifuge 0.002 Fuel fabrication 0.001 Nuclear fuel processing 0.050 Total (average) 0.086 Crude oil Onshore oil exploration 0.000 Onshore oil extraction and production 0.006 Enhanced oil recovery 0.120 Water flooding 0.600 Thermal steam injection 0.140 Forward combustion/air injection 0.050 Micellar polymer 8.900 Caustic injection 0.100 Carbon dioxide 0.640 Oil refining (traditional) 0.045 Oil refining (reforming and hydrogenation) 0.090 Other plant operations 0.070 Total (average) 1.058 Natural gas Gas processing 0.006 Pipeline operation 0.003 Plant operations 0.100 Total (average) 0.109 Other Electricity from hydropower (in m3/MWh) 5.4* Electricity from solar active space heat 0.265 (0.954 m3/MWh) Electricity from wind energy 0.000 *The values for hydropower water consumption are based on median evaporation rates calculated by Gleick 1994. On a
global scale, an agreed scientific method for measurement of net evaporation rates from hydropower reservoirs has not yet
been established and evaporation rates might vary considerably from case to case

Water for Energy World Energy Council
43
Annex 2
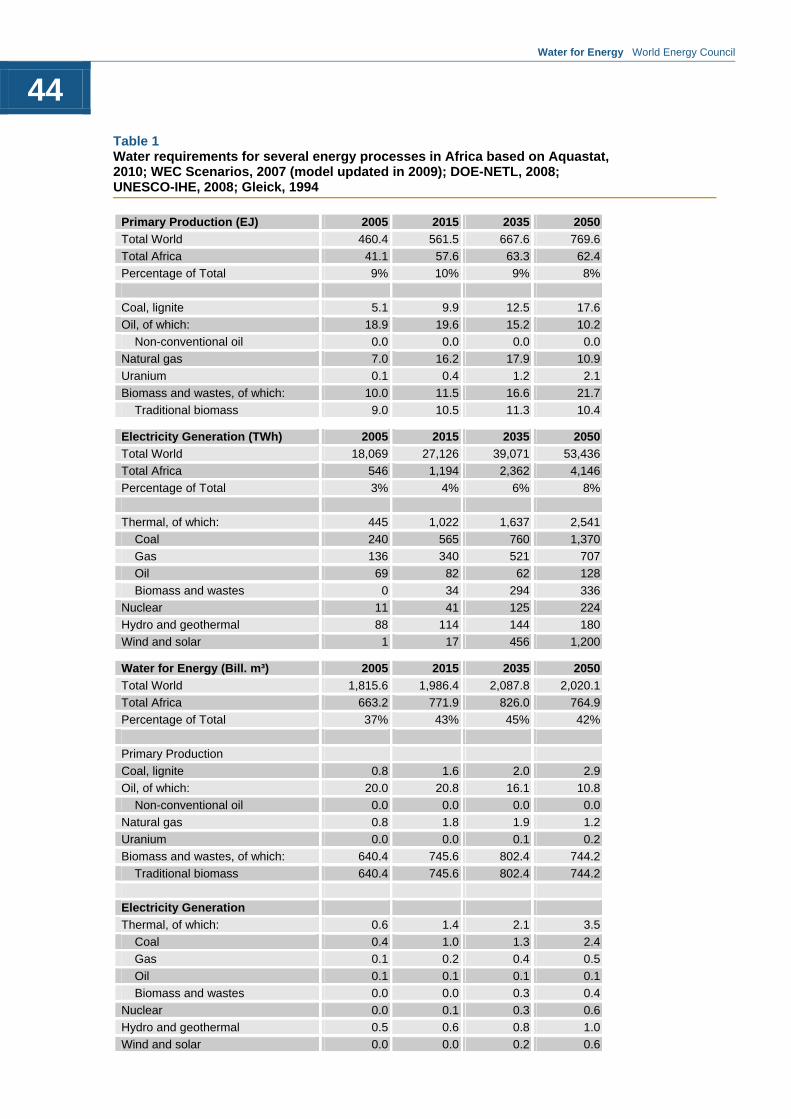
Water for Energy World Energy Council
44
Table 1 Water requirements for several energy processes in Africa based on Aquastat, 2010; WEC Scenarios, 2007 (model updated in 2009); DOE-NETL, 2008; UNESCO-IHE, 2008; Gleick, 1994
Primary Production (EJ) 2005 2015 2035 2050
Total World 460.4 561.5 667.6 769.6
Total Africa 41.1 57.6 63.3 62.4
Percentage of Total 9% 10% 9% 8%
Coal, lignite 5.1 9.9 12.5 17.6
Oil, of which: 18.9 19.6 15.2 10.2
Non-conventional oil 0.0 0.0 0.0 0.0
Natural gas 7.0 16.2 17.9 10.9
Uranium 0.1 0.4 1.2 2.1
Biomass and wastes, of which: 10.0 11.5 16.6 21.7
Traditional biomass 9.0 10.5 11.3 10.4
Electricity Generation (TWh) 2005 2015 2035 2050
Total World 18,069 27,126 39,071 53,436
Total Africa 546 1,194 2,362 4,146
Percentage of Total 3% 4% 6% 8%
Thermal, of which: 445 1,022 1,637 2,541
Coal 240 565 760 1,370
Gas 136 340 521 707
Oil 69 82 62 128
Biomass and wastes 0 34 294 336
Nuclear 11 41 125 224
Hydro and geothermal 88 114 144 180
Wind and solar 1 17 456 1,200
Water for Energy (Bill. m³) 2005 2015 2035 2050
Total World 1,815.6 1,986.4 2,087.8 2,020.1
Total Africa 663.2 771.9 826.0 764.9
Percentage of Total 37% 43% 45% 42%
Primary Production
Coal, lignite 0.8 1.6 2.0 2.9
Oil, of which: 20.0 20.8 16.1 10.8
Non-conventional oil 0.0 0.0 0.0 0.0
Natural gas 0.8 1.8 1.9 1.2
Uranium 0.0 0.0 0.1 0.2
Biomass and wastes, of which: 640.4 745.6 802.4 744.2
Traditional biomass 640.4 745.6 802.4 744.2
Electricity Generation
Thermal, of which: 0.6 1.4 2.1 3.5
Coal 0.4 1.0 1.3 2.4
Gas 0.1 0.2 0.4 0.5
Oil 0.1 0.1 0.1 0.1
Biomass and wastes 0.0 0.0 0.3 0.4
Nuclear 0.0 0.1 0.3 0.6
Hydro and geothermal 0.5 0.6 0.8 1.0
Wind and solar 0.0 0.0 0.2 0.6
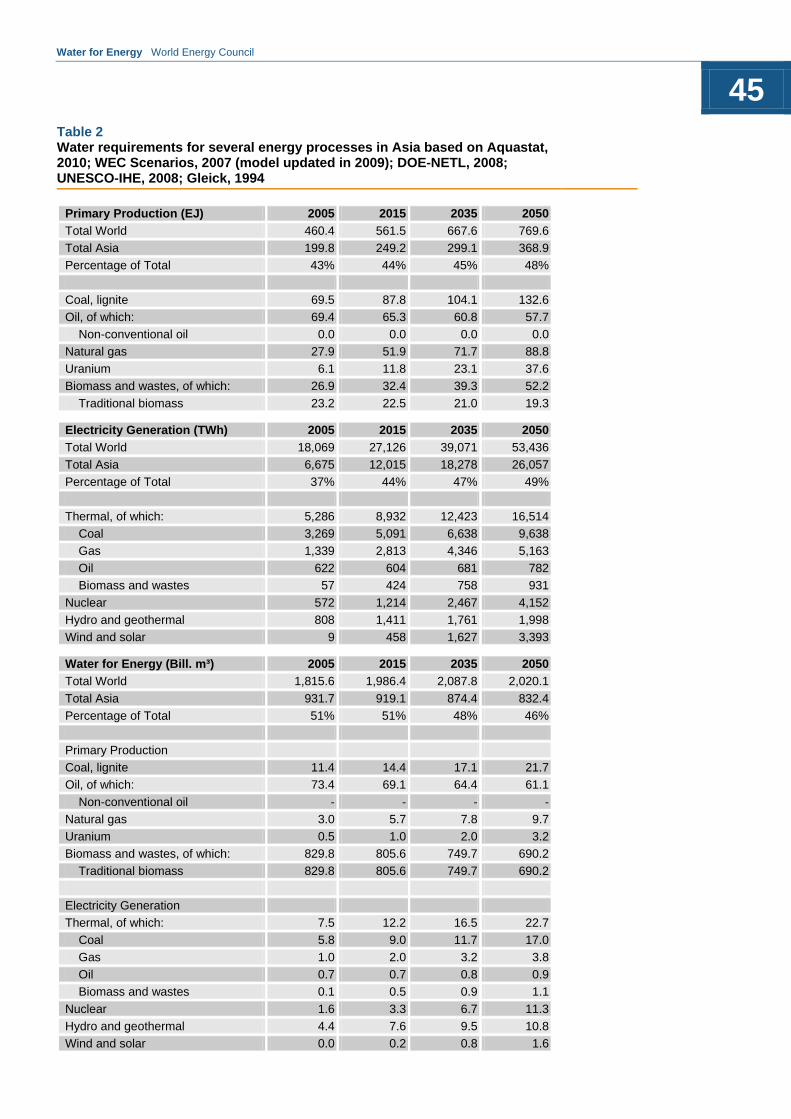
Water for Energy World Energy Council
45
Table 2 Water requirements for several energy processes in Asia based on Aquastat, 2010; WEC Scenarios, 2007 (model updated in 2009); DOE-NETL, 2008; UNESCO-IHE, 2008; Gleick, 1994
Primary Production (EJ) 2005 2015 2035 2050
Total World 460.4 561.5 667.6 769.6
Total Asia 199.8 249.2 299.1 368.9
Percentage of Total 43% 44% 45% 48%
Coal, lignite 69.5 87.8 104.1 132.6
Oil, of which: 69.4 65.3 60.8 57.7
Non-conventional oil 0.0 0.0 0.0 0.0
Natural gas 27.9 51.9 71.7 88.8
Uranium 6.1 11.8 23.1 37.6
Biomass and wastes, of which: 26.9 32.4 39.3 52.2
Traditional biomass 23.2 22.5 21.0 19.3
Electricity Generation (TWh) 2005 2015 2035 2050
Total World 18,069 27,126 39,071 53,436
Total Asia 6,675 12,015 18,278 26,057
Percentage of Total 37% 44% 47% 49%
Thermal, of which: 5,286 8,932 12,423 16,514
Coal 3,269 5,091 6,638 9,638
Gas 1,339 2,813 4,346 5,163
Oil 622 604 681 782
Biomass and wastes 57 424 758 931
Nuclear 572 1,214 2,467 4,152
Hydro and geothermal 808 1,411 1,761 1,998
Wind and solar 9 458 1,627 3,393
Water for Energy (Bill. m³) 2005 2015 2035 2050
Total World 1,815.6 1,986.4 2,087.8 2,020.1
Total Asia 931.7 919.1 874.4 832.4
Percentage of Total 51% 51% 48% 46%
Primary Production
Coal, lignite 11.4 14.4 17.1 21.7
Oil, of which: 73.4 69.1 64.4 61.1
Non-conventional oil - - - -
Natural gas 3.0 5.7 7.8 9.7
Uranium 0.5 1.0 2.0 3.2
Biomass and wastes, of which: 829.8 805.6 749.7 690.2
Traditional biomass 829.8 805.6 749.7 690.2
Electricity Generation
Thermal, of which: 7.5 12.2 16.5 22.7
Coal 5.8 9.0 11.7 17.0
Gas 1.0 2.0 3.2 3.8
Oil 0.7 0.7 0.8 0.9
Biomass and wastes 0.1 0.5 0.9 1.1
Nuclear 1.6 3.3 6.7 11.3
Hydro and geothermal 4.4 7.6 9.5 10.8
Wind and solar 0.0 0.2 0.8 1.6
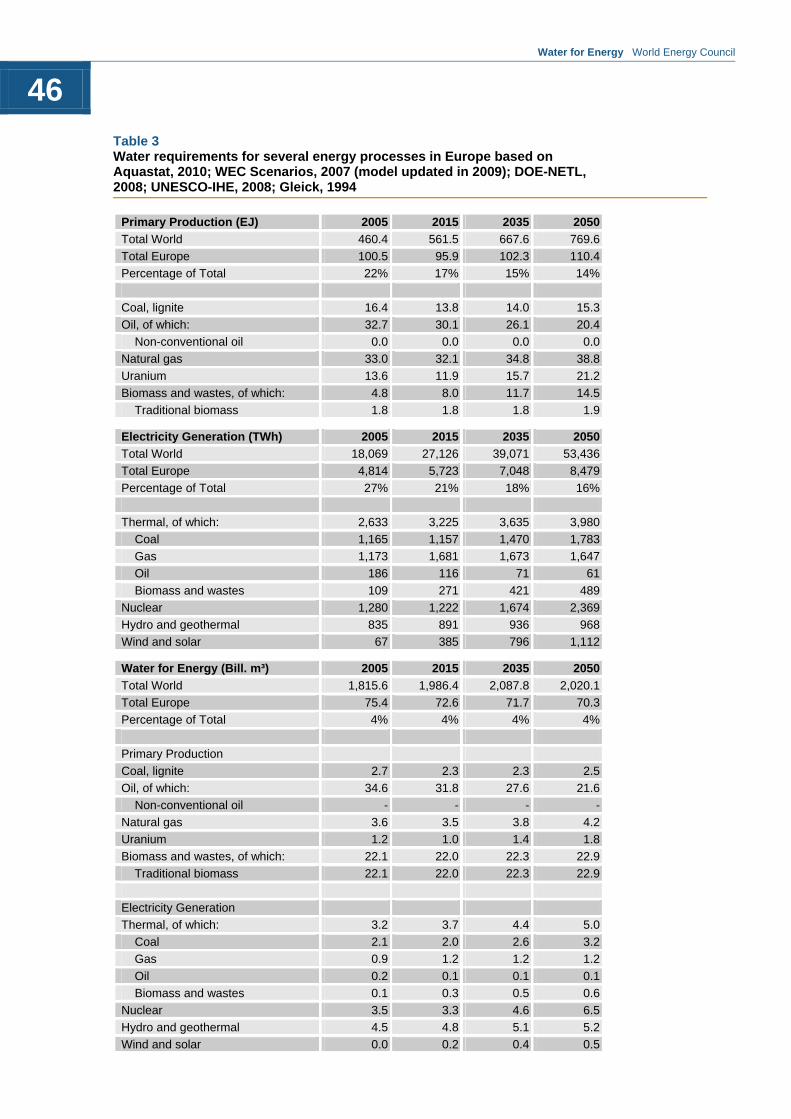
Water for Energy World Energy Council
46
Table 3 Water requirements for several energy processes in Europe based on Aquastat, 2010; WEC Scenarios, 2007 (model updated in 2009); DOE-NETL, 2008; UNESCO-IHE, 2008; Gleick, 1994
Primary Production (EJ) 2005 2015 2035 2050
Total World 460.4 561.5 667.6 769.6
Total Europe 100.5 95.9 102.3 110.4
Percentage of Total 22% 17% 15% 14%
Coal, lignite 16.4 13.8 14.0 15.3
Oil, of which: 32.7 30.1 26.1 20.4
Non-conventional oil 0.0 0.0 0.0 0.0
Natural gas 33.0 32.1 34.8 38.8
Uranium 13.6 11.9 15.7 21.2
Biomass and wastes, of which: 4.8 8.0 11.7 14.5
Traditional biomass 1.8 1.8 1.8 1.9
Electricity Generation (TWh) 2005 2015 2035 2050
Total World 18,069 27,126 39,071 53,436
Total Europe 4,814 5,723 7,048 8,479
Percentage of Total 27% 21% 18% 16%
Thermal, of which: 2,633 3,225 3,635 3,980
Coal 1,165 1,157 1,470 1,783
Gas 1,173 1,681 1,673 1,647
Oil 186 116 71 61
Biomass and wastes 109 271 421 489
Nuclear 1,280 1,222 1,674 2,369
Hydro and geothermal 835 891 936 968
Wind and solar 67 385 796 1,112
Water for Energy (Bill. m³) 2005 2015 2035 2050
Total World 1,815.6 1,986.4 2,087.8 2,020.1
Total Europe 75.4 72.6 71.7 70.3
Percentage of Total 4% 4% 4% 4%
Primary Production
Coal, lignite 2.7 2.3 2.3 2.5
Oil, of which: 34.6 31.8 27.6 21.6
Non-conventional oil - - - -
Natural gas 3.6 3.5 3.8 4.2
Uranium 1.2 1.0 1.4 1.8
Biomass and wastes, of which: 22.1 22.0 22.3 22.9
Traditional biomass 22.1 22.0 22.3 22.9
Electricity Generation
Thermal, of which: 3.2 3.7 4.4 5.0
Coal 2.1 2.0 2.6 3.2
Gas 0.9 1.2 1.2 1.2
Oil 0.2 0.1 0.1 0.1
Biomass and wastes 0.1 0.3 0.5 0.6
Nuclear 3.5 3.3 4.6 6.5
Hydro and geothermal 4.5 4.8 5.1 5.2
Wind and solar 0.0 0.2 0.4 0.5
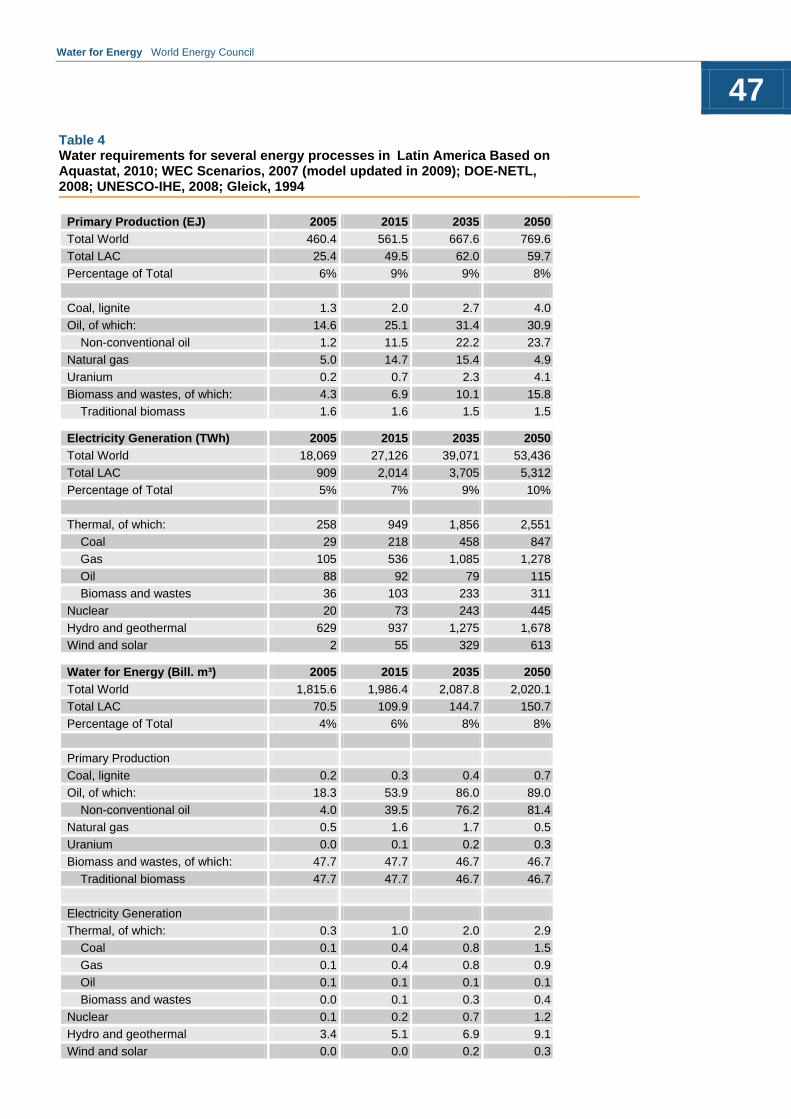
Water for Energy World Energy Council
47
Table 4 Water requirements for several energy processes in Latin America Based on Aquastat, 2010; WEC Scenarios, 2007 (model updated in 2009); DOE-NETL, 2008; UNESCO-IHE, 2008; Gleick, 1994
Primary Production (EJ) 2005 2015 2035 2050
Total World 460.4 561.5 667.6 769.6
Total LAC 25.4 49.5 62.0 59.7
Percentage of Total 6% 9% 9% 8%
Coal, lignite 1.3 2.0 2.7 4.0
Oil, of which: 14.6 25.1 31.4 30.9
Non-conventional oil 1.2 11.5 22.2 23.7
Natural gas 5.0 14.7 15.4 4.9
Uranium 0.2 0.7 2.3 4.1
Biomass and wastes, of which: 4.3 6.9 10.1 15.8
Traditional biomass 1.6 1.6 1.5 1.5
Electricity Generation (TWh) 2005 2015 2035 2050
Total World 18,069 27,126 39,071 53,436
Total LAC 909 2,014 3,705 5,312
Percentage of Total 5% 7% 9% 10%
Thermal, of which: 258 949 1,856 2,551
Coal 29 218 458 847
Gas 105 536 1,085 1,278
Oil 88 92 79 115
Biomass and wastes 36 103 233 311
Nuclear 20 73 243 445
Hydro and geothermal 629 937 1,275 1,678
Wind and solar 2 55 329 613
Water for Energy (Bill. m³) 2005 2015 2035 2050
Total World 1,815.6 1,986.4 2,087.8 2,020.1
Total LAC 70.5 109.9 144.7 150.7
Percentage of Total 4% 6% 8% 8%
Primary Production
Coal, lignite 0.2 0.3 0.4 0.7
Oil, of which: 18.3 53.9 86.0 89.0
Non-conventional oil 4.0 39.5 76.2 81.4
Natural gas 0.5 1.6 1.7 0.5
Uranium 0.0 0.1 0.2 0.3
Biomass and wastes, of which: 47.7 47.7 46.7 46.7
Traditional biomass 47.7 47.7 46.7 46.7
Electricity Generation
Thermal, of which: 0.3 1.0 2.0 2.9
Coal 0.1 0.4 0.8 1.5
Gas 0.1 0.4 0.8 0.9
Oil 0.1 0.1 0.1 0.1
Biomass and wastes 0.0 0.1 0.3 0.4
Nuclear 0.1 0.2 0.7 1.2
Hydro and geothermal 3.4 5.1 6.9 9.1
Wind and solar 0.0 0.0 0.2 0.3
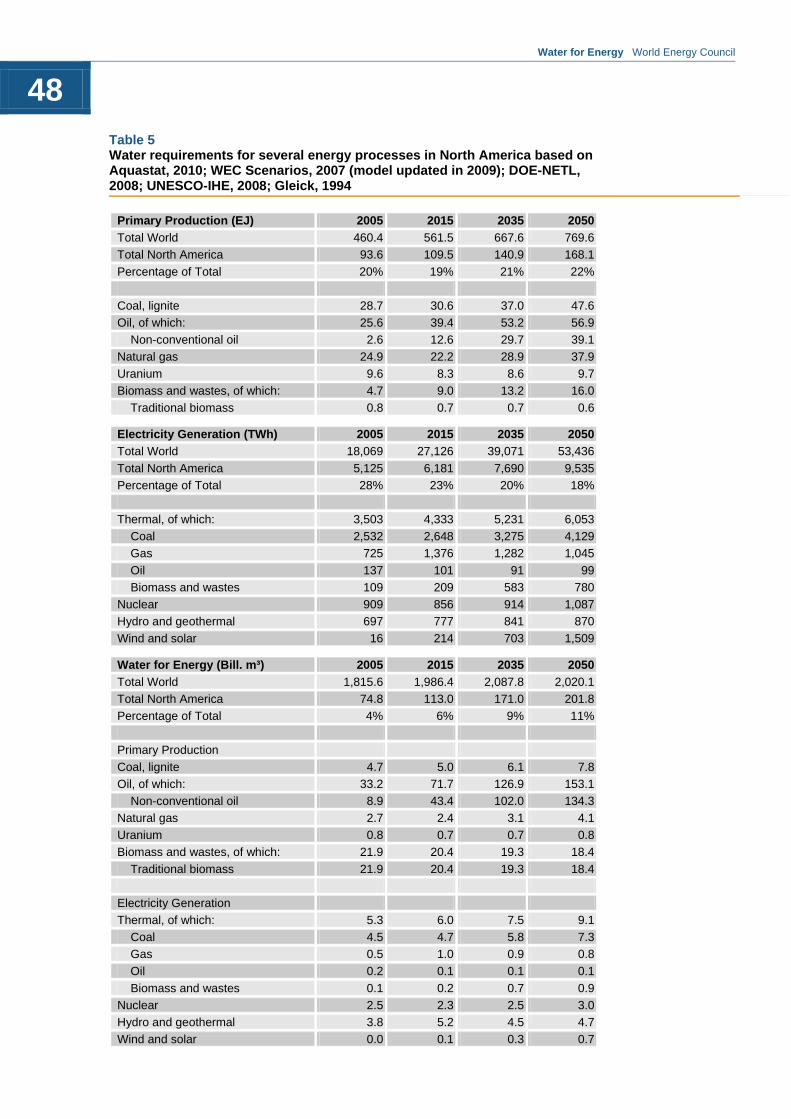
Water for Energy World Energy Council
48
Table 5 Water requirements for several energy processes in North America based on Aquastat, 2010; WEC Scenarios, 2007 (model updated in 2009); DOE-NETL, 2008; UNESCO-IHE, 2008; Gleick, 1994
Primary Production (EJ) 2005 2015 2035 2050
Total World 460.4 561.5 667.6 769.6
Total North America 93.6 109.5 140.9 168.1
Percentage of Total 20% 19% 21% 22%
Coal, lignite 28.7 30.6 37.0 47.6
Oil, of which: 25.6 39.4 53.2 56.9
Non-conventional oil 2.6 12.6 29.7 39.1
Natural gas 24.9 22.2 28.9 37.9
Uranium 9.6 8.3 8.6 9.7
Biomass and wastes, of which: 4.7 9.0 13.2 16.0
Traditional biomass 0.8 0.7 0.7 0.6
Electricity Generation (TWh) 2005 2015 2035 2050
Total World 18,069 27,126 39,071 53,436
Total North America 5,125 6,181 7,690 9,535
Percentage of Total 28% 23% 20% 18%
Thermal, of which: 3,503 4,333 5,231 6,053
Coal 2,532 2,648 3,275 4,129
Gas 725 1,376 1,282 1,045
Oil 137 101 91 99
Biomass and wastes 109 209 583 780
Nuclear 909 856 914 1,087
Hydro and geothermal 697 777 841 870
Wind and solar 16 214 703 1,509
Water for Energy (Bill. m³) 2005 2015 2035 2050
Total World 1,815.6 1,986.4 2,087.8 2,020.1
Total North America 74.8 113.0 171.0 201.8
Percentage of Total 4% 6% 9% 11%
Primary Production
Coal, lignite 4.7 5.0 6.1 7.8
Oil, of which: 33.2 71.7 126.9 153.1
Non-conventional oil 8.9 43.4 102.0 134.3
Natural gas 2.7 2.4 3.1 4.1
Uranium 0.8 0.7 0.7 0.8
Biomass and wastes, of which: 21.9 20.4 19.3 18.4
Traditional biomass 21.9 20.4 19.3 18.4
Electricity Generation
Thermal, of which: 5.3 6.0 7.5 9.1
Coal 4.5 4.7 5.8 7.3
Gas 0.5 1.0 0.9 0.8
Oil 0.2 0.1 0.1 0.1
Biomass and wastes 0.1 0.2 0.7 0.9
Nuclear 2.5 2.3 2.5 3.0
Hydro and geothermal 3.8 5.2 4.5 4.7
Wind and solar 0.0 0.1 0.3 0.7

Water for Energy World Energy Council
49
Annex 3
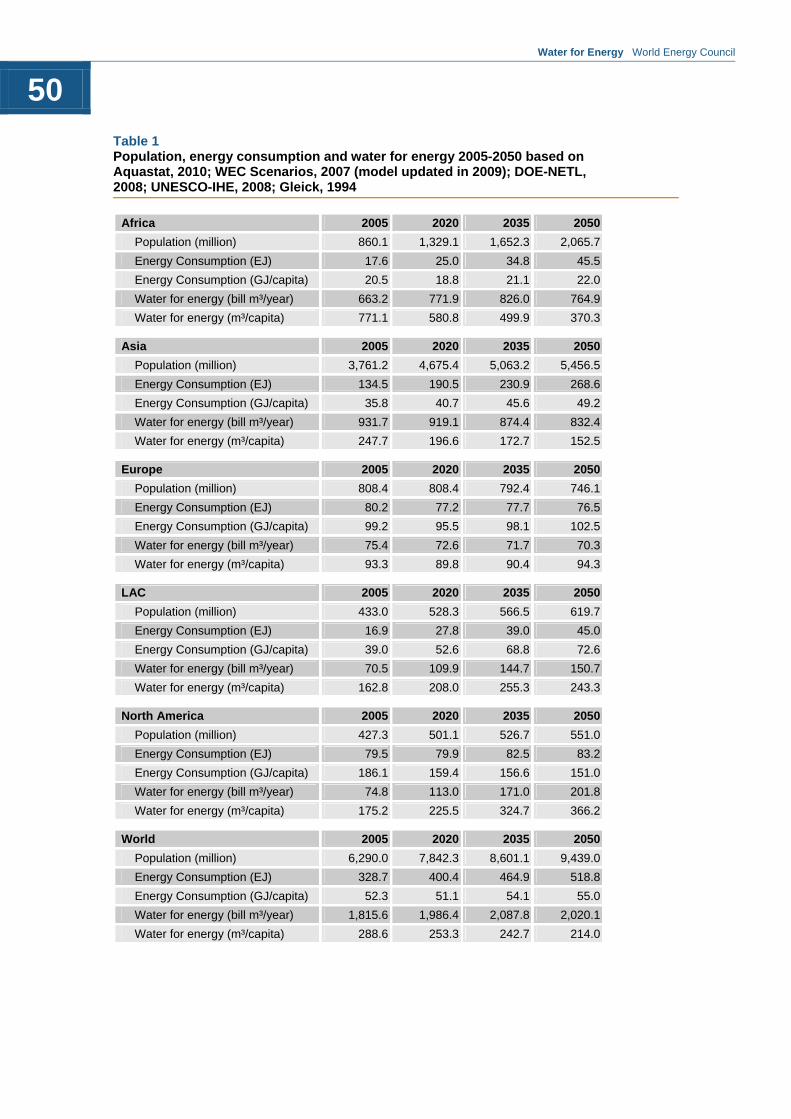
Water for Energy World Energy Council
50
Table 1 Population, energy consumption and water for energy 2005-2050 based on Aquastat, 2010; WEC Scenarios, 2007 (model updated in 2009); DOE-NETL, 2008; UNESCO-IHE, 2008; Gleick, 1994
Africa 2005 2020 2035 2050
Population (million) 860.1 1,329.1 1,652.3 2,065.7
Energy Consumption (EJ) 17.6 25.0 34.8 45.5
Energy Consumption (GJ/capita) 20.5 18.8 21.1 22.0
Water for energy (bill m³/year) 663.2 771.9 826.0 764.9
Water for energy (m³/capita) 771.1 580.8 499.9 370.3
Asia 2005 2020 2035 2050
Population (million) 3,761.2 4,675.4 5,063.2 5,456.5
Energy Consumption (EJ) 134.5 190.5 230.9 268.6
Energy Consumption (GJ/capita) 35.8 40.7 45.6 49.2
Water for energy (bill m³/year) 931.7 919.1 874.4 832.4
Water for energy (m³/capita) 247.7 196.6 172.7 152.5
Europe 2005 2020 2035 2050
Population (million) 808.4 808.4 792.4 746.1
Energy Consumption (EJ) 80.2 77.2 77.7 76.5
Energy Consumption (GJ/capita) 99.2 95.5 98.1 102.5
Water for energy (bill m³/year) 75.4 72.6 71.7 70.3
Water for energy (m³/capita) 93.3 89.8 90.4 94.3
LAC 2005 2020 2035 2050
Population (million) 433.0 528.3 566.5 619.7
Energy Consumption (EJ) 16.9 27.8 39.0 45.0
Energy Consumption (GJ/capita) 39.0 52.6 68.8 72.6
Water for energy (bill m³/year) 70.5 109.9 144.7 150.7
Water for energy (m³/capita) 162.8 208.0 255.3 243.3
North America 2005 2020 2035 2050
Population (million) 427.3 501.1 526.7 551.0
Energy Consumption (EJ) 79.5 79.9 82.5 83.2
Energy Consumption (GJ/capita) 186.1 159.4 156.6 151.0
Water for energy (bill m³/year) 74.8 113.0 171.0 201.8
Water for energy (m³/capita) 175.2 225.5 324.7 366.2
World 2005 2020 2035 2050
Population (million) 6,290.0 7,842.3 8,601.1 9,439.0
Energy Consumption (EJ) 328.7 400.4 464.9 518.8
Energy Consumption (GJ/capita) 52.3 51.1 54.1 55.0
Water for energy (bill m³/year) 1,815.6 1,986.4 2,087.8 2,020.1
Water for energy (m³/capita) 288.6 253.3 242.7 214.0
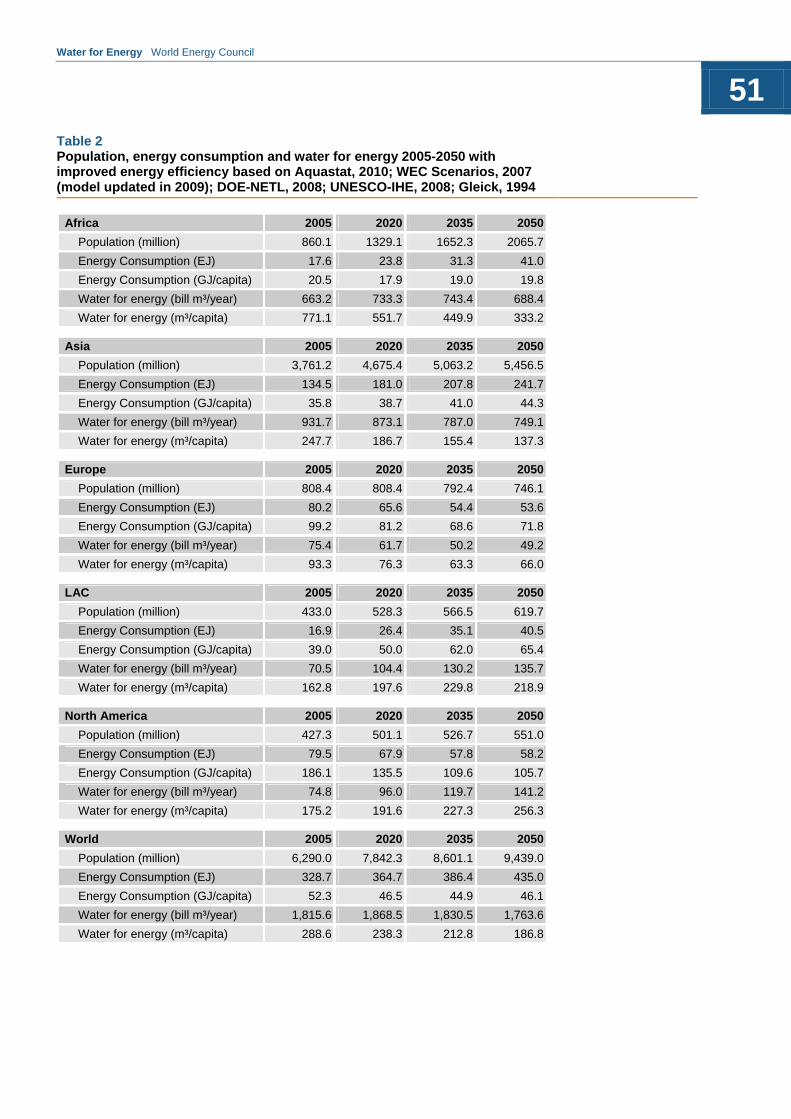
Water for Energy World Energy Council
51
Table 2 Population, energy consumption and water for energy 2005-2050 with improved energy efficiency based on Aquastat, 2010; WEC Scenarios, 2007 (model updated in 2009); DOE-NETL, 2008; UNESCO-IHE, 2008; Gleick, 1994
Africa 2005 2020 2035 2050
Population (million) 860.1 1329.1 1652.3 2065.7
Energy Consumption (EJ) 17.6 23.8 31.3 41.0
Energy Consumption (GJ/capita) 20.5 17.9 19.0 19.8
Water for energy (bill m³/year) 663.2 733.3 743.4 688.4
Water for energy (m³/capita) 771.1 551.7 449.9 333.2
Asia 2005 2020 2035 2050
Population (million) 3,761.2 4,675.4 5,063.2 5,456.5
Energy Consumption (EJ) 134.5 181.0 207.8 241.7
Energy Consumption (GJ/capita) 35.8 38.7 41.0 44.3
Water for energy (bill m³/year) 931.7 873.1 787.0 749.1
Water for energy (m³/capita) 247.7 186.7 155.4 137.3
Europe 2005 2020 2035 2050
Population (million) 808.4 808.4 792.4 746.1
Energy Consumption (EJ) 80.2 65.6 54.4 53.6
Energy Consumption (GJ/capita) 99.2 81.2 68.6 71.8
Water for energy (bill m³/year) 75.4 61.7 50.2 49.2
Water for energy (m³/capita) 93.3 76.3 63.3 66.0
LAC 2005 2020 2035 2050
Population (million) 433.0 528.3 566.5 619.7
Energy Consumption (EJ) 16.9 26.4 35.1 40.5
Energy Consumption (GJ/capita) 39.0 50.0 62.0 65.4
Water for energy (bill m³/year) 70.5 104.4 130.2 135.7
Water for energy (m³/capita) 162.8 197.6 229.8 218.9
North America 2005 2020 2035 2050
Population (million) 427.3 501.1 526.7 551.0
Energy Consumption (EJ) 79.5 67.9 57.8 58.2
Energy Consumption (GJ/capita) 186.1 135.5 109.6 105.7
Water for energy (bill m³/year) 74.8 96.0 119.7 141.2
Water for energy (m³/capita) 175.2 191.6 227.3 256.3
World 2005 2020 2035 2050
Population (million) 6,290.0 7,842.3 8,601.1 9,439.0
Energy Consumption (EJ) 328.7 364.7 386.4 435.0
Energy Consumption (GJ/capita) 52.3 46.5 44.9 46.1
Water for energy (bill m³/year) 1,815.6 1,868.5 1,830.5 1,763.6
Water for energy (m³/capita) 288.6 238.3 212.8 186.8

Albania Algeria Argentina Australia Austria Belgium Botswana Brazil Bulgaria Cameroon Canada China Colombia Congo (Democratic Republic) Côte d'Ivoire Croatia Cyprus Czech Republic Denmark Egypt (Arab Republic) Estonia Ethiopia Finland France Germany Ghana Greece Hong Kong, China Hungary Iceland India
Indonesia Iran (Islamic Republic) Ireland Israel Italy Japan Jordan Kazakhstan Kenya Korea (Rep.) Kuwait Latvia Lebanon Libya/GSPLAJ Lithuania Luxembourg Macedonia (Republic) Mexico Monaco Mongolia Morocco Namibia Nepal Netherlands New Zealand Niger Nigeria Norway Pakistan Paraguay Peru Philippines
Poland Portugal Qatar Romania Russian Federation Saudi Arabia Senegal Serbia Slovakia Slovenia South Africa Spain Sri Lanka Swaziland Sweden Switzerland Syria (Arab Republic) Taiwan, China Tajikistan Tanzania Thailand Trinidad & Tobago Tunisia Turkey Ukraine United Arab Emirates United Kingdom United States Uruguay Yemen
Member committees of the World Energy Council
Designed and produced by Merchant (Brunswick Group).

World EnRegencyLondon WT (+44) 2F (+44) 2E [email protected]
For susta
ISBN: 97
nergy Council y House 1-4 WaW1B 5LT United20 7734 5996 20 7734 5926 worldenergy.orgorldenergy.org
ainable energy.
78-0-946121-10-
rwick Street d Kingdom
g
-6


