29
Russell K. Hall and Associates, Inc. Water Injection in WIPP Vicinity: Current Practices, Failure Rates and Future Operations

Russell K. Hall and Associates, Inc.
Water Injection in WIPP Vicinity:
Current Practices, Failure Rates
and Future Operations
Water Injection in WIPP Vicinity:
Current Practices, Failure Rates and Future Operations
Effective January 1, 2013
Prepared by:
Russell K. Hall and Associates, Inc. Melzer Consulting
Reservoir Evaluation Engineers 415 West Wall, Suite 1720
303 West Wall, Suite 1102 Midland, Texas 79701
Midland, Texas 79701
432-683-6622 432-682-7664
Russell K. Hall, P. E. Steve L. Melzer, P. E.
Monica Parkison, P. E.
Susan G. Hall
Prepared Under Contract No. WIPP1-PO107933
July 2013

Table of Contents
1.0 Introduction …………………………………..….…… 1
2.0 Recent Water Injection Development …………… 3
3.0 Regulatory Requirements ………………………….. 4
3.1 Testing ………………………………………..... 4
3.2 Type of Failures ……………………………..... 7
4.0 Historical Injection Well Failures …………………. 9
5.0 Oil and Gas Productive Formations …………..….. 10
6.0 Projection of Future Activities ………………..….. 14
6.1 Waterflood Development ………………..... 17
7.0 Reservoir Fill-up …………………………………….. 19
8.0 Data Acquisition ……………………………………. 21
9.0 Conclusions ………………………………..……….. 22
10.0 References ……………………………………………. 24
Appendix I Well Tests
Appendix II Maps
Appendix III Well Inventory
Appendix IV Normalized Production Data
Appendix V New Mexico Regulations
Appendix VI Underground Injection Control (UIC) Program
Appendix VII Rate vs. Time Graphs
Appendix VIII Symbols for Mapping
List of Figures
Figure 1 Water Injection Wells ………………………………….. 2
Figure 2 Delaware Basin Stratigraphic Section ……………… 10
Figure 3 Well Completions vs. Time in Study Area …………. 14
Figure 4 Total Production vs. Time in Study Area …………… 16
Figure 5 Map of Cabin Lake Area ……………………………… . 17
Figure 6 Map of Livingston Ridge Area ……………………….. . 18
Figure 7 Reservoir Pressure vs. Recovery ……………………… 19
Figure 8 Injection to Withdrawal Ratio vs. Time in Study Area 20
List of Tables
Table 1 Missing UIC Tests in Study Area ………………………. 6
Table 2 BHT and MIT Failures in Study Area ………………… 9
Table 3 Cumulative Oil and Gas Production in Study Area …. 12
Table 4 Projected Oil and Gas Recoveries in Study Area …….. 13

1.0 Introduction
A June 1997 report entitled, Injection Methods: Current Practices and Failure
Rates in the Delaware Basin reviewed oilfield injection activities and
practices in the nine townships contiguous to the Waste Isolation Pilot
Project. The 1997 report begins: “Critics of the Waste Isolation Pilot Project
(WIPP) have often cited the existence of exploration activities and production
of petroleum resources in the immediate vicinity of the WIPP site as
sufficient reason to abandon the site for use as a nuclear waste disposal
facility. One reason given is that the petroleum industry routinely uses
water flooding techniques for pressure maintenance or secondary recovery of
petroleum, or uses wells for waste (salt) water disposal. These activities are
postulated by WIPP critics to induce water into the WIPP repository under
pressure, thereby leading to rapid movement of radionuclides dissolved in
brine within the WIPP disposal rooms toward the WIPP site boundaries, and
thus leading to a violation of the release standards of Title 40 Code of Federal
Regulations (CFR) Part 191 (EPA, 1993).”1,15 Data from the original 1997
report provided important input data “of the failure rate of water injection
(WI) and salt water disposal wells (SWD)” for computer models to predict the
consequences of said activities in and near the WIPP site. An April 3, 2003
Injection Report, an August 2008 Injection Report, and a new report (this
document) all follow a similar methodology and provide important data
concerning oilfield water injection within the nine township area. In many
respects, this report updates the data from the prior reports. Consequently,
many references are made to the April 2003 and August 2008 reports, and
many, but not all, of the discussions previously offered are repeated herein.
This report also includes a projection of future water injection development
based upon an analysis of current activities.
The analysis of oilfield injection activities and practices surrounding the
WIPP site is limited to nine sections, including (1) the township where the
WIPP site is located (22S 31E) and (2) the surrounding eight townships. In
all, these townships cover an area of approximately 324 square miles, being
roughly 18 miles by 18 miles in dimension. This area was selected because
the geological characteristics within this area, which include, but are not
limited to, lithology, depositional environment, stratigraphy, reservoir fluid
properties, geothermal gradient and geostatic pressures, would be similar to
any sites where future drilling activity near the WIPP site might occur. Thus
these townships are representative of present and future activity.
For this report, all water injection wells in the subject area were analyzed.
This includes both active injection wells, those that are presently injecting
Page no. 2
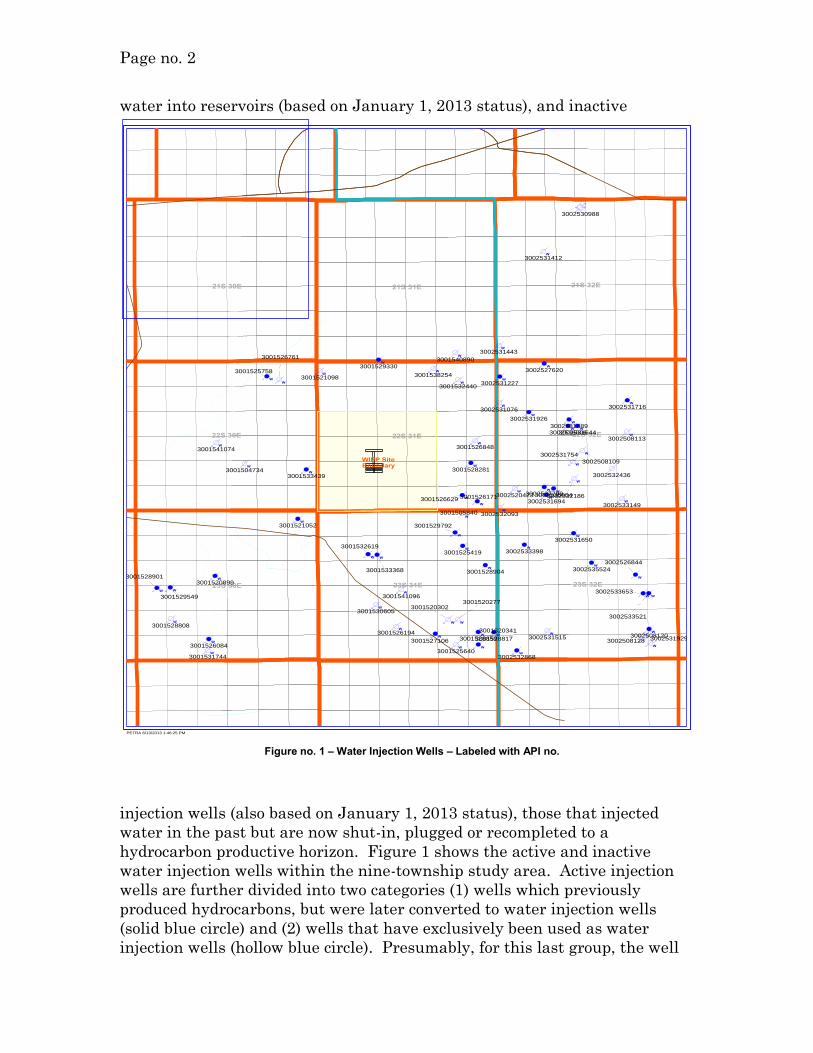
water into reservoirs (based on January 1, 2013 status), and inactive
21S 31E
22S 31E
21S 32E21S 30E
22S 30E 22S 32E
23S 30E 23S 31E 23S 32E
WIPP SiteBoundary
WW
W
W
W
W
W W
W
W
W
W
WW
W
W
W
W
W
W
W
W
W
W
W
W
W
W
W
W
W
W
W W
W
W W
W
W
W
W
W
W
W
W
W
W
W
W
W
W
W
W
W
W
W
W
W
W W
W
WW
W
W
W
W
3002531650
3001529792
3001525640
3001528808
3002526844
3001526629
3002533653
3002533521
3002531076
3001526848
3002508109
3001521052
3001525758
3001526761
30025315153002508128
3002531889
3001504734
3001529330
3002531443
3001526171
3001528281
3001531744
3002531716
3002520423
3001530605
3002531754
3002533149
3002508113
3001528901
3001526194
3002532868
3001505840
30015203023001520277
3001527106
3001520341
3002531929
3002531412
3001526084
3002531227
3001528859
3002531644
3002531694
3002536006
3002533398
3002535524
3002532436
3001528817
3002530988
3002532186
3002527620
3001529549
3002532093
3002531926
3002508120
3001520899
3001528904
3001525419
3001521098
3001532440
3001532619
3001533368
3001533439
30025360043002537799
3001541096
3001538254
3001541074
3001540890
PETRA 6/13/2013 1:46:25 PM
injection wells (also based on January 1, 2013 status), those that injected
water in the past but are now shut-in, plugged or recompleted to a
hydrocarbon productive horizon. Figure 1 shows the active and inactive
water injection wells within the nine-township study area. Active injection
wells are further divided into two categories (1) wells which previously
produced hydrocarbons, but were later converted to water injection wells
(solid blue circle) and (2) wells that have exclusively been used as water
injection wells (hollow blue circle). Presumably, for this last group, the well
Figure no. 1 – Water Injection Wells – Labeled with API no.
Page no. 3
was originally drilled to test for hydrocarbon production, but being
unsuccessful at finding commercial quantities of hydrocarbons, became a
water injection well. Figure 1 does not distinguish between active and
inactive injectors.
Finally, we analyzed the purpose of each water injection well to categorize
the well as either (1) a salt water disposal well or (2) a reservoir
enhancement well. The primary purpose for a salt water disposal well (SWD)
is to dispose of produced water, a common byproduct of hydrocarbon
production. For a SWD, water is typically injected into either (1) a non-
commercial hydrocarbon bearing reservoir or (2) a hydrocarbon bearing
reservoir, but is of sufficient distance from oil and gas productive wells as to
exhibit little or no effect on production. This contrasts to water injection
wells that are designed to enhance hydrocarbon production rates and
recovery, and includes both the processes of waterflooding and pressure
maintenance. In these instances, water injection into a productive reservoir
is hoped to increase hydrocarbon production through a combination of fluid
displacement and increasing reservoir pressure. “Waterflooding is dominant
among fluid injection methods and is without question responsible for the
current high level of producing rate and reserves within the U. S. and
Canada.”2
Of particular interest are water injection wells that fall into this last category
of reservoir enhancement wells. These will be discussed more fully in the
section titled Waterflood Development.
To orient the reader, Appendix I is a list of injection well test data, Appendix
II includes various maps of the study area surrounding the WIPP site. A
complete inventory of all producing wells in the study area is including as
Appendix III. Appendix IV contains the normalized production data by
reservoir. Appendix V is a copy of the New Mexico regulations: Title 19
Natural Resources and Wildlife, Chapter 15 Oil and Gas. Appendix VI is a
copy of the New Mexico Underground Injection Control (UIC) Program.
Appendix VII contains rate vs. time plots for all injection wells in the study
area. Appendix VIII contains a list of mapping symbols.
2.0 Recent Water Injection Development
The 1997 Injection Methods: Current Practices and Failure Rates in the
Delaware Basin report, identified a total of 26 injection wells with 21 active
salt water disposal (SWD) wells, three active water injection wells and two
temporarily abandoned or inactive SWD wells in the nine township study
area. In the April 2003 Injection Report, 39 total injection wells were

Page no. 4
identified with 36 SWD or injection wells active and 3 wells temporarily
abandoned or inactive. In the April 2008 Injection Report, 54 total injection
wells were identified with 51 SWD or injection wells active and 3 wells
temporarily abandoned or inactive. As of 1/1/2013, a total of 64 total injection
wells are identified with 58 SWD or injection wells active and 6 wells
temporarily abandoned or inactive. This represents an increase of 7 new
SWD or water injection wells since the April 2008 Injection Report. Average
daily injection into all wells is now at approximately 73,000 barrels of water
injected per day (BWIPD) or approximately 1,270 BWIPD per well. This
compares to average daily injection of 77,000 BWIPD at the end of 2007 or
approximately 1,480 BWIPD per well. Therefore, injection rates have
decreased slightly over the past 5 years.
3.0 Regulatory Requirements
The subject area surrounding the WIPP lies exclusively within the State of
New Mexico and is subject to the Uniform Injection Code, which is
administered by the New Mexico Oil Conservation Division (NMOCD). The
Uniform Injection Code applies to all wells located in New Mexico whether
the minerals are owned by private individuals, the State of New Mexico or
the U. S. Federal government. The regulations governing water injection are
stated in rules 19.15.9.701 through 19.15.9.710 and are included as Appendix
V. The rules apply to injection for secondary or other enhanced recovery,
pressure maintenance, salt water disposal and underground storage. Rule
19.15.9.701.a states “The injection of gas, liquefied petroleum gas, air, water,
or any other medium into any reservoir for the purpose of maintaining
reservoir pressure or for the purpose of secondary or other enhanced recovery
or for storage or the injection of water into any formation for the purpose of
water disposal shall be permitted only by order of the Division after notice
and hearing, unless otherwise provided herein.”3 Consequently, permitting
and monitoring of water injection wells are closely regulated by the NMOCD
to maximize hydrocarbon recovery, protect correlative rights and ensure
protection of the environment, both above and below the ground surface.
3.1 Testing
Injection wells move water from surface facilities to subsurface reservoirs.
The nature of fluid flow into a permeable media is a well documented and
understood mechanism. The rate of fluid movement is proportional to the
pressure differential between the sandface and the average reservoir
pressure. Thus water injection wells involve some form of pressure in the
wellbore, resulting from a combination of hydrostatic pressure (the weight of
the water column) and injection pumps. To ensure the injection water is

Page no. 5
disposed into only the target interval, the NMOCD outlines cementing
requirements (see NMAC 19.15.9.702), operational procedures (see NMAC
19.15.9.703) and periodic testing (see NMAC 19.15.9.704). Cementing
requirements state the wellbore casing “shall be so set and cemented as to
prevent the movement of formation or injected fluid from the injection zone
into any other zone or to the surface around the outside of any casing
string.”5
The NMOCD uses two types of tests to ensure wellbore integrity of water
injection wells, the Bradenhead Test and the Mechanical Integrity Test.
Typically a Bradenhead Test (BHT) is conducted annually and a Mechanical
Integrity Test (MIT) is conducted at five-year intervals or anytime that a well
is taken off-line for repairs; however, the actual frequency of these tests may
vary based on permit conditions.
The BHT is performed by opening the bradenhead valve to the atmosphere.
If gas or water flow is observed or indicated, flow through the bradenhead
valve is allowed to continue for a minimum of fifteen minutes. During this
period, pressures are recorded at five-minute intervals on the production,
intermediate and surface casing. Any fluids flowing from the bradenhead
valve, including measured or estimated rates of flow, are described in detail.
The BHT tests the integrity of the tubing and packer. The tubing annulus,
the volume between the tubing and the casing, is typically filled with a
corrosion-inhibiting fluid. If a leak in the tubing or packer exists, the
annulus becomes pressurized and flow occurs when the valve is opened.
The MIT tests the integrity of the casing and must be performed prior to
injection and/or any time the tubing is pulled or the packer is reseated. In
this test the tubing-casing annulus is pressurized to a minimum of 300 psia.
A pressure recorder shows any loss of pressure over a 30-minute period.
Copies of the pressure recorder chart must be submitted to the NMOCD
within 30 days of the test date. A sudden drop in pressure indicates annular
fluids are leaking out and constitutes a test failure. If a well fails a test, it is
shut-in and the operator must take corrective action before returning the well
to service.
During the past ten years, the NMOCD changed the record keeping
procedure for BHT and MIT tests. Previously, hard copy reports were filed at
each regional NMOCD office documenting the test results. For our 2003
evaluation, we visited the Artesia and Hobbs offices and copied these reports
for independent analysis. Sometime in 2005, the NMOCD converted to an
electronic database system to track Underground Injection Control (UIC) test
results. The database contains both historical BHT and MIT tests (those

Page no. 6
obtained prior to the conversion) and recent tests (conducted after the
conversion). This system replaced the manual filing system and eliminated
the need to retain hard copy reports. For the 2008 and 2013 evaluations, we
requested a query of the electronic database from each regional office and
received an ASCI text file containing the subject data.
As part of the 2005 conversion process, the NMOCD also implemented an
automated process to notify operators of upcoming BHT and MIT tests,
thereby eliminating the need of manually tracking and scheduling these
tests. Although these electronic methods should improve reliability, we
discovered some deficiencies in the system.
First, well test data are missing from the MIT and BHT electronic database.
The accompanying table identifies 24 wells (38 percent) for which we could
not locate historical MIT and/or BHT tests in the NMOCD query during the
subject 5 year period. In some cases, the tests may have been conducted but
not recorded in the NMOCD electronic database.
Well Name and No. Operator API Number County Missing Date
Aracanga Federal No. 1 Oxy USA Inc. 30-025-31650 Lea 2008, 2012
Bitsy Federal SWD No. 1 Enervest Operating, LLC 30-025-33398 Lea 2010, 2012
Cuervo Federal No. 1 Strata Production 30-025-26844 Lea 2011, 2012
Diamondtail 24 Federal A No. 1 Concho Resources 30-025-33521 Lea 2010
Diamondtail 23 Federal No. 2 Devon Energy 30-025-33653 Lea 2011
Flamenco Federal No. 1 Yates Petroleum 30-025-31076 Lea 2008
Gilmore No. 1 Strata Production 30-025-08109 Lea 2008, 2011,2012
James A No. 1 ConocoPhillips 30-015-25758 Eddy 2008, 2009, 2010, 2011, 2012
James Federal No. 1 Harvard Petroleum 30-025-31515 Lea 2008, 2010, 2012
Lost Tank SWD No. 1 Phillips Petroleum 30-025-31443 Lea 2010, 2011, 2012
Prize Federal No. 4 Oxy USA Inc. 30-025-32436 Lea 2008, 2012
Prohibition Federal Unit No. 2 COG Operating LLC 30-025-31716 Lea 2010, 2012
Proximity 31 Fed No. 4 Oxy USA Inc. 30-025-20423 Lea 2008, 2010, 2012
Red Tank Federal No. 2 EOG Resources Inc. 30-025-08113 Lea 2008
Red Tank Federal 28 No. 3 Oxy USA Inc. 30-025-31754 Lea 2008, 2012
Red Tank Federal 35 No. 3 Oxy USA Inc. 30-025-33149 Lea 2008, 2012
Sand Dunes 28 Fed No. 1 OXY USA Inc 30-015-26194 Eddy 2012
SDE 31 Federal No. 9 XTO Energy, Inc 30-025-32868 Lea 2008, 2009, 2011, 2012
Silverton '31' Fed 1 Echo Production 30-025-32093 Lea 2008, 2010, 2012
South Culebra Bluff 23 No. 17 Range Operating 30-015-35510 Eddy 2008, 2009, 2010, 2011, 2012
South Culebra Bluff 23 No. 18 Range Operating 30-015-35511 Eddy 2008, 2009, 2010, 2011, 2012
South Culebra Bluff 23 No. 19 Range Operating 30-015-35512 Eddy 2008, 2009, 2010, 2011, 2012
South Culebra Bluff 23 No. 20 Range Operating 30-015-35513 Eddy 2008, 2009, 2010, 2011, 2012
South Culebra Bluff 23 No. 21 Range Operating 30-015-35514 Eddy 2008, 2009, 2010, 2011, 2012
Triste Draw State 36 No. 1 EOG Resources Inc. 30-025-31929 Lea 2008
Secondly, the automated notification system does not encompass all of the
injection wells. Consequently NMOCD notices were not sent and some
injections wells have not been tested since 2007. It appears the conversion
process failed to capture all injection wells, consequently operators were not
notified of annual testing for these wells. It appears the 6 wells (10 percent)
Table no. 1 – Missing UIC Tests in Study Area

Page no. 7
missing consecutive tests in 2008, 2009, 2010, 2011, and 2012 likely fall into
this category. Of the two deficiencies, we believe the second is more severe.
3.2 Type of Failures
The June 1997 Injection Methods: Current Practices and Failure Rates in the
Delaware Basin identified five types of injection well failures. These include
(1) tubing leak, (2) packer leak, (3) casing leak, (4) breakdown of cement
sheath and (5) hydraulic fracturing by injecting fluids out of zone. Based
upon NMOCD practices, we would add a sixth type of failure, (6) an inability
to conduct a test. Although this does not constitute a mechanical failure, the
NMOCD considers a test failed if the test cannot be conducted. The
bradenhead test and mechanical integrity test are designed to detect the first
three types of failures. Sudden changes in annular pressure occur during
these types of failures as the injection fluids pressurize the annulus during a
tubing or packer leak while annular fluids migrate into a surrounding
reservoir during a casing leak, thereby decreasing pressure (please see
Appendix VI for an injection well wellbore schematic). None of these failures
individually result in out of zone injection. The prior report found “given the
infrequency of tubing and packer leaks…, and the infrequency of casing
leaks, the probability of these two leaks occurring simultaneously is very,
very low”1. This conclusion remains valid, based on recent failure data.
Furthermore, these failures are readily detected and repaired. Therefore
these failures do not impact the WIPP site since any injected fluids are
contained within either the tubing or casing and do not migrate out of the
desired injection interval.
For the fourth failure type, breakdown of cement sheath, the prior report
summarizes this condition very well. The report states, “the breakdown of
the cement sheath between the casing and/or the borehole wall, is the only
leak scenario that has the potential to impact the WIPP repository. This type
of failure can only be detected by a radioactive tracer test (RTT) survey
conducted inside the cased wellbore. This type of test is not a normal
regulatory requirement, but may be conducted if it appears there may be
fluid migration behind casing. There are several diagnostic tools for
indirectly detecting fluid migration behind casing. For example, if a WI well
operated to enhance oil production (i.e., waterflood operations) caused
migration out of zone, anticipated recovery would not meet the
predetermined expectations of the operator, thereby affecting the economics
of the waterflood project. Prudent operators of waterflood projects will not
allow injection fluids to migrate out of zone. Further, it is a violation of
NMOCD regulations to allow migration of fluid out of the target zone.”3 We

Page no. 8
would add that most operators of waterflood operations conduct periodic
temperature surveys to identify the intervals where injected water travels.
Since the injected water is cooler than the surrounding formations, intervals
of injection exhibit below normal temperatures. This diagnostic tool is used
to identify problems with injection conformance and to confirm the success of
corrective actions.
The 1997 report also noted “if the cement sheath in a SWD is compromised by
the injection process and fluid migrates upward, it is more likely that this
event would go undetected for a greater period of time than for a WI well.
However, the low permeability of the cement will preclude the migration of
injected water through the cement sheath. One hundred percent bonding
between cement/casing and cement/formation is not necessary to insure a
hydraulic seal. Sixty to eighty percent cement bonding over a distance of 25 –
50 feet for 5.5 inch casing and 60 – 125 feet bonding for 8.625 inch casing is
adequate to insure a hydraulic seal for injection purposes (Schlumberger
1989). Note that the minimum length of any cement sheath (production
casing) within the study area is 140 feet.”1 We have not reviewed wells
drilled since this 1997 report to determine if any wells have cement sheaths
less than 140 feet.
Failure type 5, hydraulic fracture of injection fluids out of zone could occur if
the pressure of the injection fluid exceeded the fracture pressure of the
formation at the sand face. In general, fracture pressures typically exceed 0.8
psi per foot of depth, thus for depths ranging from 5,000 feet to 8,000 feet, the
respective fracture pressures would be approximately 4,000 psi and 6,400 psi.
The NMOCD requires the surface pressure not exceed 0.2 psia per foot of
depth to the top of the perforations. Since the hydrostatic pressure of a
column of water is .435 psi per foot (for a salt saturated solution), the
maximum sand face pressures are 3,175 psi at 5,000 feet and 5,080 psi at
8,000 feet. Both are significantly below the corresponding fracture pressure
at depth and are therefore incapable of inducing a vertical fracture.
The sole exception to the NMOCD ban on injection above 0.2 psi per foot of
depth are for temporary tests, known as step-rate tests, to determine actual
formation parting pressure (the pressure that induces a vertical fracture). In
this test, water is initially injected at a low pressure and the injection rate
measured. The injection rate is then “stepped-up” to a higher pressure using
a predefined increment of perhaps 100 psi or 200 psi. Again the injection
rate is measured. The process is then repeated at successively higher
injection pressures. As long as the injection pressure is below the parting
pressure, the increase in injection will be proportional to pressure.4 Thus
each 100 psi increase in injection pressure translates into a like increase in
injected volume. Mathematically this yields a ratio such as 5 barrels per psi.

Page no. 9
Once the injection pressure exceeds the parting pressure, the injection rates
increase much more rapidly, thus the ratio of injection to pressure increases,
perhaps to 10 barrels per psi. The parting pressure, the pressure that
induces a vertical fracture, is determined from the pressure at which
injection rate first increases rapidly, and the maximum pressure allowed is
set below the measured limit. Although the formation is fractured or parted
during the test, the fracture heals once the pressure in the fracture drops
below the parting pressure. Thus the fracture results of the test are
temporary.
Finally, the 1997 report extensively addressed the geometry of a fracture
created by injecting above parting pressure. Therefore please see pages 10
and 11 of the prior report for a thorough discussion of this behavior. To
summarize, because water, the injectant, has a relatively low viscosity (0.60
centipoises at 140 F), the fluid moves rapidly into the surrounding formation
and generates little fracture height. This behavior, known as leak-off, results
in very little fracture volume due to saltwater injection. Thus the creation of
a vertical fracture (with height in excess of a few tens of feet) is highly
improbable at the injection rates reviewed in the study.
4.0 Historical Injection Well Failures
Appendix I summarizes all the Bradenhead and Mechanical Integrity Tests
for wells in the study area. Table no. 2 itemizes Bradenhead and Mechanical
Integrity Test failures in the nine township study area since 2007.
Furthermore, the table shows the cause for the failed test and the remedial
action required to return the well to injection.
Well Name and No. Test Date Test Type Reason for Failure Action Failure
TypeApache 25 Federal No. 8 Oct 2009 MIT Csg would not hold pressure repaired, retest 4/22/10. test OK 3
Charger 29 Federal No. 1 Oct 2010 MIT Csg would not hold pressure Repair csg, Retest12/20/2010, test OK 3
Cuervo Federal No. 1 Aug 2010 MIT Operational violation Retest 8/19/2010, test OK ?
Diamondtail 23 Federal No. 2 Sep 2011 MIT Pressure on tbg & csg Repair, Retest 2/17/2012, test OK 1,3
Diamondtail 24 Federal A No. 1 Apr 2013 MIT Csg would not hold pressure plans to repair 3
Gilmore No. 1 Mar 2009 MIT Csg would not hold pressure ran 51/2 ' liner; retest 8/18/2010; test OK 3
James A No. 12 Nov 2010 Brdhd Test Hole in tubing Replace tbg, retest 11/30/2010, test OK 1
Lotus SWD No. 1 Dec 2010 MIT well is down, did not test casing repair , retest 1/11/2011, test OK 3
Neff Federal 003 Oct 2012 Brdhd Test casing leak replace pkr, retest 12/5/12, test ok 3
Todd Fed 26F No. 3 Oct 2010 MIT casing leak repair, retest 2/14/2011, test OK 3
Todd Fed 26G No. 2 Sep 2009 Brdhd Test inj pressure over max limit retest 10/21/09, test OK ?
Todd Fed 27P No. 16 Sep 2009 Brdhd Test inj pressure over max limit notice of intent to P&A ?
Todd 36 State No. 1 Oct 2010 MIT Csg would not hold pressure Replace tbg, retest 11/17/2010, test OK 1
Thirteen test failures were identified for the 64 injection wells in the study
area. However, note that two of the tests failed due to an inability to conduct
a test. The Cuervo Federal 1 had an operational violation, and the Lotus
SWD 1 was down. In this situation, a testing failure occurs since a test can
Table no. 2 – BHT and MIT Failures in Study Area

Page no. 10
not be conducted and is so noted in the OCD
records. If these failures are excluded, which seems
reasonable since no mechanical failure actually
occurred, then 11 mechanical failures are observed.
The most common cause for failure was a casing or
tubing leak. In each case, the problem was repaired
and the well returned to injection.
.
5.0 Oil and Gas Productive Formations
Oil and gas in the study area, itself a part of the
vast Delaware Basin, are produced from several
different formations, including Delaware Mountain
Group, Bone Spring, Wolfcamp, Atoka, and Morrow.
The Delaware Mountain Group can be further
subdivided into Bell Canyon, Cherry Canyon and
Brushy Canyon, but production is principally from
the latter two in this area. The accompanying
stratigraphic section (figure no. 2) shows the
relative depths at which these formations are
encountered in the study area. Two of the Permian
age formations, Delaware and Bone Spring, are
generally oil bearing and produce via solution gas
expansion. The other Permian age formation, the
Wolfcamp, may be either oil or gas bearing, while
the Pennsylvanian age Atoka and Morrow clastics produce gas and some
condensate. Both the Atoka and Morrow produce under simple gas
expansion.
In the study area, the Delaware Mountain Group produces from the Cherry
Canyon and the deeper Brushy Canyon. Both formations include layers of
clastic sands, organic-rich siltstones and carbonate materials. In general, the
cementing material is calcareous and porosity appears to be controlled by the
amount of the cementing material present. “Cyclicity was a major factor in
the deposition of the Brushy Canyon.”5 Changes in sea level allowed for
massive carbonate buildups along the shelf-basin margin which, during
periods of relatively high sea level, trapped sediments on the shelf. When sea
level fell, the trapped clastics flowed toward the basin and were deposited in
vast sandstone and siltstone units. Although the exact mechanism of
submarine sediment transport is debated, the result was a collection of
Fig no. 2 – Delaware Basin Stratigraphic Section (not to scale)

Page no. 11
interbedded sandstones and organic-rich siltstones that are cut by massive
channel-type sandstones. The sea level change occurred repeatedly and
numerous layers of sand and siltstone occur in these reservoirs.
Consequently, reservoirs are typically discontinuous, both laterally and
areally.
The prolific reef build-up around the boundaries of the Delaware Basin was
eventually the cause of its own death. Margin reefs gradually grew together
and blocked the flow of sea water from the shelf margin.6 This change, along
with climatic events, produced conditions of evaporation in the Delaware
Basin. The result was the formation of the large evaporite sections of salt,
gypsum, and anhydrite and represent the dying stages of the Permian as the
seas retreated to the southwest.
The Bone Spring Formation of Leonardian age is composed of three carbonate
units that are separated by three clastic units. The sands were deposited as
debris flows from the Abo-Yeso shelf edge during periods of relatively low sea
level and extend many miles into the basin. The carbonates, in contrast,
were deposited during high sea level when carbonate production was
greatest.10 Facies changes are frequent, both due to depositional conditions
and diagenetic changes. Porous dolomitic lenses often change to non-porous
limestone while porous sandstones frequently change laterally to non-porous
dolomite and siltstone. As with the Delaware Mountain Group formations,
reservoirs are very discontinuous, so much so that different facies are often
observed in adjacent wells. For example, a carbonate deposit in one well may
become almost absent in an east or west offset and transition to sand. This
type of facies change is especially prevalent to the north, closer to the shelf
margin.
The Morrow formation encompasses three distinct clastic intervals – Lower,
Middle and Upper – each separated by a major flooding surface with the
Lower Morrow boundary at the top of the Mississippian unconformity. The
intervals are each dominated by a particular depositional environment with
the Lower Morrow being delta plain, the Middle Morrow being delta front
and the Upper Morrow being carbonate shelf.7,8 Although these were the
dominant environments, numerous sub-environments (facies) also existed
including distributary channel-fill sands, channel mouth bars, and beach and
barrier bar deposits. These later facies reflect the reworking of the upper
portions of sand deposits by wave and wind action. The many sand deposits
are typically capped by transgressive marine shales and thin carbonate
deposits. Because of the complex depositional environment, the Morrow age
sands typically cover a limited areal extent and the sands encountered in one
well are very often different than those encountered in an offset well.

Page no. 12
The common trait of all of these formations is reservoir discontinuity. Hence
reservoirs may be characterized as relatively small, separated units. Even in
a single field, production is normally from several different reservoirs. For
example, in the Cabin Lake (Delaware) Field, production is from multiple
sands in both the Cherry Canyon and Brushy Canyon intervals.
Formation
Completions Cumulative Oil
(barrels) Cumulative Gas (Mcf)
Cumulative Injection (barrels)
Delaware 1354 90,708,000 215,515,000 353,400,000
Bone Spring 234 5,381,000 20,712,000 0
Wolfcamp 33 1.038,000 8.182,000 0
Strawn 13 366,000 11,791,000 0
Atoka 57 531,000 111,527,000 0
Morrow 139 1,485,000 252,482,000 2,579,000
Dry Holes 204 0 0 0
Other 28 1,367,000 4,474,000 21,000,000
Table no. 3 shows the relative contribution of each formation as it relates to
well count, cumulative oil production, cumulative gas production and
cumulative water injection. As this table shows, Delaware wells (1,354)
constitute the vast majority of total producing wellbores, followed by Bone
Spring (234) then Morrow (139). Please note that “Dry Holes” and “Other”
refer to the producing well status as all water is presently injected into the
Delaware formation. The Delaware and Bone Spring oil wells typically are
drilled on 40-acre spacing (16 wells per section). A tight spacing is required
to adequately drain the formations due to the following reasons: (1) the
reservoirs tend to be laterally and areally discontinuous, (2) the reservoirs
are low permeability and (3) the produced fluids (oil and water) are relatively
viscous. Hence many wellbores are needed to effectively drain these
reservoirs. Even on 40 acre spacing, recovery efficiency is fairly poor and
could probably benefit from denser spacing. Average cumulative production
is 67,000 barrels and 159,000 Mcf for each Delaware well (1,354 wells). A
normalized rate versus time plot for the Delaware wells in the study area is
included in Appendix IV. Based upon the normalized production curve,
remaining reserves in the Delaware completions are 57,000 barrels and
156,000 Mcf, yielding a Delaware per well estimated ultimate recovery (EUR)
of 124,000 barrels and 315,000 Mcf. Table 4 provides further details for the
four major formations for resource extraction activities.
Table no. 3 – Cumulative Oil and Gas Production in Study Area on 12/31/2012 (data from Lasser Production Data)

Page no. 13
Bone Spring completions average 23,000 barrels and 88,500 Mcf cumulative
production per well (234 wells). A normalized rate versus time plot for the
Bone Spring wells in the study area is included in Appendix IV. Based upon
the normalized production curve, remaining reserves in the Bone Spring
completions are 43,000 barrels and 171,500 Mcf, resulting in a Bone Spring
per well EUR of 66,000 barrels and 260,000 Mcf.
Delaware Bone
Spring
Atoka
Morrow Cumulative Oil Production (bbl) 67,000 23,000 9,300 11,000
Estimated Remaining Oil (bbl) 57,000 43,000 3,700 5,000
Estimated Ultimate Oil (bbl) 124,000 66,000 13,000 16,000 Cumulative Gas Production (mcf) 159,000 88,500 1,956,000 1,816,000
Estimated Remaining Gas (mcf) 156,000 171,500 649,000 1,079,000
Estimated Ultimate Gas (mcf) 315,000 260,000 2,605,000 2,895,000 Cumulative Equiv Bbl 93,500 37,800 335,000 314,000
Estimated Remaining Equiv Bbl 150,000 71,600 112,000 185,000
Estimated Ultimate Equiv Bbl 176,500 109,000 447,000 499,000
In contrast, the deeper Atoka and Morrow gas wells, while sharing the
characteristic of discontinuity, produce a lower viscosity fluid (gas) and are
capable of draining a larger area. Studies by Hall9 suggest the average area
drained by Morrow wells is between 90 to 100 acres with some wells draining
in excess of 400 acres. Therefore only 57 and 139 Atoka and Morrow gas
wells, respectively, are encountered in the study area. Cumulative Atoka
production is at 1.956 Bcf and 9,300 barrels per well. Remaining reserves are
projected at 0.649 Bcf and 3,700 barrels, yielding a per well EUR of 2.605 Bcf
and 13,000 barrels for Atoka gas wells.
Morrow gas wells average 1.816 Bcf and 11,000 barrels cumulative
production per well. Based upon the normalized production curve, remaining
reserves in the Morrow completions are 1,079 Bcf and 5,000 barrels, resulting
in a Morrow per well EUR of 2.895 Bcf and 16,000 barrels.
When compared to EUR’s from the 2008 study, well performance is generally
better.
Table no. 4 – Average Production and Projected Oil and Gas Recoveries in Study Area (All Volumes are per well averages)

Page no. 14
6.0 Projection of Future Activities Based on Current Conditions
The following graph (figure no. 3) shows a distribution of drilling activity for
each year in the study area since 1970. Additional information for these
wells is found in Appendix III. This graph shows gradual ongoing
development of oil and gas wells during the first two decades with a marked
increase in activity starting in 1990.
0
20
40
60
80
100
120
140
160
19
70
19
72
19
74
19
76
19
78
19
80
19
82
19
84
19
86
19
88
19
90
19
92
19
94
19
96
19
98
20
00
20
02
20
04
20
06
20
08
20
10
20
12
CO
MPL
ETIO
NS
PER
YEA
R
TIME
DRY HOLES
DELAWARE
BONE SPRING
WOLFCAMP
ATOKA
MORROW
Drilling continued at a fast pace of about 100 to 130 wells per year through
the 1990’s until the oil price collapse in late 1998. As commodity prices
improved starting in 2000, the drilling rate rose correspondingly to 60 to 100
wells per year. However, in spite of dramatically higher oil and gas prices in
the past few years, new well permits are exhibiting a decreasing trend during
the 5 year study period with 18, 43, 58, 60, and 50 permits issued in 2008,
2009, 2010, 2011, and 2012, respectively. These numbers consider the first
issuance of a permit and do not include permits reissued for the same well
once a permit expires. At year-end 2012, 59 wells were permitted yet
undrilled. The NMOCD issues drilling permits for a one year period which
expire if drilling operations have not commenced. We have not determined
the current status (active or expired) of the 59 permits issued in the study
area.
As the graph illustrates, wells targeting the Delaware Mountain Group
constitute the majority of drilling since 1985. Discussions with operators in
the study area confirm favorable economics for the Delaware formation and
Figure no. 3 – Well Completions vs. Time in Study Area

Page no. 15
plans are underway by many operators to continue development of this
formation with infill and extension drilling. If oil prices remain close to
current levels, we believe Delaware well drilling will continue at 40 to 60
wells per year for at least five more years.
Bone Spring wells offer relatively low reserves of approximately 109,000
equivalent barrels per completion. However with the significant recent
increase in commodity prices, the Bone Spring offers attractive economic
returns and more wells have targeted this reservoir in recent years. Finally,
the Bone Spring will likely be perforated and tested for commercial
quantities of hydrocarbons in Atoka and Morrow gas wells once these
reservoirs are depleted.
Operators typically consider the Pennsylvanian gas reservoirs, Atoka and
Morrow, together since the channel sands are quite unpredictable. Thus a
Morrow test often includes the Atoka as a “bail-out” or secondary target.
Therefore, economics for these formations are calculated in this report
assuming the Morrow is the primary target with the Atoka as the secondary
target. A survey of post-1970 wells reveals 168 wells produced from the
Morrow sands, but 13 of these were later recompleted into the shallower
Atoka sands. Fifty-three wells produced from only the Atoka sands
(presumably the Morrow was dry), while 22 dry holes encountered no
production in either the Morrow or Atoka. Therefore, in all, 243 wellbores
were drilled to test Pennsylvanian targets. Since the gas price collapse of
mid-2008, Atoka and Morrow drilling has virtually ceased with only 1 or 2
wells completed each year. We expect future drilling to continue at this rate
until gas prices recover.
A shift from vertical to horizontal well drilling marks the most significant
development change since the 2008 review. The 2008 review included three
horizontal wells. Since then, 94 horizontal wells penetrated the Delaware and
Bone Spring formations accounting for about 80 percent of the completions
during 2010 through 2012. Typically these wells drill 4,700 ft laterals in the
target formation. Based on the attractive economics of horizontal
completions, we anticipate the industry will favor ongoing horizontal
development over vertical wells. Therefore, it is likely that additional
horizontal wells will be drilled under the 16 section WIPP site boundary.
Although we do not anticipate these horizontal wells to be attractive as
injection wells, they will be hydraulically fracture stimulated during
completion. Presently 100 additional horizontal wells are permitted in the
study area.
The following graph (figure no. 4) depicts production and injection for all of
the wells in the nine township study area. Monthly volumes for oil

Page no. 16
10
100
1,000
10,000
100,000
1,000,000
10,000,000
1970 1980 1990 2000 2010 2020
GAS PRODUCTION (MCF/MO) OIL PRODUCTION (BBL/MO) WATER PRODUCTION (BBL/MO)
NUMBER OF WELLS WATER INJECTION (BBL/MO)
production, gas production, water production, water injection and well count
are plotted versus time for a period from 1970 through 2013. This graph
includes all wells regardless of productive interval (Morrow, Atoka, Bone
Spring, Delaware, etc.) and all water injection wells. The graph illustrates
several important features for wells in this area. First, total water injection
is essentially equal to total water production. Obviously, little or no make-up
water is injected. During the last five years, from 2008 through 2012, water
production averaged 2,605,479 barrels of water per month while water
injection averaged 2,090,170 barrels of water per month. The difference
between these two values probably represents an error in water
measurement. Since produced water, unlike oil or gas, is not sold, most
operators allow for some error in determining produced water volumes.
Figure no. 4 – Total Production vs. Time in Study Area

Page no. 17
6.1 Waterflood Development
We reviewed the performance of every producing well in the study area to
determine if water injection influences oil and gas production. Two groups of
wells appear to benefit from offset water injection. The first group, in the
Cabin Lake (Delaware) Field, is located to the northwest of the WIPP site
boundary in township 22S 30E (see map in Appendix II). The second group of
wells is to the east of the WIPP site boundary in the Livingston Ridge
(Delaware) Field in township 22S 31E. (see legend of symbols in Appendix
VIII).
The first group, in the Cabin Lake (Delaware) Field, shows a response to
water injection in James “A” no. 3 and James “A” no. 12. In this instance, six
Delaware oil wells exhibit either (1) increasing production or (2) production
that declines more gradually than is generally expected based upon field-wide
characteristics. The responding oil wells are indicated in the accompanying
map (figure no. 5) by orange circles.
ConocoPhillips Company operates
both the injection wells and
producing wells. Discussions with
the operator indicate no plans are
presently in place to expand
injection, either with larger
volumes in the existing wells or
with additional injection wells.
Furthermore, the operator believes
further study of the Delaware
formation is needed before the
working interest owners could
approve such an expansion project.
We believe the operator will not
pursue an expansion of this project
for several reasons. These include:
(1) staff and financial resources do
not appear to be directed toward
such a project, (2) the total project
is relatively small and offers little
incentive for a large international
major company, (3) lifting costs
would increase substantially which
appear contrary to corporate goals,
(4) the Delaware formation is
Zone: WELL - INJ_RESPONSE [RKH] 1.00 to 1.00
W
W
JAMES A003
JAMES A007
JAMES A012
JAMES E001
LIVINGSTON RIDGE FEDWD-1
JAMES A002
JAMES A004
JAMES RANCH UNIT070
JAMES A005
JAMES A006
JAMES E003
JAMES A008
JAMES A009
JAMES A010
JAMES E004
JAMES E005
LIVINGSTON RIDGE FED001
LIVINGSTON RIDGE FED006
LIVINGSTON RIDGE FED004
LIVINGSTON RIDGE FED002
LIVINGSTON RIDGE FED003
JAMES E012
JAMES E013
JAMES E014
JAMES E011
JAMES E006
JAMES E015
JAMES E008
JAMES RANCH UNIT048
JAMES E001
CABANA001
JAMES E006
JAMES A COM001
JAMES `E` FEDERAL16
JAMES A011
JAMES `E`2
JASMINE `AJI` FEDER
1003 Ft/In
PETRA 5/13/03 10:08:13 AM
Figure no. 5 – Map of Cabin Lake Area
2 1
11 12

Page no. 18
complex with little current understanding as to productive or injective
intervals (both Cherry Canyon and Brushy Canyon intervals are open in
producers and injectors) and (5) a source for make-up water is not readily
available. These hurdles are significant, consequently we believe expansion
of water injection in the Cabin Lake (Delaware) Field by ConocoPhillips
Company is unlikely and anticipate the status quo (disposal of produced
water) to be maintained.
The second area with response to water injection is found in the Livingston
Ridge (Delaware) Field. Again the wells with response to water injection are
indicated by orange circles (figure no 6). Three wells exhibited some
improvement in production, apparently due to water disposal in the Neff
Federal no. 3. However, producer response in this area is much poorer than
observed in the Cabin Lake (Delaware) Field even though injection volumes
are about the same at 2,000 barrels to 2,500 barrels of water per day.
In a 1995 SPE paper entitled Characterization of a Delaware Slope Basin
Reservoir for Optimal Development, Weiss, Ouenes and Sultan of New Mexico
Petroleum Recovery Research Center studied primary performance of the
East Livingston (Delaware) Field.
This field is located in township
22S 32E, about five miles east of
the WIPP site boundary. Their
work compared actual primary
performance to a reservoir model
consisting of seven layers, each
corresponding to a different
geological interval in the Brushy
Canyon formation. After matching
the model projected production to
three years of production data,
their work suggested a very low
primary recovery factor (0.67
percent) for the current 23
producing wells.10 This low primary
recovery is consistent with the
Avalon field with a projected
primary recovery of 1.5 percent.12
To improve total recovery, the
authors modeled both (1) an infill
drilling project and (2) a secondary
recovery project using two uneconomic producers converted to water
injection. For the water injection project, they concluded “the high watercut,
low oil recovery characteristics of the simulated waterflood suggest that it is
Zone: WELL - INJ_RESPONSE [RKH] 1.00 to 1.00
W
W
GETTY `24` FEDERALWD-5
NEFF FED003
GETTY 24 FED011
GETTY 24 FED015
GETTY 24 FED001
NEFF FED001
GETTY 24 FED002
GETTY 24 FED003
FEDERAL 26001
FEDERAL 23001
FEDERAL 23003
GETTY 24 FED004
NEFF FED002
FEDERAL 23005
FEDERAL 26005
GETTY 24 FED006
GETTY 24 FED007
GETTY 24 FED009
GETTY 24 FED010
FEDERAL 23002
GETTY FEDERAL 24001
FEDERAL 26002
WRIGHT-FED 231
FEDERAL /B/1
FEDERAL /A/1
934 Ft/In
PETRA 5/13/03 10:06:33 AM
Figure no. 6 – Map of Livingston Ridge Area
24
25
23
26

Page no. 19
not a viable strategy”.11 Jenkins suggested high interstitial water saturations
might result in inefficient flooding of the Delaware sands.13 Based on lack of
response to injection in this field, these conclusions seem reasonable.
7.0 Reservoir Fill-Up
As reservoir fluids (oil, gas, water) are
produced in undersaturated oil
reservoirs, reservoir pressure
decreases. The Delaware formation in
the study area is considered an
undersaturated oil reservoir based on
performance characteristics. The
accompanying graph (figure no. 7),
after Craft and Hawkins14, depicts how
pressure typically declines in solution-
gas drive reservoirs. (Please note, the
graph represents a typical solution-gas
drive reservoir, the Kelly Snyder Field
and is not calculated from any of the
fields in the study area.) As this graph illustrates, reservoir pressure
decreases as fluids are withdrawn (shown as recovery in per cent). The
pressure decrease is most pronounced above the bubble point when gas
remains in solution and fluid expansion is the dominant drive mechanism.
This is because reservoir fluids are relatively incompressible and small
changes in volume (v) translate into large changes in pressure (p).
Pressure changes more gradually once pressure falls below the bubble point
as expansion of the fluid is a combination of fluid expansion and increasing
gas saturation. Since the Delaware Mountain group formations produce
under a solution gas drive mechanism, average reservoir pressure decreases
with time, provided total withdrawals exceed total injection.
A survey of the water injection and salt water disposal wells in the study
area shows almost all injection is into the Delaware Mountain group. Hence
if total fluid production (oil, gas, water) is a larger volume (at reservoir
conditions) than total fluid injection (water) the average reservoir pressure
has decreased with time. This assumes the injection is evenly distributed
throughout the reservoir such that no area receives a disproportionate
injection volume in relation to production. This assumption will, for now, be
accepted, but will be shown later in this discussion to be correct. The
accompanying graph (figure no. 8) shows the injection / withdraw ratio as a
function of time for the Delaware Mountain Group.
Figure no. 7 –Reservoir Pressure vs. Recovery

Page no. 20
0%
20%
40%
60%
80%
100%
120%
1992 1993 1994 1995 1996 1997 1998 1999 2000 2001 2002 2003 2004 2005 2006 2007 2008 2009 2010 2011 2012 2013 2014
Inje
ctio
n to
With
draw
Rat
io
Time
This graph shows the injection to withdraw ratio, although gradually
climbing, remains less than unity. Consequently, (1) withdraws continue to
outpace injection, (2) reservoir voidage continues to increase and (3) reservoir
pressure in the Delaware Mountain Group formations is declining. The
current net voidage is approximately 156,000,000 reservoir barrels. If the
present water injection rate of 2,400,000 barrels of water per month were to
double, it would take approximately 2.5 years just to fill-up the current
voidage. This calculation assumes production continues on the current
decline trend.
When compared to the prior 2008 study, water injection is essentially the
same at a 2012 average of 75,000 barrels of water per day versus 74,100
barrels of water per day during 2007.
Figure no. 8 – Injection to Withdraw Ratio vs. Time in Study Area

Page no. 21
The maximum volume of any injection well is 7,945 barrels of water per day
for the Todd 36 State no. 1 in October 2012. This volume represents
approximately 10 percent of the total volume injected in the study area. The
section with the most injection is section 36 in 23S 31E with an average
injection of 6,816 barrels of water per day into one well representing about
9.0 percent of the total. Twelve additional sections have average injection
ranging from 6,280 barrels of water per day to 2,000 barrels of water per day.
The thirteen sections with the highest injection volumes account for 55
percent of the total injection in the study area. These thirteen sections are
scattered throughout the area, one is in township 21S 31E, one is in township
22S 31E, three are in township 22S 32E, one is in township 22S 30E, two are
in township 23S 31E, two are in township 23S 31E, one is in township 21S
32E, and two are in 23S 30E. Consequently, injection is rather evenly
distributed, with no single area receiving a disproportionate volume of water.
8.0 Data Acquisition
The data used herein consists primarily of two types of information, well
volume data and well testing data. The well volumes of oil, gas, water and
water injection were obtained from a combination of sources including the
New Mexico Oil Conservation Division, New Mexico Oil & Gas Engineering
Committee and Lasser Production Data, Inc. Lasser maintains a proprietary
database derived from public records. Well test data were obtained from well
files at the NMOCD office in Santa Fe, New Mexico and from the Risk Based
Data Management System (RBDMS) database in the OCD District I office in
Hobbs, New Mexico and the OCD District II office in Artesia, New Mexico.
All data were obtained during May and June 2013 and include all data
available through December 2012.

Page no. 22
9.0 Conclusions
Based upon a study of both producing and injection wells in the nine
township study area, we offer the following conclusions:
1. Ongoing development of oil and gas bearing reservoirs in the study
area will continue throughout the next five years provided economic
returns remain favorable (i.e. oil and gas prices and drilling costs
remain comparable). Horizontal development accounts for nearly all
new well drilling in the Delaware and Bone Spring formations. The
rate of drilling for the Delaware Mountain Group (Cherry Canyon,
Brushy Canyon) oil wells is projected at 40 to 60 wells per year.
Pennsylvanian gas well completions in the Atoka and Morrow
formations are not attractive at current gas prices. New SWD wells
will be needed to handle the additional volumes of produced water
from new oil and gas wells.
2. Improving commodity prices encourage additional drilling activity. If
oil and gas prices remain relatively constant, the drilling rates
suggested in conclusion no. 1 are reasonable. Should commodity prices
drop, then fewer wells will likely be drilled. Conversely, should
commodity prices rise, then drilling will likely proceed at a faster pace.
3. Strawn and Wolfcamp reservoirs alone offer poor economics. These
reservoirs, however, are reasonable targets in existing wells as deeper
Atoka and Morrow sands become depleted.
4. The depositional environments in this region of the Delaware Basin
suggest small, discontinuous reservoirs. Well performance and
geological interpretation further support the concept of
compartmentalized reservoirs.
5. For the study area, water injection into the Delaware Mountain Group
formations is principally a water disposal operation. Therefore water
injection volumes are virtually the same as produced water volumes.
Several significant factors, such as poor response to injection and lack
of economic feasibility, are disincentives to waterflooding of the
Delaware reservoirs. Therefore, the status quo should continue and
any increases in water injection should simply mirror increases in
water production.
6. NMOCD regulations governing the operation of SWD and injection
wells appear to successfully control the injection pressures and

Page no. 23
mechanical failures of said wells. Mechanical failure rates are low and
water injection out of zone rarely occurs under these conditions.
However, during the past five years, the NMOCD has experienced
difficulty in consistently applying these regulations to schedule,
monitor, and record MIT and BHT tests. We believe this represents a
significant shortfall in the enforcement of the New Mexico regulations
and should be corrected. Although it is beyond the scope of this report
to identify improvements, we do observe the active injector well count
in the study area has increased 14 percent in five years with virtually
no change in staffing levels at the OCD District Offices.
7. Reservoir voidage in the Delaware Mountain Group formations
continues to increase. Consequently average reservoir pressure is
declining.
8. Mandated testing ensures that mechanical failure of tubing, packer or
casing is routinely detected and repaired. Furthermore, operators
observe the statutory maximum injection pressures, thereby
preventing out-of-zone fracturing. Operators of SWD wells generally
seek to maintain low injectivity pressure and thereby minimize
pumping costs. Such preferred lower pressures further reduce the
potential for fracturing and migration out-of-zone. As drilling
increases so will the need to dispose increased volumes of produced
waters. Careful and prudent operation of disposal wells, as well as
consistent enforcement of the governing injection rules, are important
to help insure the injected waters are retained in the intended zones.

Page no. 24
1. Kirkes, G. Ross and Evans, Ronald D. “Injection Methods: Current
Practices and Failure Rates in the Delaware Basin”, DOE/WIPP-97-2240,
June 1997
2. Craig, Forrest F. Jr. The Reservoir Engineering Aspects of
Waterflooding. Monograph Vol. 3: Society of Petroleum Engineers of
AIME, 1971.
3. New Mexico, Title 19 Natural Resources & Wildlife, Chapter 15 Oil &
Gas, Part 9 Secondary or Other Enhanced Recovery, Pressure
Maintenance, Salt Water Disposal, and Underground Storage, February
1, 1996
4. Earlougher, Robert C. Jr. Advances in Well Test Analysis Monograph
Vol. 5: Society of Petroleum Engineers of AIME, 1977
5. Catalano, and Markus D. Thomerson, “Reservoir Characteristics and
Petrophysical Analysis of the Upper Brushy Canyon Sandstones, East
Livingston Ridge Delaware Field Lea County, New Mexico.” A
Symposium of Oil and Gas Fields of Southeastern New Mexico. New
Mexico: Roswell Geological Society 1995.
6. Cook, V. O. “Regional Geology of the Delaware Basin.” Journal of
Petroleum Technology (1966) : 1260-1266
7. Roberts, and Kevin M. Kohles, “The Morrow of Southeastern New
Mexico: A Detailed Look at the Big Picture.” A Symposium of Oil and Gas
Fields of Southeastern New Mexico. New Mexico: Roswell Geological
Society 1999.
8. Mallan, and Robert R. Casavant, “Facies and Reservoir Characterization
of the Morrow Sandstones, White City Penn Gas Pool, Eddy County, New
Mexico.” A Symposium of Oil and Gas Fields of Southeastern New
Mexico. New Mexico: Roswell Geological Society 1999.
9. Hall, Russell K. Memo to McCombs Energy. Houston, Texas. 20 March
2003.
10. W. Weis, A. Ouenes, A. Sultan, and New Mexico Petroleum Recovery
Research Center, “Characterization of a Delaware Slope Basin Reservoir
for Optimal Development.” SPE Paper 29597, presented at the SPE
Rocky Mountain Regional/Low-Permeability Reservoirs Symposium held
in Denver, CO, U.S.A., 20-22 March 1995.

Page no. 25
11. Mayhew, R: “Avalon (Delaware) Field, Report of the Technical Committee
for the Working Interest Owners,” To be presented to the New Mexico Oil
Conservation Division in 1995.
12. Kane, and D.L. Cantrell, “Production History and Geology Avalon
(Delaware) Field.” A Symposium of Oil and Gas Fields of Southeastern
New Mexico. New Mexico: Roswell Geological Society 1995.
13. Jenkins, Ralph E. “Characteristics of the Delaware Formation.” Journal
of Petroleum Technology (1961) : 1230-1236
14. B. C. Craft and M. F. Hawkins. Applied Petroleum Reservoir
Engineering. New Jersey: Prentice-Hall, 1959
15. EPA (U.S. Environmental Protection Agency), 1993. 40 CFR Part 191,
Environmental Radiation Protection Standards for the Management and
Disposal of Spent Nuclear Fuel, High-Level and Transuranic Radioactive
Wastes; Final Rule. Federal Register, Vol. 58, No. 242, jpp. 66398-66416,
December 20, 1993. Office of Radiation and Indoor Air: Washington, D.C.


