Water Management Information System for the Rio Bravo/Grande basin Recent achievements Carlos Patino-Gomez Daene C. McKinney David R. Maidment Center for Research in Water Resources UNIVERSITY OF TEXAS AT AUSTIN 10,100 Burnet Road Building 119 Austin, Texas 78758 Tel: (512) 471-0073 Fax: (512) 471-0076 [email protected]
Transcript
Water Management Information System for the Rio Bravo/Grande basin
Recent achievements
Carlos Patino-Gomez Daene C. McKinney David R. Maidment
Center for Research in Water Resources UNIVERSITY OF TEXAS AT AUSTIN
Water Management Information System for the Rio Grande/Bravo basin
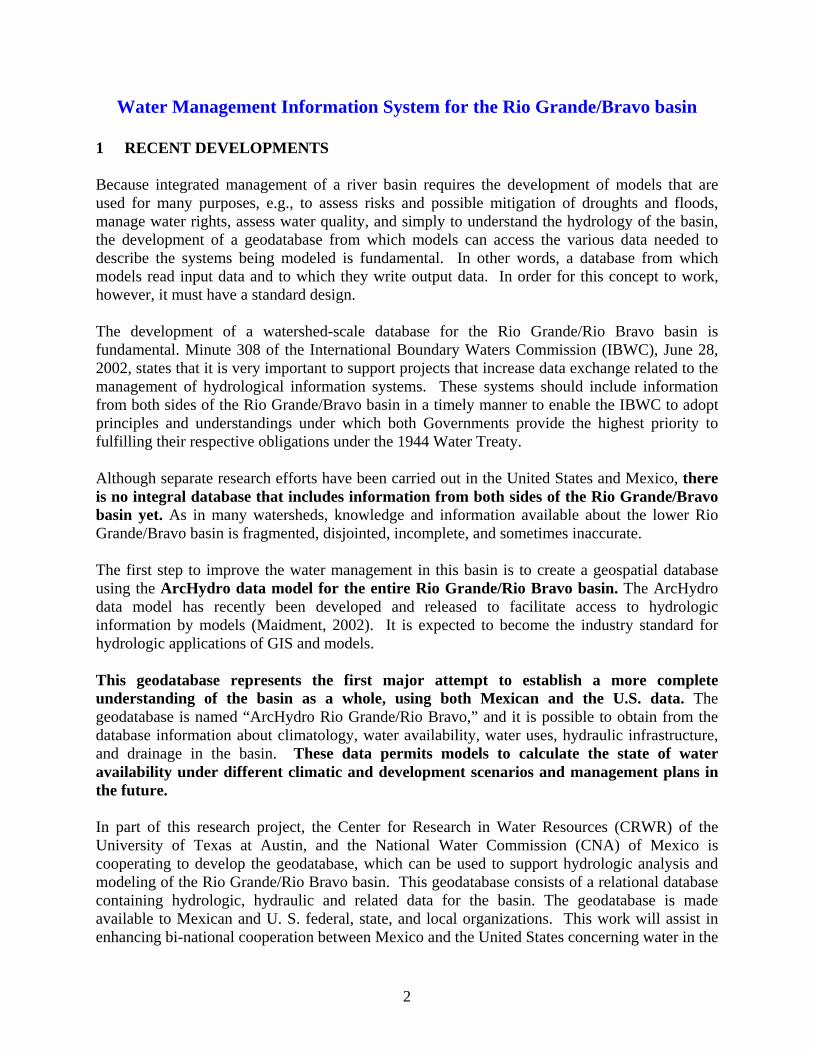
1 RECENT DEVELOPMENTS Because integrated management of a river basin requires the development of models that are used for many purposes, e.g., to assess risks and possible mitigation of droughts and floods, manage water rights, assess water quality, and simply to understand the hydrology of the basin, the development of a geodatabase from which models can access the various data needed to describe the systems being modeled is fundamental. In other words, a database from which models read input data and to which they write output data. In order for this concept to work, however, it must have a standard design. The development of a watershed-scale database for the Rio Grande/Rio Bravo basin is fundamental. Minute 308 of the International Boundary Waters Commission (IBWC), June 28, 2002, states that it is very important to support projects that increase data exchange related to the management of hydrological information systems. These systems should include information from both sides of the Rio Grande/Bravo basin in a timely manner to enable the IBWC to adopt principles and understandings under which both Governments provide the highest priority to fulfilling their respective obligations under the 1944 Water Treaty. Although separate research efforts have been carried out in the United States and Mexico, there is no integral database that includes information from both sides of the Rio Grande/Bravo basin yet. As in many watersheds, knowledge and information available about the lower Rio Grande/Bravo basin is fragmented, disjointed, incomplete, and sometimes inaccurate. The first step to improve the water management in this basin is to create a geospatial database using the ArcHydro data model for the entire Rio Grande/Rio Bravo basin. The ArcHydro data model has recently been developed and released to facilitate access to hydrologic information by models (Maidment, 2002). It is expected to become the industry standard for hydrologic applications of GIS and models. This geodatabase represents the first major attempt to establish a more complete understanding of the basin as a whole, using both Mexican and the U.S. data. The geodatabase is named “ArcHydro Rio Grande/Rio Bravo,” and it is possible to obtain from the database information about climatology, water availability, water uses, hydraulic infrastructure, and drainage in the basin. These data permits models to calculate the state of water availability under different climatic and development scenarios and management plans in the future. In part of this research project, the Center for Research in Water Resources (CRWR) of the University of Texas at Austin, and the National Water Commission (CNA) of Mexico is cooperating to develop the geodatabase, which can be used to support hydrologic analysis and modeling of the Rio Grande/Rio Bravo basin. This geodatabase consists of a relational database containing hydrologic, hydraulic and related data for the basin. The geodatabase is made available to Mexican and U. S. federal, state, and local organizations. This work will assist in enhancing bi-national cooperation between Mexico and the United States concerning water in the
2
Rio Grande basin, providing accurate and reliable data necessary for analysis and resolution of water resources issues. The process to create the Rio Grande/Bravo geodatabase is described below: 1.1 Collection of the geo-spatial data from original sources
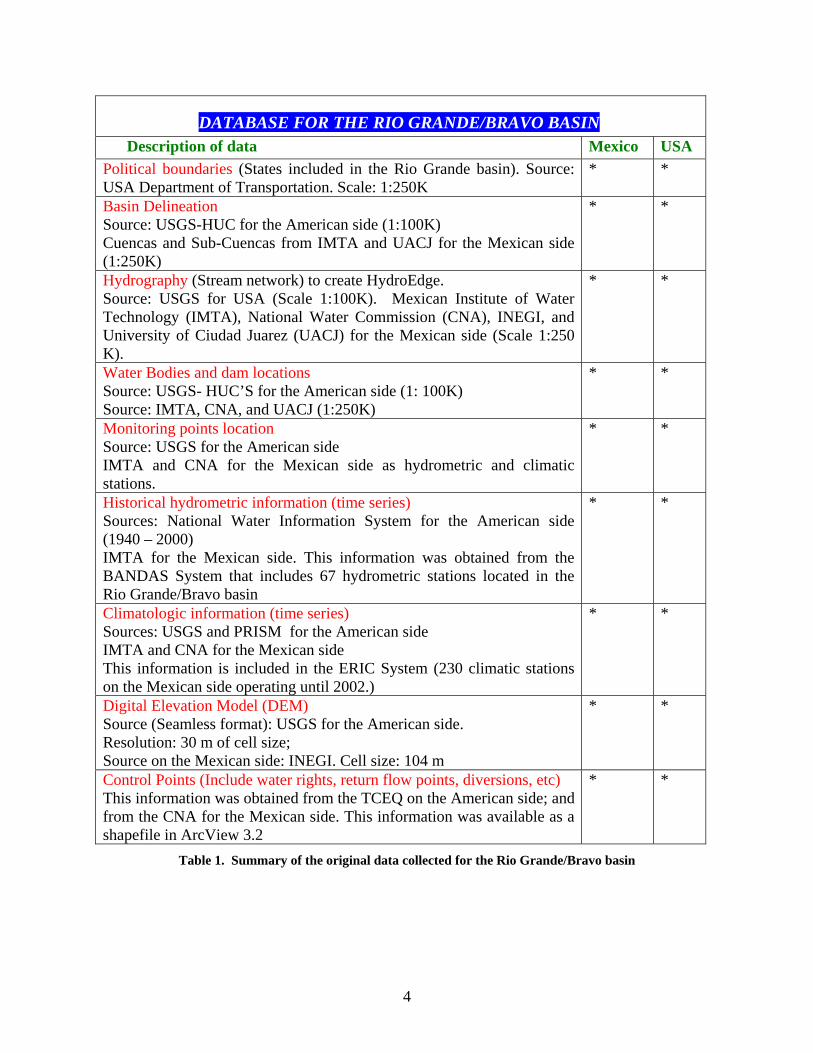
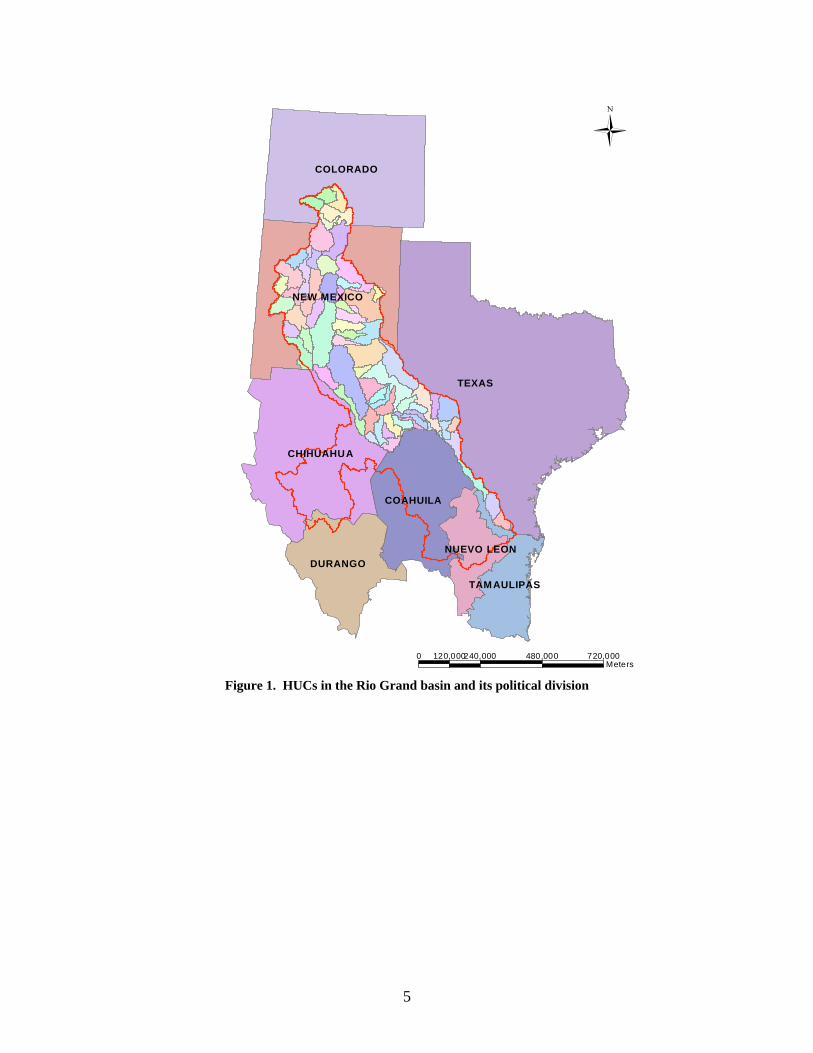
Hydrological information was obtained from Mexican and U.S. agencies in this step of the project. The political boundaries, river network, water bodies and gauging stations on the Mexican side were collected from the CNA, IMTA, University of Ciudad Juarez (UACJ), and INEGI. A travel to Mexico was made to achieve this step. The information for the American side was obtained from the USGS, TCEQ, TNRIS, among others agencies. Some of this information was downloaded from Internet, as well as directly from the agencies’ offices. The data collected from the original sources are included in the table 1, as well as some of the data characteristics. Several errors were found in the hydrological information as wrong positions of some control points, disconnection in the river network, wrong location of some water bodies, etc. Part of the original information is shown in figures 1 through 3.
3
DATABASE FOR THE RIO GRANDE/BRAVO BASIN Description of data Mexico USA
Political boundaries (States included in the Rio Grande basin). Source: USA Department of Transportation. Scale: 1:250K
* *
Basin Delineation Source: USGS-HUC for the American side (1:100K) Cuencas and Sub-Cuencas from IMTA and UACJ for the Mexican side (1:250K)
* *
Hydrography (Stream network) to create HydroEdge. Source: USGS for USA (Scale 1:100K). Mexican Institute of Water Technology (IMTA), National Water Commission (CNA), INEGI, and University of Ciudad Juarez (UACJ) for the Mexican side (Scale 1:250 K).
* *
Water Bodies and dam locations Source: USGS- HUC’S for the American side (1: 100K) Source: IMTA, CNA, and UACJ (1:250K)
* *
Monitoring points location Source: USGS for the American side IMTA and CNA for the Mexican side as hydrometric and climatic stations.
* *
Historical hydrometric information (time series) Sources: National Water Information System for the American side (1940 – 2000) IMTA for the Mexican side. This information was obtained from the BANDAS System that includes 67 hydrometric stations located in the Rio Grande/Bravo basin
* *
Climatologic information (time series) Sources: USGS and PRISM for the American side IMTA and CNA for the Mexican side This information is included in the ERIC System (230 climatic stations on the Mexican side operating until 2002.)
* *
Digital Elevation Model (DEM) Source (Seamless format): USGS for the American side. Resolution: 30 m of cell size; Source on the Mexican side: INEGI. Cell size: 104 m
* *
Control Points (Include water rights, return flow points, diversions, etc) This information was obtained from the TCEQ on the American side; and from the CNA for the Mexican side. This information was available as a shapefile in ArcView 3.2
* *
Table 1. Summary of the original data collected for the Rio Grande/Bravo basin
4
0 240,000 480,000 720,000120,000Meters
TEXAS
NEW MEXICO
COLORADO
CHIHUAHUA
COAHUILA
DURANGO
TAMAULIPAS
NUEVO LEON
Figure 1. HUCs in the Rio Grand basin and its political division
5
CHIHUAHUA
DURANGO
TAMAULIPAS
COAHUILA DE ZARAGOZA
NUEVO LEON
Estados
Cuencas RH24P. FALCON - R. SALADOR. BRAVO - CD. JUAREZR. BRAVO - MATAMOROS - REYNOSAR. BRAVO - NUEVO LAREDOR. BRAVO - OJINAGAR. BRAVO - P. DE LA AMISTADR. BRAVO - PIEDRAS NEGRASR. BRAVO - SAN JUANR. BRAVO - SOSAR. CONCHOS - OJINAGAR. CONCHOS - P. DE LA COLINAR. CONCHOS - P. EL GRANEROR. FLORIDOR. SAN PEDRO
hidrografia
N
EW
S Figure 2. Cuencas, Sub Cuencas and original hydrography of the Rio Bravo basin on the Mexican side
6
TEXAS
CHIHUAHUA
NEW MEXICO
COAHUILA
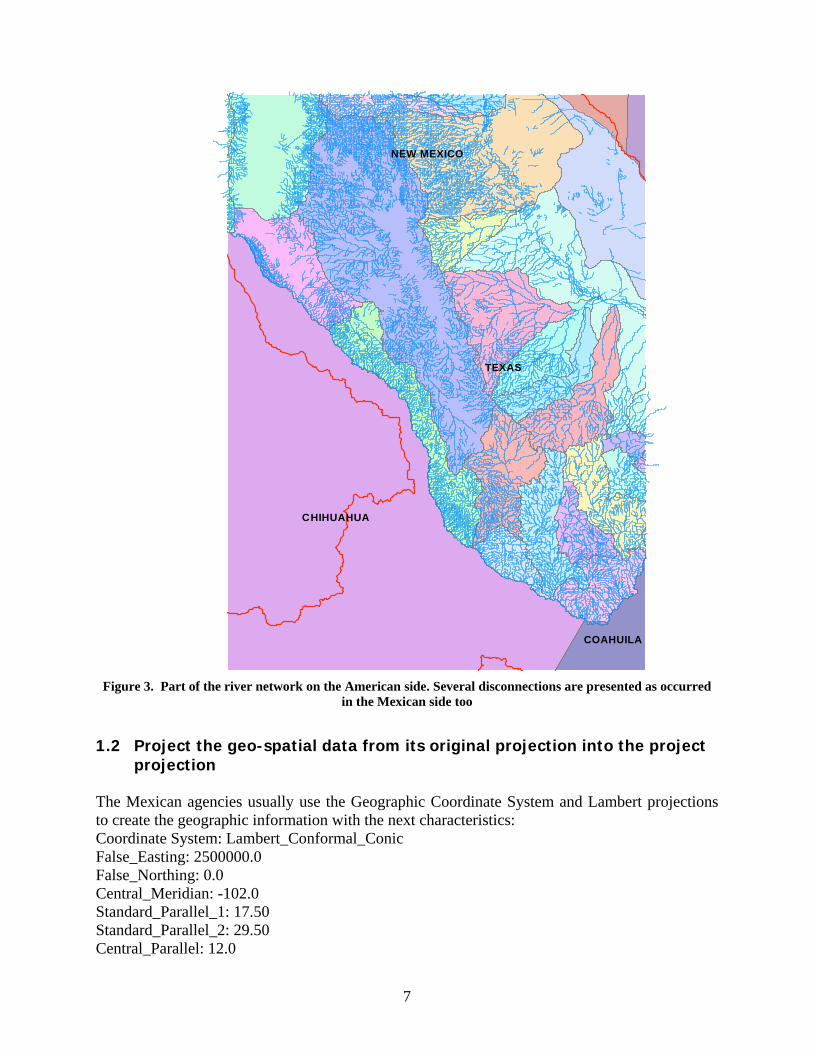
Figure 3. Part of the river network on the American side. Several disconnections are presented as occurred
in the Mexican side too
1.2 Project the geo-spatial data from its original projection into the project
projection The Mexican agencies usually use the Geographic Coordinate System and Lambert projections to create the geographic information with the next characteristics: Coordinate System: Lambert_Conformal_Conic False_Easting: 2500000.0 False_Northing: 0.0 Central_Meridian: -102.0 Standard_Parallel_1: 17.50 Standard_Parallel_2: 29.50 Central_Parallel: 12.0
7
GCS_North_American_1927 Datum: D_North_American_1927 Prime Meridian: 0 The Albers equal area projection was proposed for the project projection in order to preserve the areas, as well as a more recent Datum so the data conforms to most international datasets. The central meridian was located at the middle of the Rio Grande Bravo basin, approximately. The proposed characteristics for the project projection are shown below. Coordinate System: Albers Conical Equal Area False_Easting: 1000000.0 False_Northing: 1000000.0 Central_Meridian: -100.0 Standard_Parallel_1: 27.416667 Standard_Parallel_2: 34.916667 Latitude_Of_Origin: 31.166667 GCS_North_American_1983 Datum: D_North_American_1983 Prime Meridian: 0 This new projection was called Rio Grand Mapping System (RGMS) 1.3 Clip or merge the geo-spatial data sets depending on their original
extent Data distributed on a national or state level had to be clipped; while data distributed at a county or Hydrologic Cataloging Unit level, had to be merged into a single and larger data set. With respect to the DEM, the original tiles from the USGS were reprojected and merged. After that, this bigger DEM, which included more than one state, was clipped based on the basin boundaries. The original DEM for Mexico was clipped based on the basin boundaries too. The results of this step are shown in figure 4.
8
02
1113
06
07
04
05
15
12
01
1408
03
16
10
09
Rio Grande/Bravo basinCell size: 30 m (Seamless format)Projection: Albers; NAD 1983
Figure 4. Clipped DEMs for the basin including a 10 Km buffer
1.4 Import the data sets into a feature dataset of a geodatabase This step included the processing the available information into the ArcHydro Rio Grande/Bravo geodatabase. Several feature datasets were created that include the feature classes related to each type of information. The whole basin was divided into 9 hydrological subregions on the U.S. side and 7 hydrological subregions on the Mexican side, in order to apply the ArcHydro tools subregion by subregion (figures 5-7).
9
0 240,000 480,000 720,000 960,000120,000Meters
TEXAS
NEW MEXICO
COLORADO
CHIHUAHUA
COAHUILA
DURANGO
TAMAULIPAS
NUEVO LEON
Figure 5. Rio Grande/Bravo basin including HUC’S on the American side; as well as Cuencas and
SubCuencas on the Mexican side projected into the RGMS projection
10
0 260 520 780 1,040130Kilometers
1302
1306
1307
1304
1305
1301
1303
1308
1309
TEXAS
NEW MEXICO
COLORADO
CHIHUAHUA
COAHUILA
DURANGO
TAMAULIPAS
NUEVO LEON
24022404
2406
24032405
2407
2401
Figure 6. Hydrological subregions of the basin, according to the new classification
11
TEXAS
NEW MEXICO
CHIHUAHUA
COAHUILA
COLORADO
DURANGONUEVO LEON
TAMAULIPAS
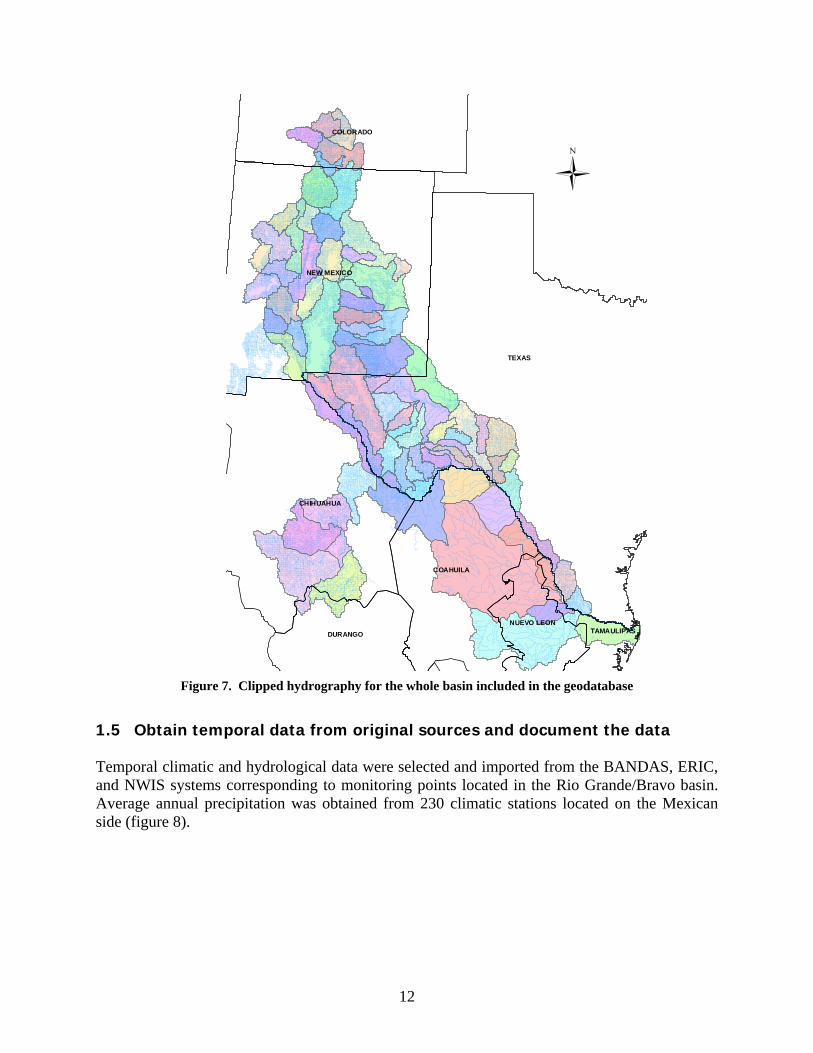
Figure 7. Clipped hydrography for the whole basin included in the geodatabase
1.5 Obtain temporal data from original sources and document the data Temporal climatic and hydrological data were selected and imported from the BANDAS, ERIC, and NWIS systems corresponding to monitoring points located in the Rio Grande/Bravo basin. Average annual precipitation was obtained from 230 climatic stations located on the Mexican side (figure 8).
12
0 100 200 300 400 50050Kilometers
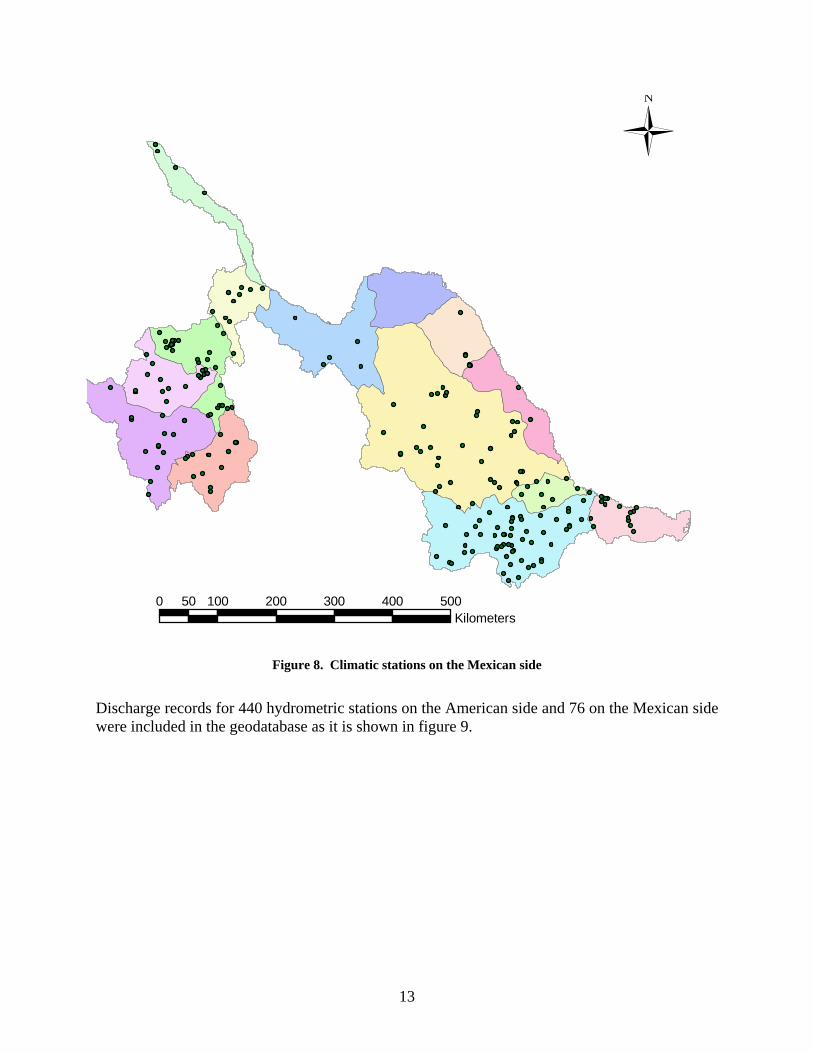
Figure 8. Climatic stations on the Mexican side
Discharge records for 440 hydrometric stations on the American side and 76 on the Mexican side were included in the geodatabase as it is shown in figure 9.
Figure 9. Hydrometric stations on the Rio Grande/Bravo basin
1.6 Import time series into the geodatabase The ArcGIS format will be applied to all temporal data obtained in the last step in order to include and relate the time series to the monitoring and control points in the geodatabase
1.7 Apply the WRAPHydro tools to all hydrological subregions A particular schema was applied to every hydrological subregion in order to create all necessary fields that were populated by the WRAPHydro tools. The WRAP Hydro data model has been derived from the Arc Hydro model and is tailored specifically for the WRAP project developed jointly with the Texas Commission for
14
Environmental Quality (TCEQ). The WRAPHydro data model is structured to suit the needs of the WRAP parameter processing. The feature classes and fields those are required for the WRAP process are retained, those that are not are removed and some others that do not exist in the ArcHydro Framework and are required by the WRAP process are added. The WRAP Hydro tools consist of a set of public domain utilities developed on top of the Arc Hydro data model. They operate in the ArcGIS ArcMap environment. Some of the functions require the Spatial Analyst extension. Arc Hydro is a water resources data model that defines attributes, relationships, and connectivity between hydrologic features in a GIS database. Many of the terms and concepts used by the WRAP Hydro tools stem from Arc Hydro. For more information on Arc Hydro, see the Arc Hydro Online Support System at http://www.crwr.utexas.edu/giswr/hydro/ArcHOSS/main.htm.
The WRAP Hydro tools operate using a certain database design. This design should be in place before using the WRAP Hydro tools. The tools are accessed through the WRAP Hydro tools toolbar, where they are grouped by functions into two menus and five buttons. The purpose of this toolkit is to process GIS data in order to calculate parameters used by the Water Rights Analysis Package (WRAP). These parameters are tabulated for each ControlPoint and include:
• Average curve number • Average annual precipitation • Total upstream drainage area • Next downstream ControlPoint
1.8 Application of a regional HydroID A unique identification number called Regional HydroID was assigned to every feature class (River Network and Control Points mainly for the WRAPHydro process) that includes ten digits according to the next classification
• The first digit (blue box) describes the hydrological region. The region 13 on the American side was identified with the number 1, and the number 2 identified the region 24 on the Mexican side
• The second 2 digits (yellow boxes) describe the Hydrologic SubRegion. The basin is divided in 9 subregions on the American side and 7 subregions for the Mexican side
• The next two digits (red boxes) correspond to the feature class. o The value 01 was assigned for the ControlPoint feature class o The value 02 was assigned for the WRAPEdge (River network) o WaterBody was identified as 03 o Watershed was identified as 04 o And so on
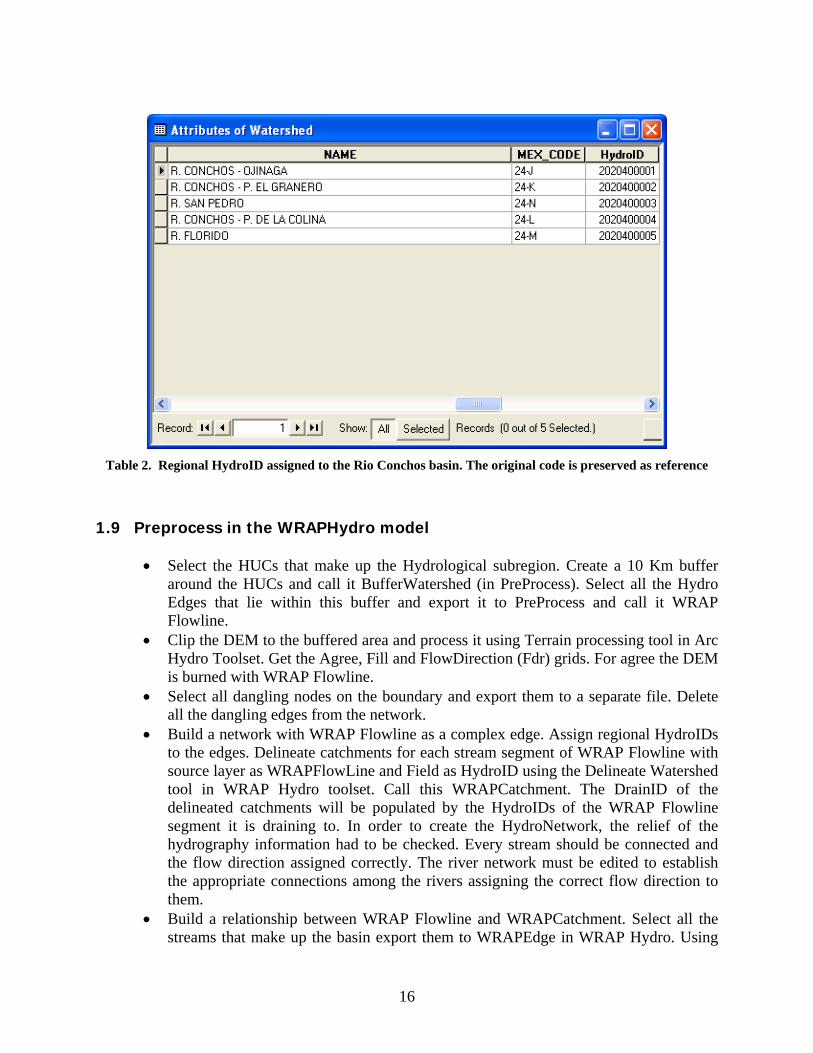
• The last five digits (green boxes) describe the feature number, which could reach until 99999 positions. The Regional HydroID for the Rio Conchos basin is shown in the table 2.
15
Table 2. Regional HydroID assigned to the Rio Conchos basin. The original code is preserved as reference
1.9 Preprocess in the WRAPHydro model
• Select the HUCs that make up the Hydrological subregion. Create a 10 Km buffer around the HUCs and call it BufferWatershed (in PreProcess). Select all the Hydro Edges that lie within this buffer and export it to PreProcess and call it WRAP Flowline.
• Clip the DEM to the buffered area and process it using Terrain processing tool in Arc Hydro Toolset. Get the Agree, Fill and FlowDirection (Fdr) grids. For agree the DEM is burned with WRAP Flowline.
• Select all dangling nodes on the boundary and export them to a separate file. Delete all the dangling edges from the network.
• Build a network with WRAP Flowline as a complex edge. Assign regional HydroIDs to the edges. Delineate catchments for each stream segment of WRAP Flowline with source layer as WRAPFlowLine and Field as HydroID using the Delineate Watershed tool in WRAP Hydro toolset. Call this WRAPCatchment. The DrainID of the delineated catchments will be populated by the HydroIDs of the WRAP Flowline segment it is draining to. In order to create the HydroNetwork, the relief of the hydrography information had to be checked. Every stream should be connected and the flow direction assigned correctly. The river network must be edited to establish the appropriate connections among the rivers assigning the correct flow direction to them.
• Build a relationship between WRAP Flowline and WRAPCatchment. Select all the streams that make up the basin export them to WRAPEdge in WRAP Hydro. Using
16
the relationship, select those catchments that drain to the selected streams. Export these catchments to a separate file. Dissolve all the polygons to create a single polygon ‘basin’ which defines the boundary of the basin. The figure 10 describes the comparison between the SubCuencas at the Rio Conchos basin defined by INEGI (Red line) and the WRAPWatershed defined by the WRAPHydro Tools (color polygons). The SubCuencas were defined using a topographic map 1:250K, while the WRAPWatershed feature considered a WRAPEdge 1:100K (from a digitalized map) and a DEM resolution of 30 m close to the border, and 90 m for the rest of the Rio Conchos sub basin. The green points correspond to the WRAP Junctions located on the geometric network, while the black points represent the related water rights and return flow control points.
• Create a mask of basin and clip the Fdr grid to it • Copy the BaseControlPoint feature class to PreProcess feature dataset and call it
SnapControlPoint. Change the location of the junctions so that they lie within 15 m from the WRAPFlowLine. Delete the old network and build a new one with SnapControlPoint and WRAPFlowLine and snap the junctions to the edges by giving a 15 m snapping tolerance. Make sure all the junctions are snapped. Assign flow directions. Do a find connected task by changing the tracing options to selection. Export all the selected SnapControlPoint features to WRAPJunction.
17
Created by Carlos PatinoCRWR - UTMay, 2003
0 67,500 135,000 202,500 270,00033,750Meters
!(
!(
!(
!(
!(
!(
!(
!(!(
!(
!(
!(
!(
!(
!(
!(
!(
!(
!(
!(
!(
!(
!(
!(
!(
!(
!(
!(
!(
!(
!(
!(
!(!(!(!(
!(
!(
&
&
&
&
&
&
&
&
&
&
&
&
&
&
&
&
&
&
&
&
&&
&&&
&
&
&
&
&
&
&
&
&
&
&
&
&
&
&
&
&
&
&
&
&
&
&
&
&
&
&
Figure 10. Delineation of the Rio Conchos basin
1.10 Final Parameter Processing
• Export the BaseControlPoint file to WRAPHydro and call it ControlPoint. • Build a network with WRAPJunction and WRAPEdge, with WRAPEdge as a simple
edge feature and a 15 m snapping tolerance. Assign flow directions to the network. Make a copy of the WRAPJunction feature class. Delete all the features from WRAPJunction and load the features back in from the ‘copy’ file using the Load objects command. This is done to split the edges on points where junctions are located. After loading the Junctions the flow directions have to be set again for the WRAPEdge feature class.
18
1.11 Calculating hydrological parameters in WRAPHydro
• Next Downstream ID: the flow direction has to be set before running this tool. This parameter is populated in the NextDownID field in the WRAPJunction feature class. Find Next Downstream Junction in the ArcHydro toolset is used. For any junction that does not have a next down id, the field is populated as -1. This also serves as a check to see if all the NextDownIDs are correctly populated.
• Length to Outlet: this parameter is populated in the LengthDown field in WRAPJunction. The Calculate Length Downstream tool in ArcHydro Toolset is used. The value obtained is in meters. This has to be converted to miles for the WRAP model.
• Upstream area Delineation: To find the total area that drains into each control point, incremental watersheds are delineated for each junction and their value is accumulated downstream. The delineation process is done using the WRAP HYDRO toolset. The feature classes and grid names are specified in the layer tab in settings, default fields are used in the fields tab and the WRAPEdge is specified as the source layer for delineation with JunctionID as source attribute in the options tab. The Ids to edges tool is used to populate the JunctionID field in WRAPEdge with the HydroID of the next downstream junction. Thus, all the Edges between two junctions will have the same JunctionID. Once all the JunctionIDs are populated, the Delineate Watersheds tool is used to delineate watersheds for each junction. The watersheds are delineated using the WRAPFdr flow direction grid to the Edges and the feature class is called WRAPWatershed. The HYDROIDs of the WRAPJunction are populated to the JunctionIDs of the WRAPEdge which are in turn populated to the DrainIDs of the WRAPWatershed.
• Watershed Drain Area, Average Curve Number and Average precipitation: These values are populated in the DrainArea, AvgCN and AvgPR fields in the WRAPWatershed feature. These are incremental values for each delineated watershed. The Average value of Curve Number and Annual Precipitation for each Watershed is the mean of all the cell values within that area. The drainage area was obtained in square miles for the WRAP model, but it can be gotten in square kilometers too.
• Consolidating attributes: Once the incremental values for the drain area, curve number and annual precipitation have been determined for each feature in WRAPWatershed, these values are consolidated to add in the effects of all the area that is upstream of each junction. This is done using the ‘Accumulate CN, Precip and Area’ tool in the WRAPHydro toolset. The drain area values are added downstream and are stored in the Drain_Area field in the WRAPJunction. The curve number and precipitation values are populated in the AvgCN and AvgPR fields in the WRAPJunction by taking a weighted average of the respective values over each watershed.
1.12 Copying attributes to coincident features The CP tools in the WRAP Hydro toolset are used. The ‘Params to control point’ tool copies the HydroIDs of WRAPJunction to the JunctionID field of coincident features of SnapControlPoint
19
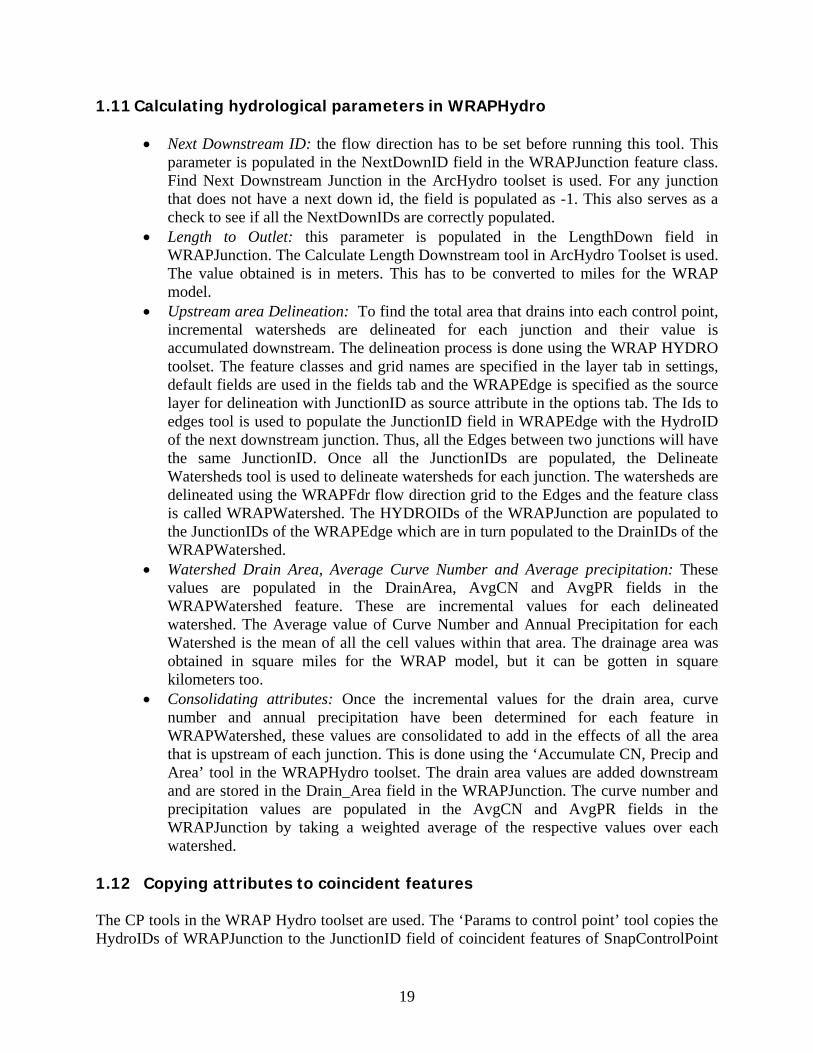
feature class. The Attribute table of SnapControlPoint feature class is joined with the attribute table of ControlPoint feature class with ObjectID as the common field and copy the JunctionID from the SnapControlPoint into the JunctionID field of the ControlPoint feature class. Choose the ControlPoint as the input file in the “ControlPoint” window of the WRAPHydro settings. For each match of HydroID in WRAPJunction with JunctionID in Control Point, the respective attributes for LengthDown, DrainArea, AvgCN and AvgPR values are copied from WRAPJunction to ControlPoint. The figure 11 shows the completed results of the WRAPHydro process applied to the Rio Grande/Bravo basin from Ciudad Juarez – El Paso until the Gulf of Mexico, which include the hydrography, control points in both sides of the basin, as well as the average precipitation, CN, and drainage area parameters among the others.
WRAPEdgeUSAWRAPEdgeMexico
ControlPointUSA
ControlPointMexico
0 225 450 675 900112.5Kilometers
TEXAS
NEW MEXICO
COLORADO
CHIHUAHUA
COAHUILA
DURANGO
TAMAULIPAS
NUEVO LEON
Figure 11. Final results of the WRAPHydro process applied to the whole basin
20
21
1.13 Regionalization process The regionalization technique allows a large region to be divided into hydrological distinct subregions where raster analyses may be performed in a feasible manner. When working with huge basins like the Rio Grande/Bravo basin, the computer processor might not be able to handle the large datasets, especially the raster processing part. This is dealt with by dividing the basin into sub regions and processing grids individually for each region. The results from each sub basin are merged on the vector side for determining parameters. In order to verify the validity of dividing a basin for processing without compromising on the accuracy of the parameter values determined, the Rio Grande/Bravo basin divided in 9 hydrological subregions on the American side and 7 subregions on the Mexican side according to the USGS and CNA distribution respectively, as it is shown in the figure 12.
0 200,000 400,000 600
,000 800,000Meters
Fig 12. Hydrological subregions of the whole basin
02
0204
06
07
04
05
06
03
01
0508
03
07
01
09
UT-CRWRCreated by Carlos PatinoFebruary 17, 2003
j ;
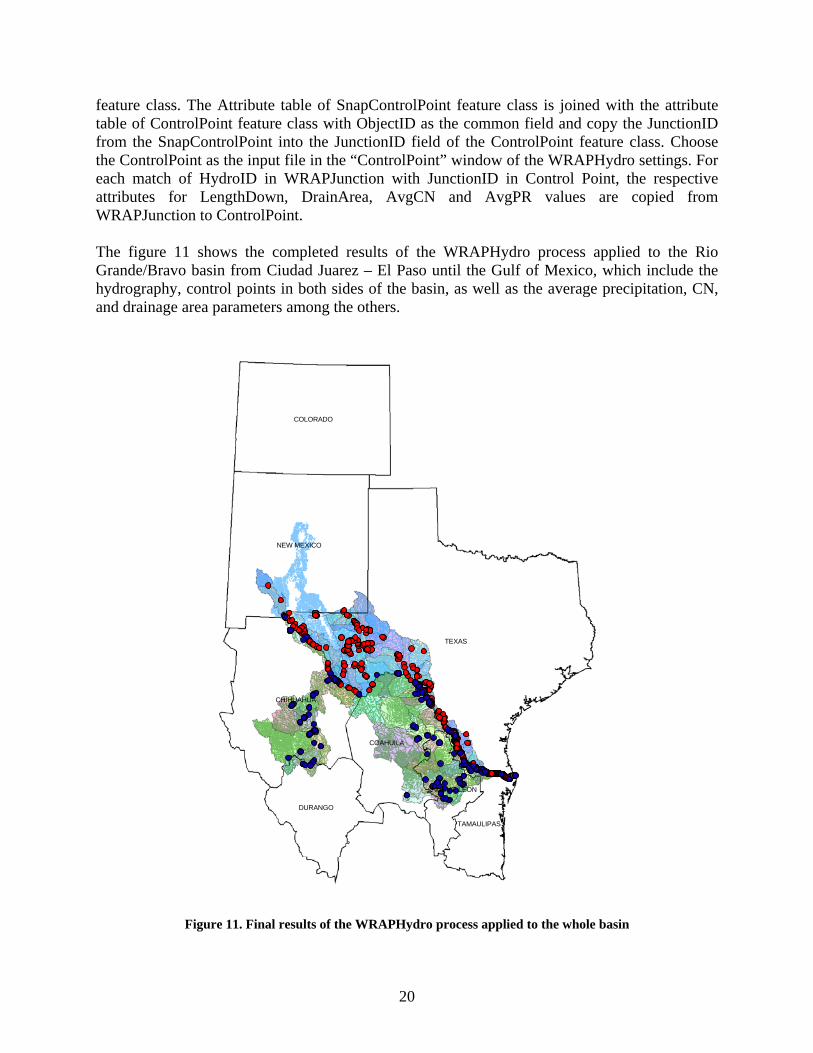
In figures 13 through 15 it is described the schematic diagram for the Mexican and American sides after all hydrological subregions were processed and merged, including 184 control points for Mexico and 1164 for the USA, as well as their corresponding main rivers in the basin.
Created by Carlos PatinoCRWR- UT at AustinMarch 2004
0 150 30075Kilometers
"
") ")% %%
%
!(!( !(
%,
!(!(
!(!(
!( !(
!(
!(
!( "
Û
Û
%
Û
Û
#*
#*
")
")$+
")
")")%
!(
!(
!(
!(
!(
!(
!(
!(!(
!(
!(
!(
!(
!(
!(
!(
!(
!(
!(
!(
!(
!(
!(
!(
!( !(
%,
!(
"
"
Û
Û
Û
#*
#*
#*
")
")
")
!(
!(
!(
!(
!(
!(
!(
!(
%,
!(!(
!(
!(
!(
!(
!(
!(
!(
!(
!(
!(
!(
!(
!(
!(
%
Û
Û
#*
#*
#*
")!(!(
Û
Û
#*
!(
!(
!(
%,
#*
!(
!(
!(%,
!(!(!(!(!(!(!(!(
!(
!(
!(
!(
!(!(
%,
!(
!(
!(
!(
!(
!(
!(
!(
!(
!(
!(
!(
!(
!(
!(
!(
!(
!(
!(
!(
!(
!(
!(
!(
%
#*
Û
Û
#*
#*
Û
Û
Û
Û
!(
!(
!(
!(
!(
!(
!(
!(
!(!(
%,%,%,
%,
!(
Rio Salado
Rio Salinas
Rio Sabinas
Rio
San
Jua
n
Rio
Ba l
l eza
Rio Pesqueria
Arroyo Sabinas
Rio Grande/Bravo
Rio Alamos
Arroyo Alam
os
Rio
Flor
idoRio San Diego
Arroyo La Zorra
Rio San Rodrigo
Arroyo El Parral
Arroyo Camaron
Rio Escondido
Arroyo El Aura
Rio El Pilon
Main Canal
Arro yo La Boqui ll a
Rio
Can
dela
Arroyo Santa Isabel
Arroyo
El Caba
llo
Arroyo Babia
Arroyo Santa Elena
Rio Primero
Arroyo Las CabrasRio C
onchos
Arroyo El Pino
Rio El Alamo
Arroyo El Lobo
Arroyo Santa Cruz
Arroyo El Amole
Arroyo Santa Barbara
Rio Sacramento
Rio
Non
oav a
Arroyo San Matias
Arroyo El Chivo
Arroyo
Magueye
s
Arroyo El Nogal
Arroyo Coyame
Arroyo Las Vacas
Rio C
huviscar
Arroyo El M
uerto
Rio Encadenado
Arro
yo L
os C
alabo
zos
Arroyo El Rancho
Rio San Javier
Rio San Pedro
Arroyo Los Alamos
Arroyo La Compuerta
Arroyo C
er ro Pr iet o
Rio La Boquilla
Arroyo El Bobo
Rio
Gar
rapa
tas
Arro
yo L
a Co
china
Arroyo Mohinos
Arroyo Mojarras
Arroyo La Negra
Arro
yo L
as R
anas
Arroyo
El R
ialito
Arroyo La Piedra Pinta
Arroyo El Holan
Arroyo El Tule
Arro
yo L
as B
ande
jas
Arroyo Agua Verde
Arro
yo E
l Jab
ali
Arroyo El Carrizo
Arroyo El Cuervillo
Rio Florido
Rio Conchos
Rio Conchos
Arroyo El Parral
Rio Conchos
Rio San Pedro
Rio
Con
chos
22
Fig 13 Schematic Diagram of the Rio Grande/Bravo basin on the Mexican side
Created by Carlos PatinoCRWR - UT at AustinMarch 2004