128
FINAL REPORT Prepared For: Detroit Water and Sewerage Department August 14, 2015 PROJECT CS-1528 WATER MASTER PLAN UPDATE
FINAL REPORT
Prepared For:
Detroit Water and Sewerage Department
August 14, 2015
PROJECT CS-1528
WATER MASTER PLAN UPDATE

THIS PAGE INTENTIONALLY LEFT BLANK.

This report was prepared by the Water Master Plan Update consulting team
CDM Smith Michigan Inc.
Project Innovations, Inc.
Public Sector Consultants, Inc.
SERCH Consultants
Tetra Tech of Michigan, PC
Tucker, Young, Jackson, Tull, Inc.
Walter Grayman Consulting Engineer

THIS PAGE INTENTIONALLY LEFT BLANK.

i
Table of Contents
EXECUTIVE SUMMARY ......................................................................................................................................................... 1
THE IMPORTANCE OF AN UPDATED WATER MASTER PLAN ............................................................................................................... 1 SOLUTIONS TO MANAGE COST AND RESPOND TO FUTURE CHANGE .................................................................................................. 2 CUSTOMER INVOLVEMENT STEERED THE PLANNING AND PRIORITIES ............................................................................................. 3 MARKET PLAN: FORECASTING FUTURE WATER SALES ....................................................................................................................... 4 ADJUSTMENTS TO THE PLAN WILL EMERGE FROM MARKET INDICATORS ....................................................................................... 8 WATER QUALITY COMPLIANCE AND LONG TERM COST MANAGEMENT ........................................................................................... 9 COST-EFFECTIVE CONSOLIDATION OF WATER TREATMENT PLANTS ............................................................................................. 10 OPTIMIZING SERVICE DELIVERY ............................................................................................................................................................. 11 MAJOR CONCLUSIONS AND RECOMMENDATIONS ................................................................................................................................ 12
1 INTRODUCTION .......................................................................................................................................................... 15
1.1 BACKGROUND .............................................................................................................................................................................. 15 1.2 GOALS OF THE MASTER PLAN UPDATE .................................................................................................................................. 15 1.3 INTERIM REPORTS MAXIMIZED CUSTOMER REVIEW AND INVOLVEMENT ....................................................................... 15 1.4 FORMAT AND DISTRIBUTION OF THIS REPORT ..................................................................................................................... 16
2 PLANNING CRITERIA ................................................................................................................................................ 17
2.1 PLANNING PERIOD ..................................................................................................................................................................... 17 2.2 PLANNING AREA ......................................................................................................................................................................... 17 2.3 LEVEL OF SERVICE GOALS ......................................................................................................................................................... 17 2.4 POPULATION PROJECTIONS ...................................................................................................................................................... 17 2.5 BASIS OF COST ESTIMATES ....................................................................................................................................................... 22
3 WATER DEMAND PROJECTIONS ........................................................................................................................... 25
3.1 GENERAL ...................................................................................................................................................................................... 25 3.2 WATER SALES AND PRODUCTION TRENDS ............................................................................................................................ 28 3.3 CONTRACT STATUS OF WHOLESALE CUSTOMERS ................................................................................................................ 32 3.4 METHODOLOGY FOR WATER DEMAND PROJECTIONS .......................................................................................................... 37 3.5 DOMESTIC DEMANDS ................................................................................................................................................................. 38 3.6 BUSINESS WATER DEMANDS ................................................................................................................................................... 39 3.7 OUTDOOR IRRIGATION ............................................................................................................................................................... 39 3.8 NON-REVENUE WATER ............................................................................................................................................................. 40
4 GROWTH AND DEMAND MANAGEMENT SCENARIOS ................................................................................... 43
4.1 GENERAL ...................................................................................................................................................................................... 43 4.2 MAJOR FACTORS AND TRENDS ................................................................................................................................................. 43 4.3 BASELINE PROJECTIONS AND HIGH AND LOW ESTIMATES ................................................................................................. 47 4.4 ANNUAL TRACKING, REPORTING AND 5-YEAR ASSESSMENT ............................................................................................. 48
5 SOURCE PROTECTION AND WATER QUALITY ................................................................................................. 51
5.1 OVERVIEW OF THE SOURCE PROTECTION AND WATER QUALITY PLAN ........................................................................... 51 5.2 REGULATIONS GOVERNING SOURCE WATER ......................................................................................................................... 52 5.3 THREATS TO SOURCE WATER QUALITY ................................................................................................................................. 55 5.4 PLAN FOR SOURCE WATER PROTECTION ............................................................................................................................... 58 5.5 REGULATIONS GOVERNING DRINKING WATER ..................................................................................................................... 61
Final Report Table of Contents
Page ii
5.6 PLAN FOR DRINKING WATER QUALITY .................................................................................................................................. 63
6 WATER TREATMENT ................................................................................................................................................ 73
6.1 SUMMARY OF THE WATER TREATMENT PLAN ..................................................................................................................... 73 6.2 EXISTING WATER TREATMENT FACILITIES ........................................................................................................................... 74 6.3 NEEDS ASSESSMENT .................................................................................................................................................................. 83 6.4 DISCUSSION OF PARTICULAR TYPES OF IMPROVEMENTS .................................................................................................... 84 6.5 SCREENING AND EVALUATION OF ALTERNATIVES ............................................................................................................... 86 6.6 SUMMARY OF COST AND NON-MONETARY FACTORS .......................................................................................................... 93 6.7 PROPOSED TREATMENT PROGRAMS ....................................................................................................................................... 97 6.8 PROGRAM TO REDUCE TREATMENT PLANT CAPACITY ....................................................................................................... 97 6.9 PROGRAM TO REPURPOSE THE NORTHEAST WATER TREATMENT PLANT .................................................................. 100 6.10 PROGRAM FOR REGULATORY COMPLIANCE ........................................................................................................................ 119 6.11 PROGRAM FOR RENEWAL, RELIABILITY AND ENERGY MANAGEMENT .......................................................................... 120
7 TRANSMISSION ........................................................................................................................................................ 121
7.1 ADAMS BRANCH ...................................................................................................................................................................... 121 7.2 24-MILE ROAD ....................................................................................................................................................................... 123 7.3 DOWNRIVER ............................................................................................................................................................................. 125 7.4 PHASE 1 CONCLUSIONS .......................................................................................................................................................... 128 7.5 ENERGY MANAGEMENT ......................................................................................................................................................... 137 7.6 PHASE 2 EVALUATIONS .......................................................................................................................................................... 144 7.7 PROPOSED TRANSMISSION PROGRAMS ............................................................................................................................... 164 7.8 PROGRAM TO DECOMMISSION CERTAIN BOOSTER PUMPING STATIONS ....................................................................... 164 7.9 PROGRAM TO OPTIMIZE DELIVERY TO CERTAIN CUSTOMERS ........................................................................................ 167 7.10 PROGRAM TO IMPROVE TRANSMISSION REDUNDANCY .................................................................................................... 177 7.11 PROGRAM FOR RENEWAL AND RELIABILITY ...................................................................................................................... 182
8 DISTRIBUTION ......................................................................................................................................................... 189
8.1 RETAIL CUSTOMER SERVICE ................................................................................................................................................. 189 8.2 REHABILITATION AND REPLACEMENT OF DISTRIBUTION MAINS .................................................................................. 190 8.3 SYSTEM CONSOLIDATION ....................................................................................................................................................... 201 8.4 LEAD PIPE SERVICES .............................................................................................................................................................. 202 8.5 PROPOSED CAPITAL IMPROVEMENT PLAN ......................................................................................................................... 203
9 METERING AND NON-REVENUE WATER ........................................................................................................ 205
9.1 TRENDS IN NONREVENUE WATER ....................................................................................................................................... 205 9.2 PRELIMINARY WATER BALANCE FOR FY 2012 ................................................................................................................ 205 9.3 GOALS FOR NONREVENUE WATER ....................................................................................................................................... 206 9.4 CURRENT PRACTICE FOR METERING AND WATER AUDITS ............................................................................................. 207 9.5 TECHNIQUES FOR MANAGING NONREVENUE WATER ...................................................................................................... 209 9.6 WHOLESALE METERING FOR DEARBORN AND HIGHLAND PARK ................................................................................... 213 9.7 WHOLESALE METERING FOR DETROIT ............................................................................................................................... 216 9.8 RETAIL CUSTOMER METERING IN DETROIT ....................................................................................................................... 219 9.9 PROPOSED CAPITAL IMPROVEMENT PLAN ......................................................................................................................... 219
10 FINANCIAL ANALYSIS ........................................................................................................................................ 221
10.1 INTRODUCTION ........................................................................................................................................................................ 221 10.2 RECENT FINANCIAL PERFORMANCE .................................................................................................................................... 222
Final Report Table of Contents
iii
10.3 KEY PERFORMANCE INDICATORS RELATIVE TO PEER UTILITIES ................................................................................... 223 10.4 ORGANIZATIONAL INITIATIVES TO IMPROVE PERFORMANCE .......................................................................................... 225 10.5 REVIEW OF FY 2016 BUDGET AND CAPITAL IMPROVEMENT PLAN .............................................................................. 227
11 IMPLEMENTATION............................................................................................................................................. 231
11.1 INTRODUCTION ........................................................................................................................................................................ 231 11.2 POLICIES TO IMPLEMENT THE MASTER PLAN .................................................................................................................... 231 11.3 PROJECT INITIATION ............................................................................................................................................................... 238 11.4 CIP EXECUTION MANAGEMENT ............................................................................................................................................ 240
APPENDICES
TM-1 CUSTOMER INVOLVEMENT PROGRAM SUMMARY
TM-2 REGIONAL POPULATION PROJECTIONS
TM-3 EVALUATION OF WHOLESALE METERS
TM-4 PLANNING CRITERIA
TM-5 WATER DEMANDS
TM-6 LIFE CYCLE COST ANALYSIS
TM-7 BLUE WATER ECONOMY
TM-8 WATERSHED MANAGEMENT AND PROTECTION
TM-9 DRINKING WATER REGULATIONS
TM-10 WATER QUALITY MONITORING
TM-11 HYDRAULIC MODEL
TM-12 EMERGENCY RESPONSE PLAN
TM-13 NEEDS ASSESSMENT FOR WATER TREATMENT
TM-14 NEEDS ASSESSMENT FOR BOOSTER PUMPING AND RESERVOIRS
TM-15 SUMMARY OF WHOLESALE CUSTOMER PROJECTIONS
TM-16 ENERGY MANAGEMENT
TM-17 CAPITAL IMPROVEMENT PROGRAM

THIS PAGE INTENTIONALLY LEFT BLANK.
Page 1
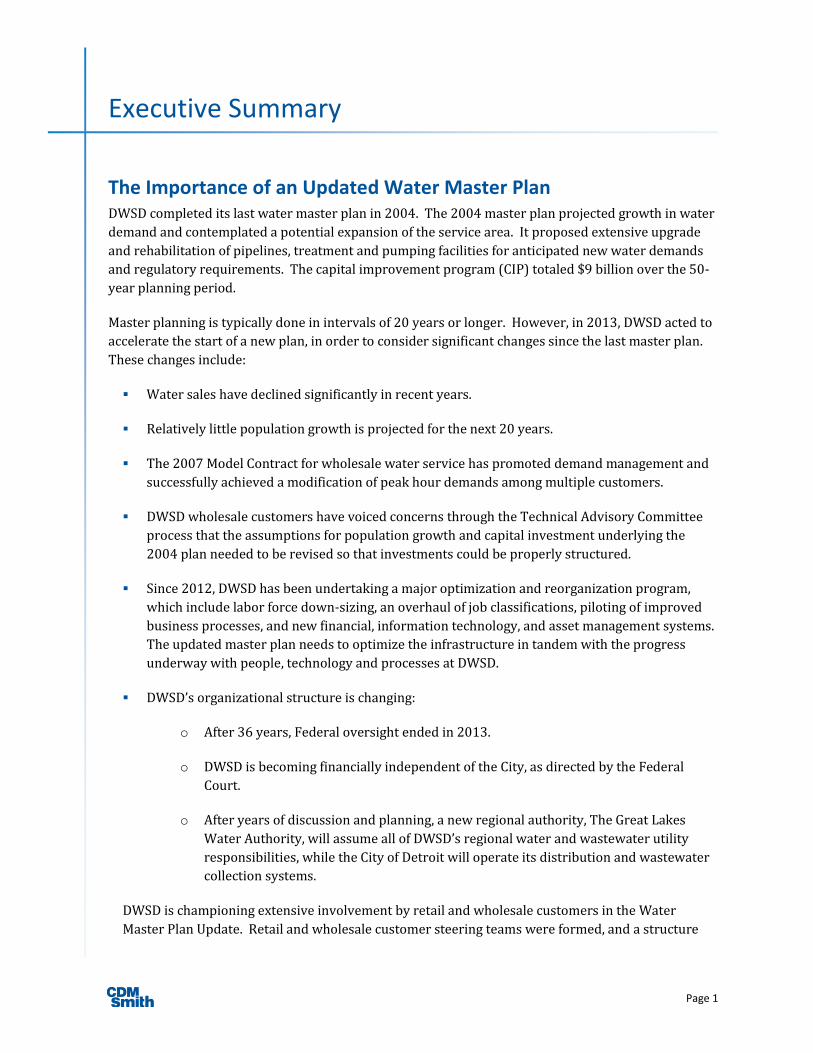
Executive Summary
The Importance of an Updated Water Master Plan DWSD completed its last water master plan in 2004. The 2004 master plan projected growth in water demand and contemplated a potential expansion of the service area. It proposed extensive upgrade
and rehabilitation of pipelines, treatment and pumping facilities for anticipated new water demands
and regulatory requirements. The capital improvement program (CIP) totaled $9 billion over the 50-year planning period.
Master planning is typically done in intervals of 20 years or longer. However, in 2013, DWSD acted to
accelerate the start of a new plan, in order to consider significant changes since the last master plan.
These changes include:
Water sales have declined significantly in recent years.
Relatively little population growth is projected for the next 20 years.
The 2007 Model Contract for wholesale water service has promoted demand management and
successfully achieved a modification of peak hour demands among multiple customers.
DWSD wholesale customers have voiced concerns through the Technical Advisory Committee
process that the assumptions for population growth and capital investment underlying the
2004 plan needed to be revised so that investments could be properly structured.
Since 2012, DWSD has been undertaking a major optimization and reorganization program,
which include labor force down-sizing, an overhaul of job classifications, piloting of improved
business processes, and new financial, information technology, and asset management systems.
The updated master plan needs to optimize the infrastructure in tandem with the progress
underway with people, technology and processes at DWSD.
DWSD’s organizational structure is changing:
o After 36 years, Federal oversight ended in 2013.
o DWSD is becoming financially independent of the City, as directed by the Federal
Court.
o After years of discussion and planning, a new regional authority, The Great Lakes
Water Authority, will assume all of DWSD’s regional water and wastewater utility
responsibilities, while the City of Detroit will operate its distribution and wastewater
collection systems.
DWSD is championing extensive involvement by retail and wholesale customers in the Water Master Plan Update. Retail and wholesale customer steering teams were formed, and a structure
Final Report Executive Summary
Page 2
was created for regular engagement with the wholesale customer Technical Advisory Committee
and its several specialty work groups.
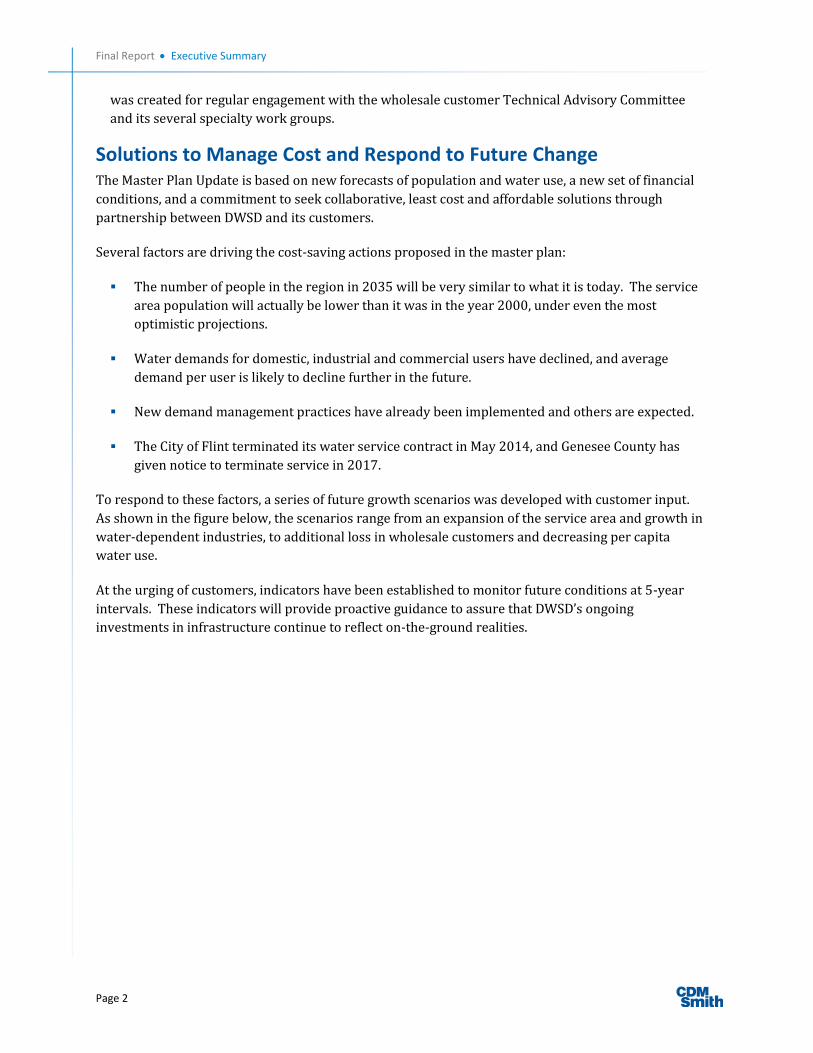
Solutions to Manage Cost and Respond to Future Change The Master Plan Update is based on new forecasts of population and water use, a new set of financial
conditions, and a commitment to seek collaborative, least cost and affordable solutions through
partnership between DWSD and its customers.
Several factors are driving the cost-saving actions proposed in the master plan:
The number of people in the region in 2035 will be very similar to what it is today. The service
area population will actually be lower than it was in the year 2000, under even the most
optimistic projections.
Water demands for domestic, industrial and commercial users have declined, and average
demand per user is likely to decline further in the future.
New demand management practices have already been implemented and others are expected.
The City of Flint terminated its water service contract in May 2014, and Genesee County has
given notice to terminate service in 2017.
To respond to these factors, a series of future growth scenarios was developed with customer input. As shown in the figure below, the scenarios range from an expansion of the service area and growth in
water-dependent industries, to additional loss in wholesale customers and decreasing per capita
water use.
At the urging of customers, indicators have been established to monitor future conditions at 5-year intervals. These indicators will provide proactive guidance to assure that DWSD’s ongoing
investments in infrastructure continue to reflect on-the-ground realities.
Final Report Executive Summary
Page 3
Factors Affecting Future Water Demand
Customer Involvement Steered the Planning and Priorities The Water Master Plan Update was a 24-month project. In order to maximize opportunity for customer and stakeholder involvement, understanding, and input, the plan was prepared as a series of 6 interim reports at scheduled intervals during the project.
The first interim report focused on processes for engaging customers and creating a sense of ownership in the plan. The Customer Involvement Plan was prepared in July 2013. It resulted in
the formation of formal steering committees of retail customers and wholesale customers. It provided
connectivity to the broader wholesale customer Technical Advisory Committee work groups and other stakeholder audiences. It also resulted in the creation of internet-based access to planning meeting
summaries, presentations and interim reports.
Retail and wholesale customer committees, specialty work groups, stakeholders, and DWSD staff have
been engaged regularly for fact finding and decision making in the planning process, and over 70
meetings and workshops were held.
Customer involvement shaped the recommendations of the second interim report on Priorities for
the First 5 Years, which was issued in March 2014. This report identified seven specific priority
actions for implementation between 2015 and 2020. These actions are summarized below.
1. Reduce water treatment plant capacity to align with projected water demand: The current
rated capacity of 1,720 MGD should be reduced to 1,040 MGD. This should be done by a
combination of repurposing the Northeast water treatment plant and reducing the capacity of other plants.

Final Report Executive Summary
Page 4
2. Reduce non-revenue water: Non-revenue water is the difference between the amount of water produced at the plants and the amount of water actually sold. Non-revenue water is currently
30 percent of water production. Non-revenue water is expected to be substantially reduced
through water metering improvements already being implemented by DWSD. Additional
longer-term action to reduce leakage is also underway.
3. Reduce energy use and energy costs: Optimize operational practices to reduce electrical demand charges. Extend seasonal operation practices to reduce annual power costs, and
apply technology for energy recovery from hydraulic turbines, solar and wind sources.
4. Collaborate with customers to address long standing water transmission problems:
Investigations performed by the master planning team have identified solutions to pressure
and supply redundancy problems in Wayne, Oakland and Macomb counties. These are
collaborative solutions between DWSD and the affected wholesale customers, and the new
solutions have significantly lower cost than original estimates.
5. Update water quality goals and monitoring efforts: Minimize the cost of future water quality
regulation through new water quality investigations, partnerships, additional water quality
monitoring services to wholesale customers, and mutual aid agreements. These types of proactive, collaborative, problem-solving activities are important for managing the long term
cost of regulatory compliance.
6. Optimize return on investments using asset management to prioritize capital improvements:
New information technology currently being implemented by DWSD can be combined with
new condition assessment, inspection and preventive maintenance techniques to extend the
service life of equipment. This new approach replaces specific assets rather than systems of assets.
7. Renew and rehabilitate the water distribution system in the City of Detroit: Renewal and
rehabilitation of Detroit’s water distribution mains will be critical to reducing leakage in the
distribution system, reducing the frequency of water main breaks in the future, and
maintaining reliable high quality water to the City. Selective retirement of water mains in
areas of the City that are vacant is a long term strategy to reduce the cost of distribution
system renewal and rehabilitation.
Market Plan: Forecasting Future Water Sales DWSD’s system supplies water to approximately 3.5 million people in 128 communities in Southeast Michigan. Average daily water sales were 372 MGD in Fiscal Year 2014. City of Detroit water sales
were 69 MGD, and wholesale customer sales were 303 MGD.
A long term trend in declining water sales is now documented. The reasons for this trend are
analyzed and accounted for in this market plan. At the same time, potential changes to the future
forecast during the planning period are analyzed, so that expectations of future water sales can be
reasonably framed.
Specifically, regional water sales declined 32 percent from an average of 550 MGD in 2000 to 372 MGD
in 2014. This decline is a combination of a national trend in reduced per capita water use and regional
Final Report Executive Summary
Page 5
economic conditions in Southeast Michigan. Most notably, the regional water service area economy
employed 443,000 in manufacturing jobs in the year 2000, but this number is expected to fall to
185,000 by 2035. Historically, these manufacturing jobs also generated high water use. New
employment growth is expected to be largely in knowledge-based services and health care which have
relatively lower water use than the older manufacturing processes.
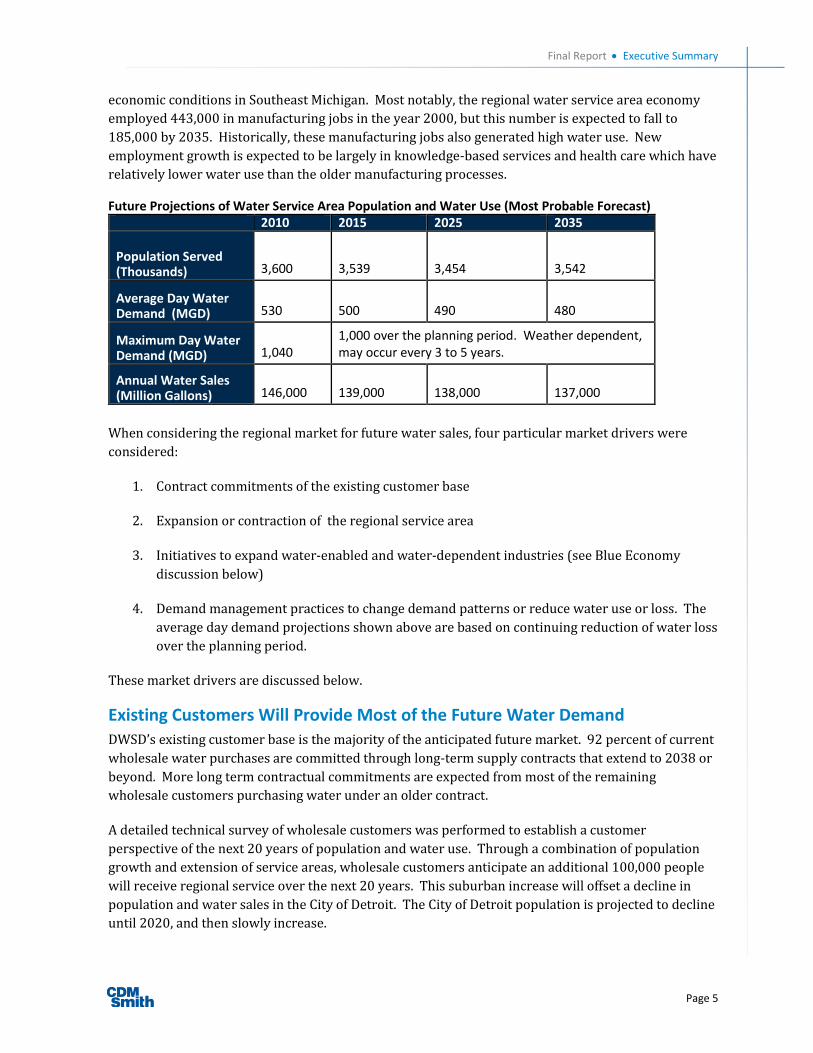
Future Projections of Water Service Area Population and Water Use (Most Probable Forecast) 2010 2015 2025 2035
Population Served (Thousands) 3,600 3,539 3,454 3,542
Average Day Water Demand (MGD) 530 500 490 480
Maximum Day Water Demand (MGD) 1,040
1,000 over the planning period. Weather dependent, may occur every 3 to 5 years.
Annual Water Sales (Million Gallons) 146,000 139,000 138,000 137,000
When considering the regional market for future water sales, four particular market drivers were
considered:
1. Contract commitments of the existing customer base
2. Expansion or contraction of the regional service area
3. Initiatives to expand water-enabled and water-dependent industries (see Blue Economy
discussion below)
4. Demand management practices to change demand patterns or reduce water use or loss. The
average day demand projections shown above are based on continuing reduction of water loss
over the planning period.
These market drivers are discussed below.
Existing Customers Will Provide Most of the Future Water Demand DWSD’s existing customer base is the majority of the anticipated future market. 92 percent of current
wholesale water purchases are committed through long-term supply contracts that extend to 2038 or
beyond. More long term contractual commitments are expected from most of the remaining
wholesale customers purchasing water under an older contract.
A detailed technical survey of wholesale customers was performed to establish a customer perspective of the next 20 years of population and water use. Through a combination of population
growth and extension of service areas, wholesale customers anticipate an additional 100,000 people
will receive regional service over the next 20 years. This suburban increase will offset a decline in
population and water sales in the City of Detroit. The City of Detroit population is projected to decline
until 2020, and then slowly increase.
Final Report Executive Summary
Page 6
Addition or Loss of Customers in the Regional Service Area Scenarios for addition or loss of customers in the service area were developed. Their impact on future
water sales and system capacity were evaluated. The result: maximum day water demand ranging
from 1,100 MGD on the high end to 930 MGD on the low end. The 1,040 MGD maximum day demand
represents the most likely future demand.
Following is a summary of potential changes in the future service area:
Wholesale customers in Genesee County are in transition. The City of Flint ended continuous
water purchases in May 2014. Flint is currently under an agreement providing only for emergency service. Genesee County has provided notice to DWSD that it will end water
purchases in 2016. Similar to Flint, they will then become an emergency supply customer.
Lapeer County customers continue to purchase water from DWSD and are in discussion with
DWSD regarding water supply beyond 2016.
Some wholesale customers in the Downriver area have not yet signed a long term service
contract.
An examination of smaller water service providers to the west of the regional water service
area was performed to document population growth, source water supply and cost of water service. Based on this analysis, it is possible that some communities in southern Oakland
County and northern Washtenaw County could seek water service from DWSD during the
planning period.
Larger water service providers, such as Monroe and Ann Arbor, could seek emergency supply
agreements to address seasonal water supply.
Lastly, some water service providers along the St. Clair River have expressed interest in
considering regional water service.
New Blue Economy Water Use
A Blue Economy integrates water resources with jobs and development. On-going initiatives
underway in Michigan’s Blue Economy intend to grow businesses and jobs in water-enabled and
water-related sectors by utilizing the region’s abundant resources – water, academia, engineering and
manufacturing workforces. Water-enabled and water-related industries are those portions of the
economy that produce, implement, or are significantly affected by water research and innovation.
At present, Blue Economy water users represent less than 5 percent of DWSD’s annual water sales.
Food and beverage companies have particular potential for growth, and these represent half of the
current Blue Economy water use. A review was performed of ongoing initiatives, potential for growth,
and techniques for stimulating growth in Blue Economy water use. Based on this review,
recommendations are presented for a collaborative effort by DWSD, the City of Detroit, Oakland,
Wayne and Macomb counties, and business organizations to plan for and attract new Blue Economy
businesses to the regional water service area. Over the last 12 years, water use by major industries in
the DWSD service area has declined from 45 MGD in 2002 to 23 MGD today.
Final Report Executive Summary
Page 7
Blue Economy Initiatives have the potential for restoring some of the losses in industrial water demand with new highly sustainable industrial and commercial water users. However, these changes
are not expected to have a major impact on average daily demand, peak daily demand, or the many
implementation actions proposed to reduce the system’s capacity in order to lower fixed costs.
Demand Management Demand management is the proactive application of technology or regulation to minimize water use
or modify water use patterns. There are four principle categories of demand management actions that
will continue to impact DWSD water sales and operational efficiency in the next 20 years.
1. Increasing transition to plumbing fixtures that conserve water
2. More investment in storage of water by wholesale customers to reduce their peak demand
3. Increased use of outdoor irrigation regulations and public education to reduce peak demand
4. Reduction in water loss by fixing leaks and replacing older pipes.
Water conserving plumbing fixtures have been increasingly regulated through building and
plumbing codes since 1982. Much of the impact of these regulations has already been experienced,
but it can be expected to continue to impact per capita domestic water use through the planning
period. Current estimates of domestic water use in the DWSD service area range from 58 gallons per capita per day (GPCD) to 77 GPCD. A range of 50 to 60 GPCD is possible by the end of the planning
period.
Wholesale customers are building storage to reduce the cost of peak hour water purchases from
DWSD. Wholesale customer storage currently totals 95 million gallons at 30 locations. 15 million
gallons has been built in the last 7 years and an additional 9 million gallons of storage is planned for the remainder of the planning period.
The impacts of this type of storage are significant in two ways:
1. It reduces costs to customer communities as well as peak hour pumping requirements and
associated energy costs for DWSD.
2. Reduction in revenue to DWSD, because peak hour rates have less impact.
45 of DWSD’s wholesale customers have regulations or have public education programs to mitigate
peak hour water use for outdoor irrigation. A detailed evaluation of the quantitative impact of these
regulations and public education programs has not been performed. However, peak hour water demand has fallen by more than 200 MGD in the last 10 years, and this can be attributed to a
combination of peak hour storage, outdoor irrigation regulation and public education.
A final component of demand management is reduction in water loss. The first interim report on
Priorities for the Next 5 Years identified reduction in non-revenue water as a key priority. Real water loss through leakage in the City of Detroit is estimated to be 50 to 80 MGD. DWSD is vigorously
applying a number of methods to find and eliminate leakage.
Final Report Executive Summary
Page 8
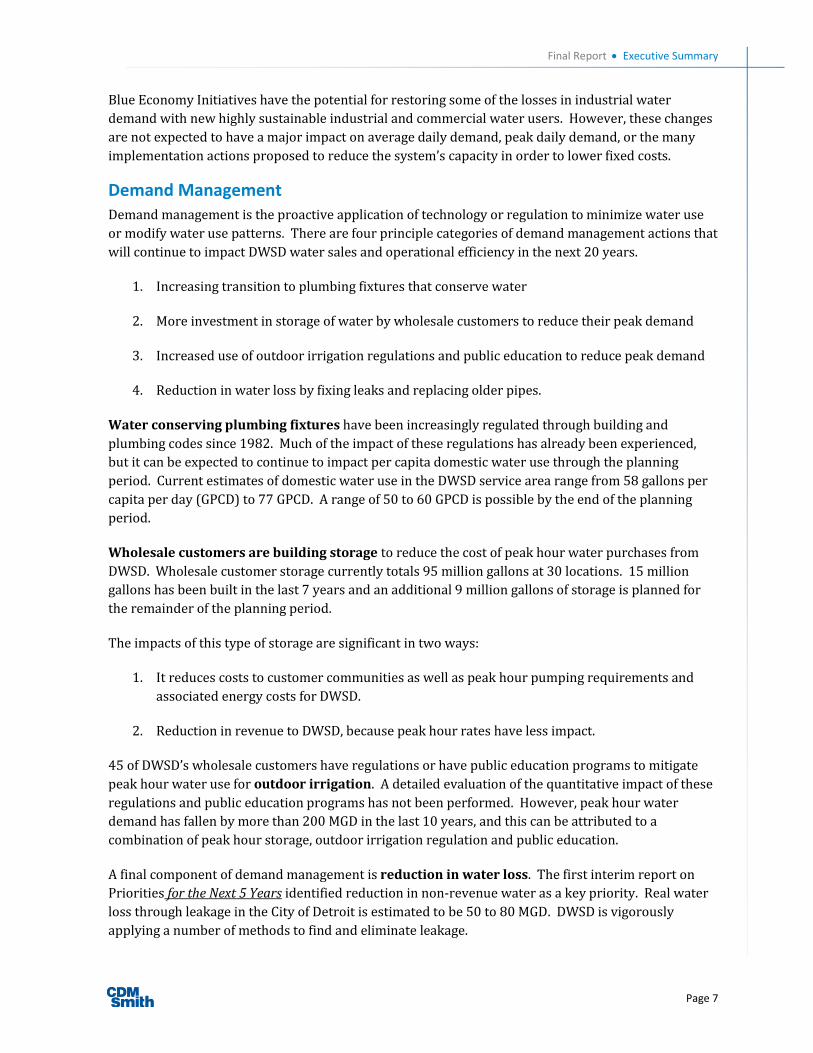
Adjustments to the Plan Will Emerge from Market Indicators The key driver for DWSD’s future water sales is population change. Other factors include changes in
the service area, trends in domestic water use, industrial water use, outdoor irrigation trends, and
outdoor irrigation practices.
The figure below shows service area population from 2000 to 2015, along with projections to 2035.
The black line is the most probable projection based on input from wholesale customers and the
Southeast Michigan Council of Governments (SEMCOG). The light blue line is the high projection, and
the darker blue line is the low projection, both based on SEMCOG’s range of future projections. Most
noteworthy is that service area population under any 2035 scenario is still less than the service area
population in 2000.
In order to monitor and assess future trends, the following indicators are proposed for tracking on an
annual basis. See Chapter 4 for a discussion of why these indicators were selected.
Employment trend and forecast
Population trend and forecast
Major industrial water use
Per capita domestic water use
Water production
3000
3100
3200
3300
3400
3500
3600
3700
3800
3900
4000
2000 2005 2010 2015 2020 2025 2030 2035 2040
Po
pu
lati
on
(x
10
00
)
DWSD Water Service Population 2000-2035
Recorded Population Served Most Probable Population Served (x1000)Low Estimate High Estimate
Final Report Executive Summary
Page 9
Water sales
Reduction in water loss through leak reduction and pipe replacement
Customer updates on projected water purchases
Customer satisfaction surveys and water service contract execution
Federal and state regulations
It is proposed that a customer outreach work group be convened in 2020 to assist in performing the
first 5-year assessment of indicators and trends. Upon completion of that effort, the work group
should recommend a process for the subsequent updates in 2025 and thereafter. Prior to the first formal plan review in 2020, a customer outreach workgroup should assess progress toward achieving
the first five-year goals in late 2017.
The forecast of growth, the range of scenarios, and 5-year monitoring of indicators provide a guide
map that will allow DWSD to continue its focus on optimization of facilities, work force development,
improving customer service and efficiency. DWSD can continue to make informed decisions for infrastructure investment, and to make these investments in measured steps to meet objectives in
management of cost of service and affordability.
Water Quality Compliance and Long Term Cost Management The Product Plan includes actions over the next twenty years to protect source water quality, stay in
compliance with drinking water regulations, update water quality goals, and update the monitoring
and emergency response plans.
Major elements of the source projection and water quality plan include the following future actions:
1. Update the Source Water Assessment, which was originally prepared in 2002.
2. Prepare Surface Water Intake Protection Plans for all three intakes
3. Expand participation in Partnership for Safe Water, MiWARN, and the Huron to Erie
Monitoring System.
4. Increase the number of water quality staff to increase DWSD’s role in these partnerships, and
to perform the new monitoring and special water quality studies recommended herein.
5. Update water quality goals for 2016 to 2025 with emphasis on repurposing and optimizing
conventional filtration capacity at four plants and converting to direct filtration at the Lake
Huron plant.
6. After 2025, update water quality goals again in response to new regulations that may take
effect, and for new initiatives for multi-barrier disinfection and conversion from chlorine gas
to sodium hypochlorite.
Final Report Executive Summary
Page 10
The plan proposes goals that in some cases go beyond existing minimum federal and state regulatory
requirements, but are consistent with the best practices of major peer water utilities.
Cost-Effective Consolidation of Water Treatment Plants DWSD owns and operates 5 water treatment plants. These plants have a design capacity of 1,720
MGD, they are in compliance with current regulatory requirements, and they produce high quality
water, but they have over 700 MGD excess capacity relative to projected water demands during the
planning period.
A needs assessment for all water treatment plants was performed in order to determine the most cost-effective approach to reduce excess capacity and maintain or improve the level of service to customers
throughout the planning period. Improvements were identified for regulatory compliance, safety,
energy and operational efficiency. The projected capital needs for all 5 plants are approximately $997
million over the planning period in today’s prices.
In addition to the needs assessment, a life cycle cost analysis was performed to consider O&M as well as capital needs, the cost to decommission and repurpose plants, the cost to build new transmission
mains for water supply, and the cost to assure a level of redundancy typical of large water utilities.
Life Cycle Cost Comparison of Alternatives for Water Treatment Plant Consolidation
The figure shown above summarizes the life cycle cost analysis and shows that repurposing the
Northeast and Southwest plants is the alternative with the lowest life cycle cost. A detailed review of the costs of repurposing Northeast and Southwest plants shows that under some economic forecasts,
the most cost-effective alternative is to repurpose only the Northeast plant and continue to operate
the Southwest plant. Therefore, it is proposed that DWSD move forward to reduce active treatment
capacity in all of its plants to a total of 1,040 MGD by 2020, and by the same time repurpose the
Northeast water treatment plant for only reservoir and high lift pump operations. After 2020, with
new information available, re-examine the cost effectiveness of continuing to operate the Southwest plant.
Final Report Executive Summary
Page 11
DWSD has already taken the initial steps in its FY2016 CIP to reduce the capacity of its water treatment plants. The FY2016 CIP was developed with substantial input from the Water Master Plan
Update.
The new consolidation and repurposing program will reduce DWSD’s costs for operation and
maintenance, as well as reduce its immediate capital costs for plant upgrades and long term costs for regulatory compliance. This program builds on DWSD’s ongoing initiatives for optimization, asset
management, and customer service, and it maintains high level of service standards in drinking water
quality, pressure and volume.
Optimizing Service Delivery The service management plan proposes changes to the transmission system to efficiently meet wholesale customer contract requirements and projected 2035 water demands. The changes to the
transmission system allow for the repurposing of the Northeast Water Treatment Plant and the
decommissioning of older booster pumping stations that were originally part of the Wayne County
water system and acquired by DWSD in 1960. Pumping capacity in DWSD’s high lift pumping stations
exceeds 2,500 MGD, but future requirements are 1,500 MGD, so substantial idle capacity can be
removed from service to reduce costs for preventive maintenance and electrical demand charges, and
reduce costs of future capital upgrades. In conjunction with these changes, the Service Management
plan recommends several improvements to add transmission redundancy and new isolation gates on
transmission mains. These improvements will add reliability to locations which have historically been
areas of concern and risk for the utility and its wholesale customers. DWSD is aggressively moving
forward to reduce nonrevenue water, and the Service Management Plan recommends additional short
term and long term projects and operational actions to reach a non-revenue water goal of 15 percent
by 2035.
Changing the treatment and transmission system is complex, and must be done in a carefully planned
and sequenced approach. Therefore, the Service Management Plan identifies specific projects and a
project sequence and schedule to accomplish the goals of the master plan. The Service Management Plan also anticipates the departure of Genesee County as a wholesale customer in July 2016, and
includes projects to maintain water quality to wholesale customers who will remain served by the 72-inch main to Flint.
DWSD is in transition to two successor agencies: the Great Lakes Water Authority for the regional
system, and the City of Detroit for retail water service in the City of Detroit. The Service Management
Plan identifies specific capital projects for GLWA on the regional system and specific capital projects
for the City of Detroit for the work within the City. The capital improvement plan for this Master Plan
Update includes a total of 320 capital projects for the next 20 years. The first five years of the
planning period, 2015 to 2020, will provide new information and new ideas from DWSD’s successor agencies. Implementation of the Service Management Plan should be reviewed annually based on
progress and new conditions. As provided in other aspects of the plan, formal reviews of the 20-year plan should be conducted every 5 years to account for new information and changes from anticipated
conditions.
Final Report Executive Summary
Page 12
Major Conclusions and Recommendations Recommendations of the master plan are presented in the form of a 20-year capital improvement
program. The 20-year CIP is presented in Technical Memorandum 17, and in summary form in
Chapter 10. Chapters 6, 7, 8 and 9 describe the major analyses, alternatives and important early
action projects. Chapter 11 provides recommendations to drive implementation of the plan and
expansion of the customer base. These policies include planning, water rates, water audits, wholesale
customer service, and asset management.
The recommended capital improvement plan is approximately $2.9 billion over the next 20 years. On
an annual basis, the capital improvement program for the GLWA averages $120 million annually, and
for the City of Detroit retail, it averages $25 million annually.
Implementation of the recommended projects in the Master Plan Update will provide the following
benefits to customers in the service area:
Reinforces the level of service
DWSD’s traditionally high level of service in supplying superior quality water and meeting retail and wholesale customer requirements for pressure, volume and water quality and reliability
would be reinforced.
Improved procedures have been developed for emergency response, if a local and short term
service disruption requires a reduced water supply in the impacted area.
Right-sizing treatment and pumping capacity will reduce future capital costs and operating costs
The proposed 20-year capital improvement program is $500 million less expensive (life cycle
cost basis) than the cost of continuing to maintain and operate all existing water treatment
plants at today’s capacity.
In addition to water treatment plant savings, the proposed decommissioning of certain booster pump stations and right-sizing high lift pumping will reduce capital costs by another $90
million over the planning period.
Provides flexibility for a range of future scenarios
Growth projections show the need to right-size treatment plant capacity to approximately 1,040
MGD maximum day demand and average day of 480 MGD.
The right-sizing of plants will be done in a way so that if there is unexpected growth or expansion of today’s service are, treatment capacity can be restored cost-effectively.
Trends in water consumption for households and business have been decreasing in recent
years. If these trends continue, the plan sets forth a pathway to reduce treatment and pumping
capacity further.
Improves transmission redundancy and reliability

Final Report Executive Summary
Page 13
Proposed transmission system improvements will increase redundancy of supply to each
operating zone.
Use of inter-customer connections have been proposed as low cost solution to certain
redundancy needs.
Three water intakes will be maintained, and emergency level short term water supply can be
provided with any one plant out of service.
Optimizes service delivery to wholesale customers
The existing service area of the Northeast water treatment plant will be supplied from the Lake
Huron plant and the Water Works Park plant.
Transmission constraints will be eliminated at Water Works Park plant, and this plant will cost-effectively provide finished water to the repurposed Northeast high lift pump station
Rehabilitation of existing pumps in the Water Works Park high lift station will optimize the
station for both low demand and high demand periods.
Changing certain flow splits within wholesale customer contracts provides a mechanism for future savings, particularly energy savings
Proactive approach to manage the cost of compliance with future regulations
DWSD has already begun work on Surface Water Intake Protection Program (SWIPP) for each
of its intakes and analyzing requirements for chlorine boosting for Lapeer City and Mayfield.
A pilot study for a direct filtration process at Lake Huron is proposed for mid-planning period to
reduce the cost of treatment at that plant.
A process has been developed to update the water quality goals that govern treatment plant
operations. Updating the goals will help to maintain compliance with regulatory requirements.
$250 million is budgeted address new water quality regulations, which are not required now,
but could potentially be required in the future
Provides a new strategy for water main renewal in Detroit
DWSD has traditionally used open-cut construction and ductile iron pipe. Looking forward, the
variety in development type and density within the City of Detroit provides opportunity for a
new mix of technologies currently used within Detroit’s suburbs and peer cities, with a goal of
reduce the cost of water mains from $300 per foot to less than $200 per foot.
A 3-year pilot program is proposed to develop design criteria, construction standards, and
application criteria for the new mix of technologies. The benefit of new approach is to reduce
the potential long term cost of distribution system renewal from $5 billion over the next 100
years to $3 billion or less.

Final Report Executive Summary
Page 14
Proactive asset management approach to CIP planning
The 20-year capital improvement program includes $35 million for condition assessment
studies of transmission mains, treatment plants and booster pump stations.
Accurate and current condition assessment data, combined with computerized maintenance
management and asset management systems, can reduce the future costs of infrastructure
replacement by providing alternatives for rehabilitation or smaller scale replacement of weak
links in the infrastructure.
Reducing nonrevenue water to improve system efficiency
The Master Plan Update sets a goal of reducing nonrevenue water from 30 percent today to15
percent by 2035.
New production metering projects underway, and DWSD is piloting District Metering Area
approach to manage leakage within geographic limits.
New wholesale meter are proposed for Detroit, Dearborn and Highland Park. Within Detroit,
the goal is to complete wholesale metering for half of the City by 2035, and to perform this work
in coordination with concurrent water distribution main renewal projects to minimize the cost.

Page 15
1 Introduction
1.1 Background The Detroit Water and Sewerage Department (DWSD) and its predecessor agencies have provided
public water supply since 1836. Master planning has been used by the department for over 100 years
as a way to establish direction for growth and facilities in 20 to 50 year periods.
The last comprehensive master plan was completed in 2004. The economic recession of 2007 created
significant changes to the projections used in the 2004 master plan. Also, starting in 2003, the
wholesale water customers of DWSD became more involved in analysis and planning for the system
through a customer outreach initiative.
Consequently, DWSD and its wholesale customers agreed in 2012 to prepare an update to the
previous master plan. DWSD also established a formal retail customer steering committee, to
complement the wholesale customer involvement effort.
1.2 Goals of the Master Plan Update The goals of the Master Plan Update are:
1. Perform the planning with extensive customer involvement from retail customer and
wholesale customer steering committees and specialty working groups.
2. Examine a range of future scenarios and establish indicators to guide realistic projections of
population and water demand, to plan capital facilities, and to respond to change.
3. Resolve legacy issues on requirements for plant capacity and transmission system
improvements that have been pending for several years.
4. Focus on actions that result in cost efficiency, maximizing use of existing assets, and
improving reliability, and long term financial sustainability.
1.3 Interim Reports Maximized Customer Review and Involvement The Water Master Plan Update was a 24-month project, extending from June 2013 to June 2015. In
order to provide maximum opportunity for customer and stakeholder input, results of the Master Plan
Update were presented in a series of six interim reports:
Customer Involvement Plan Interim Report. This interim report was prepared in July 2013,
and it established the framework and procedures for wholesale customer and retail customer involvement activities in the planning study.
Priorities for First Five Years Interim Report. This was prepared in March 2014, and it
outlined priorities for the first 5 years of the planning period.

Water Master Plan Update Section 1
Page 16
Market Plan Interim Report. This interim report was prepared in September 2014, and it
established a forecast for the service area, population served, and water use projections to
2035.
Source Water and Water Quality Plan Interim Report. This interim report was prepared in
December 2014, and it examined watershed management and source water protection
requirements. It also addressed water quality monitoring and compliance with future
regulations.
Infrastructure and Service Management Plan Interim Report. This interim report was
prepared in March 2015, and it analyzed requirements for pumping, storage, transmission, and
distribution facilities to meet level of service goals for retail and wholesale customers.
Financial Analysis. This analysis was prepared in April 2015, presented the proposed 20-year capital improvement program (CIP) and forecasts of water sales for multiple scenarios. The 20-year capital improvement plan and water sales forecasts were incorporated into concurrent
financial analyses performed for transition to the new Great Lakes Water Authority. (See
Chapter 10.)
Each of the interim reports were accompanied by workshops and meetings to receive comments and
examine particular issues in depth. The final report was prepared cumulatively through building
blocks of each interim report, followed by continuing review and refinement of planning objectives,
technical issues, and recommendations over the 24-month period.
1.4 Format and Distribution of this Report This report has been prepared and organized for general distribution as a PDF file to representatives
of DWSD, the Master Plan Steering Team, Retail Customer Steering Committee, and wholesale
customers. The report and previous interim reports were distributed through the DWSD Oureach.org
internet portal and it is readable with Adobe Reader Version XI or earlier versions. Printed copies of the final report and associated digital project deliverables were provided to DWSD.
The technical appendices for this report are presented in a series of technical memoranda. These are
referenced in the report by the abbreviation TM-2 for Technical Memorandum 2, for example.
The content of the interim reports noted in Section 1.3 has been updated for this final report.
Headings at the top of Chapters 3 to 11 indicate the original interim report from which the chapter content is derived.
Page 17
2 Planning Criteria This chapter presents the basic planning criteria for the Water Master Plan Update. Additional
information is presented in TM-2 and TM-4, which provide detail on population projections, level of service goals, redundancy, reliability, cost estimates, and life cycle cost evaluations.
2.1 Planning Period DWSD’s goal is to provide an update to its earlier 50-year Comprehensive Master Plan, which covered
the years 2000 to 2050. This Master Plan Update covers a shorter planning period of 20 years.
In order to synchronize with DWSD’s annual Capital Improvement Program, the planning period for this Master Plan Update has been established as July 1, 2015, to June 30, 2034.
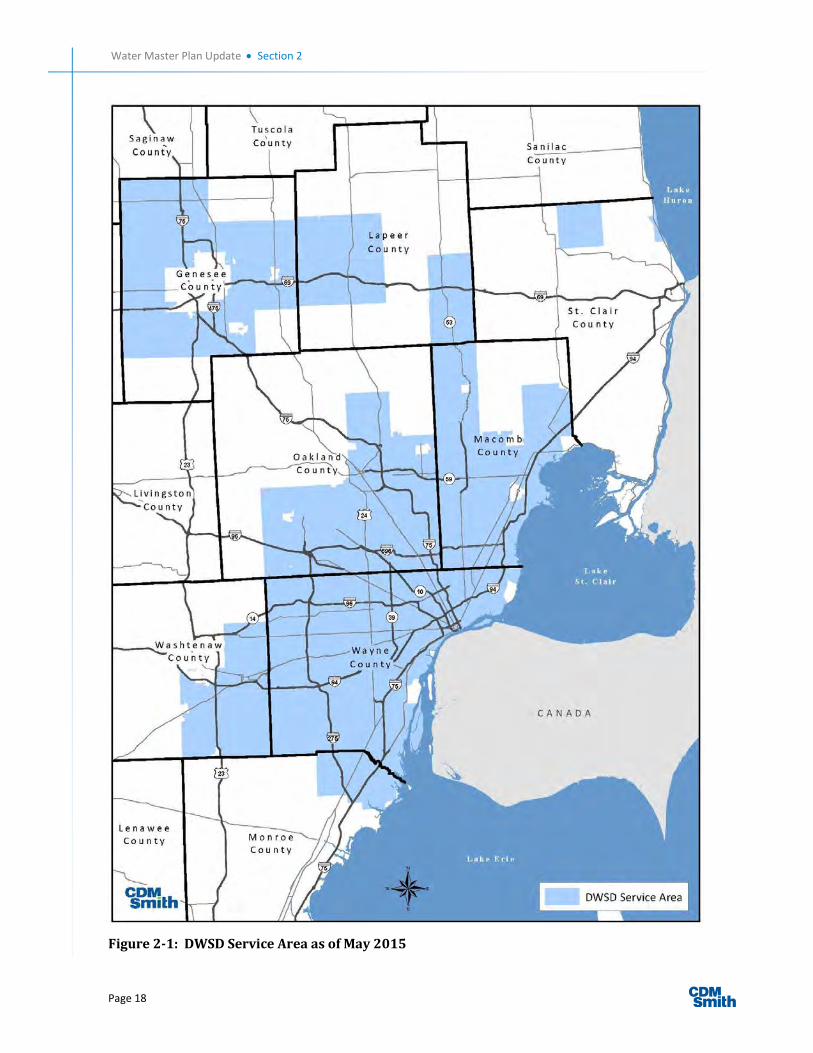
2.2 Planning Area Figure 2-1 on the follow page shows the current service area in May 2015. Characteristics of the
service area are described in Chapter 3. The planning area is primarily the current water service.
Areas not served by public water supply that adjoin the current service area, and other adjoining
water service providers were considered on a limited basis as potential future wholesale customers.
Potential new wholesale customers are discussed in Chapter 4.
2.3 Level of Service Goals Level of service goals were established to guide decision-making on new infrastructure and
rehabilitation of existing infrastructure. The goals cover the areas of redundancy, reliability, customer service pressure and volume, hydraulics of the transmission system, storage capacity, and water quality. TM-4 presents the level of service goals.
2.4 Population Projections Population projections for the DWSD service area were developed based on regional forecasts made
by Southeast Michigan Council of Governments, Genesee County Metropolitan Planning Commission
and a private forecaster, Woods & Poole Economic, Inc.
Water Master Plan Update Section 2
Page 18
Figure 2-1: DWSD Service Area as of May 2015
Water Master Plan Update Section 2
Page 19
During the period December 2013 to March 2014, the master planning team sent customized data
packages to all wholesale customers. These data packages included recent trends in building permits,
population and employment past trends and projections, identification of major industrial water users, and maps of major water facilities and service area. The objective of these data packages was to
allow each wholesale customer the opportunity to review and amend projections for this Master Plan
Update.
The wholesale customer projections are generally consistent with the regional population and
employment projections. The wholesale customer projections also identify the current and projected
residential population and the geographic areas to be served by DWSD water, which adds precision to
the estimates of future water demand.
Tables 2-1 and 2-2 show 20-year projections for population growth. See Appendix TM-2 for more
detail on these projections. In these tables, the term “non-customers” refers to residents and workers
who are served by private wells or other water service providers.

Water Master Plan Update Section 2
Page 20
Table 2-1: Regional Population Projections Showing DWSD Water Customers County 2010 2015 2020 2025 2030 2035 Genesee Co. Total 425,100 421,531 421,711 422,231 422,645 422,895
Genesee Co. Non-customers 113,100 211,531 421,711 422,231 422,645 422,895
Genesee Co. DWSD Customers1 312,000 210,000 0 0 0 0
Lapeer Co. Total 88,189 91,275 95,474 99,784 104,107 108,423
Lapeer Co. Non-customers 67,189 69,575 72,774 75,984 79,307 82,623
Lapeer Co. DWSD Customers2 21,000 21,700 22,700 23,800 24,800 25,800
Macomb Co. Total 840,978 855,378 863,380 872,733 884,846 896,401
Macomb Co. Non-customers 51,333 52,218 52,835 52,819 52,675 52,661
Macomb Co. DWSD Customers 789,645 803,160 810,545 819,914 832,171 843,740
Monroe Co. Total 152,021 155,696 156,602 158,347 160,865 163,246
Monroe Co. Non-customers 135,357 138,218 138,602 139,830 141,971 144,175
Monroe Co. DWSD Customers 16,664 17,478 18,000 18,517 18,894 19,071
Oakland Co. Total 1,202,362 1,215,322 1,218,432 1,221,340 1,230,734 1,232,649
Oakland Co. Non-customers 311,271 319,325 319,031 319,111 321,989 320,377
Oakland Co. DWSD Customers 891,091 895,997 899,401 902,229 908,745 912,272
St. Clair Co. Total 163,040 161,667 161,497 162,541 164,643 166,652
St. Clair Co. Non-customers 157,494 156,001 155,829 156,543 158,537 160,427
St. Clair Co. DWSD Customers 5,546 5,666 5,668 5,998 6,106 6,225
Washtenaw Co. Total 344,791 350,784 354,116 360,366 368,297 377,220
Washtenaw Co. Non-customers 208,858 213,237 213,772 217,751 221,219 225,103
Washtenaw Co. DWSD Customers 135,933 137,547 140,344 142,615 147,078 152,117
Wayne Co. Total (outside Detroit) 1,106,807 1,093,946 1,076,145 1,063,050 1,054,944 1,047,933
Wayne Co. Non-customers 52,559 49,622 48,183 47,072 46,394 45,966
Wayne Co. DWSD Customers (outside Detroit)
1,054,248 1,044,324 1,027,962 1,015,978 1,008,550 1,001,967
City of Detroit 713,777 648,350 624,705 612,442 609,745 613,709
Regional Total 5,037,065 4,993,949 4,972,062 4,972,834 5,000,826 5,029,128
Regional Non-customers 1,097,161 1,209,727 1,422,737 1,431,341 1,444,737 1,454,227
Regional DWSD Customers 3,939,904 3,784,222 3,549,325 3,541,493 3,556,089 3,574,901
Regional DWSD Customers excluding
Genesee County in 2010 and 2015
3,627,904
3,574,222
3,549,325 3,541,493
3,556,089
3,574,901 1Genesee Co. DWSD Customers includes 2010 Census Population for the City of Flint and surrounding Genesee County customers. 2015 DWSD customers include only the estimate of residents in areas served through Genesee County Drain Commission (see TM-15 for population connected to water service). After 2017 Genesee Co. has indicated they will no longer be a DWSD customer - entire Woods & Poole population projection for Genesee Co. shown as Non-Customer 2020-2035. 2Lapeer Co. DWSD Customer population estimated based on 2010 Census data (locations with >1 person/acre) and Woods & Poole County-wide population projection trends.

Water Master Plan Update Section 2
Page 21
Table 2-2: Regional Employment Projections Showing DWSD Water Customers County 2010 2015 2020 2025 2030 2035 Genesee Co. Total 184,015 194,140 202,408 211,192 220,474 230,236
Genesee Co. Non-customers 48,915 97,440 202,408 211,192 220,474 230,236
Genesee Co. DWSD Customers 135,100 96,700 0 0 0 0
Lapeer Co. Total 31,197 32,869 34,256 35,647 37,047 38,449
Lapeer Co. Non-customers 23,797 25,069 26,156 27,147 28,247 29,349
Lapeer Co. DWSD Customers 7,400 7,800 8,100 8,500 8,800 9,100
Macomb Co. Total 362,517 377,116 379,981 387,217 395,239 403,398
Macomb Co. Non-customers 29,646 30,745 31,271 31,953 32,688 33,478
Macomb Co. DWSD Customers 332,871 346,371 348,710 355,264 362,551 369,920
Monroe Co. Total 53,761 56,262 56,928 57,637 58,669 60,081
Monroe Co. Non-customers 49,003 51,267 51,850 52,491 53,422 54,722
Monroe Co. DWSD Customers 4,758 4,995 5,078 5,146 5,247 5,359
Oakland Co. Total 842,222 901,219 921,533 936,923 951,622 964,459
Oakland Co. Non-customers 86,581 92,693 94,357 96,118 97,682 99,092
Oakland Co. DWSD Customers 755,641 808,526 827,176 840,805 853,940 865,367
St. Clair Co. Total 62,614 65,243 66,061 67,045 68,350 70,038
St. Clair Co. Non-customers 61,823 64,432 65,231 66,200 67,498 69,165
St. Clair Co. DWSD Customers 791 811 830 845 852 873
Washtenaw Co. Total 236,676 246,721 252,598 260,024 268,528 277,576
Washtenaw Co. Non-customers 177,029 184,613 188,972 194,649 201,208 208,060
Washtenaw Co. DWSD Customers 59,647 62,108 63,626 65,375 67,320 69,516
Wayne Co. Total (outside Detroit) 509,859 522,832 527,342 531,131 535,371 540,431
Wayne Co. Non-customers 25,123 25,450 25,735 26,004 26,341 26,635
Wayne Co. DWSD Customers (outside Detroit)
484,736 497,382 501,607 505,127 509,030 513,796
City of Detroit 347,545 357,247 353,242 352,394 352,670 354,075
Regional Total 2,630,406 2,753,649 2,794,349 2,839,210 2,887,970 2,938,743
Regional Non-customers 501,917 571,709 685,980 705,754 727,560 750,737
Regional DWSD Customers 2,128,489 2,181,940 2,108,369 2,133,456 2,160,410 2,188,006
Regional DWSD Customers
excluding Genesee County in 2010
and 2015 1,993,389 2,085,240 2,108,369 2,133,456 2,160,410 2,188,006
The following statements can be made in summary of Tables 2-1 and 2-2 and additional information
in TM-2:
1. Employment growth within DWSD customer communities is expected to increase 9.7% over the planning period.
2. The number of residential households within DWSD customer communities is expected to
increase by 3.7 percent. (See TM-2 for a tabulation of households.)

Water Master Plan Update Section 2
Page 22
3. Population within DWSD customer communities (excluding Genesee County) is expected to
decrease 1.6 percent relative to 2010.
4. Compared to the population in the service area in the year 2000, which was approximately
3.78 million, the 2035 projection represents a 6.1 percent decline.
5. Current residential population projections to the year 2035 are approximately 12 percent lower than the projections that were the basis for the previous 2004 Comprehensive Water Master Plan.
2.5 Basis of Cost Estimates Cost estimates for the Water Master Plan Update are based on planning level investigations, and these
cost estimates are intended for comparison of alternatives and general capital budgeting. Estimates in
this report are expected to change as more detailed definition develops through facilities planning and
design investigations. A cost contingency allowance is added to planning level estimates to allow for potential cost increase in later phases of implementation.
The following terms and values are used in the planning level cost estimates:
Construction Cost: Estimated construction contract cost for furnishing materials, equipment and
labor, testing and warranties. Construction cost estimates are generally based on recent bids for similar construction. All construction costs are presented based on prevailing prices in metropolitan
Detroit in December 2013. Where cost estimates prepared in previous years were used, these were
escalated to December 2013 prevailing prices.
Unit Prices: Unitized construction costs expressed as “$ per foot” for transmission mains or “$ per gallon” for reservoirs. Unit prices provide a basis for comparing the relative cost of different projects.
Engineering Cost: The cost of engineering during design and construction. An allowance of 15
percent is used for the estimates in this report. If substantial geotechnical investigation or other special services are anticipated, additional allowances are added for these.
Administrative and Legal: The cost of the owner (DWSD) to procure, award, contract manage,
administer and provide routine legal support for a project. An allowance of 5 percent has been used
for the estimates in this report.
Land and Easements: The estimated cost of land and easement acquisition for a project. These are
estimated on a case-by-case basis.
Contingency: An allowance for additional requirements that may be discovered in subsequent stages
of engineering. An allowance of 15 percent is used for this report. This includes 10 percent for new
requirements during the design phase and 5 percent for change to construction contract price based
on unexpected field conditions or requested changes. This type of allowance is continually reduced
after planning is completed, and design progresses.
Cost estimates have been prepared in accordance with standards of the Association for the
Advancement of Cost Engineering International (AACE International). They are generally based on
Water Master Plan Update Section 2
Page 23
Class 4, 10 percent conceptual or preliminary design. Construction estimates are expected to be
accurate with a range of 50 percent higher to 30 percent lower, and are for use as budgetary values
only.
The previous Needs Assessment reports for water treatment plants prepared in 2002 used different
factors for engineering, legal, and administrative services and project contingencies. Also, the 2004
Comprehensive Water Master Plan presented its estimates of capital cost based on different factors.
The factors in those previous efforts ranged from 26 to 56 percent total allocations, compared to the
35 percent used for this Water Master Plan Update. The current plan includes more investigation and
review of previous project concepts and cost estimates with DWSD staff and wholesale customers.
Technical Memorandum TM- 4 provides detail on the basis of construction cost estimates.
Construction cost estimates are based on recent available bid prices within the DWSD service area.
The scope of work for this project included an update of costs from previous needs assessment
reports prepared in 2002. In that case, current construction costs are estimated based on escalation
according to the Engineering News Record Construction Cost Index.
2.5.1 Life Cycle Cost Evaluation
One of the major tasks for the previous Product Plan Interim Report and ongoing analysis of water treatment plant consolidation was an evaluation of the economics for water plant closures and
repurposing. This evaluation required the consideration of capital costs, operating costs, and the
staging of when construction would occur. There are several alternatives for water plant closures, and
these alternatives have significantly different operating and capital costs. In order to compare all alternatives on a consistent economic basis, a life cycle cost evaluation was performed. The life cycle
cost evaluation considers a time series of new capital, replacement, salvage, and annual operating
costs over the 20-year planning period. All costs in the time series are then represented by one
number, called the Present Worth, as of March 2014.
The alternative with the lowest Present Worth cost is the most cost-effective in consideration of expenditures and benefits. In developing the different alternatives, it is important that all meet the
same threshold of level of service, reliability and redundancy.
Not all factors in the plant closure evaluation can be equated into annual costs and capital costs. There
are non-monetary factors, such as potential future scenarios for regulations and growth, and certain
risks that are best understood as additional decision criteria outside of the life cycle cost evaluation.
These non-monetary factors are discussed in Chapter 6.
The life cycle cost evaluation was performed in accordance with the United States Office of Management and Budget Circular A-94.Revised, titled: “Guidelines and Discount Rates for Benefit-Cost
Analysis of Federal Programs.” These guidelines are generally used in programs when federal funding
is provided for water and transportation projects.
In the context of the OMB Circular A-94 guidelines, the discount rate is an important economic factor.
This factor is used to translate future expenditures and benefits over time to the single Present Worth
value described above. In order to compute Present Worth, it is necessary to discount future benefits
and costs. The OMB guidance on the use of discount rates is presented below:
Water Master Plan Update Section 2
Page 24
“This discounting reflects the time value of money. Benefits and costs are worth more if they are
experienced sooner. All future benefits and costs, including non-monetized benefits and costs, should
be discounted. The higher the discount rate, the lower is the present value of future cash flows. For typical investments, with costs concentrated in early periods and benefits following in later periods,
raising the discount rate tends to reduce the net present value.”
In the context of the water plant closure evaluation, the alternatives are structured so that benefits are
consistent for all alternatives, as measured by the level of service goal. The largest uncertainty for DWSD and its customers is how costs could rise in the future, in order to achieve the level of service
benefits. Future costs include construction, financing, and energy, chemical, labor and benefits.
In order to address the uncertainty around future costs, the life cycle evaluation was performed twice,
once with a lower discount rate, then again with a higher discount rate. The low discount rate was 4
percent per year, and the high rate was 7 percent per year.
This range of rates is typical of the range of values currently used in the United States for cost-benefit
studies performed in accordance with Circular A-94. The higher discount rate reflects a scenario of costs increasing at a higher rate than has been the case over the last 5 years. The lower discount rate
reflects a scenario of costs increasing at approximately the same rate as over the last 5 years.
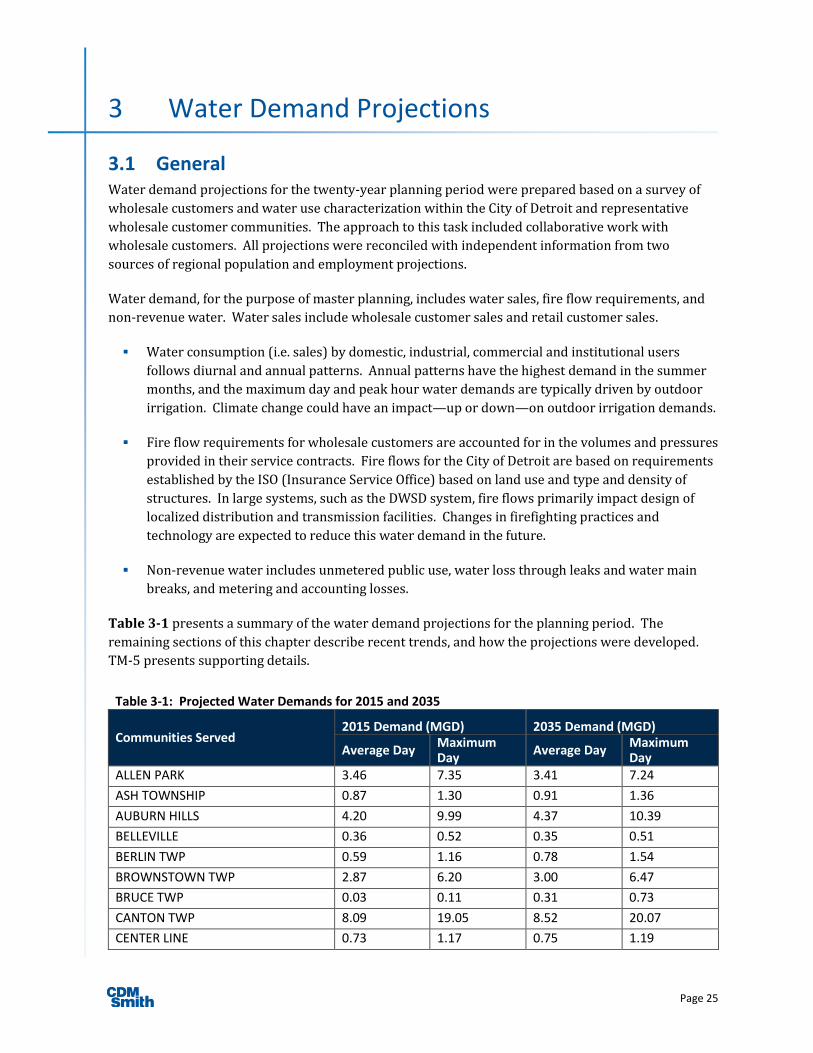
Page 25
3 Water Demand Projections
3.1 General Water demand projections for the twenty-year planning period were prepared based on a survey of wholesale customers and water use characterization within the City of Detroit and representative
wholesale customer communities. The approach to this task included collaborative work with
wholesale customers. All projections were reconciled with independent information from two
sources of regional population and employment projections.
Water demand, for the purpose of master planning, includes water sales, fire flow requirements, and
non-revenue water. Water sales include wholesale customer sales and retail customer sales.
Water consumption (i.e. sales) by domestic, industrial, commercial and institutional users
follows diurnal and annual patterns. Annual patterns have the highest demand in the summer months, and the maximum day and peak hour water demands are typically driven by outdoor irrigation. Climate change could have an impact—up or down—on outdoor irrigation demands.
Fire flow requirements for wholesale customers are accounted for in the volumes and pressures provided in their service contracts. Fire flows for the City of Detroit are based on requirements
established by the ISO (Insurance Service Office) based on land use and type and density of structures. In large systems, such as the DWSD system, fire flows primarily impact design of localized distribution and transmission facilities. Changes in firefighting practices and
technology are expected to reduce this water demand in the future.
Non-revenue water includes unmetered public use, water loss through leaks and water main
breaks, and metering and accounting losses.
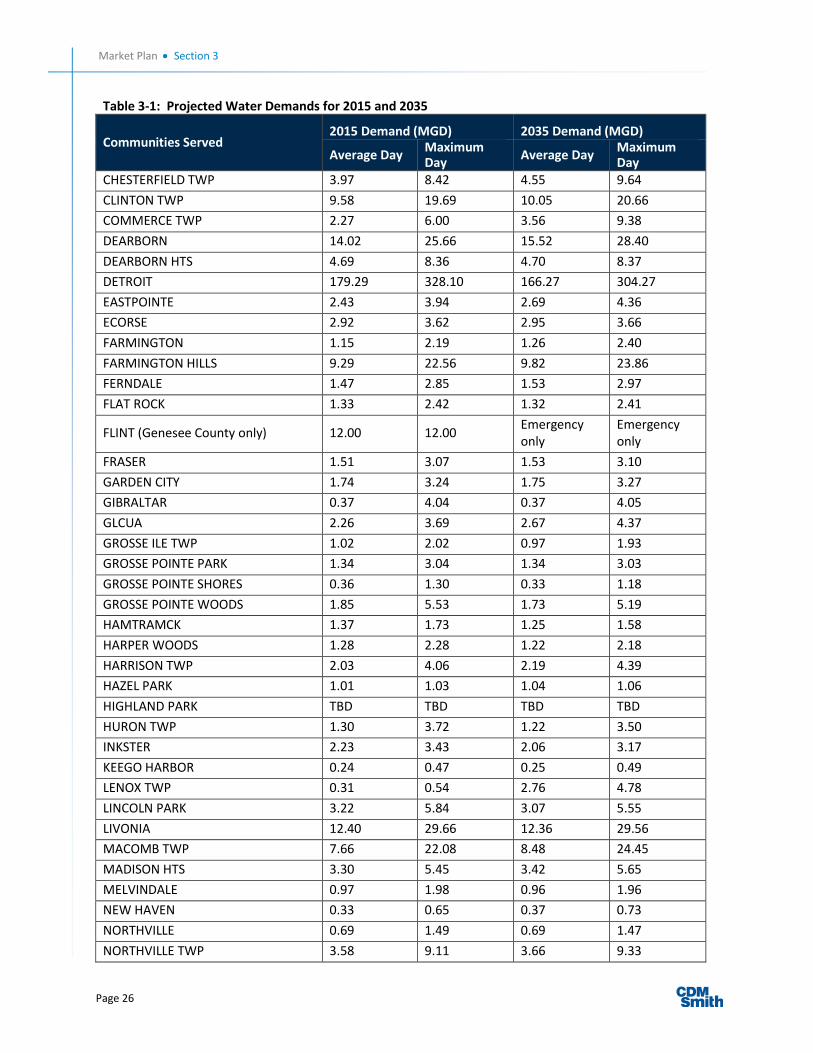
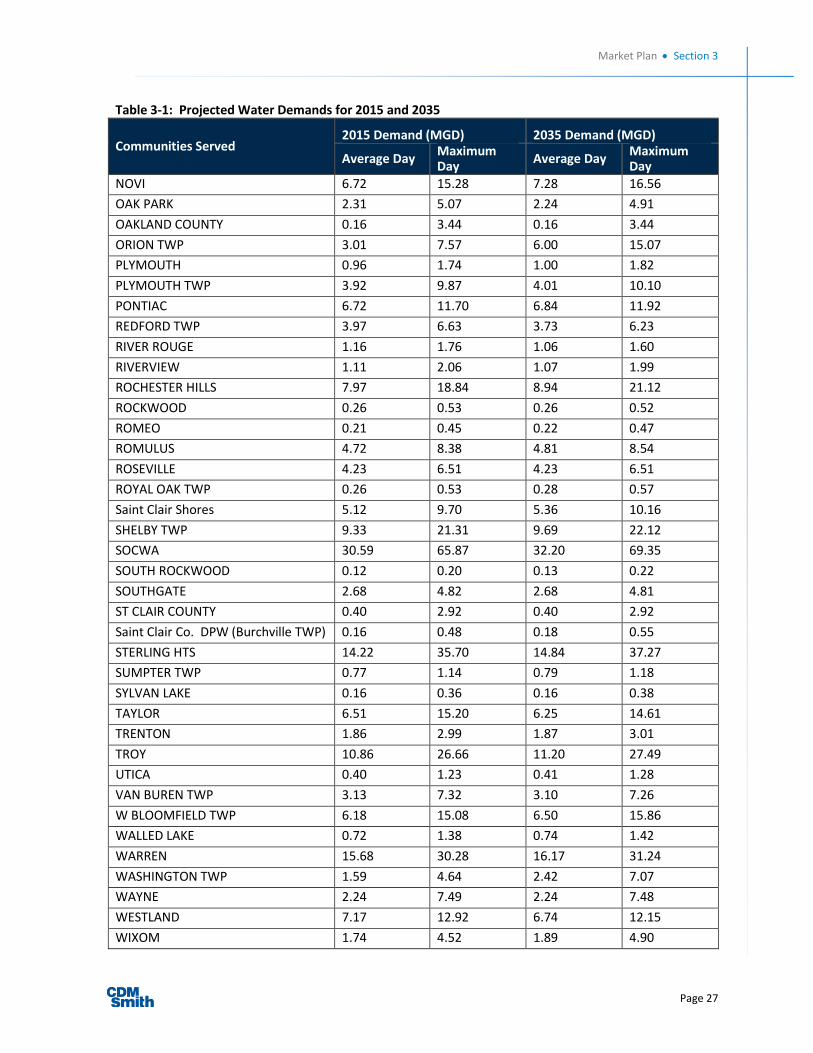
Table 3-1 presents a summary of the water demand projections for the planning period. The
remaining sections of this chapter describe recent trends, and how the projections were developed.
TM-5 presents supporting details.
Table 3-1: Projected Water Demands for 2015 and 2035
Communities Served 2015 Demand (MGD) 2035 Demand (MGD)
Average Day Maximum Day
Average Day Maximum Day
ALLEN PARK 3.46 7.35 3.41 7.24
ASH TOWNSHIP 0.87 1.30 0.91 1.36
AUBURN HILLS 4.20 9.99 4.37 10.39
BELLEVILLE 0.36 0.52 0.35 0.51
BERLIN TWP 0.59 1.16 0.78 1.54
BROWNSTOWN TWP 2.87 6.20 3.00 6.47
BRUCE TWP 0.03 0.11 0.31 0.73
CANTON TWP 8.09 19.05 8.52 20.07
CENTER LINE 0.73 1.17 0.75 1.19
Market Plan Section 3
Page 26
Table 3-1: Projected Water Demands for 2015 and 2035
Communities Served 2015 Demand (MGD) 2035 Demand (MGD)
Average Day Maximum Day
Average Day Maximum Day
CHESTERFIELD TWP 3.97 8.42 4.55 9.64
CLINTON TWP 9.58 19.69 10.05 20.66
COMMERCE TWP 2.27 6.00 3.56 9.38
DEARBORN 14.02 25.66 15.52 28.40
DEARBORN HTS 4.69 8.36 4.70 8.37
DETROIT 179.29 328.10 166.27 304.27
EASTPOINTE 2.43 3.94 2.69 4.36
ECORSE 2.92 3.62 2.95 3.66
FARMINGTON 1.15 2.19 1.26 2.40
FARMINGTON HILLS 9.29 22.56 9.82 23.86
FERNDALE 1.47 2.85 1.53 2.97
FLAT ROCK 1.33 2.42 1.32 2.41
FLINT (Genesee County only) 12.00 12.00 Emergency only
Emergency only
FRASER 1.51 3.07 1.53 3.10
GARDEN CITY 1.74 3.24 1.75 3.27
GIBRALTAR 0.37 4.04 0.37 4.05
GLCUA 2.26 3.69 2.67 4.37
GROSSE ILE TWP 1.02 2.02 0.97 1.93
GROSSE POINTE PARK 1.34 3.04 1.34 3.03
GROSSE POINTE SHORES 0.36 1.30 0.33 1.18
GROSSE POINTE WOODS 1.85 5.53 1.73 5.19
HAMTRAMCK 1.37 1.73 1.25 1.58
HARPER WOODS 1.28 2.28 1.22 2.18
HARRISON TWP 2.03 4.06 2.19 4.39
HAZEL PARK 1.01 1.03 1.04 1.06
HIGHLAND PARK TBD TBD TBD TBD
HURON TWP 1.30 3.72 1.22 3.50
INKSTER 2.23 3.43 2.06 3.17
KEEGO HARBOR 0.24 0.47 0.25 0.49
LENOX TWP 0.31 0.54 2.76 4.78
LINCOLN PARK 3.22 5.84 3.07 5.55
LIVONIA 12.40 29.66 12.36 29.56
MACOMB TWP 7.66 22.08 8.48 24.45
MADISON HTS 3.30 5.45 3.42 5.65
MELVINDALE 0.97 1.98 0.96 1.96
NEW HAVEN 0.33 0.65 0.37 0.73
NORTHVILLE 0.69 1.49 0.69 1.47
NORTHVILLE TWP 3.58 9.11 3.66 9.33
Market Plan Section 3
Page 27
Table 3-1: Projected Water Demands for 2015 and 2035
Communities Served 2015 Demand (MGD) 2035 Demand (MGD)
Average Day Maximum Day
Average Day Maximum Day
NOVI 6.72 15.28 7.28 16.56
OAK PARK 2.31 5.07 2.24 4.91
OAKLAND COUNTY 0.16 3.44 0.16 3.44
ORION TWP 3.01 7.57 6.00 15.07
PLYMOUTH 0.96 1.74 1.00 1.82
PLYMOUTH TWP 3.92 9.87 4.01 10.10
PONTIAC 6.72 11.70 6.84 11.92
REDFORD TWP 3.97 6.63 3.73 6.23
RIVER ROUGE 1.16 1.76 1.06 1.60
RIVERVIEW 1.11 2.06 1.07 1.99
ROCHESTER HILLS 7.97 18.84 8.94 21.12
ROCKWOOD 0.26 0.53 0.26 0.52
ROMEO 0.21 0.45 0.22 0.47
ROMULUS 4.72 8.38 4.81 8.54
ROSEVILLE 4.23 6.51 4.23 6.51
ROYAL OAK TWP 0.26 0.53 0.28 0.57
Saint Clair Shores 5.12 9.70 5.36 10.16
SHELBY TWP 9.33 21.31 9.69 22.12
SOCWA 30.59 65.87 32.20 69.35
SOUTH ROCKWOOD 0.12 0.20 0.13 0.22
SOUTHGATE 2.68 4.82 2.68 4.81
ST CLAIR COUNTY 0.40 2.92 0.40 2.92
Saint Clair Co. DPW (Burchville TWP) 0.16 0.48 0.18 0.55
STERLING HTS 14.22 35.70 14.84 37.27
SUMPTER TWP 0.77 1.14 0.79 1.18
SYLVAN LAKE 0.16 0.36 0.16 0.38
TAYLOR 6.51 15.20 6.25 14.61
TRENTON 1.86 2.99 1.87 3.01
TROY 10.86 26.66 11.20 27.49
UTICA 0.40 1.23 0.41 1.28
VAN BUREN TWP 3.13 7.32 3.10 7.26
W BLOOMFIELD TWP 6.18 15.08 6.50 15.86
WALLED LAKE 0.72 1.38 0.74 1.42
WARREN 15.68 30.28 16.17 31.24
WASHINGTON TWP 1.59 4.64 2.42 7.07
WAYNE 2.24 7.49 2.24 7.48
WESTLAND 7.17 12.92 6.74 12.15
WIXOM 1.74 4.52 1.89 4.90
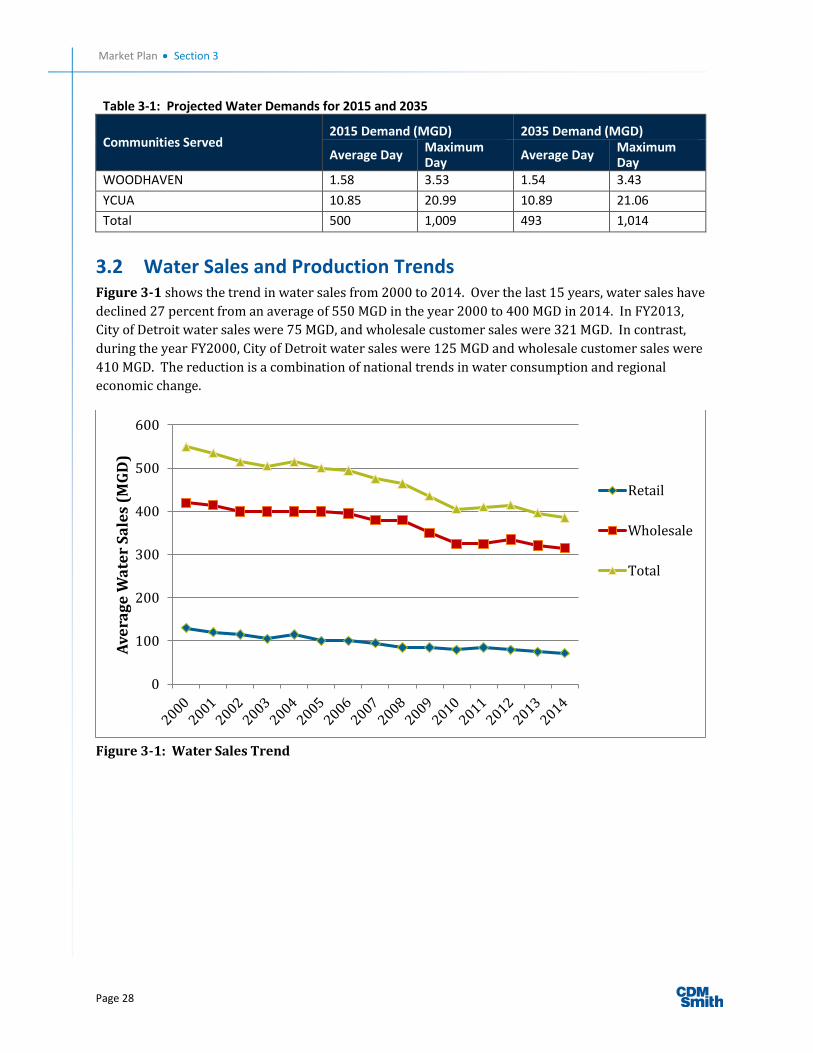
Market Plan Section 3
Page 28
Table 3-1: Projected Water Demands for 2015 and 2035
Communities Served 2015 Demand (MGD) 2035 Demand (MGD)
Average Day Maximum Day
Average Day Maximum Day
WOODHAVEN 1.58 3.53 1.54 3.43
YCUA 10.85 20.99 10.89 21.06
Total 500 1,009 493 1,014
3.2 Water Sales and Production Trends Figure 3-1 shows the trend in water sales from 2000 to 2014. Over the last 15 years, water sales have
declined 27 percent from an average of 550 MGD in the year 2000 to 400 MGD in 2014. In FY2013,
City of Detroit water sales were 75 MGD, and wholesale customer sales were 321 MGD. In contrast, during the year FY2000, City of Detroit water sales were 125 MGD and wholesale customer sales were
410 MGD. The reduction is a combination of national trends in water consumption and regional
economic change.
Figure 3-1: Water Sales Trend
0
100
200
300
400
500
600
Ave
rag
e W
ate
r S
ale
s (M
GD
)
Retail
Wholesale
Total

Market Plan Section 3
Page 29
During the same period, nonrevenue water has increased to an annualized average of 165 MGD in FY
2014. Nonrevenue water is discussed in more detail in Section 3.8. Figure 3-2 shows the principle
components of DWSD water production for FY2013.
Figure 3-2: Current Use of Total Water Production FY2013
Figures 3-3 and 3-4 show the past ten years of water production trends. These figures show daily
water production at each water treatment plant, along with total production. Average production
exceeded 600 MGD prior to 2004, and is now approximately 550 MGD. There are some time periods
when production numbers were missing from the available data.
These charts show the trend in water production from each plant. The five plants operate at an
average of 30 percent rated capacity in non-peak season, and recent maximum day production has
been 53 percent of rated capacity, as shown in Table 3-2.
Table 3-2: Recent Plant Production Relative to Rated Capacity 2003 to 2013
Plant
Rated Capacity MGD
2003 Average Production
2013 Average Production
2013 Maximum Day
2013 Average Percent Loading
2013 Maximum Percent Loading
Southwest 240 75 55 100 23 42
Northeast 300 130 105 200 35 67
Lake Huron 400 125 110 225 28 56
Water Works Park 240 100 80* 90* 33 38
Springwells 540 200 175 300 32 56
Total 1,720 630 525 915 30 53 *Water production at Water Works Park is currently limited by yard piping restrictions. DWSD has designed the required improvements, and this project is in the current CIP for construction.
321 MGD150 MGD
75 MGD
Suburban Sales Nonrevenue Water Retail Sales

Market Plan Section 3
Page 30
*Data were not available for July and December 1998.
Figure 3-3: 10-Year Pumping Record for the Northeast, Southwest and Lake Huron WTPs
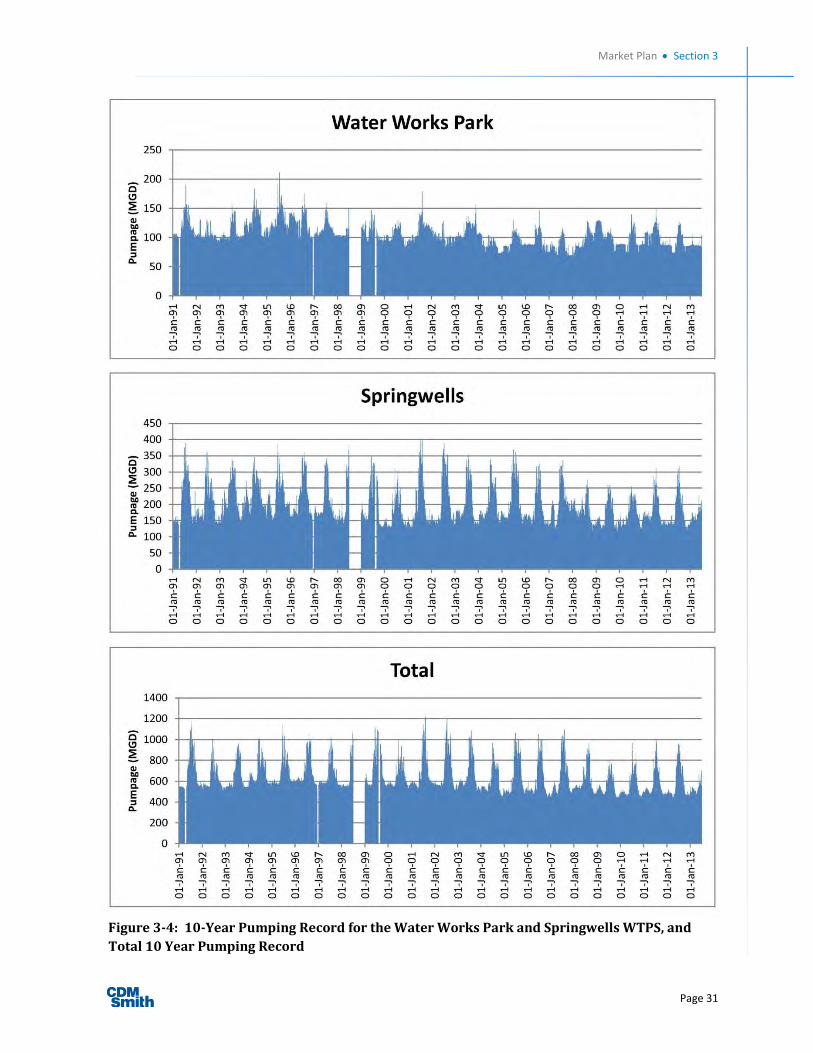
Market Plan Section 3
Page 31
Figure 3-4: 10-Year Pumping Record for the Water Works Park and Springwells WTPS, and
Total 10 Year Pumping Record
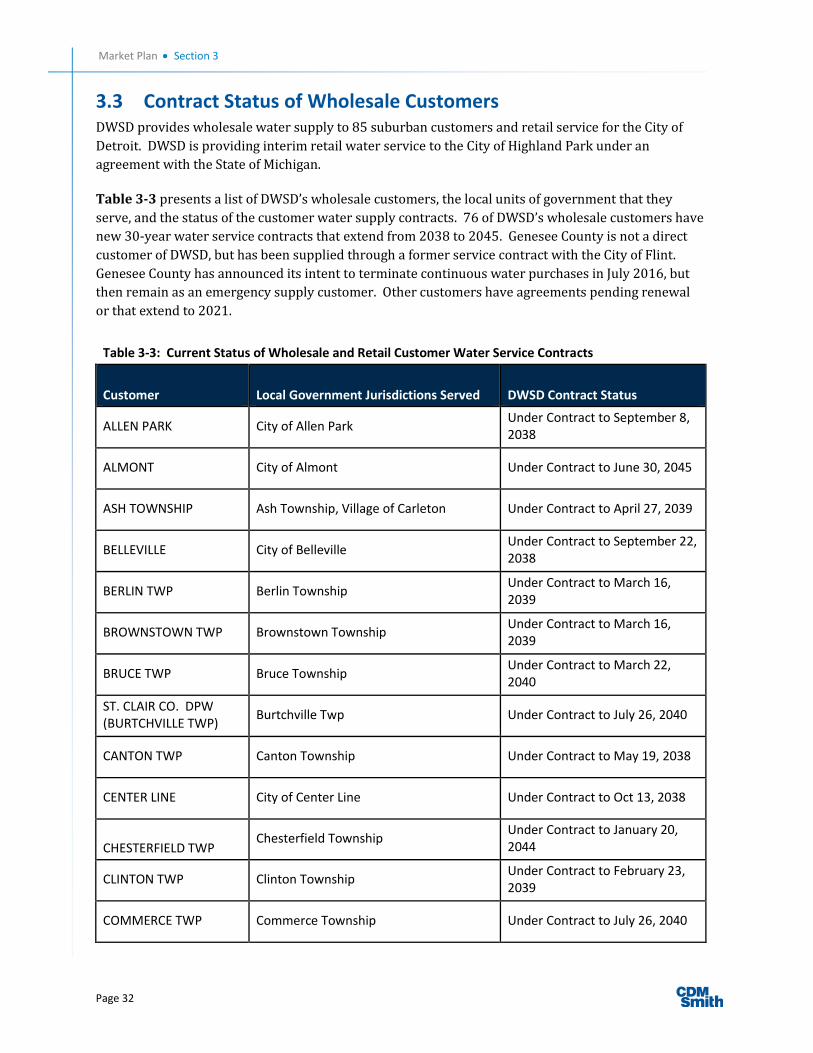
Market Plan Section 3
Page 32
3.3 Contract Status of Wholesale Customers DWSD provides wholesale water supply to 85 suburban customers and retail service for the City of Detroit. DWSD is providing interim retail water service to the City of Highland Park under an
agreement with the State of Michigan.
Table 3-3 presents a list of DWSD’s wholesale customers, the local units of government that they
serve, and the status of the customer water supply contracts. 76 of DWSD’s wholesale customers have
new 30-year water service contracts that extend from 2038 to 2045. Genesee County is not a direct
customer of DWSD, but has been supplied through a former service contract with the City of Flint. Genesee County has announced its intent to terminate continuous water purchases in July 2016, but
then remain as an emergency supply customer. Other customers have agreements pending renewal
or that extend to 2021.
Table 3-3: Current Status of Wholesale and Retail Customer Water Service Contracts
Customer Local Government Jurisdictions Served DWSD Contract Status
ALLEN PARK City of Allen Park Under Contract to September 8, 2038
ALMONT City of Almont Under Contract to June 30, 2045
ASH TOWNSHIP Ash Township, Village of Carleton Under Contract to April 27, 2039
BELLEVILLE City of Belleville Under Contract to September 22, 2038
BERLIN TWP Berlin Township Under Contract to March 16, 2039
BROWNSTOWN TWP Brownstown Township Under Contract to March 16, 2039
BRUCE TWP Bruce Township Under Contract to March 22, 2040
ST. CLAIR CO. DPW (BURTCHVILLE TWP)
Burtchville Twp Under Contract to July 26, 2040
CANTON TWP Canton Township Under Contract to May 19, 2038
CENTER LINE City of Center Line Under Contract to Oct 13, 2038
CHESTERFIELD TWP Chesterfield Township
Under Contract to January 20, 2044
CLINTON TWP Clinton Township Under Contract to February 23, 2039
COMMERCE TWP Commerce Township Under Contract to July 26, 2040
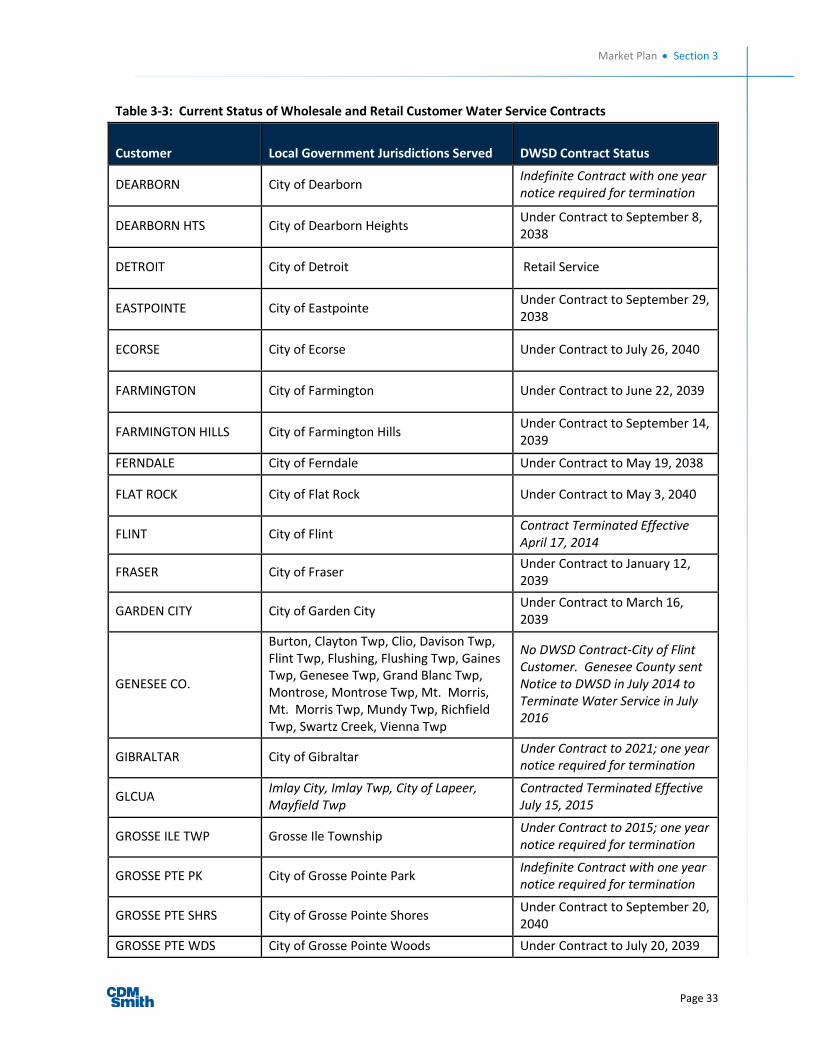
Market Plan Section 3
Page 33
Table 3-3: Current Status of Wholesale and Retail Customer Water Service Contracts
Customer Local Government Jurisdictions Served DWSD Contract Status
DEARBORN City of Dearborn Indefinite Contract with one year notice required for termination
DEARBORN HTS City of Dearborn Heights Under Contract to September 8, 2038
DETROIT City of Detroit Retail Service
EASTPOINTE City of Eastpointe Under Contract to September 29, 2038
ECORSE City of Ecorse Under Contract to July 26, 2040
FARMINGTON City of Farmington Under Contract to June 22, 2039
FARMINGTON HILLS City of Farmington Hills Under Contract to September 14, 2039
FERNDALE City of Ferndale Under Contract to May 19, 2038
FLAT ROCK City of Flat Rock Under Contract to May 3, 2040
FLINT City of Flint Contract Terminated Effective April 17, 2014
FRASER City of Fraser Under Contract to January 12, 2039
GARDEN CITY City of Garden City Under Contract to March 16, 2039
GENESEE CO.
Burton, Clayton Twp, Clio, Davison Twp, Flint Twp, Flushing, Flushing Twp, Gaines Twp, Genesee Twp, Grand Blanc Twp, Montrose, Montrose Twp, Mt. Morris, Mt. Morris Twp, Mundy Twp, Richfield Twp, Swartz Creek, Vienna Twp
No DWSD Contract-City of Flint Customer. Genesee County sent Notice to DWSD in July 2014 to Terminate Water Service in July 2016
GIBRALTAR City of Gibraltar Under Contract to 2021; one year notice required for termination
GLCUA Imlay City, Imlay Twp, City of Lapeer, Mayfield Twp
Contracted Terminated Effective July 15, 2015
GROSSE ILE TWP Grosse Ile Township Under Contract to 2015; one year notice required for termination
GROSSE PTE PK City of Grosse Pointe Park Indefinite Contract with one year notice required for termination
GROSSE PTE SHRS City of Grosse Pointe Shores Under Contract to September 20, 2040
GROSSE PTE WDS City of Grosse Pointe Woods Under Contract to July 20, 2039

Market Plan Section 3
Page 34
Table 3-3: Current Status of Wholesale and Retail Customer Water Service Contracts
Customer Local Government Jurisdictions Served DWSD Contract Status
HAMTRAMCK City of Hamtramck Under Contract to June 14, 2040
HARPER WOODS City of Harper Woods Under Contract to May 17, 2040
HARRISON TWP Harrison Township Under Contract to July 26, 2040
HAZEL PARK City of Hazel Park Under Contract to May 3, 2040
HIGHLAND PARK City of Highland Park Service Being Provided through an Agreement with the State of Michigan
HURON TWP Huron Township Under Contract to May 18, 2039
INKSTER City of Inkster Under Contract to 2021
KEEGO HARBOR City of Keego Harbor Under Contract to September 14, 2039
LENOX TWP Lenox Township Under Contract to September 14, 2039
LINCOLN PARK City of Lincoln Park Under Contract to January 20, 2044
LIVONIA City of Livonia Under Contract to July 20, 2039
MACOMB TWP Macomb Township Under Contract to July 20, 2039
MADISON HTS City of Madison Heights Under Contract to September 14, 2039
MELVINDALE City of Melvindale Under Contract to July 20, 2039
NEW HAVEN Village of New Haven Under Contract to May 3, 2040
NOCWA
Auburn Hills, Orion Twp., Pontiac, Rochester Hills
Under Contract to February 4, 2045
NORTHVILLE City of Northville Under Contract to June 23, 2038
NORTHVILLE TWP Northville Township Under Contract to June 23, 2038
NOVI City of Novi Under Contract to July 20, 2039
OAK PARK City of Oak Park Under Contract to March 16, 2039
OAKLAND COUNTY (Kuhn District)
Kuhn Drain Facility Under Contract to November 19, 2039

Market Plan Section 3
Page 35
Table 3-3: Current Status of Wholesale and Retail Customer Water Service Contracts
Customer Local Government Jurisdictions Served DWSD Contract Status
PLYMOUTH City of Plymouth Under Contract to October 13, 2038
PLYMOUTH TWP Plymouth Township, Salem Township Under Contract to May 18, 2039
REDFORD TWP Redford Township Under Contract to August 7, 2038
RIVER ROUGE City of River Rouge Under Contract to July 26, 2040
RIVERVIEW City of Riverview Contract expired 2014; one year notice required for termination
ROCKWOOD City of Rockwood Under Contract to January 11, 2040
ROMEO Romeo Industrial District Under Contract to July 16, 2042
ROMULUS City of Romulus Under Contract to April 27, 2039
ROSEVILLE City of Roseville Under Contract to October 13, 2038
ROYAL OAK TWP Royal Oak Township Under Contract to May 17, 2040
SHELBY TWP Shelby Township, Portion of City of Rochester through SY-08/RH-01
Under Contract to May 17, 2040
SOCWA
Berkley, Beverly Hills, Bingham Farms, Birmingham, Bloomfield Hills, Bloomfield Twp, Clawson, Huntington Woods, Lathrup Village, Pleasant Ridge, Royal Oak, Southfield, Southfield Twp, Village of Franklin
Under Contract to September 14, 2039
SOUTH ROCKWOOD Village of South Rockwood Under Contract to February 23, 2039
SOUTHGATE City of Southgate Under Contract to March 16, 2039
ST CLAIR COUNTY / Greenwood DTE supply
St. Clair County Board of Public Works Contract expired 2009; one year notice required for termination
ST CLAIR SHORES City of St Clair Shores Under Contract to September 29, 2038
STERLING HTS City of Sterling Heights Under Contract to July 21, 2038
SUMPTER TWP Sumpter Township Under Contract to July 26, 2040

Market Plan Section 3
Page 36
Table 3-3: Current Status of Wholesale and Retail Customer Water Service Contracts
Customer Local Government Jurisdictions Served DWSD Contract Status
SYLVAN LAKE City of Sylvan Lake Under Contract to September 20, 2040
TAYLOR City of Taylor Under Contract to September 8, 2038
TRENTON City of Trenton Contract Expires 2020; one year notice required for termination
TROY City of Troy Under Contract to June 23, 2038
UTICA City of Utica Under Contract to January 26, 2039
VAN BUREN TWP Van Buren Township Under Contract to June 23, 2038
W BLOOMFIELD TWP West Bloomfield Township, Orchard Lake Under Contract to June 23, 2038
WALLED LAKE Walled Lake Under Contract to October 5, 2039
WARREN City of Warren Under Contract to February 21, 2041
WASHINGTON TWP Washington Township Under Contract to June 23, 2038
WAYNE City of Wayne Under Contract to October 13, 2038
WESTLAND City of Westland Under Contract to March 16, 2039
WIXOM City of Wixom Under Contract to December 1, 2038
WOODHAVEN City of Woodhaven Under Contract to September 22, 2038
YPSILANTI (YCUA) Augusta Twp, Pittsfield Twp, Superior Twp, York Twp, City of Ypsilanti, Ypsilanti Twp
Under Contract to May 19, 2038
Overall, DWSD has 92 percent of its annual recent water sales volume under agreements that extend
beyond the planning period. Given the long term status of most contracts, detailed demand
projections have been made for the current base of wholesale customers and retail customers.
It is possible that new customers will seek to join the regional water supply system during the
planning period. It is also possible that one or more existing customers could choose to terminate
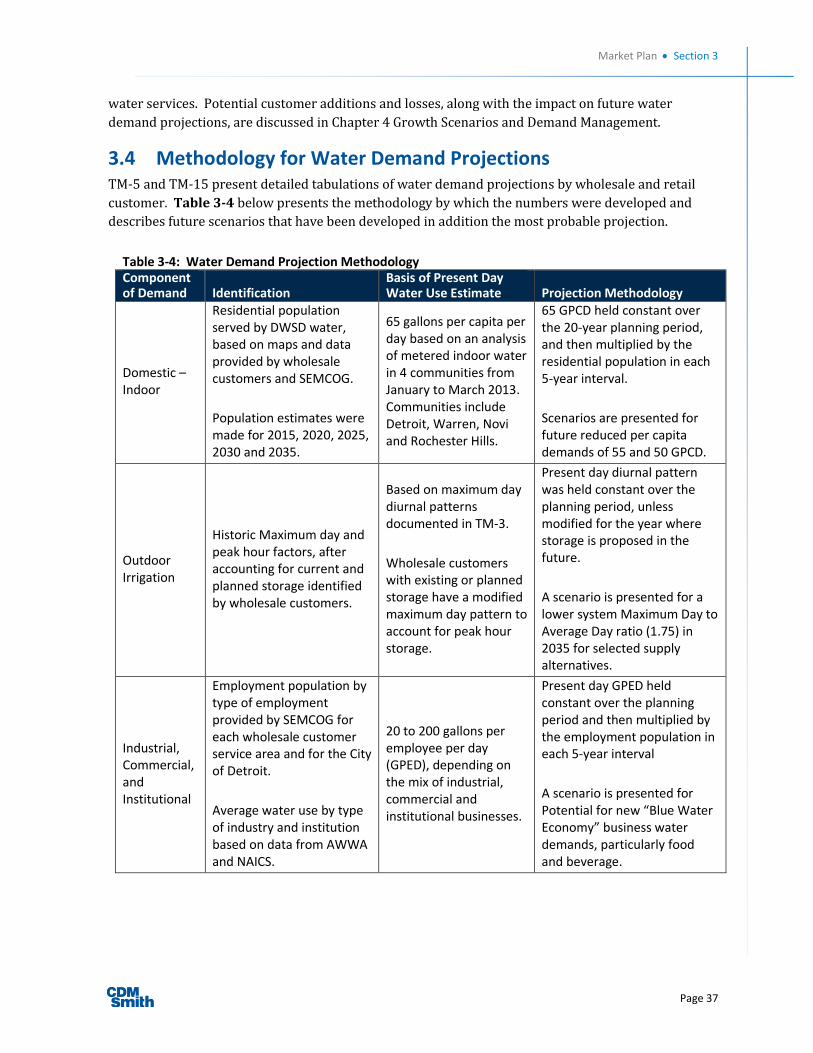
Market Plan Section 3
Page 37
water services. Potential customer additions and losses, along with the impact on future water demand projections, are discussed in Chapter 4 Growth Scenarios and Demand Management.
3.4 Methodology for Water Demand Projections TM-5 and TM-15 present detailed tabulations of water demand projections by wholesale and retail customer. Table 3-4 below presents the methodology by which the numbers were developed and
describes future scenarios that have been developed in addition the most probable projection.
Table 3-4: Water Demand Projection Methodology Component of Demand Identification
Basis of Present Day Water Use Estimate Projection Methodology
Domestic – Indoor
Residential population served by DWSD water, based on maps and data provided by wholesale customers and SEMCOG.
Population estimates were made for 2015, 2020, 2025, 2030 and 2035.
65 gallons per capita per day based on an analysis of metered indoor water in 4 communities from January to March 2013. Communities include Detroit, Warren, Novi and Rochester Hills.
65 GPCD held constant over the 20-year planning period, and then multiplied by the residential population in each 5-year interval.
Scenarios are presented for future reduced per capita demands of 55 and 50 GPCD.
Outdoor Irrigation
Historic Maximum day and peak hour factors, after accounting for current and planned storage identified by wholesale customers.
Based on maximum day diurnal patterns documented in TM-3.
Wholesale customers with existing or planned storage have a modified maximum day pattern to account for peak hour storage.
Present day diurnal pattern was held constant over the planning period, unless modified for the year where storage is proposed in the future.
A scenario is presented for a lower system Maximum Day to Average Day ratio (1.75) in 2035 for selected supply alternatives.
Industrial, Commercial, and Institutional
Employment population by type of employment provided by SEMCOG for each wholesale customer service area and for the City of Detroit.
Average water use by type of industry and institution based on data from AWWA and NAICS.
20 to 200 gallons per employee per day (GPED), depending on the mix of industrial, commercial and institutional businesses.
Present day GPED held constant over the planning period and then multiplied by the employment population in each 5-year interval
A scenario is presented for Potential for new “Blue Water Economy” business water demands, particularly food and beverage.

Market Plan Section 3
Page 38
Table 3-4: Water Demand Projection Methodology Component of Demand Identification
Basis of Present Day Water Use Estimate Projection Methodology
Major Industrial Users
Individually identified as users of 25,000 GPD or more as provided by DWSD for FY2014 in the wastewater service area; and as identified by wholesale customer survey forms for areas outside of the wastewater service area.
Actual water use FY2013 or FY2014.
Held constant over the 20-year planning period.
Scenarios for reduced water use by major industrial users are discussed in Chapter 4.
Fire Flow
Applicable for retail service area of Detroit and Highland Park.
Wholesale customer maximum day and peak hour contract limits are intended to include fire flow requirements.
Insurance Service office standards.
Fire flows were not explicitly considered for the master planning scale of analysis.
Non-Revenue Water
Wholesale Customers:
Comparison of three years of water sales to water purchases from DWSD. These data were available for 22 wholesale customers.
For Detroit, Dearborn and Highland Park: based on findings of CS-1364 Water Audit.
In general, NRW for wholesale customers ranges from 10 to 20 percent, with an average of 15 percent.
Used 10, 15, or 20 percent when data was not available. The higher or lower numbers were used based on relative age of water system.
Held constant over the planning period for wholesale customers.
For the City of Detroit, average daily water loss is estimated to be approximately 90 MGD. Recommended practices to reduce this water loss were presented in the Product Plan Interim Report. For modeling, the current percentage of NRW was held constant for the planning period.
3.5 Domestic Demands Domestic water demand is defined for this study as indoor household use associated with cooking,
bathing, toilet flushing, and cleaning.
Domestic water demand in the United States has been declining for the last twenty years. This is due
to the mandated use of water conserving plumbing fixtures and patterns of behavior to conserve
water. Typical water use per household is approximately 200 gallons per household per day for residence of 2 to 3 persons.
In order to establish accurate per capita indoor domestic water use for the DWSD service area, a
survey of four wholesale customers and three neighborhoods in Detroit was performed. Results of the

Market Plan Section 3
Page 39
survey are described in TM-5. The range of domestic water use ranged from 58 to 72 gallons per
capita per day (GPCD). An average of 65 GPCD was used for calculating future domestic demand
projections.
3.6 Business Water Demands 3.6.1 Industrial, Commercial and Institutional Industrial, commercial, and institutional water demands for Detroit and each wholesale customer were estimated based on projections of the number of employees and types of businesses in each
municipality. SEMCOG maintains projections on numbers of employees and types of businesses for each municipality.
The North American Industrial Classification System (NAICS) provides a classification system for all types of business, which range from heavy industry, to retail commercial, professional services,
schools, hospitals, among others. The NAICS classifications were used to establish an average daily
water use per employee. Typical water demands for most businesses range from 20 gallons per employee per day to 200 gallons per employee per day, depending on the type of business. Lower numbers and higher numbers apply for certain types of businesses. Details of the methodology of developing these water demands are presented in TM-5.
3.6.2 Major Industrial Users
Major industrial users are defined as individual locations that use 25,000 gallons of water or more per day. Major industrial users are a subset of the industrial, commercial and institutional water demands
described previously. However, because of the size of these individual water demands, these users
were identified separately.
DWSD maintains a list of these users in its service area. The list is maintained by the Industrial
Pretreatment Group in the Wastewater Division, and the list is called “Significant Industrial Users”
(SIU). This list includes industry that meets the threshold for water use, as well as some industry with
special wastewater characteristics, but lower daily water use.
For those wholesale customers that are not located in the DWSD wastewater service area, the major industrial users were identified by the customer on its Technical Data Request form. See Appendix
TM-15 for additional information.
3.6.3 Blue Economy Initiatives Appendix TM-7 describes economic initiatives to expand segments of businesses that are highly
dependent on water in their business process. Examples include food and beverage industry,
agriculture, mining, and certain types of manufacturing. These types of businesses currently
represent less than 5 percent of DWSD’s average water demand. The goal of the Blue Economy Plan is
to expand the number of water-dependent industries in the service area.
3.7 Outdoor Irrigation Outdoor irrigation demands occur primarily in the summer months. Outdoor irrigation drives the
maximum day and peak hour demand, which is typically in June, July or August.

Market Plan Section 3
Page 40
Outdoor irrigation demand is weather dependent. The design maximum day demand of 1,014 MGD
currently estimated for 2035 is a number that is expected to be reached about once every 3 to 5 years.
Table 3-5 shows maximum day and peak hour water use from the previous 10 years.
Table 3-5: Maximum Day and Peak Hour Demands 2005 to 2014
Year Date Maximum Day (MGD) Peak Hour (MGD)
2005 June 27 1,104 1,347
2006 June 17 1,080 1,337
2007 August 3 1,128 1,388
2008 August 18 961 1,184
2009 August 5 804 989
2010 July 7 957 1,130
2011 July 21 1,000 1,205
2012 July 2 969 1,171
2013 August 26 761 914
2014 July 22 720 853
3.8 Non-Revenue Water 3.8.1 Trends in Nonrevenue Water
Nonrevenue water is the difference between the volume of water produced and the volume of metered or estimated sales. Water utilities generally have water production that exceeds water sales.
This is due to meter inaccuracies, losses of water through leaks and breaks, and authorized unmetered
public use of water for firefighting, water main construction and other purposes.
DWSD’s rate setting process includes detailed reporting to wholesale and retail customers on
revenues, prior period expenditures and proposed budgets for capital improvements, financing, and
operation and maintenance. The information presented in the rates process documents the estimated
volume of nonrevenue water. In the last seven years, nonrevenue water has been increasing in
volume and as a percentage of total water production, as shown in Table 3-6.
Table 3-6: Trends in Nonrevenue Water
Period Annual Volume of Nonrevenue Water (MGD)
Percentage of Total Water Production
July 2004 to June 2005 108.0 18.6
July 2005 to June 2006 106.2 17.7
July 2006 to June 2007 101.9 17.7
July 2007 to June 2008 139.2 23.2
July 2008 to June 2009 125.0 22.7
July 2009 to June 2010 113.6 22.0
July 2010 to June 2011 127.1 23.4
July 2011 to June 2012 145.5 26.2
July 2012 to June 2013 152.3 27.7
July 2013 to June 2014 165 30.7

Market Plan Section 3
Page 41
3.8.2 Preliminary Water Balance for FY2012 The American Water Works Association (AWWA) has established terminology and procedures for analyzing and managing nonrevenue water. DWSD performed its first water audit in accordance with
the AWWA procedures in 2006, and it performed a second water audit based on 2012 data. The
purpose of these water audits is to analyze nonrevenue water and develop estimates for leakage,
meter inaccuracy, and authorized, but un-metered public uses and develop strategies to reduce the
NRW volume.
The first step in management of nonrevenue water is to establish best estimates of apparent causes of water loss. Table 3-7 shows preliminary estimates prepared for this Water Master Plan Update based
on results from DWSD’s water audit program and its rate setting methodology.
Table 3-7: Preliminary Water Balance for FY 2012
Category Estimated Volume (Million Gallons)
Approximate Percent of Total Production Basis
Total Production 203,600 FY2013 recorded water production
Over-Registration at WTPs 10,000 to 20,000 5 to 10%
DWSD water audit 2006 pump tests and rate setting methodology
Net Production 183,600 to 193,600
Water Sold to Suburbs 121,200 Actual sales to wholesale customers
Allowance for Transmission and Wholesale Meter Loss 10,000 to 20,000 5 to 10%
DWSD water audits and rate setting methodology
Water Sold to Dearborn 4,500 Actual sale to Dearborn
Allowance for NRW in Dearborn 800 DWSD water audit and rate setting methodology
Water Sold in Detroit 29,200
Allowance for NRW in Detroit 20,000 to 30,000 10 to 15% Rate setting methodology
Total Production 203,600
Total Sales 150,400
Nonrevenue Water (Total Production – Total Sales) 53,200 26.2% Annual financial report
Source: CS 1396 2006 Draft Report; Sept 2013 BOWC Finance Committee Water Supply System Revenue Analysis; and Water Rate Methodology Table 14 Allocation of Non-Revenue Water.
Reducing non-revenue water is a demand management opportunity. Estimated leakage within the
City of Detroit is 50 to 80 MGD, which is 10 to 15 percent of total water production.
Chapter 4 presents a discussion of future scenarios for water loss reduction.

Page 42
THIS PAGE INTENTIONALLY LEFT BLANK.
Page 43
4 Growth and Demand Management Scenarios
4.1 General This chapter identifies future scenarios for growth in population and water sales, as well as scenarios
for managing water demand. Collectively, these scenarios result in future water demands that range
from approximately 5 percent higher to 10 percent lower than the baseline projections in Chapter 3.
Many water utilities face similar uncertainty when planning for 20 years into the future. In DWSD’s
situation, the significant loss of population in the service area since the year 2000, plus termination of water service agreements with the City of Flint and Genesee County have led to a close examination of future scenarios.
While there are recent events that have caused a decline in water sales, there is also data to suggest that water sales will increase over the planning period. Over 90 percent of future demand is
associated with long term contracts; many of these customers expect growth in their service areas;
there are inquiries to DWSD for new water service; and there are regional initiatives for economic
growth.
The underlying factors that drive water consumption were analyzed, and from these factors a series of indicators were identified to track and report annually, and formally assess at 5-year intervals. These
indicators will provide DWSD with the essential data to continue to regularly update this master plan
and guide the capital improvement program.
The projections in this chapter present three scenarios for future growth: most probable, best case
and worst case. In early 2015, it was decided to evaluate a fourth scenario: “worst worst” case. This
fourth scenario was developed for sensitivity analysis for future financial projections, and all four scenarios are quantified in Chapter 10.
4.2 Major Factors and Trends Six major factors that will influence water demands over the planning period were identified.
1. Residential Population
2. Domestic Water Use
3. Outdoor Irrigation
4. Industrial Water Use
5. Water Loss Reduction
6. Addition and Loss of Customers
Each of these factors and recent trends are discussed below.

Market Plan Section 4
Page 44
4.2.1 Residential Population Three projections were created for residential population: most probable, high and low. Figure 4-1
shows the recent history of service area population from 2000 to 2015, along with projections to
2035. The black line is the most probable projection based on input from wholesale customers and
SEMCOG. The light blue line is the high projection, and the darker blue line is the low projection, both
based on SEMCOG’s range of future population projections.
Figure 4-1: DWSD Water Service Population 2000-2035
The decline in water sales from the years 2000 to 2015 is consistent with national trends. The
Michigan State University Institute for Public Utilities reports that annual declines of 1 to 3 percent
per year are not uncommon in the United States during this period. The basis and development of these population projections and high and low scenarios are discussed in Appendix TM-2 and
Appendix TM-15.
4.2.2 Domestic Water Use The trend in household water use in the United States has been a decline that was first observed in the
early 1980’s. Per capita domestic water use has fallen from 80 gallons per capita per day (GPCD) or more, to 60 to 70 GPCD in most recent studies. Projections by the Michigan State University Institute
for Public Utilities point to domestic water use of 45 to 50 GPCD, with a theoretical lower limit of 35
GPCD. These lower numbers reflect new plumbing fixtures and water conserving appliances for household use, personal behavior dedicated to water conservation and reuse, changing attitudes and
environmental ethic, and reduction in water use and waste in reaction to the increasing cost of water as a percentage of household expenses. Future regulatory action could also mandate or incentivize
conservation.
3000
3100
3200
3300
3400
3500
3600
3700
3800
3900
4000
2000 2005 2010 2015 2020 2025 2030 2035 2040
Po
pu
lati
on
(x
10
00
)
Recorded Population Served Most Probable Population Served (x1000)Low Estimate High Estimate

Market Plan Section 4
Page 45
Water conserving plumbing fixtures have been increasingly regulated through building and plumbing
codes since 1982. Much of the impact of these regulations has already been experienced, but it can be
expected to continue to impact per capita domestic water use through the planning period. Current
estimates of domestic water use in the DWSD service area range from 58 GPCD to 77 GPCD. A range of 50 to 60 GPCD is possible by the end of the planning period.
4.2.3 Outdoor Irrigation The Detroit metropolitan area has had outdoor irrigation regulations in various forms since the mid-1950’s. Over half of DWSD’s wholesale customers have enacted ordinances and/or public education
programs to reduce outdoor irrigation peak demands on the regional system. A detailed evaluation of the quantitative impact of these regulations and public education programs has not been performed.
However, peak hour water demand has fallen by more than 200 MGD in the last 10 years, and this can
be attributed to a combination of peak hour storage, outdoor irrigation regulation and public
education efforts.
Wholesale customers have constructed 95 million gallons of peak shaving storage at 30 locations. 15
million gallons of that storage has been built in the last 7 years and an additional 9 million gallons of storage is planned for the remainder of the planning period.
The impacts of this type of storage are significant in two ways:
1. First, this type of storage reduces the cost of water purchases for wholesale customers under the current rate structure.
2. Second, customer operated storage tanks reduce energy costs for pumping by DWSD.
However, this reduction in energy cost is relatively small compared to other fixed costs for pumping and transmission facilities. The continuing reduction in revenue from water sales
requires continued downsizing of the transmission system in some areas to align with current
and future demands.
The City of Detroit’s green infrastructure program could impact future trends in outdoor irrigation.
This program, which DWSD is both encouraging and funding, has the goal of reducing current and
future costs of managing wet weather runoff in the City of Detroit. Among the methods being
promoted are rain barrels, cisterns, and stormwater retention basins, all of which can also be used to
store rainwater and provide water for irrigation during dry periods. These efforts are intended to
reduce peak summer water use for those customers who adopt the methods.
In some cases, DSWD is actively incentivizing large customers to store and reuse rainwater and
stormwater. As an example, DWSD reports that a major manufacturer is utilizing a previously unused
stormwater pond to retain and reuse runoff from its parking lot, up to a capacity of a few million
gallons per storm. In return for holding this runoff and not releasing it into the sewer system, DWSD
is providing the customer with a substantial reduction in their monthly drainage charge, which is
billed to customers based on their acres of impervious are (e.g. paved lots and rooftops).
Currently DWSD plans to spend at least $3 million per year on green infrastructure. It is likely that some of these activities will end up retaining rainwater for future irrigation use, and may reduce peak
demands for water as well.
Market Plan Section 4
Page 46
4.2.4 Industrial Water Use Another trend is in water use by industry. DWSD Wastewater Division tracks the water consumption
of its significant industrial users (SIUs) as part of its Industrial Pretreatment Program. SIUs are those
industries which purchase at least 25,000 gallons per day of water. Water purchases by the SIUs have
fallen from 45 MGD to 22 MGD from 2000 to 2014. Industrial water use has been declining due to
increased attention to cost control, production efficiency, water reuse, and sustainability practices.
The Blue Economy Plan, and other economic initiatives, could begin to increase industrial and
commercial water demand. A Blue Economy integrates water resources with jobs and development. On-going initiatives underway in Michigan’s Blue Economy intend to grow businesses and jobs in
water-enabled and water-related sectors by utilizing the region’s abundant resources – water, academia, engineering and manufacturing workforces. Water-enabled and water-related industries
are those portions of the economy that produce, implement, or are significantly affected by water research and innovation.
At present, Blue Economy water users represent less than 5 percent of DWSD’s annual water sales.
Food and beverage companies have particular potential for growth, and these represent half of the
current Blue Economy water use. The proposed Blue Economy Plan has the potential for restoring
some of the lost industrial water demand with new highly sustainable industrial and commercial
water users. However, these changes are not expected to have a major impact on average daily
demand, peak daily demand, or the many implementation actions proposed to reduce the system’s
capacity in order to lower fixed costs.
4.2.5 Water Loss Reduction
Many water utilities are implementing water loss reduction programs. These programs address the
whole range of water loss, from water leaks, to metering improvements, and accounting and
enforcement practices. Utilities are using these programs in reaction to aging infrastructure, limited
water supply, or the need to reduce the cost of water purchases. Industry has responded with new
technology for measuring, finding and rehabilitating water pipes. While DWSD has abundant supply,
nonrevenue water has grown for the last 10 years. Reduction in real water loss would reduce the
operating load on treatment plants, high lift and booster pump stations.
Chapter 3 identifies reduction in non-revenue water as a key priority. Real water loss through leakage
in the City of Detroit is estimated to be 50 to 80 MGD. DWSD is vigorously applying a number of methods to locate and eliminate leakage. These efforts, in conjunction with replacement and
rehabilitation of water distribution mains, are expected to produce significant reductions in water loss
over the planning period. See Chapter 9 for recommended actions to reduce non-revenue water.
4.2.6 Addition or Loss of Wholesale Customers Table 3-1 in Chapter 3 presents the water service contract status for current wholesale customers.
The status of service contract was used as a basis for assessing the potential for loss of a customer. On
the other hand, DWSD is receiving inquiries for water service from potential new customers. The
following is a summary of ongoing or potential changes in the future service area:
Market Plan Section 4
Page 47
Wholesale customers in Genesee County are in transition. The City of Flint ended continuous
water purchases in May 2014. Genesee County has provided notice to DWSD that it will end
water purchases and the estimated termination date is in 2017.
Lapeer County customers continue to purchase water from DWSD and are in discussion with
DWSD regarding water supply beyond 2016.
Some wholesale customers in the Downriver area have not signed a long term service contract and are considering water service from the City of Wyandotte.
An examination of smaller water service providers to the west of the regional water service
area was performed to document population growth, source water supply and cost of water service. Treatment and distribution regulations are becoming more stringent; this will tend to
force consolidation of smaller water service providers. Potential new customers who may seek
water service from DWSD in the future would likely be in one of the following three groups.
o Limited Groundwater Supply. There is a significant groundwater aquifer to the west of the DWSD service area. This aquifer stretches from northwest Macomb County, through
northwest Oakland County, and southeast Livingston County to northwest Washtenaw
County. Some parts of this aquifer are impacted by regulated water quality contaminants.
The location of the aquifer establishes a general boundary for cost-competitive water
supply from DWSD. The aquifer delineates the western extent of DWSD’s long term
potential service area. As population growth continues, communities to the south and east of this aquifer could seek water service from DWSD in the future.
o St Clair River Water Service Providers. Another group of potential customers include
smaller water providers whose source water is the St. Clair River. As regulatory
requirements and costs increase, some of these water providers could seek water service
from DWSD in the future.
o Emergency Supply. Larger water service providers, such as Monroe and Ann Arbor, could
seek emergency supply agreements to address seasonal water supply. As noted earlier, the
City of Flint has an emergency supply agreement with DWSD, and Genesee County is
seeking an emergency supply agreement in 2016.
DWSD began serving Highland Park on November 13, 2012. Before that time, Highland Park
was a water service provider, but in 2012 it was not meeting water quality standards.
There is an established trend for DWSD wholesale customers to sell water to adjacent
communities. Most recently, Plymouth Township expanded its service area to include part of
Salem Township.
4.3 Baseline Projections and High and Low Estimates Each of the preceding factors was considered in reviewing projections for the major operating
parameters of the treatment and transmission system. Table 4-1 shows the factors in relation to the
key parameters that they influence, including maximum day demand, peak hour demand, annual
water sales, population served, real water loss, and industrial water sales. A baseline projection to the

Market Plan Section 4
Page 48
year 2035 is presented, along with high and low estimates based on the trends discussed previously
for each factor.
Table 4-1: Preliminary Projections , High and Low Ranges for 2035
Factor Parameter Last 5 Years Range
2035 Baseline
2035 High Bound
2035 Low Bound
Outdoor Irrigation System Maximum Day Demand (MGD)
761 to 1,000
1,014 1,050 930
Outdoor Irrigation System Peak Hour Demand (MGD)
914 to 1,200
1,100 1,200 1,020
Population, Domestic Demand, Industrial
Annual Water Sales (Million Gallons)
136,000 to 150,000
137,000 142,000 125,000
Service Area Population Served (Millions)
3.5 to 3.7 3.54 3.68 3.40
Water Loss
Reduction
Estimated Real Water Loss (MGD)
50 to 80 40 70 30
Industrial Demand Food & Beverage Industries Water Sales (MGD)
2 to 3 5 10 3
4.4 Annual Tracking, Reporting and 5-Year Assessment Table 4-2 presents a relationship between the factors that influence water use and measurable
parameters that are indicators of the trend influence.
Table 4-2: Indicators for Factors Affecting Water Demand Factor Leading Indicators Operating Parameter
Residential Population Federal Census and annual municipal reporting of population, employment projections
Average Daily Demand and Annual Water Sales
Industrial Water Use Industrial customer surveys Average Daily Demand
and Annual Water Sales
Domestic Water Use Water use surveys based on billing records; new regulations
Average Daily Demand
and Annual Water Sales
Outdoor Irrigation Customer storage tank construction, projections discussed in contract re-opener discussions; new regulations
Maximum Day Demand
Water Loss Reduction Leakage reduction measurements as described in AWWA Manual of Practice M36, Water Audits and Loss Control Program
Non-Revenue Water
Addition or Loss of Customers Annual water revenue forecast, customer satisfaction surveys
Annual Water Sales
The indicators identified in Table 4-2 provide a framework for collecting and maintaining data on the
leading indicators that signal a possible impact the operating parameters of the regional water system.

Market Plan Section 4
Page 49
It is proposed that DWSD and its customers develop procedures to collect data on leading indicators
on an annual basis. Every 5 years, these data would be assessed with respect to changes observed in
system operating parameters, and with respect to proposed improvements in this master plan and in
DWSD’s 5-Year Capital Improvement Plans
The forecast of growth, the range of scenarios, and 5-year monitoring of indicators provide a guide
map that will allow DWSD to continue its focus on optimization of facilities, work force development,
improving customer service and efficiency.
Assessing market indicators on a 5-year basis will allow DWSD to continue to make informed
decisions for infrastructure investment. With respect to water treatment, all future scenarios confirm
the need for a major reduction in water treatment capacity from 1,720 MGD to approximately 1,000
MGD.
Customers, both wholesale and retail, have demonstrated their ability to make relatively quick
changes in their water use. However, it will take DWSD most of the planning period to optimize the
treatment and transmission system to current and future demands. The infrastructure optimization
process will be step-by-step and designed to address the range of potential forecasts for each
operational zone of system. Each step of the optimization should be implemented based on the most current review of trends for the operational zone.

Page 50
THIS PAGE INTENTIONALLY LEFT BLANK.

Page 51
5 Source Protection and Water Quality
5.1 Overview of the Source Protection and Water Quality Plan Customers of the DWSD share the Great Lakes watershed with approximately 35 million people in the
United States and Canada. The Great Lakes are the world’s largest source of fresh water, and its
quality is exceptionally high relative to most fresh water sources. At the same time, the Great Lakes
are subject to increasing pollution loads from agriculture, wet weather point and non-point source
pollutants; chemical and oil spills, impacts of invasive species, and climate change.
DWSD is the largest water supplier to inhabitants of the Great Lakes watershed and it has a long and
excellent reputation in water quality. DWSD supplies water to over 10 percent of the population of the watershed. (The City of Chicago supplies a larger population, but most of those served by Chicago
live outside of the watershed). DWSD’s significant role in the Great Lakes watershed creates a unique
interest and responsibility for it to lead collaborative efforts for source water protection and water quality monitoring. The source protection and water quality plan proposes the following new
leadership efforts by DWSD:
1. Update the Source Water Assessment, which was originally prepared in 2002.
2. Prepare Surface Water Intake Protection Plans for all three intakes.
3. Continue participation in Partnership for Safe Water, MiWARN, and the Huron to Erie
Monitoring System.
4. Consider increasing the number of water quality staff to expand DWSD’s role in these
partnerships as needed, and to perform the new monitoring and special water quality studies
recommended herein.
5. Update water quality goals for 2016 to 2025 with emphasis on repurposing and optimizing
conventional filtration capacity at four plants, conversion to direct filtration at the Lake Huron
plant, and maintaining regulatory compliance.
6. After 2025, update water quality goals again in response to new regulations that may take
effect, and for new initiatives for multi-barrier disinfection and conversion from chlorine gas
to sodium hypochlorite.
The plan proposes actions that in some cases go beyond existing minimum federal and state
regulatory requirements, but are consistent with the best practices of major peer water utilities. The
proposed actions will provide proactive information from which to make informed decisions on
treatment plant upgrades and distribution system improvements required to protect public health
and maintain compliance with water regulations quality in the future.

Product Plan Section 5
Page 52
This chapter describes the detailed plan for source water protection and drinking water quality. The
following three technical memoranda provide an in depth presentation on current and anticipated
regulations and best practices to support the discussion in this chapter:
Technical Memorandum 8: Watershed Management and Source Water Protection (TM-8)
Technical Memorandum 9: Current and Future Drinking Water Regulations (TM-9)
Technical Memorandum 10: Water Quality Monitoring (TM-10).
5.2 Regulations Governing Source Water 5.2.1 Introduction This section outlines the current international, federal and state laws and regulations pertaining to
source water quality that are relevant to DWSD. The regulatory information presented is based on
current and historical literature from the US EPA, the MDEQ, and the Ontario Ministry for the
Environment (OME). Additional detail is presented in TM-8 and TM-9 in the Appendix.
5.2.2 Bi-National Great Lakes Agreements There are a series of Great Lakes water resources agreements spanning from 1995 to 2008, The Great
Lakes Charter, originally published in 1995, established five principles for management of Great Lakes
water resources:
1. Conserve the levels and flows of the Great Lakes and their tributary and connecting waters.
2. Protect and conserve the environmental balance of the Great Lakes Basin ecosystem.
3. Provide for cooperative programs and management of the water resources of the Great Lakes
Basin by the signatory states of the United States and provinces of Canada.
4. Make secure and protect development within the region at the time of the agreement.
5. Provide a secure foundation for future investment and development within the region.
The Great Lakes Charter Annex is a supplementary agreement developed in 2001. The purpose of the
Annex was for the Great Lakes Governors and Premiers to reaffirm their commitment to the five broad
principles in the Great Lakes Charter. The Annex states: “The Governors and Premiers commit to
further implementing the principles of the Charter by developing an enhanced water management
system that is simple, durable, and efficient, retains and respects authority within the Basin, and, most
importantly, protects, conserves, restores, and improves the waters and water-dependent natural
resources of the Great Lakes Basin”.
In 2005, the Great Lakes Governors and Premiers signed the Great Lakes-St. Lawrence River Basin
Sustainable Water Resources Agreement. At the same time, the governors endorsed the companion
Great Lakes St. Lawrence River Basin Water Resources Compact, which became law in December 2008. These agreements reaffirm previous agreements and detail how the states and provinces will manage and protect the basin and provide a framework for each state and province to enact measures
for water quality protection. The Council of Great Lakes Governors has a key role in approving actions
Product Plan Section 5
Page 53
regulated under the Great Lakes agreements. The Council of Great Lakes Governors includes those of Illinois, Indiana, Michigan, Minnesota, New York, Ohio, Pennsylvania and Wisconsin. The Canadian
counterparts are the premiers of Ontario and Quebec.
5.2.3 Canadian Source Water Protection Law and Regulation The OME regulates surface water protection plans under the Ontario Clean Water Act of 2006.
Ontario requirements for source water protection are similar to those of the United States, but
Ontario’s requirements are mandatory, while those in the United States are mandatory for wells, but
voluntary for surface waters. Ontario requires that each water utility:
Establish an intake protection zone.
Evaluate the vulnerable areas of the intake protection zone
Identify existing and potential future land use activities that could be threats to source water quality.
Evaluate water quality issues
Evaluate water quantity for inland watersheds and groundwater systems
DWSD’s Fighting Island intake lies within Canadian waters. Jurisdiction for development of a source
water assessment and intake protection plan lies with MDEQ and DWSD. However, maintenance and
repair activities need to be communicated and approved by the OME. Canadian land use activities
have the potential to impact water drawn from this intake as well as the Belle Isle intake.
5.2.4 United States Source Water Protection Law and Regulation The Safe Drinking Water Act (SDWA) was passed in 1974, and amended in 1986 and 1996. The SDWA
gives the EPA the authority to establish and implement national drinking water standards and
regulations. Public water suppliers have responsibility of meeting the standards set forth by the EPA
and by their State regulatory agency when the State holds primacy as with Michigan. The 1996
amendments greatly enhanced the existing law by recognizing source water protection and public
information as important components of safe drinking water. The 1996 amendments emphasize
prevention through source water protection, enhanced watershed management and sustainable water
use. Each state creates and implements its own program within the framework of the 1996 SDWA
amendments. While the surface water protection program is voluntary, states have encouraged major water utilities to implement source water assessments.
5.2.5 MDEQ Source Water Assessment Program and DWSD Source Water Assessment
In 1998, Michigan amended its Safe Drinking Water Act to provide MDEQ with authority to regulate
the source water assessment program. MDEQ established a voluntary program, and there are two
principle parts:
1. Development of a Source Water Assessment (SWA)
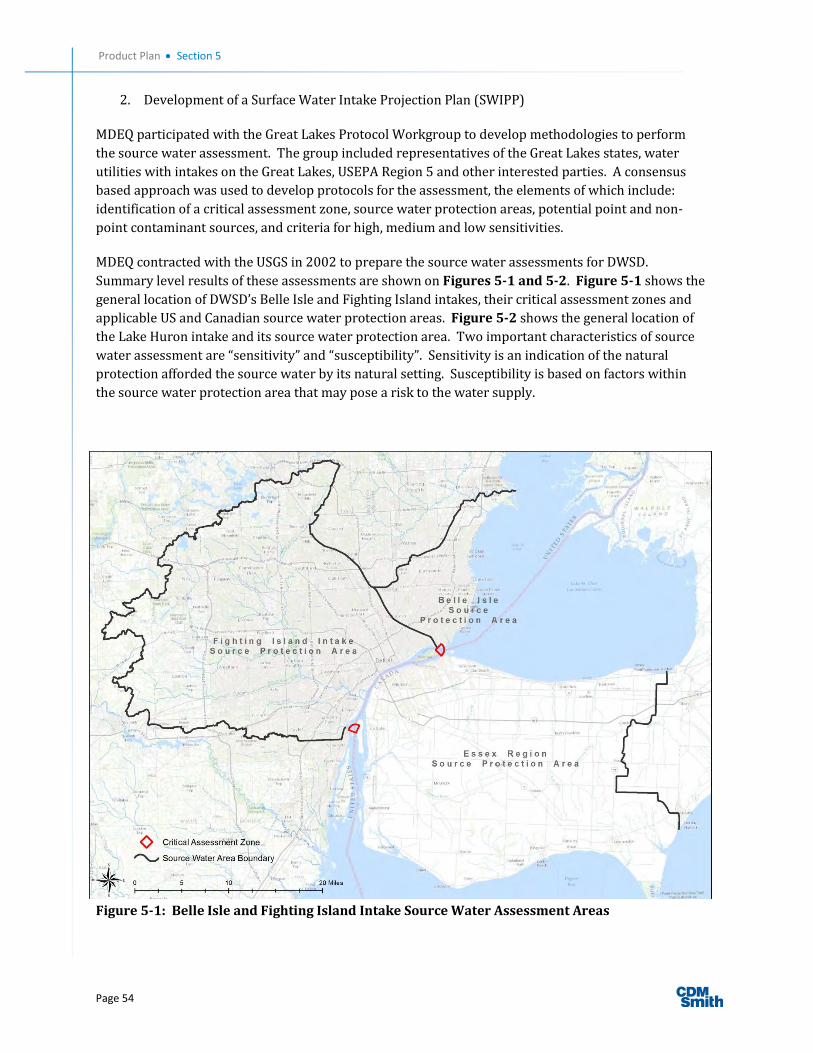
Product Plan Section 5
Page 54
2. Development of a Surface Water Intake Projection Plan (SWIPP)
MDEQ participated with the Great Lakes Protocol Workgroup to develop methodologies to perform
the source water assessment. The group included representatives of the Great Lakes states, water utilities with intakes on the Great Lakes, USEPA Region 5 and other interested parties. A consensus
based approach was used to develop protocols for the assessment, the elements of which include:
identification of a critical assessment zone, source water protection areas, potential point and non-point contaminant sources, and criteria for high, medium and low sensitivities.
MDEQ contracted with the USGS in 2002 to prepare the source water assessments for DWSD.
Summary level results of these assessments are shown on Figures 5-1 and 5-2. Figure 5-1 shows the
general location of DWSD’s Belle Isle and Fighting Island intakes, their critical assessment zones and
applicable US and Canadian source water protection areas. Figure 5-2 shows the general location of the Lake Huron intake and its source water protection area. Two important characteristics of source
water assessment are “sensitivity” and “susceptibility”. Sensitivity is an indication of the natural
protection afforded the source water by its natural setting. Susceptibility is based on factors within
the source water protection area that may pose a risk to the water supply.
Figure 5-1: Belle Isle and Fighting Island Intake Source Water Assessment Areas
Product Plan Section 5
Page 55
The Lake Huron source water was rated as moderate sensitivity and moderately low susceptibility
based on the limited number of potential contaminant sources. The Fighting Island source water was
rated as high sensitivity and high susceptibility based on the number of contaminant sources. The
Belle Isle source water was rated as high sensitivity and high susceptibility based on the number of potential contaminant sources.
TM-8 provides additional mapping and information on the source water assessments.
5.3 Threats to Source Water Quality 5.3.1 Introduction The source water assessments should be updated periodically to re-inventory contaminant sources
and consider new factors. Going forward, a 5-year frequency of updating is recommended. This
section discusses the key contaminant sources and influences that should be considered in each
update.
5.3.2 Point and Non-Point Sources Point sources include permitted wastewater treatment plant discharges and separate storm water discharges. Storm water discharges in Michigan are regulated by general storm water discharge
permits for each municipality. This permit is met by implementing best management practices to
address the following:
Public education program on storm water impacts
Public involvement and participation
Illicit discharge elimination program
Post-construction storm water management program for new development and redevelopment
projects
Construction storm water runoff control
Pollution prevention and good housekeeping for municipal operations
There are many storm water discharges into the source water protection areas. The City of Detroit’s
storm water discharges are currently regulated by the jurisdictional general storm water discharge
permit MIS04000 issued February 23, 2003. Other entities with storm water discharges have similar
regulations and activities.
National Pollutant Discharge Elimination System (NPDES) permits provide water quality protection
related to discharges from industrial facilities and wastewater treatment plants (WWTPs). These
permits establish operating conditions and allowable discharge limits for a variety of parameters,
including fecal coliform, nutrients and other pollutants. These types of discharges occur in all of the
three intake source water protection areas. There are five WWTPs which discharge to the Detroit
River (Detroit, Wayne County, Trenton, Grosse Ile Township and South Huron Valley Utility
Authority). There are additional wastewater plants that discharge to Lake St. Clair and Lake Huron
and tributary to the Detroit River.
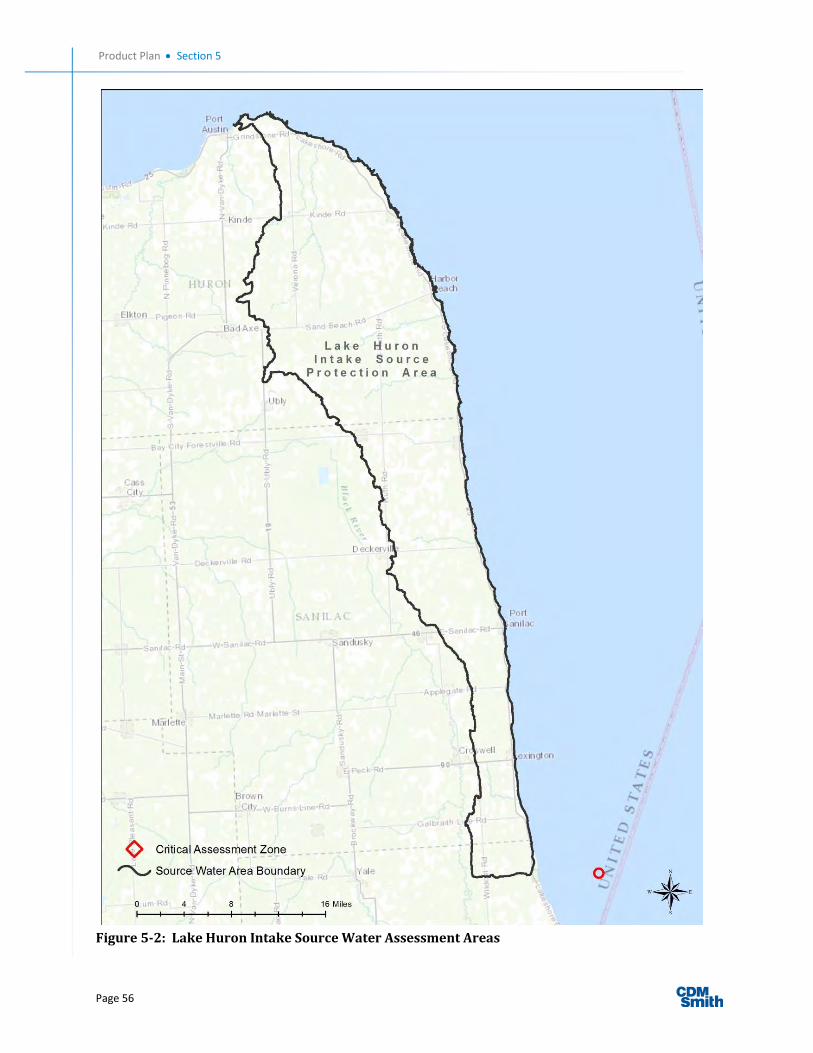
Product Plan Section 5
Page 56
Figure 5-2: Lake Huron Intake Source Water Assessment Areas

Product Plan Section 5
Page 57
Combined sewer overflow and sanitary sewer overflows (CSO/SSO) are typically associated with wet
weather conditions and therefore occur intermittently. MDEQ tracks and reports CSO discharges on
their website and issues annual reports on both CSO and SSO operations and discharges. There are
many CSOs in the Lake Huron and Detroit River watershed and they generally discharge with a
frequency of 4 to 20 times per year.
5.3.3 Spills Spills of pollutants are a concern for source water protection. Spills may occur from:
Industry/point source spills associated with local manufacturing or chemical storage. Both
manufacturing and chemical storage are present in the watershed, particularly in the St. Clair and Detroit rivers.
Transportation of substances can lead to spills on land or water. Such spills are unpredictable
in duration, content and magnitude.
Non-point sources typically impact water quality over a significant period of time. For example,
seasonal accumulation of agricultural runoff.
The US Coast Guard maintains the spill reporting center under its authority as a National Reporting
Center with the Department of Homeland Security. The State of Michigan and the Province of Ontario
maintain respective spill alert systems. The State of Michigan Pollutant Emergency Alerting System
(PEAS) was established in 1975, and the Ontario Spills Action Centre (OSAC) was established in 1985.
Both organizations provide 24/7 operations to receive and disseminate information about spills.
From 2004 to 2013, there were 405 reported spills in Wayne County, 154 in Macomb County, 124 in
St Clair County, and 11 in Sanilac County. The major spills involved oil, gasoline and polychlorinated
biphenyls. There were over 1,000 spills reported for the province of Ontario in 2009. However, OME
does not break out the spills by watershed.
5.3.4 Invasive Species
Zebra mussels and Quagga mussels have spread throughout the Great Lakes, rivers and inland lakes of
the upper Midwest and Ontario. The mussels attach to any hard surface in the water. The ability of these mussels to attach in large clumps can create numerous problems, such as clogging water intake
pipes and killing native mussels. The mussels are filter feeders and consume significant quantities of phytoplankton. The filter feeding results in improved lake clarity which in turn promotes macrophyte
growth and extensive weed beds. The mussels’ foul beaches, interfere with food webs, smother native
mussels, impart taste and odor, and are linked to fish and wildlife die-offs. As such, they have a
significant and typically negative impact on a water ecosystem. Quagga mussels are not currently as
common as zebra mussels in the Great Lakes and often are found at greater depths.
Zebra mussels have been detected at DWSD intakes. Chlorination is practiced as a control measure at the Belle Isle intake but not at the other intakes. DWSD relies upon the large intake size as an
approach to zebra mussel management. Blue-green algae blooms are another example of invasive
species. These are discussed in the next section.
Product Plan Section 5
Page 58
5.3.5 Climate Change Climate change has multiple potential impacts on water quality and water quantity. Therefore, it is
important to consider and plan for these impacts over the 20-year master planning horizon. In the
Great Lakes area, reports of increased storm severity leading to rapidly fluctuating water quality and
reports of increased cyanobacteria (blue-green algae) blooms leading to concerns over taste and odor and microcystin production. There is significant uncertainty associated with both the extent and
timing of impacts so that it is difficult to predict the exact impacts over the next 20 years.
The USEPA anticipates that the Midwest could see increasing frequency and intensity of precipitation
due to climate change. Excess runoff and snow melt could add to the extent of water quality changes.
Among the potential impacts of climate change for DWSD are:
Source water quality changes in concentrations and increasing fluctuations (pH, temperature,
new pollutants)
Increase in total organic carbon (TOC), pathogens, nutrients and cyanobacteria (microcystin
production)
Decrease in raw water alkalinity
Elevated and fluctuating raw water turbidity
Impacts of water quality changes on water treatment processes, distribution
Changes in water demand due to changing precipitation patterns.
DWSD currently monitors most of these parameters and should continue to monitor and assess
results at 5-year intervals. As discussed later in this plan, it is recommended that DWSD add to its
monitoring program the occurrence of cyanobacteria, particularly at Fighting Island and at Belle Isle.
5.4 Plan for Source Water Protection Based on the laws, regulations, and threats described above, four major actions are proposed over the
planning period:
1. Update the source water assessment
2. Prepare surface water intake plans and perform associated monitoring
3. Expand involvement with Huron to Erie monitoring system.
These actions are described below.
5.4.1 Update of Source Water Assessment
DWSD’s existing source water assessment was prepared in 2002. These type of assessments need to
be updated periodically to consider results of water quality monitoring, changing land use, new
regulations, and changes in the water quality threats described previously. DWSD should update the
source water assessment within the first three years of the planning period. It is recommended that
Product Plan Section 5
Page 59
DWSD engage both MDEQ and OME in planning and scope development for this work, and that a
public involvement component be included. The updated source water assessment should update the
contaminant inventory for each intake area, consider additional pathogen assessments, and provide
recommendations on monitoring by the Huron to Erie Monitoring System (discussed below).
The AWWA provides guidance on source water assessment in its G-300 Source Water Protection
Guidebook. The principle elements of AWWA’s approach are:
1. Vision
2. Source Water Characterization
3. Program Goals
4. Implementation
5. Iterative Evaluation
The vision step should be done in conjunction with a public and stakeholder involvement program,
including both internal and external stakeholders, including representation from the MDEQ and
Province of Ontario.
Source water characterization should include an updated watershed delineation using newer GIS
coverage information available since 2002. Hydrodynamic modeling tools and concurrent
investigations by others can be used to update water quality and quantity and confirm or update
previously identified key potential contaminants. Microtoxin should be added to list of potential
contaminants.
Program goals should be developed around the risk assessment, susceptibility analysis and
monitoring of potential contaminant sources, as well as history of compliance and regulatory
requirements.
Implementation should include setting milestones for risk reduction, monitoring, emergency
preparedness and response to specific, higher risk problems.
The iterative evaluation should be done on a 5- to 10- year frequency, depending on findings and
specific goals of the assessment.
5.4.2 Prepare Surface Water Intake Protection Plans DWSD has prepared and submitted applications to MDEQ for financial assistance to prepare Surface
Water Intake Protection Plans (SWIPP) for all of its three intakes. The SWIPPs can be prepared in
parallel with source water assessment, and should be completed within 3 years. DWSD began
preparation of SWIPPs in January 2015. Critical issues for the SWIPPs include:
Evaluate Zebra and Quagga mussel occurrence at all intakes.
Establish chlorine feed system for mussels at Lake Huron. (Chlorine is currently fed at the Belle
Isle intake.)

Product Plan Section 5
Page 60
In consultation with OME, improve routine access to the Fighting Island intake,
After routine access is arranged, then establish chlorine feed system for mussel control at
Fighting Island.
Monitor cyanobacteria occurrence (microcystin production), particularly at Fighting
Island/Southwest.
Perform a historical water quality data review to determine if mussels have altered source
water quality, algae types and concentrations, taste and odor, raw water pumping costs.
5.4.3 Huron to Erie Monitoring System The Huron to Erie Monitoring System was established in 2007 as a means to provide early warning for chemical and petroleum spills in the St. Clair and Detroit river system. The network currently includes
eight public water suppliers (shown in Table 5-1):
The operational goals of this group are:
Install and maintain monitoring equipment at their water intakes
Analyze water quality data every 15- to 30-minutes round the clock
Share real time data with all participants
Develop and use a water quality alarm system
The system is run as a collaborative effort among the utilities. Work is done on a part-time basis by
one or more employees for each utility, or contracted by the respective utilities. Table 5-1 shows the
equipment installed in the system. Some equipment is newer, so historic data sets are incomplete.
Table 5-1. Existing Equipment for the Huron to Erie Monitoring System
Utility Multi parameter sonde
TOC analyzer Fluorometer Microtox
Marysville WTP X X
Marine City WTP X
Algonac WTP X
Ira WTP X
Mt. Clemens WTP X X
Water Works Park II X X X X
Southwest WTP X X X X
Wyandotte WTP X
Monroe WTP X X X
The multi-parameter sonde has the capability to measure pH, temperature, conductivity, dissolved
oxygen, oxidation reduction potential (ORP), turbidity and chlorophyll. The fluorometer is used to
measure total hydrocarbons. Microtox is used to test for potential water contamination. It is based on
Product Plan Section 5
Page 61
respiration of a strain of bioluminescent bacteria. Changes in bacterial respiration indicate a change
in water quality.
The monitoring system provides high value with relatively low cost for public health protection.
However, not all systems are fully functional or developed, maintenance and calibration are not
regularly performed, and quality assurance and quality control procedures need to be improved.
Some of the test equipment and procedures could be upgraded to newer and less expensive testing
technology. An Event Detection System (EDS) should be added to the monitoring network in order to
provide improved data analysis and alarm system.
More staff time and improved network capability are required to consistently meet the goals of the
system. Given the value and importance of this monitoring system, it is recommended that DWSD
consider ways to increase its participation in the operation of the system. Options include:
Addition of one or more full-time staff;
Extending DWSD’s SCADA network to include the 8 monitoring sites; or
DWSD and others providing additional funding for the network.
5.5 Regulations Governing Drinking Water 5.5.1 Introduction Regulations that govern drinking water have evolved from laws governing public health in England
shortly before the time that DWSD started to provide public water service in 1850. The Safe Drinking
Water Act (SDWA) of 1974 established the first enforceable national standards in the United States.
The 1974 Act was amended in 1986 and 1996, and both amendments broadened the scope of drinking
water regulation. Public water suppliers have the responsibility of meeting the standards set by the
EPA. The 1996 amendments greatly enhanced the existing law by recognizing source water protection, operator training, funding for water system improvements, and public information as
important tools in maintaining safe drinking water.
Michigan passed the Michigan Safe Drinking Water Act 399 in 1976. The MDEQ holds primacy in the
State of Michigan, and it adopts USEPA regulations largely unchanged.
5.5.2 Current Regulations Current regulations are comprised of primary and secondary drinking water standards. The National
Primary Drinking Water Regulations are legally enforceable standards that apply to all public water systems, although the regulatory details may vary with system size. These standards protect the
drinking water quality by limiting the levels of specific contaminants that can adversely affect public
health. There are current regulations for over 80 contaminants.
The National Secondary Drinking Water Regulations are federally non-enforceable guidelines
regulating contaminants that may cause cosmetic effects or aesthetic effects in drinking water. EPA
does not require public water supply systems to comply with secondary standards, but states may
choose to adopt them as enforceable. MDEQ recommends but does not enforce secondary standards.
TM-9 presents a complete review of current regulations in the following categories:
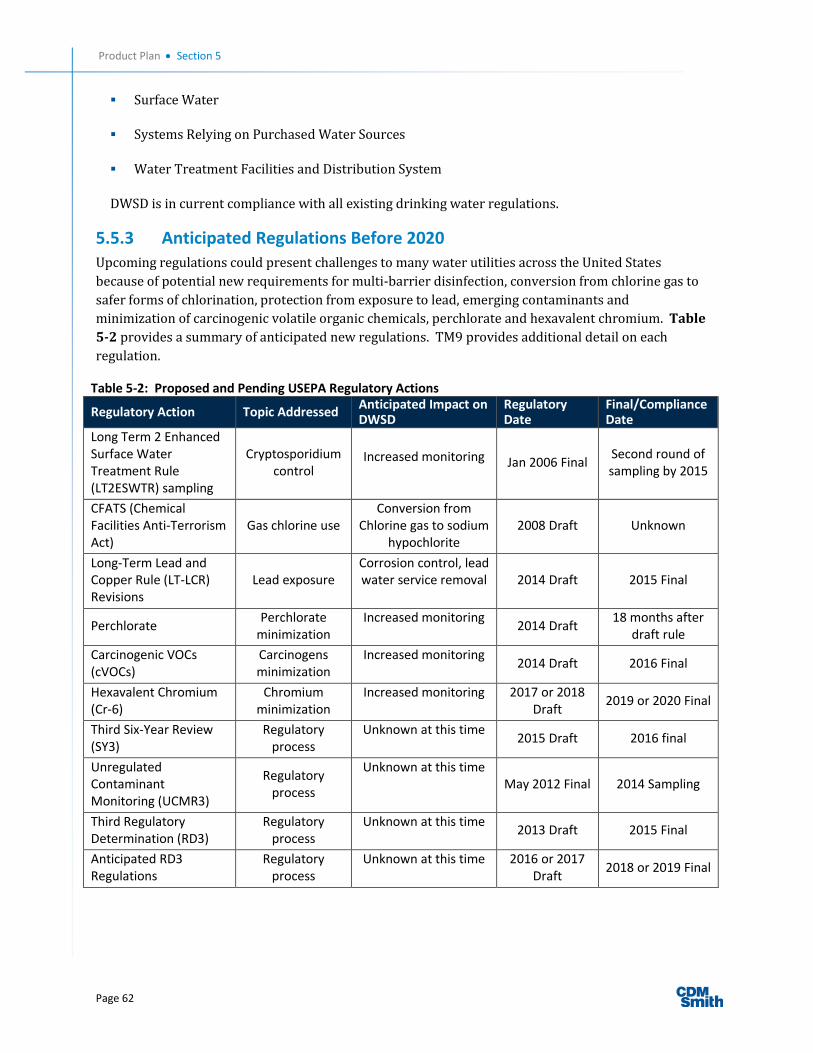
Product Plan Section 5
Page 62
Surface Water
Systems Relying on Purchased Water Sources
Water Treatment Facilities and Distribution System
DWSD is in current compliance with all existing drinking water regulations.
5.5.3 Anticipated Regulations Before 2020 Upcoming regulations could present challenges to many water utilities across the United States
because of potential new requirements for multi-barrier disinfection, conversion from chlorine gas to
safer forms of chlorination, protection from exposure to lead, emerging contaminants and
minimization of carcinogenic volatile organic chemicals, perchlorate and hexavalent chromium. Table
5-2 provides a summary of anticipated new regulations. TM9 provides additional detail on each
regulation.
Table 5-2: Proposed and Pending USEPA Regulatory Actions
Regulatory Action Topic Addressed Anticipated Impact on DWSD
Regulatory Date
Final/Compliance Date
Long Term 2 Enhanced Surface Water Treatment Rule (LT2ESWTR) sampling
Cryptosporidium control
Increased monitoring Jan 2006 Final Second round of sampling by 2015
CFATS (Chemical Facilities Anti-Terrorism Act)
Gas chlorine use Conversion from
Chlorine gas to sodium hypochlorite
2008 Draft Unknown
Long-Term Lead and Copper Rule (LT-LCR) Revisions
Lead exposure Corrosion control, lead water service removal 2014 Draft 2015 Final
Perchlorate Perchlorate
minimization Increased monitoring
2014 Draft 18 months after
draft rule
Carcinogenic VOCs (cVOCs)
Carcinogens minimization
Increased monitoring 2014 Draft 2016 Final
Hexavalent Chromium (Cr-6)
Chromium minimization
Increased monitoring 2017 or 2018 Draft
2019 or 2020 Final
Third Six-Year Review (SY3)
Regulatory process
Unknown at this time 2015 Draft 2016 final
Unregulated Contaminant Monitoring (UCMR3)
Regulatory process
Unknown at this time May 2012 Final 2014 Sampling
Third Regulatory Determination (RD3)
Regulatory process
Unknown at this time 2013 Draft 2015 Final
Anticipated RD3 Regulations
Regulatory process
Unknown at this time 2016 or 2017 Draft
2018 or 2019 Final
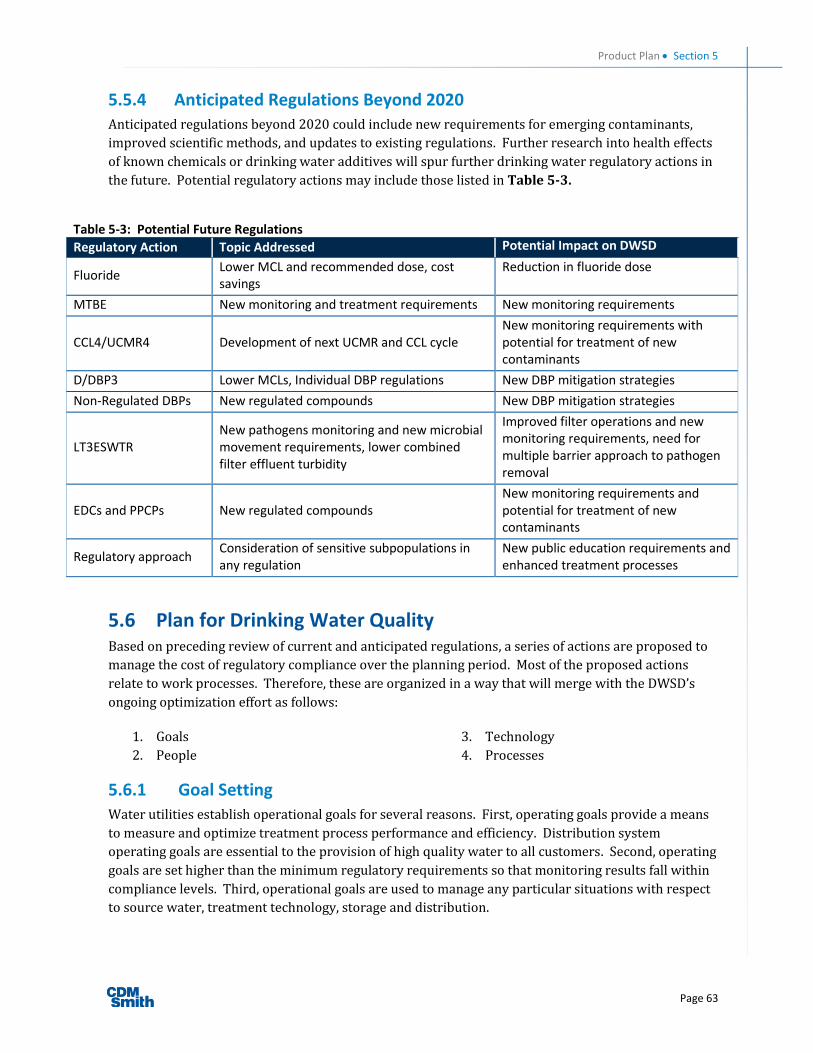
Product Plan Section 5
Page 63
5.5.4 Anticipated Regulations Beyond 2020 Anticipated regulations beyond 2020 could include new requirements for emerging contaminants,
improved scientific methods, and updates to existing regulations. Further research into health effects
of known chemicals or drinking water additives will spur further drinking water regulatory actions in
the future. Potential regulatory actions may include those listed in Table 5-3.
Table 5-3: Potential Future Regulations
Regulatory Action Topic Addressed Potential Impact on DWSD
Fluoride Lower MCL and recommended dose, cost savings
Reduction in fluoride dose
MTBE New monitoring and treatment requirements New monitoring requirements
CCL4/UCMR4 Development of next UCMR and CCL cycle New monitoring requirements with potential for treatment of new contaminants
D/DBP3 Lower MCLs, Individual DBP regulations New DBP mitigation strategies
Non-Regulated DBPs New regulated compounds New DBP mitigation strategies
LT3ESWTR New pathogens monitoring and new microbial movement requirements, lower combined filter effluent turbidity
Improved filter operations and new monitoring requirements, need for multiple barrier approach to pathogen removal
EDCs and PPCPs New regulated compounds New monitoring requirements and potential for treatment of new contaminants
Regulatory approach Consideration of sensitive subpopulations in any regulation
New public education requirements and enhanced treatment processes
5.6 Plan for Drinking Water Quality Based on preceding review of current and anticipated regulations, a series of actions are proposed to
manage the cost of regulatory compliance over the planning period. Most of the proposed actions
relate to work processes. Therefore, these are organized in a way that will merge with the DWSD’s
ongoing optimization effort as follows:
1. Goals 2. People
3. Technology
4. Processes
5.6.1 Goal Setting Water utilities establish operational goals for several reasons. First, operating goals provide a means
to measure and optimize treatment process performance and efficiency. Distribution system
operating goals are essential to the provision of high quality water to all customers. Second, operating
goals are set higher than the minimum regulatory requirements so that monitoring results fall within
compliance levels. Third, operational goals are used to manage any particular situations with respect
to source water, treatment technology, storage and distribution.
Product Plan Section 5
Page 64
Table 5-4 shows the relationship between water quality goals and treatment process/distribution
system upgrades for DWSD. The table establishes 8 major groups of water quality characteristics,
describes the impact on respective treatment processes, and then establishes goals for the first half and second half of the planning period. Goals are established for the first and second half of the
planning period for reasons related to regulatory compliance:
1. DWSD is in compliance with current regulations, which are expected to remain in effect for the
next ten years or beyond. During this 10-year period, DWSD will be reducing treatment
capacity and optimizing.
2. New regulations are anticipated by 2020, and these may require the addition of new
treatment process for multi-barrier disinfection and corrosion control.
DWSD has established goals for over 35 water quality constituents. Many of these goals go beyond
minimum standards and meet best practices of the municipal water treatment industry. For example:
DWSD’s turbidity goal is to maintain finished water at less than 0.1 NTU (Nephelometric Turbidity
Unit), while the regulatory standard is less than 0.3 NTU. There is no regulatory requirement for Taste and Odor, but DWSD operates with a goal of no objectionable taste or odor.
These goals guide DWSD’s drinking water treatment and transmission and distribution system
performance. Table 5-4 is a thematic summary of the goals, while Table 1-1 in TM-10 presents the
actual goals.
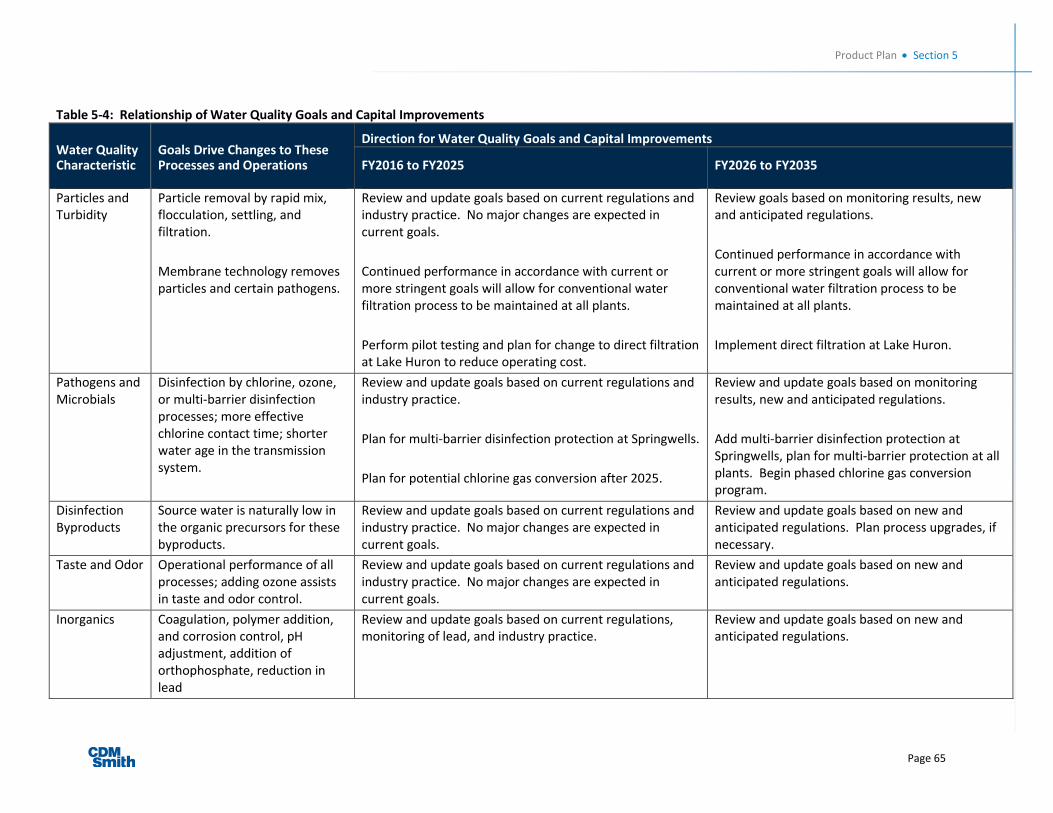
Product Plan Section 5
Page 65
Table 5-4: Relationship of Water Quality Goals and Capital Improvements
Water Quality Characteristic
Goals Drive Changes to These Processes and Operations
Direction for Water Quality Goals and Capital Improvements
FY2016 to FY2025
FY2026 to FY2035
Particles and Turbidity
Particle removal by rapid mix, flocculation, settling, and filtration.
Membrane technology removes particles and certain pathogens.
Review and update goals based on current regulations and industry practice. No major changes are expected in current goals.
Continued performance in accordance with current or more stringent goals will allow for conventional water filtration process to be maintained at all plants.
Perform pilot testing and plan for change to direct filtration at Lake Huron to reduce operating cost.
Review goals based on monitoring results, new and anticipated regulations.
Continued performance in accordance with current or more stringent goals will allow for conventional water filtration process to be maintained at all plants.
Implement direct filtration at Lake Huron.
Pathogens and Microbials
Disinfection by chlorine, ozone, or multi-barrier disinfection processes; more effective chlorine contact time; shorter water age in the transmission system.
Review and update goals based on current regulations and industry practice.
Plan for multi-barrier disinfection protection at Springwells.
Plan for potential chlorine gas conversion after 2025.
Review and update goals based on monitoring results, new and anticipated regulations.
Add multi-barrier disinfection protection at Springwells, plan for multi-barrier protection at all plants. Begin phased chlorine gas conversion program.
Disinfection Byproducts
Source water is naturally low in the organic precursors for these byproducts.
Review and update goals based on current regulations and industry practice. No major changes are expected in current goals.
Review and update goals based on new and anticipated regulations. Plan process upgrades, if necessary.
Taste and Odor Operational performance of all processes; adding ozone assists in taste and odor control.
Review and update goals based on current regulations and industry practice. No major changes are expected in current goals.
Review and update goals based on new and anticipated regulations.
Inorganics Coagulation, polymer addition, and corrosion control, pH adjustment, addition of orthophosphate, reduction in lead
Review and update goals based on current regulations, monitoring of lead, and industry practice.
Review and update goals based on new and anticipated regulations.

Product Plan Section 5
Page 66
Table 5-4: Relationship of Water Quality Goals and Capital Improvements
Water Quality Characteristic
Goals Drive Changes to These Processes and Operations
Direction for Water Quality Goals and Capital Improvements
FY2016 to FY2025
FY2026 to FY2035
Chlorine Residual and Water Age
Operational practice for reservoir turn-over; re-chlorination at distant points in the transmission system.
Establish goals based on current practice for reservoir operations and ultimate “treatment to tap” water age. Perform pilot testing to assess need for re-chlorination in the 72-inch main to Lapeer and Genesee County.
Review and update goals based on monitoring results and new and anticipated regulations.
Emerging Contaminants
Optimization of existing processes, or new processes to remove contaminants such as personal care products, microcystin, and others.
Special studies and monitoring programs as proposed in this plan.
Review and update goals based on monitoring results and new and anticipated regulations.
Product Plan Section 5
Page 67
5.6.2 People
A 2012 study completed for Arlington County, Virginia established a relationship between the number of water quality staff positions in water utilities and total population served by the utility. DWSD
performs all of the water quality analyses for the treatment plants. DWSD also performs water quality
analyses for the distribution systems in Detroit. Wholesale customers perform the water quality
analyses in their respective distribution systems, with the exception that DWSD performs total coliform rule (TCR) samples, lead and copper (LCR) samples, and customer complaint samples for most customers. Based on DWSD’s responsibilities, the 2012 study indicates that water quality
staffing should total between 30 to 34 full time staff. The current staffing level is approximately 22 full time staff. Therefore, current staffing should be considered and analyzed to ensure water quality
compliance.
These new staff will enable DWSD to fulfill the recommendations in this chapter for regulatory driven
monitoring, source water assessment updating, special studies for source water, treatment process
changes and distribution system water quality. The organization of new staff should be performed
within the context of DWSD’s ongoing operational optimization program and the proposed
consolidation and repurposing of water treatment plants as discussed in Chapter 6.
Staff Training and Responsibilities. DWSD should provide continuing staff support and training to
facilitate its ongoing work to meet water quality goals, maintain laboratory certification, maintain
regulatory compliance, and perform special studies as well as planning for the future. Specific
recommendations include:
1. Familiarize staff and prepare a plan for Level 1 assessment requirements under revised total
coliform rule (RTCR).
2. Continue to proactively track and plan for potential regulatory changes.
3. Review water quality goals and update to be more comprehensive of regulations and
aesthetics. Consider more global approach that includes wholesale systems or water quality
at the points of entry.
4. Implement the monitoring recommendations provided in Table 2-1 of TM-10 Water Quality
Monitoring.
5. Develop and implement a plan to review and trend data routinely. Establish and utilize
control limits for key parameters.
6. Document all sampling plans and update annually
7. Review current sampling plans per recommendations.
5.6.3 Technology Technology changes proposed in this master plan include evaluation and pilot testing of the direct filtration process at the Lake Huron water treatment plant, upgrading and consolidation of laboratory
facilities, and new monitoring technology.
Product Plan Section 5
Page 68
Direct Filtration at Lake Huron. The Lake Huron water treatment plant has been approved by the
MDEQ to operate with a “modified direct filtration” process. With the potential reduction of treatment
capacity at Lake Huron and other plants (see Chapter 6), it is possible that a full direct filtration
process could be used. The advantage of direct filtration is lower cost for chemicals, and elimination
of rapid mix, flocculation sedimentation basins and associated operating costs.
Direct filtration appears to be feasible at the Lake Huron plant due to the low turbidity in the source
water. The major steps to evaluating the feasibility of this process are:
1. Meet with the MDEQ to review any pilot or demonstration work requirements and collect any
additional data required. While new water treatment plants are required to conduct pilot
studies per 10-States Standards, converting an existing treatment plant to direct filtration may
only require in-plant demonstration studies.
2. Review existing treatment processes relative to typical direct filtration design parameters.
These include:
a. Filter design parameters: media type, media configuration, filter loading rate, maximum
available filtering head and historical filter treatment performance when operated in
conventional and direct filtration modes including filter loading rate, filter run time, unit
filter run volumes, backwash frequency, and head loss accumulation rates. Review of these parameters will be important to determine what upgrades will be required, if any,
to convert to year-round direct filtration. .
b. Design and operational information as mentioned above can be compared against industry best practices for direct filtration. For example, experience has shown that a
deep-bed coarse mono media filter should have greater capacity to cope with algal and
diatom blooms with reasonable filter runs than traditional dual-media beds with 1.0 mm
effective size anthracite.
c. Conduct pilot and/or full-scale evaluations if required to validate year-round direct filtration process at Lake Huron. Bench-scale tests should also be performed to screen
alternative coagulants and polymers for cold water coagulation to produce a filterable
floc. Polyaluminum chloride (PACL) may be a promising coagulant for cold water direct filtration application. Filter aids should also be considered for year-round application at
low doses.
d. Complete survey of other direct filtration plants treating Lake Huron water such as the
Lake Huron plant referenced in Foley, 1981 (“Experience with Direct Filtration at
Ontario’s Lake Huron Treatment Plant,” Journal AWWA, 1981).
e. Based on the outcomes of the above steps, prepare process design criteria and cost estimates for direct filtration upgrades for Lake Huron WTP.

Product Plan Section 5
Page 69
Laboratory Facilities. Most of DWSD’s laboratory facilities are 25 or more years old. Recommended
upgrades are listed below:
1. Maintain central laboratory facility and capacity at Water Works Park II.
2. Rehabilitate the laboratory at Springwells plant as part of the existing SP-563 construction
contract.
3. Begin to phase out operations at the Northeast plant starting in 2016, and eliminate this
laboratory by 2020 as part of the repurposing plan outlined in Chapter 6.
4. Review laboratory operations between the Springwells and Southwest plants, and determine
if it is more cost-effective to perform more water quality analysis at Springwells and less at Southwest.
5. Plan longer term laboratory improvements at Lake Huron, to be constructed after 2025.
6. Acquire and implement a Laboratory Information Management System (LIMS). Such a system
will streamline compliance reporting to MDEQ, improve QAQC processes within DWSD and
enhance data sharing among DWSD facilities and wholesale communities.
New Monitoring Technology. New monitoring technology will enhance compliance with new
regulations and improve operational control of the treatment and transmission systems.
1. Evaluate data needs and gaps in existing online instrumentation in the source water, treatment plants and transmission system. Add online instruments as determined per this
study.
2. Re-evaluate the potential for using installed distribution system sampling stations at select
locations in the distribution system. The difficulty in establishing satisfactory transmission
system sample points is an ongoing challenge for DWSD and therefore dedicated owned
stations may be an option. This type of monitoring technology should be explored by DWSD
and its wholesale customers.
5.6.4 Processes
Key recommendations for new processes offered relating to water quality monitoring and assessment
are presented below.
5.6.4.1 Water Quality Monitoring
DWSD tests source waters, finished waters and the distribution system for a wide variety of parameters (see Table 2-1 in TM-10 Water Quality Monitoring). In addition, special studies are
conducted through Water Research Foundation participation, consultants, the DWSD Water Quality
Group and regulatory requirements such as the Unregulated Contaminant Monitoring Rule.
In addition to testing DWSD source and finished waters, DWSD tests the City of Detroit distribution
system. DWSD collects and analyzes samples for retail customers. DWSD also provides total coliform
Product Plan Section 5
Page 70
sample collection and testing for 84 of the 127 communities. While this water quality monitoring
program is robust, some detailed improvements are recommended as shown in Table 2-1 in TM-10.
5.6.4.2 Maintaining Water Quality in the Transmission and Distribution Systems
DWSD does an excellent job in maintaining water quality in its transmission and distribution systems.
The AWWA Manual of Practice Water Quality Control in Distribution Systems outlines standard
procedures which should continue to be followed. Minimum pressures are monitored closely,
reservoir pumps are automated to turn-over reservoir volume within 3 days, chlorine residuals are
monitored throughout the transmission system, and water main repairs are flushed and chlorinated
before returning a main to service.
DWSD tracks customer complaints in the retail distribution system. DWSD receives customer inquiries on topics such as rusty water, lead, odor, and others. In the past, odor had been a frequent
complaint related to algal blooms and zebra mussels, but the frequency has declined in recent years.
Rusty water complaints can occur in areas with high water age and old unlined cast iron pipe. All
water quality data complaints are captured by type, location and time in a database. Hydrant flushing
is the primary approach employed to improve customer concerns. Onsite investigation and sampling
are conducted when deemed appropriate.
DWSD should consider developing a database of wholesale customer complaints within the wholesale
customer distribution systems.
Changes in future water use patterns in the transmission system and distribution system should be
watched. DWD is already assessing options for satellite chlorination in the 72-inch water main that was constructed to originally serve Flint and Genesee County, but now serves Genesee County and the
Greater Lapeer Utility Authority. Within the City of Detroit, many water distribution mains serve a
greatly reduced residential population in over 25 percent of the City. These water mains could be
subject to increasing water quality problems due to long water age.
5.6.4.3 Special Studies and Projects
A number of special studies and water quality projects are recommended to enhance the
understanding of both current and future water quality challenges. These special studies should be
performed within the next 5 to 10 years in order to have new knowledge pertinent to anticipated
future regulations, and to refine water quality goals as described earlier. These special studies
include:
1. (Re)assess perchlorate concentrations in source water
2. (Re) assess MTBE concentrations in source water
3. Develop an inventory of lead pipe and lead connections in distribution system (in progress)
4. Assess strontium in source water and finished water (2014 UCMR3)
5. Assess hexavalent chromium in distribution system (2014 UMCR3)
6. Continue monitoring of EDCs (endocrine disrupting compounds) and PPCPs (pharmaceuticals
and personal care products) in source water
Product Plan Section 5
Page 71
7. Assess HAA9(Haloacetic acids) concentrations
8. Deliver CCR (consumer confidence report) via provision of URL on postcard and/or water bill (ongoing)
9. Develop design criteria for conversion from gas chlorine to hypochlorite
10. Assess zebra mussel impact on water quality
11. Evaluate aluminum occurrence and approaches for minimization
12. Monitor microcystin, MIB and geosmin when algae blooms occur
13. Perform a study of UV254 absorbance and UV transmittance prior to any UV disinfection
planning or design.
TM-8, TM-9 and TM-10 provide detail on the scope and objective of each special study and water quality project.
5.6.4.4 Emergency Response Planning
The Emergency Response Plan Technical Memorandum was submitted separately to DWSD in
November 2013. The Master Plan Update team performed a review of DWSD’s existing Emergency
Response Plan, and made recommendations. The DWSD’s Emergency Response Plan and the review
performed under Master Plan Update are confidential documents for reasons of security.
DWSD is currently updating its Emergency Response Plan, and this plan includes procedures for responding to water quality emergencies.
5.6.4.5 Work Groups and Partnerships
DWSD has facilitated a robust customer involvement program for drinking water customers for
over 10 years. This program has demonstrated the value of dialogue and facilitated discussion
among DWSD staff, wholesale and retail customers, regulatory agencies, industry partners and
other stakeholders. Customer involvement work groups and partnerships with other water
utilities and agencies should continue throughout the planning period and specific objectives
should evolve to address the challenges of the regional utility. While DWSD and its customers
have several work groups and discussion topics underway, potential new topics include the
following:
1. Meeting water quality regulations in the transmission and distribution system can best be
achieved by close collaboration between the water quality staff of DWSD and its wholesale
customers. It is recommended that a team of water quality personnel from DWSD and its
wholesale customers form a water quality group to facilitate discussion and coordination of activities.
2. To meet finished water quality objectives, a coordinated team that includes representatives
from each plant and the water quality group should be implemented
Product Plan Section 5
Page 72
3. Develop a program and costs for providing lab services to wholesale customers.
4. Continue participation in Partnership for Safe Water and MIWARN. Consider participation in
the AWWA Distribution System Optimization programs.
Page 73
6 Water Treatment
6.1 Summary of the Water Treatment Plan DWSD owns and operates 5 water treatment plants. These plants have a design capacity of 1,720
MGD, they are in compliance with current regulatory requirements, and they produce high quality
water for the service area.
Chapter 4 identifies a potential range of required water treatment capacity in 2035 from 930 to 1,100
MGD, based on different scenarios for population growth, service area expansion, and per capita water use. Therefore, DWSD has significant excess capacity for water treatment relative to projected water demands.
A needs assessment for all water treatment plants was performed in order to determine the most cost-effective approach to reduce excess capacity and maintain or improve the level of service to customers
throughout the planning period. Improvements were identified for regulatory compliance, safety,
energy and operational efficiency. With the exception of the newest plant, Water Works Park, the
other 4 plants were built or acquired in the period 1930 to 1970. The plants are in compliance with
current regulations for water treatment. While there is no imminent change in regulatory
requirements, by the end of the planning period DWSD can expect to address conversion from
chlorine gas to sodium hypochlorite and extension of multi-barrier disinfection. The projected capital
needs for all 5 plants to maintain current regulatory requirements and current rated capacities are
approximately $981 million over the planning period.
In addition to the needs assessment, a life cycle cost analysis was performed to consider O&M as well as capital needs, the cost to decommission and repurpose plants, the cost to build new transmission
mains for water supply, and the cost to assure a level of redundancy typical of large water utilities.
Figure 6-1 summarizes the life cycle cost analysis and shows that repurposing the Northeast and
Southwest plants is the alternative with the lowest life cycle cost. A detailed review of the costs of repurposing Northeast and Southwest plants shows that under some economic forecasts, the most cost-effective alternative is to repurpose only the Northeast plant and continue to operate the
Southwest plant. Therefore, it is proposed that DWSD move forward with repurposing the Northeast
water treatment plant by 2020, and then re-examine the cost effectiveness of continuing to operate
the Southwest plant or repurposing it.
DWSD has already taken the initial steps in its FY2016 CIP to reduce the capacity of its water treatment plants. The FY2016 CIP was developed with substantial input from the Water Master Plan
Update.

Product Plan Section 6
Page 74
Figure 6-1: Summary of Life Cycle Cost Analysis1
The water treatment consolidation and repurposing program outlined in this chapter builds on the
plan for regulatory compliance and source water protection outlined in Chapter 5. The new
consolidation and repurposing program will reduce DWSD’s costs for operation and maintenance, as
well as reduce its immediate capital costs for plant upgrades and long term costs for regulatory
compliance. This program builds on DWSD’s ongoing initiatives for optimization, asset management,
and customer service, and it maintains high level of service standards in drinking water quality,
pressure and volume.
6.2 Existing Water Treatment Facilities DWSD owns and operates five water treatment facilities which provide water to 3.54 million
customers in Southeastern Michigan. The Springwells, Northeast, Southwest, Lake Huron, and Water Works Park Water Treatment Plants have a maximum rated treatment capacity of 1,720 million
gallons per day and firm high service pumping capacity of 2,400 million gallons per day. The high
service pumping capacity exceeds the rated treatment capacity to assist in meeting peak hourly
demands from finished water storage. Applicable treatment and pumping capacities and other data
for each plant are shown in Table 6-1.
1 The costs in Figure 6-1 include allowances for financing costs. Financing costs were not explicitly included in the life-cycle cost analysis presented in TM-6. Therefore, the values in Figure 6-1 differ slightly from the values in TM-6 and Table 6-6.
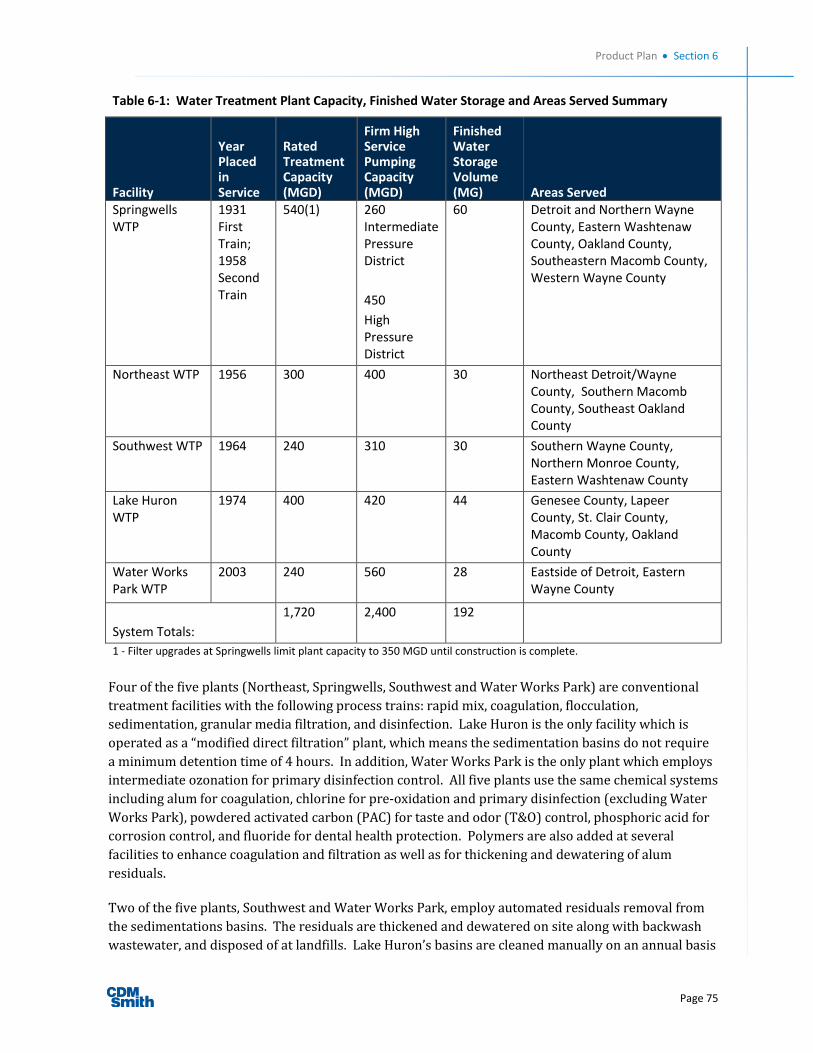
Product Plan Section 6
Page 75
Table 6-1: Water Treatment Plant Capacity, Finished Water Storage and Areas Served Summary
Facility
Year Placed in Service
Rated Treatment Capacity (MGD)
Firm High Service Pumping Capacity (MGD)
Finished Water Storage Volume (MG) Areas Served
Springwells WTP
1931 First Train; 1958 Second Train
540(1) 260 Intermediate Pressure District
450
High Pressure District
60 Detroit and Northern Wayne County, Eastern Washtenaw County, Oakland County, Southeastern Macomb County, Western Wayne County
Northeast WTP 1956 300 400 30 Northeast Detroit/Wayne County, Southern Macomb County, Southeast Oakland County
Southwest WTP 1964 240 310 30 Southern Wayne County, Northern Monroe County, Eastern Washtenaw County
Lake Huron WTP
1974 400 420 44 Genesee County, Lapeer County, St. Clair County, Macomb County, Oakland County
Water Works Park WTP
2003
240 560 28 Eastside of Detroit, Eastern Wayne County
System Totals:
1,720 2,400 192
1 - Filter upgrades at Springwells limit plant capacity to 350 MGD until construction is complete.
Four of the five plants (Northeast, Springwells, Southwest and Water Works Park) are conventional
treatment facilities with the following process trains: rapid mix, coagulation, flocculation,
sedimentation, granular media filtration, and disinfection. Lake Huron is the only facility which is
operated as a “modified direct filtration” plant, which means the sedimentation basins do not require
a minimum detention time of 4 hours. In addition, Water Works Park is the only plant which employs
intermediate ozonation for primary disinfection control. All five plants use the same chemical systems
including alum for coagulation, chlorine for pre-oxidation and primary disinfection (excluding Water Works Park), powdered activated carbon (PAC) for taste and odor (T&O) control, phosphoric acid for corrosion control, and fluoride for dental health protection. Polymers are also added at several
facilities to enhance coagulation and filtration as well as for thickening and dewatering of alum
residuals.
Two of the five plants, Southwest and Water Works Park, employ automated residuals removal from
the sedimentations basins. The residuals are thickened and dewatered on site along with backwash
wastewater, and disposed of at landfills. Lake Huron’s basins are cleaned manually on an annual basis

Product Plan Section 6
Page 76
and the sludge is discharged to the sludge drying lagoons. The lagoons also receive thickened solids
from the waste wash water treatment facility which processes filter backwash wastewater. The
Springwells and Northeast plants do not have automated alum residuals collection in the
sedimentation basins or a thickening treatment process on site for alum residuals or backwash
wastewater. At both facilities, the basins have been manually cleaned on an annual or biannual basis
and the solids discharged to the wastewater collection system; backwash wastewater is also
discharged to the wastewater collection system. Over the last two years, DWSD has assessed the
impact of the water treatment residuals on its wastewater treatment plant, and is seeking solutions to
minimize the residuals loading. A pilot is planned at Northeast in which the mud valves in the
sedimentation basins will be opened approximately every two months to discharge sedimentation
basin solids to the collection system. This process will be adopted at Springwells if the pilot test at
Northeast is successful.
A more complete description of treatment processes is provided in TM-13 in the Appendix. A general
description of each plant is presented below.
6.2.1 Springwells Water Treatment Plant The Springwells WTP is the oldest of the DWSD water treatment facilities. The first train was
constructed in 1930 and has a maximum rated capacity of 340 MGD and the second train constructed
in 1958 has a maximum rated capacity of 200 MGD, for a total capacity of 540 MGD. Like Northeast,
the Springwells plant receives its raw water from the Belle Isle Intake. The raw water influent is
screened, chlorinated and fluoridated at Water Works Park before it is conveyed to Springwells. The
low lift pumps lift the raw water for treatment through the process trains, which operate
independently. The 1930 train provides hydraulic mixing through a baffled chamber for rapid mixing
while the 1958 train has mechanical rapid mixers. Both trains have flocculation, sedimentation and
filtration treatment units. Figure 6-2 shows a schematic diagram of the Springwells Water Treatment
Plant.
A major project to upgrade the Springwells plant, SP 583, was underway during the preparation of this Master Plan Update. This project includes a complete replacement of the 1958 filters and a limited
replacement of some of the 1930 filters. A laboratory upgrade, yard piping and other site
improvements, and electrical improvements are also included in this project.
6.2.2 Northeast Water Treatment Plant
The Northeast Water Treatment Plant was constructed in 1956 to serve growing suburban
populations east and north of Detroit. The source of raw water is the Belle Isle intake, located in the
Detroit River, which also serves Springwells and Water Works Park. The raw water is chlorinated,
fluoridated, and screened at WWP before it flows to Northeast by gravity. Low lift pumps lift the raw
water to the process trains, which operate in parallel. With a maximum rated capacity of 300 MGD,
the plant process trains consist of rapid mix, flocculation, sedimentation, and dual-media gravity
filtration. Figure 6-3 shows a schematic diagram of the Northeast Water Treatment Plant.
6.2.3 Southwest Water Treatment Plant The Southwest Water Treatment Plant was constructed in 1963 at which time it was owned and
operated by Wayne County. Through an agreement with Wayne County, DWSD purchased this plant
to regionalize water services in Southeast Michigan. Raw water for Southwest flows by gravity from

Product Plan Section 6
Page 77
the Detroit River through an intake at Fighting Island. The plant has a rated capacity of 240 MGD. The
original plant was designed with the ability to be upgraded to 320 MGD via equipment replacement. There are also spare raw water conduits which can accommodate an expansion up to 480 MGD. The
low lift pumps lift the raw water for treatment through the process trains which operate in parallel. The Southwest Water Treatment Plant also has a Residuals Handling Facility to treat filter backwash
wastewater and alum sludge residuals. Figure 6-4 shows a schematic diagram of the Southwest
Water Treatment Plant.
6.2.4 Lake Huron Water Treatment Plant Lake Huron was constructed in 1974, initially designed as a conventional water treatment facility. In
2004, after completion of a pilot study along with various upgrades to the process trains, the MDEQ
rated the maximum capacity of Lake Huron at 400 MGD. Lake Huron is the only DWSD facility which
is operated in “modified” direct filtration mode. The sedimentation basins do not meet 10-State
standards and thus are not considered to be true settling basins by the MDEQ. The raw water source
for the plant is Lake Huron. The raw water tunnel is designed for a maximum capacity of 1200 MGD
and 800 MGD during cold weather. The plant was constructed with provisions to increase the
capacity by adding additional process trains and pumping units to obtain the maximum production
capacity of 1200 MGD.
In the early 2000’s a variety of process treatment improvements were constructed at the Lake Huron
WTP. These improvements included new high lift and backwash water pumps (including discharge
piping and valves), rehabilitation of two clear wells and the high service suction well, filtration
capacity improvements, pretreatment improvements and filter control modification, and a new
treatment facility for filter backwash wastewater. Figure 6-5 shows a schematic diagram of the Lake
Huron Water Treatment Plant.
6.2.5 Water Works Park Water Treatment Plant Water Works Park II began operating in 2003 as a conventional surface water treatment plant. The
original Water Works Park water treatment plant was razed and a new facility was constructed on the
same site. The raw water source for the plant is the Belle Isle intake on the Detroit River. The plant
has a maximum rated capacity of 240 MGD and is DWSD’s first facility with ozone disinfection facilities as well as a Residuals Handling Facility to treat filter backwash wastewater and alum sludge residuals.
The plant was designed to use independent process trains - a minimum of two process units are
provided for each treatment process. In addition, all conveyance facilities such as pipelines, junction
chambers, channels, and wet wells are configured to provide a minimum of two treatment pathways.
Figure 6-6 shows a schematic diagram of the Water Works Park Water Treatment Plant.
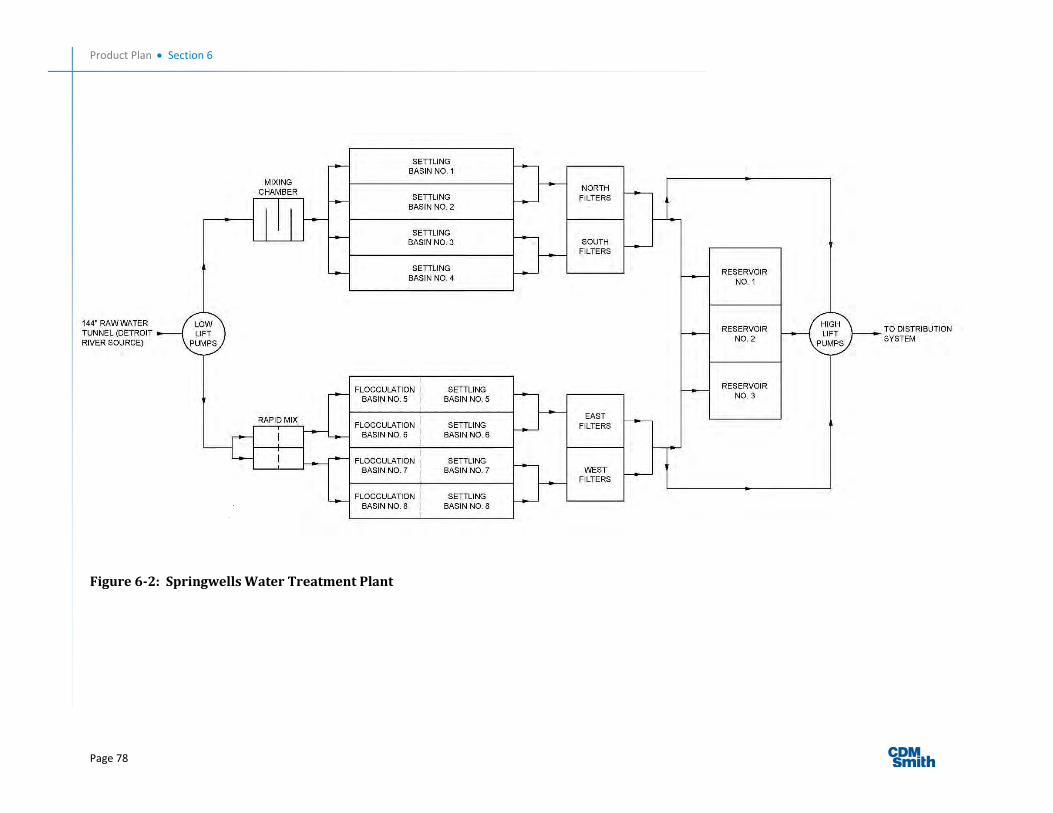
Product Plan Section 6
Page 78
Figure 6-2: Springwells Water Treatment Plant

Product Plan Section 6
Page 79
Figure 6-3: Northeast Water Treatment Plant
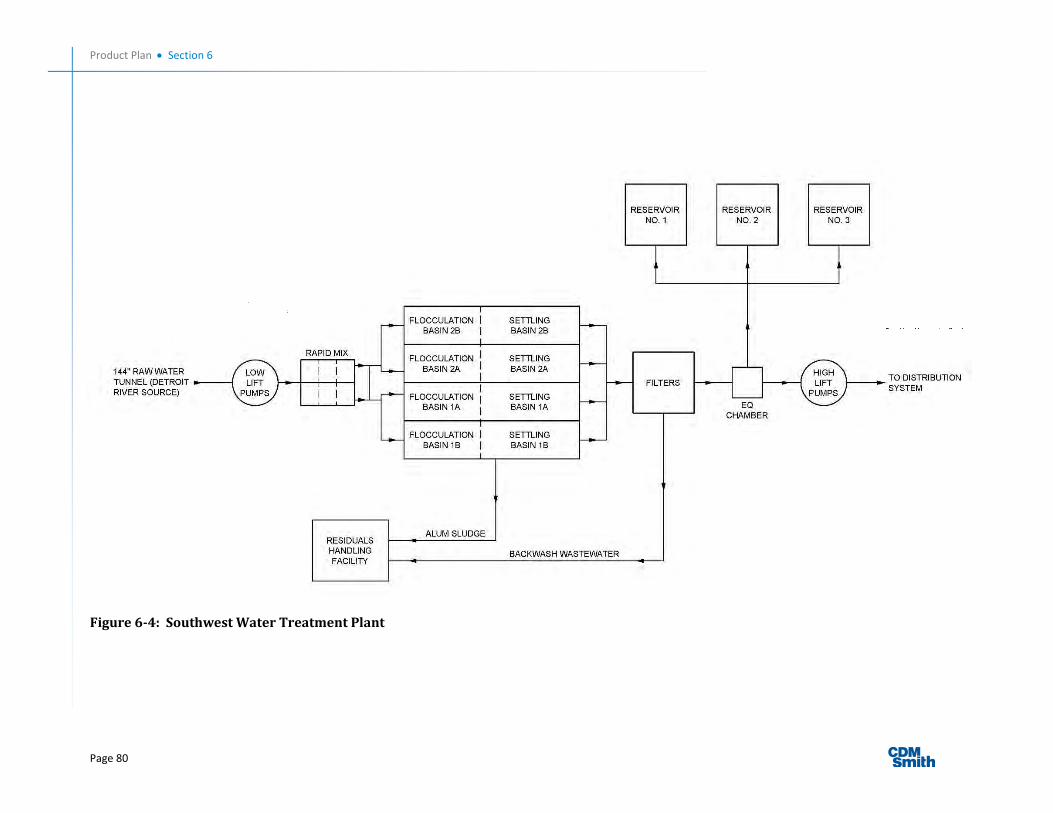
Product Plan Section 6
Page 80
Figure 6-4: Southwest Water Treatment Plant
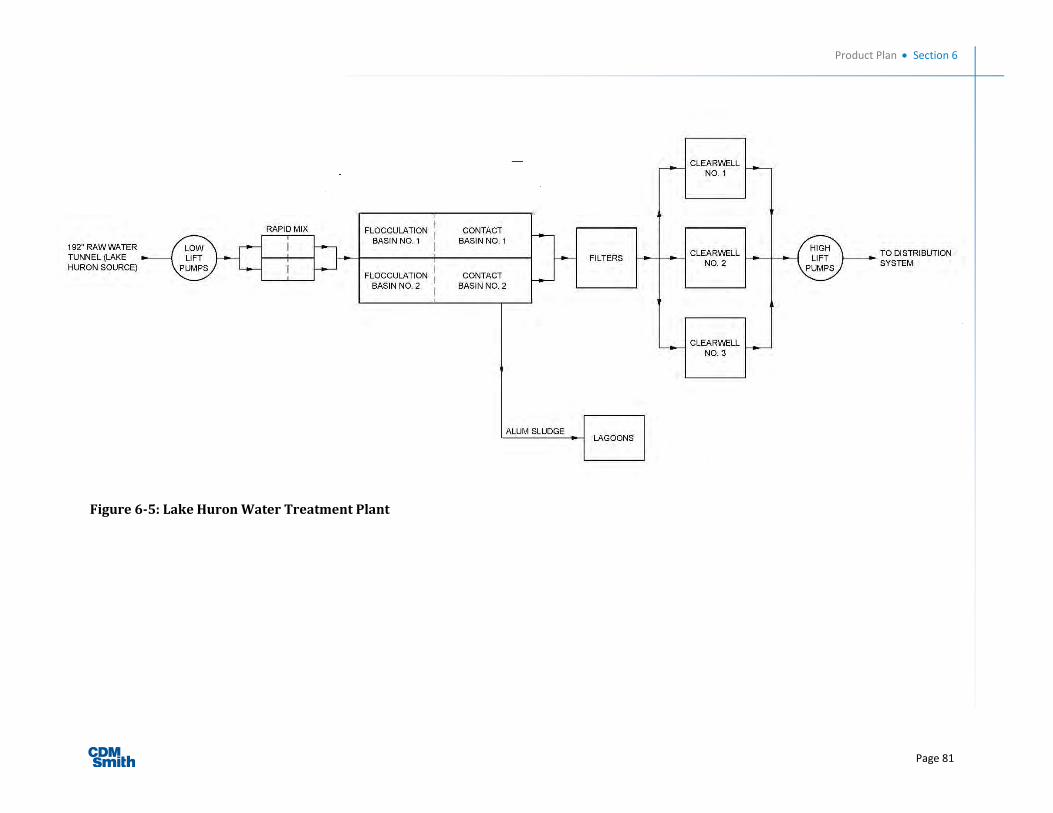
Product Plan Section 6
Page 81
Figure 6-5: Lake Huron Water Treatment Plant
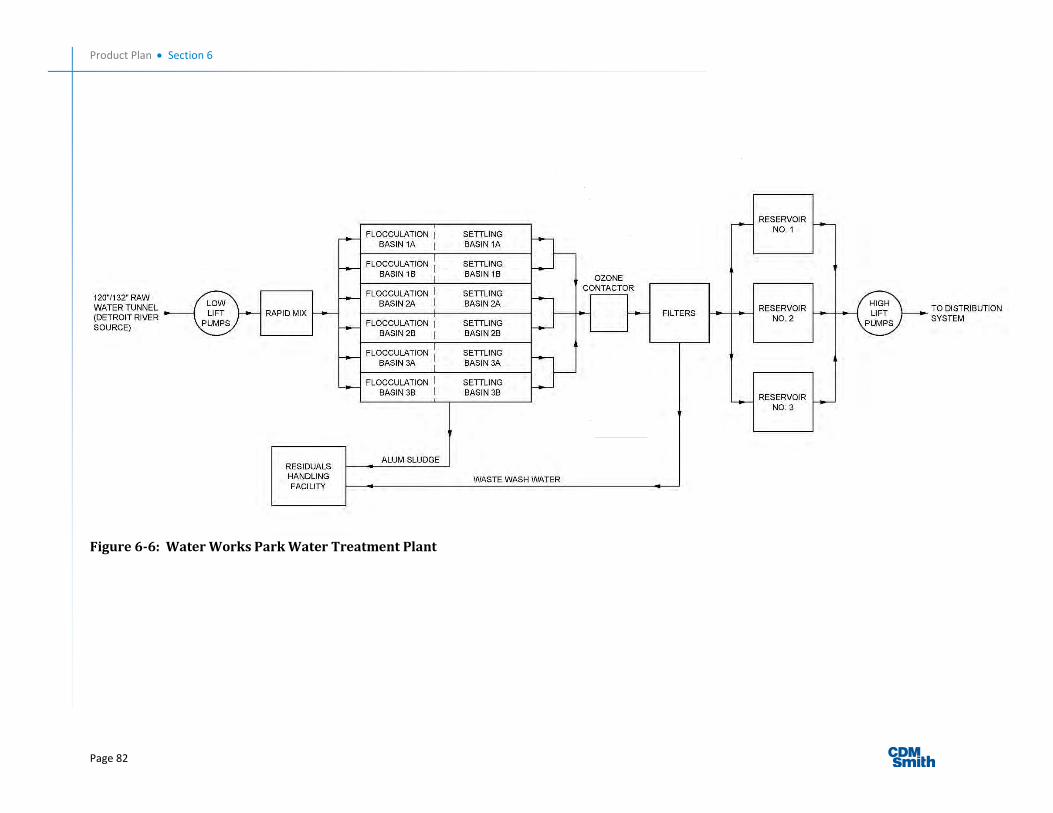
Product Plan Section 6
Page 82
Figure 6-6: Water Works Park Water Treatment Plant
Product Plan Section 6
Page 83
6.3 Needs Assessment An assessment of the capital improvement needs for all five plants was performed. This work included a
review and update of previous needs assessment projects in the years 2002 and 2003. At that time,
DWSD performed a series of detailed inspections and engineering studies at its three oldest water treatment plants – Springwells, Northeast, and Southwest. The update was prepared in a series of five
steps:
1. Detailed review of 2002 and 2003 Needs Assessment reports.
2. Identification of projects completed since 2003.
3. Interviews with DWSD engineering staff, plant operators and general plant inspections in
September 2013.
4. Integration with the evaluation performed for the Independent Evaluation of DWSD’s 10-Year Capital Improvement Program in September 2013.
5. Review of the current DWSD capital improvement plans for the period July 2014 to June 2020.
In updating the previous needs assessments, any previously proposed improvements to add treatment
capacity were excluded from the forecast for this master plan. For example, in the previous 2002 Needs
Assessment for the Northeast Water Treatment Plant, there was a recommendation to increase the plant
capacity from 300 MGD to 340 MGD. Costs for this capacity expansion are not included in the updated
needs assessment for this master plan.
Highlights of the updated needs assessment for each plant are presented below. Additional detail and
project lists are provided in TM-13 in the Appendix. The proposed improvements address identified
needs for mechanical equipment upgrades, regulatory requirements, safety and reliability, and efficiency
in operation, and are intended to bring the plants to the levels of reliability and redundancy established
in TM-4 Planning Criteria.
6.3.1 Springwells Water Treatment Plant Needs Assessment The Needs Assessment for Springwells was completed in November of 2002. This report identified
process, mechanical, electrical, instrumentation, HVAC, structural and architectural system deficiencies.
All of these deficiencies were grouped into projects and a 10-year capital improvement plan was
developed to address the necessary improvements. Some of the major process improvements identified
were completed or are under construction at Springwells. The largest project is SPW 583, which is the
rehabilitation of the 1958 filters.
6.3.2 Northeast Water Treatment Plant Needs Assessment The Needs Assessment for the Northeast Water Treatment Plant was completed in April 2002. This
project was conducted to identify process, mechanical, electrical, instrumentation, HVAC, structural and
architectural deficiencies and develop a 10-year capital improvement program to address these needs.
The needs assessment team found that, due to the length of service of much of the plant’s equipment and
the frequency of preventive and corrective maintenance activities, most of the process equipment was in
need of replacement.
Product Plan Section 6
Page 84
Most of the projects recommended have not been constructed and several design projects for recommended improvements are now on hold, pending the findings from this update of the water master plan. DWSD staff have performed very well to maintain high water quality at the Northeast plant
without the previously recommended improvements. Recent and proposed short-term projects are
designed to maintain minimum plant operations until the plant is repurposed.
6.3.3 Southwest Water Treatment Plant Needs Assessment
The Needs Assessment report for the Southwest Water Treatment Plant was completed in May of 2003.
This report identified process, mechanical, electrical, instrumentation, HVAC, structural and
architectural system deficiencies. All of these deficiencies were grouped into projects and a 10-year capital improvement plan was developed to address the necessary improvements. Several of the
projects have been completed in the last ten years. During 2011 to 2013, capacity at the Southwest
plant was limited to 120 MGD while project SW-548 (Sludge Treatment and Waste Wash Water Treatment Facilities) was being completed.
6.3.4 Lake Huron Water Treatment Plant Capital improvements needs for the Lake Huron Water Treatment Plant were included in the
Comprehensive Water Master Plan in 2004. Several projects were identified to increase the treatment
capacity of Lake Huron to match future demand projections of the DWSD water distribution system in
the northern and northwestern suburbs. Given decreasing water demands in recent years, only a
number of smaller projects have been implemented.
6.3.5 Water Works Park Water Treatment Plant The Water Works Park water treatment plant was new at the time that the 2004 Comprehensive Water Master Plan Team was prepared. Consequently, the 2004 master plan only recommended the addition
of a new UV disinfection system. The yard piping improvements project for Water Works Park is
included in DWSD’s current capital improvement plan, and this is a time-critical project that must be
completed before the Northeast plant can be decommissioned and repurposed. Other sizeable projects
for Water Works Park include a new ozone generator, Ovation system upgrades, and replacement of certain mechanical equipment subject to high wear.
6.4 Discussion of Particular Types of Improvements Three types of identified future needs have significant capital and O&M cost impact and are discussed
below.
6.4.1 Residuals Handling
Mechanical systems to handle residuals in sedimentation basins have been installed in the Water Works
Park and Southwest water treatment plants. DWSD is currently testing a new procedure to flush small quantities of sedimentation basin residuals to the wastewater collection system on a regular schedule. If this procedure is successful, then systems to handle residuals may be less costly at Northeast and
Springwells. The cost for full mechanical residuals handling has been maintained in TM13, but ultimate
implementation could be achieved at a lower cost than presented.

Product Plan Section 6
Page 85
6.4.2 Advanced Disinfection The 2002 and 2003 needs assessment reports and the 2004 Comprehensive Water Master Plan included
the addition of ultraviolet light (UV) disinfection at all five water plants and the addition of ozone at the
Southwest, Northeast, Lake Huron and Springwells plants. Ozone is currently installed at Water Works
Park.
The addition of ozone and UV to enhance DWSD’s ability to remove giardia and cryptosporidium was
proposed in the 2002 and 2003 needs assessment reports. The US EPA Interim Enhanced Surface Water Treatment requires 2-log removal of Cryptosporidium. This is accomplished by filtration performance
which is achievable by well operated water plants. Additional removal may be required depending on
the concentrations of Cryptosporidium detected in the source water(s). If additional Cryptosporidium
removal is required based upon sampling results, then a utility has multiple options for providing that removal, including but not limited to, ozone, UV, enhanced filtration, source water protection, and other approaches. Michigan utilities, including DWSD, are not required to achieve additional Cryptosporidium
removal because of source water quality.
6.4.3 Chlorine Gas Conversion In 2007-2008, MDEQ conducted a project to meet with all water and wastewater utilities that use gas
chlorine in Michigan to discuss the potential to convert to non-gas alternative (such as hypochlorite). A
few utilities, such as Wyoming, have since made the conversion. The MDEQ continues to advocate for reduction in gas chlorine use. If a capital project at a treatment plant impacts the disinfection system,
that utility will be required to convert or to justify continued gas chlorine use. In addition, the US
Congress has discussed including water and wastewater utilities in the CFATS (Chemical Facilities Anti-Terrorism Standard). After much deliberation, water and wastewater utilities have remained exempt, and this regulation is currently not being actively pursued. Both MDEQ and Congress justify the
reduction in use of gas chlorine based on risks from both accidental releases and terrorism acts.
Several major water utilities in the United States and Canada are currently implementing projects to
convert from chlorine gas to on-site generation of sodium hypochlorite. On-site generation of sodium
hypochlorite for water treatment plants in the range of 180 MGD to 540 MGD would use technology to
convert brine to a 12 percent solution of sodium hypochlorite. New facilities are needed for salt
receiving, handling and storage; brine generation, heat exchangers, chillers, and water softening;
storage tanks for brine and 12 percent sodium hypochlorite; and new equipment for adding and mixing
sodium hypochlorite in the finished water. Based on the cost of installations in other water utilities,
costs for DWSD’s water plants could be $20 to $40 million per plant, or higher.
Chlorine gas conversion was not included in previous needs assessment reports. It has been included in
life cycle cost analysis in TM-6 as part of the potential costs of regulatory compliance. Further discussion will be held with DWSD during development of the Service Management Plan in March 2015
to address chlorine gas conversion in long term capital planning.

Product Plan Section 6
Page 86
6.4.4 Summary Table 6-2 presents a summary of the needs assessment in TM-13. The cost estimates show needs based
on current regulatory requirements to rehabilitate the plants to their current rated capacities. The work
includes the installation of mechanical system for residuals as described above.
Table 6-2: Summary of Needs Assessment for 2015 to 2035 Based on Current Regulatory Requirements Plant Needs Based on Current
Regulations Lake Huron $ 176,800,000
Northeast $ 211,200,000
Water Works Park $ 82,800,000
Springwells $ 446,000,000
Southwest $ 64,200,000
Total $ 981,000,000
Notes: See TM-6 and TM-13 for documentation of these numbers. Values are rounded to nearest hundred thousand dollars. Cost estimates are based on prevailing construction prices for March 2014.
6.5 Screening and Evaluation of Alternatives A two-phase process was conducted to screen a range of alternatives for water treatment plant
consolidation and repurposing. A detailed presentation of the screening and evaluation of alternatives
is presented in TM-6 in the Appendix. Highlights are presented in this chapter.
In the first phase, eight alternatives were analyzed. Based on the conclusions from the screening
process, four alternatives were given additional consideration. The process was conducted with a high
degree of involvement from DWSD staff, wholesale customers, and the Board of Water Commissioners.
Four meetings and three workshops devoted to this issue were held between March and August of 2014.
6.5.1 Screening of Alternatives In the first phase, the following alternatives were analyzed:
1. Maintain all 5 plants at their current capacity
2. Repurpose the Northeast plant
3. Repurpose Southwest plant
4. Repurpose Northeast and Southwest plants
5. Repurpose the Springwells plant
6. Increase Capacity at Lake Huron

Product Plan Section 6
Page 87
7. Reduce Capacity Across all plants
8. Repurpose Lake Huron plant
In this analysis “repurposing” a water treatment plant means maintaining the high lift pumping and
reservoirs, and then building a new main or mains to supply water to the high lift pumping. The existing
reservoirs will be supplied with water from other plants, and the existing high lift pumps will operate in
manner similar to other booster pumping stations in the system.
An important factor to consider in planning a reduction in the number of water treatment plants is the
limited number of days each year when the plants operate at or near their peak capacity. Currently, the
five plants operate at less than 35% percent of design capacity for 9 months of the year. Figure 6-7
compares rated water treatment plant capacity to projected water demand. Water treatment capacity is
based on the maximum day demand. The maximum day demand, in turn, is based on the summer time
outdoor irrigation pattern. The maximum day demand pattern is approximately twice the average day
demand when outdoor irrigation is at its maximum. However, due to the variability of weather, outdoor irrigation demands fluctuate from year to year, and the design maximum day demand may be reached
every 3 to 5 years. 2013 and 2014 were cool, wet summers, and the maximum day demands were 761
and 748 MGD, respectively. 2012 was exceptionally dry and warm, and the maximum day demand was
969 MGD. Figure 6-7 shows capacity requirements in terms of days per year.
Figure 6-7: Comparison of Plant Capacity and Projected Water Demand (dotted red lines)
The alternatives are described below. All alternatives were defined so that they met the standards for redundancy established in TM-4. In order to meet these standards, any alternative that includes
decommissioning a plant includes new transmission system improvements to allow for maximum day
demand to be conveyed from other remaining plants.

Product Plan Section 6
Page 88
1. Maintain all Plants at Current MDEQ Rated Capacity. This is the baseline alternative of continuing to upgrade and operate plants at current permitted capacity. In this alternative, all plants would be upgraded to the levels summarized in Table 6-1 to meet current regulatory
requirements. The Water Works Park Yard Piping Project, WW-536, would be completed so
that the high lift pumps can move 240 MGD from the plant site. The work of upgrading the
plants would be performed over the 20-year period 2015 to 2035. For purposes of general
planning of the construction work, the following phases were established in Table 6-3.
Table 6-3: Construction Phasing Plan for Life Cycle Cost Analysis
Period Type of Upgrade Activity Approximate Percent of Total Construction Cost
2015-2019 Safety, Water Quality 10
2020-2024 Efficiency, Water Quality 25
2025-2029 Efficiency, Water Quality 30
2030-2034 Service Life Renewal 35
2. Repurpose the Northeast Water Treatment Plant. This is the same as the baseline alternative,
except the Northeast plant treatment facilities would be decommissioned early in the planning
period. The high lift pumps and finished water reservoirs would continue in operation, and
would function like other booster pump stations in the transmission system. Transmission
system improvements would be made to allow the Northeast reservoirs to be filled from the
high lift pumps at Water Works Park and the North Service Center.
3. Repurpose the Southwest Water Treatment Plant. This is the same as the baseline alternative,
except the Southwest plant treatment facilities would be decommissioned early in the planning
period. The high lift pumps and finished water reservoirs would continue in operation, and
would function like other booster pump stations in the transmission system. Transmission
system improvements would be made to allow the Southwest reservoirs to be filled from the
high lift pumps at Springwells.
4. Repurpose the Northeast and Southwest Water Treatment Plants. This is the same as the
baseline alternative, except the Northeast and Southwest plant treatment facilities would be
decommissioned early in the planning period. The high lift pumps and finished water reservoirs
would continue in operation, and would function like other booster pump stations in the
transmission system. Transmission system improvements would be made to allow the
Northeast reservoirs to be filled from the high lift pumps at Water Works Park. North Service
Center valve operations would be changed to allow more water from Lake Huron into the
Northeast service area. Other improvements would allow the Southwest reservoirs to be filled
from the high lift pumps at Springwells.
5. Repurpose the Springwells Water Treatment Plant. This is the same as the baseline alternative,
except the Springwells plant treatment facilities would be decommissioned early in the planning
period. The high lift pumps and finished water reservoirs would continue in operation, and
would function like other booster pump stations in the transmission system. Transmission

Product Plan Section 6
Page 89
system improvements would be made to allow the Springwells reservoirs to be filled from the
high lift pumps at Water Works Park and Northeast.
6. Expand the Lake Huron Plant and Continue to use Water Works Park. This alternative would
expand the Lake Huron plant to use direct filtration treatment technology. Direct filtration is a
less costly treatment process, because it does not use sedimentation ahead of filtration. The
excellent source water quality in Lake Huron makes this process theoretically feasible. Pilot
testing would be needed to establish design criteria and obtain approval from MDEQ. The Water Works Park plant would be upgraded and operated at its current rated capacity. Other plants
would be decommissioned. The high lift pumps and finished water reservoirs of the other plants would continue in operation, and would function like other booster pump stations in the
transmission system. Significant transmission system improvements would be required to
bring more water from the Lake Huron plant to the service area. In concept, this would require
the second feed from the Lake Huron Plant to the North Service Center, plus additional
transmission improvements south of that point.
7. Upgrade All Plants at a Reduced Rated Capacity. This alternative would maintain all plants, but
the total capacity would be equal to the projected maximum day demand in 2035, roughly 1000
MGD. There are many ways to downsize the plants to equal 1000 MGD. The scenario shown in
Table 6-4 was used for the ;life-cycle cost evaluation:
Table 6-4: Scenario for Future Reduced Capacity Plant Scenario for Future
Rated Capacity Rationale
Water Works Park 240 New plant, maintain existing rated capacity
Northeast 150 High cost to upgrade, reduce capacity by half
Southwest 180
Reduce capacity 25 percent with one less flocculation/sedimentation train
Springwells 200
Capacity of 1958 plant, currently being upgraded
Lake Huron 300
Reduce because most water customers are far south of this plant
Total 1,0702
Transmission improvements similar to those included in Alternative 5 would be required to
assure that finished water could be routed among the Northeast, Southwest, Water Works Park
and Springwells plants, and they could collectively meet maximum day demands.
8. Repurpose Lake Huron Water Treatment Plant. This alternative was suggested for consideration by one of DWSD’s wholesale customers. It is the same as the baseline alternative,
except the Lake Huron plant treatment facilities would be decommissioned early in the planning
period. The reason for considering this is that the energy cost for pumping water are higher from Lake Huron than other plants, and the plant could be offered for sale to KWA. Due to the
2 The capacity of 1,070 MGD used in the life-cycle cost evaluation was later refined to 1,040 MGD for the recommended plan. This footnote also applies to Table 6-5 and Table 6-6.
Product Plan Section 6
Page 90
distance of this plant, the high lift pumps and finished water reservoirs would not continue in
operation. Transmission system improvements would be made to provide a second
transmission main from the North Service Center to customers in northern Macomb County and
northern Oakland County as a redundant source of supply should a service disruption take place
on the 96-inch transmission main.
TM-6 in the Appendix presents the details of the life cycle cost evaluation for the Screening of Alternatives. The following conclusions were drawn:
It is cost effective to reduce the number of treatment plants in the future. In the face of stable
water demands, DWSD can avoid capital costs by upgrading fewer plants.
Given the potential for future regulatory requirements for ozone, ultraviolet disinfection, and
chlorine gas conversion, the cost savings of decommissioning two plants could be 15 to 20
percent greater than shown in Table 6-2. Therefore, potential future regulatory requirements
reinforce the cost-effectiveness of reducing the number of DWSD’s water treatment facilities.
DWSD would reduce fixed costs and achieve economies of scale by making regulatory-driven
improvements at fewer facilities in the future.
The alternative for direct filtration at Lake Huron has potential long term merit. This alternative
could be more cost-effective in the future, depending on adding new customers in the northern
part of the service area, and depending on future regulations.
It is cost-effective to decommission the Northeast water treatment plant early in the planning
period. During the 1970s and again in 1985, the Northeast plant was temporarily closed, and
there is operational experience on filling its reservoirs from the transmission system.
Transmission system upgrades totaling approximately $68 million are required, but capital costs
avoided by not upgrading the Northeast plant are $211 million based on current regulations and
potentially much higher if ozone, UV disinfection and chlorine gas conversion are required in the
future.
It is potentially cost effective to decommission the Southwest water treatment plant later in the
planning period. Improvements currently underway at the Springwells 1958 plant need to be
completed, and future improvements to assure the reliability of Springwells high lift and
intermediate pumps need to be completed.
Also, further evaluation of nonrevenue water and reduction in non-revenue water is
recommended. Over $60 million in new capital improvements have been made at the Southwest
plant in the last 7 years. Delaying the closure of Southwest allows DWSD to gain more benefit
from those investments while rehabilitation of Springwells continues. However, if a future
decision or event triggers the need for new capital investment at Southwest, then that would be
the time to consider decommissioning.
Part of the ongoing upgrade project at Springwells includes limited upgrades to the Springwells
1930 filter plant. That work could determine that the cost to upgrade all of the 1930 filters is
greater than what has been estimated in the updated needs assessment. If that is the case, then
Product Plan Section 6
Page 91
DWSD could consider decommissioning the 1930 filter plant at Springwells, but maintain the
1958 plant and the Southwest plant.
6.5.2 Evaluation of Selected Alternatives
The preceding findings and conclusions were reviewed with DWSD and wholesale customers in a series
of workshops from May to August 2014. Based on the results of the workshops, the following four alternatives were selected for further evaluation:
1. Reduce all plants to a total capacity of 1,070 MGD.
2. Repurpose the Northeast plant, and reduce others for a total of 1,070 MGD.
3. Repurpose the Northeast and Southwest plants, and reduce others for a total of 1,070 MGD.
4. Repurpose the Springwells plant, and reduce others for a total of 1,070 MGD.
In the evaluation of the selected four alternatives, some of the earlier ground rules used in the screening
of alternatives were changed. The changes included the addition of the following costs to the evaluation:
1. Costs for complying with potential future drinking water regulations;
2. Costs for warehousing and inventory of water treatment plant spare parts, equipment and
materials;
3. Annual costs for FY2014 were considered in addition to those previously used for FY2013; and
4. Costs to upgrade all critical inter-plant transmission mains and to maintain three water intakes.
TM-6 in the Appendix presents the details of the evaluation of selected alternatives. The non-monetary
considerations for the evaluation are listed in Table 6-7. Highlights are summarized in this section. The
four alternatives are described below.
1. Upgrade All Plants at a Reduced Rated Capacity. This alternative would maintain all plants, but
the total capacity would be equal to the projected maximum day demand in 2035, roughly 1000
MGD. There are many ways to downsize the plants to equal 1000 MGD. Further hydraulic
modeling and optimization of each operating zone to meet the future needs of the City of Detroit
and wholesale customers will establish the planning period capacities for each plant. The
following scenario was used for the economic evaluation for this Product Plan Interim Report:

Product Plan Section 6
Page 92
Table 6-5: Scenario for Future Reduced Capacity for Selected Alternatives
Plant Scenario for Future Rated Capacity Rationale
Water Works Park 240 New plant, maintain existing rated capacity
Northeast 150 High cost to upgrade, reduce capacity by half
Southwest 180
Reduce capacity 25 percent with one less flocculation/sedimentation train
Springwells 200
Capacity of 1958 plant, currently being upgraded
Lake Huron 300
Reduce to the capacity of the 96-inch main from Imlay Station to North Service Center
Total 1,0701
2. Repurpose the Northeast Water Treatment Plant. This is similar to the baseline alternative,
except the Northeast plant treatment facilities would be decommissioned early in the planning
period. The high lift pumps and finished water reservoirs would continue in operation, and
would function like other booster pump stations in the transmission system. Transmission
system improvements would be made to allow the Northeast reservoirs to be filled from the
high lift pumps at Water Works Park and the North Service Center.
3. Repurpose the Northeast and Southwest Water Treatment Plants. This is similar to the baseline
alternative, except the Northeast and Southwest plant treatment facilities would be
decommissioned early in the planning period. The high lift pumps and finished water reservoirs
would continue in operation, and would function like other booster pump stations in the
transmission system. Transmission system improvements would be made to allow the
Northeast reservoirs to be filled from the high lift pumps at Water Works Park. North Service
Center valve operations would be changed to allow more water from Lake Huron into the
Northeast service area. Other improvements will allow the Southwest reservoirs to be filled
from the high lift pumps at Springwells.
4. Repurpose the Springwells Water Treatment Plant. This is similar to baseline alternative,
except the Springwells plant treatment facilities would be decommissioned early in the planning
period. The high lift pumps and finished water reservoirs would continue in operation, and
would function like other booster pump stations in the transmission system. Transmission
system improvements would be made to allow the Springwells reservoirs to be filled from the
high lift pumps at Water Works Park and Northeast.
Table 6-6 shows a summary of present worth and annual operating and maintenance costs for the four selected alternatives compared to the projected cost of maintaining past practice with operation of all five plants at their current rated capacity.
The least cost alternative remains repurposing Northeast and Southwest. However, the costs are very
close, and an equally attractive alternative is to maintain Southwest but not upgrade Springwells beyond
the capacity of the current filter upgrade project. Filters could be rerated from 200 to 240, DWSD could
establish that new capacity for Springwells and avoid higher costs up upgrading the 1930 filter plant.
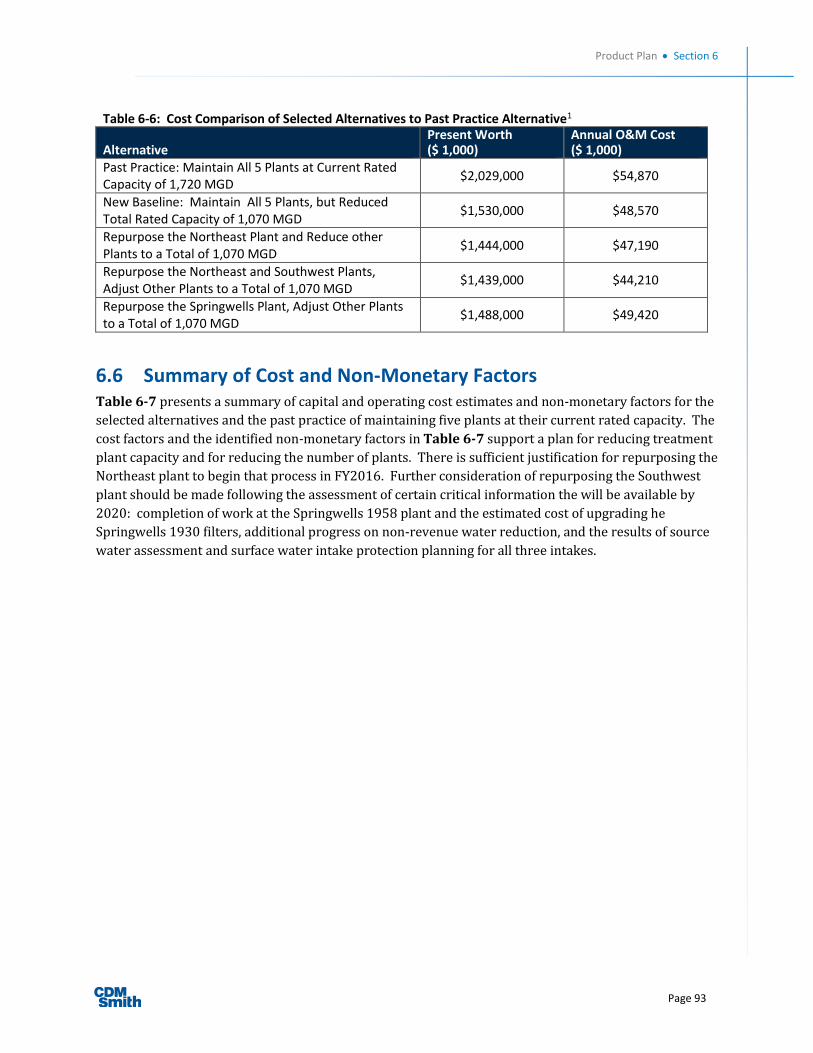
Product Plan Section 6
Page 93
Table 6-6: Cost Comparison of Selected Alternatives to Past Practice Alternative1
Alternative Present Worth ($ 1,000)
Annual O&M Cost ($ 1,000)
Past Practice: Maintain All 5 Plants at Current Rated Capacity of 1,720 MGD
$2,029,000 $54,870
New Baseline: Maintain All 5 Plants, but Reduced Total Rated Capacity of 1,070 MGD
$1,530,000 $48,570
Repurpose the Northeast Plant and Reduce other Plants to a Total of 1,070 MGD
$1,444,000 $47,190
Repurpose the Northeast and Southwest Plants, Adjust Other Plants to a Total of 1,070 MGD
$1,439,000 $44,210
Repurpose the Springwells Plant, Adjust Other Plants to a Total of 1,070 MGD
$1,488,000 $49,420
6.6 Summary of Cost and Non-Monetary Factors Table 6-7 presents a summary of capital and operating cost estimates and non-monetary factors for the
selected alternatives and the past practice of maintaining five plants at their current rated capacity. The
cost factors and the identified non-monetary factors in Table 6-7 support a plan for reducing treatment
plant capacity and for reducing the number of plants. There is sufficient justification for repurposing the
Northeast plant to begin that process in FY2016. Further consideration of repurposing the Southwest plant should be made following the assessment of certain critical information the will be available by
2020: completion of work at the Springwells 1958 plant and the estimated cost of upgrading he
Springwells 1930 filters, additional progress on non-revenue water reduction, and the results of source
water assessment and surface water intake protection planning for all three intakes.

Page 94
THIS PAGE INTENTIONALLY LEFT BLANK.
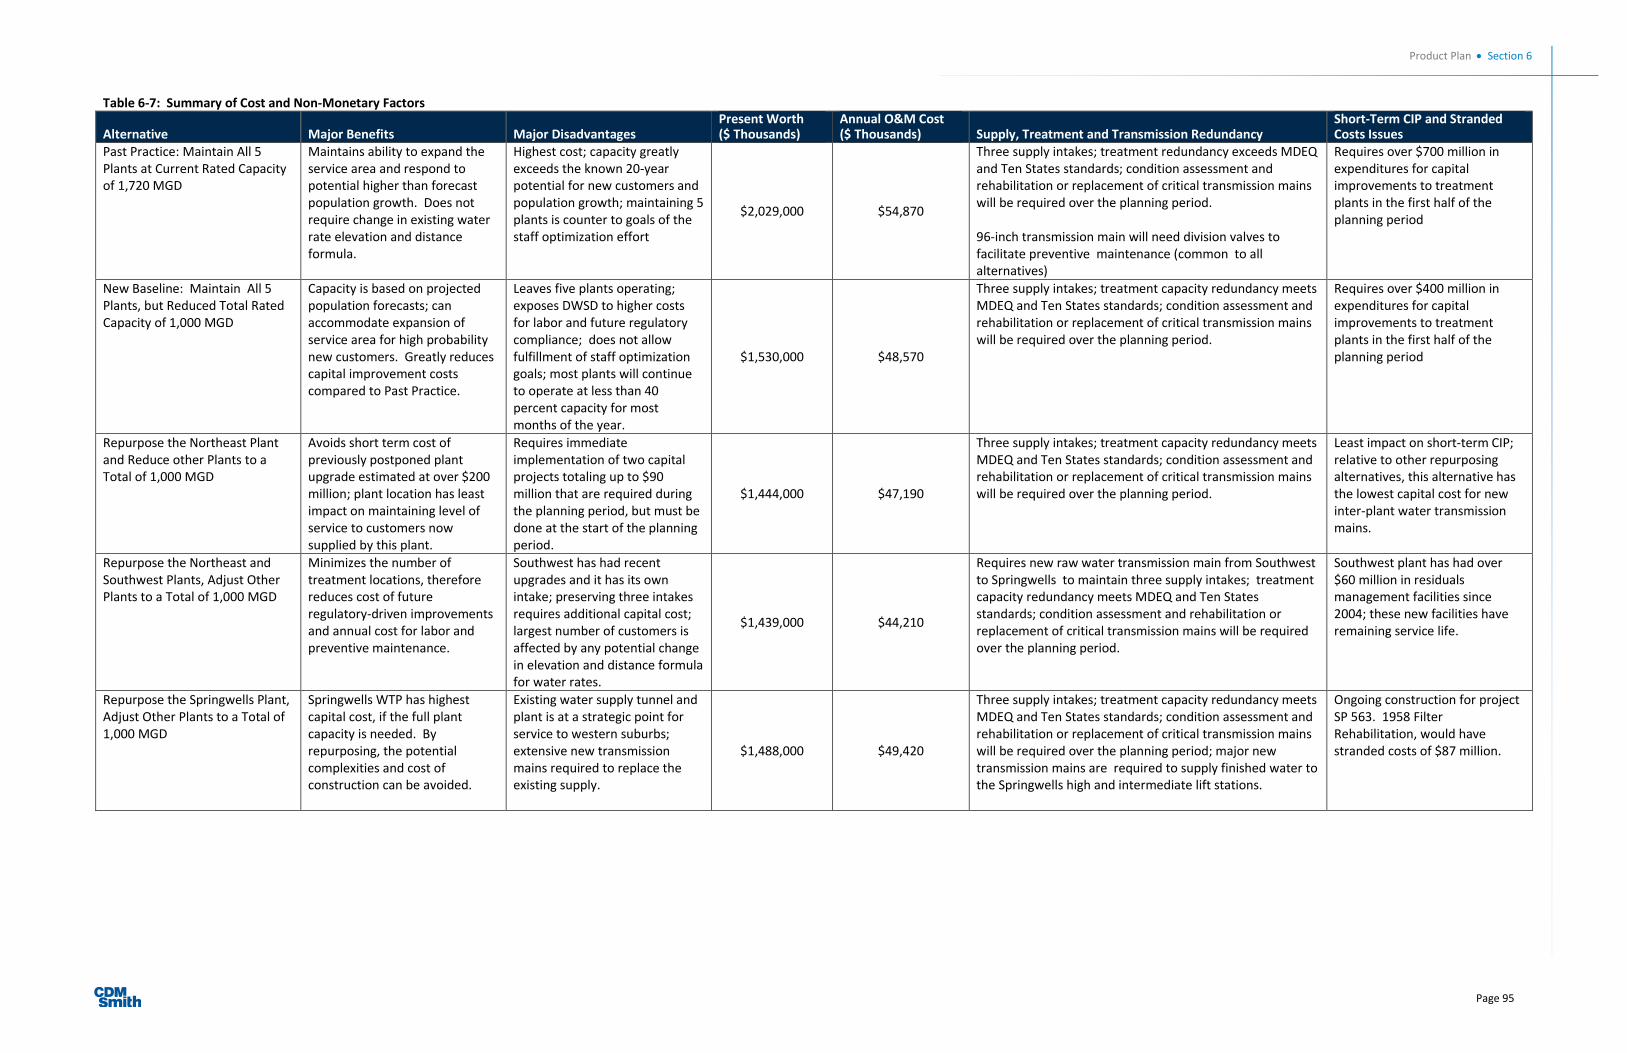
Product Plan Section 6
Page 95
Table 6-7: Summary of Cost and Non-Monetary Factors
Alternative Major Benefits Major Disadvantages Present Worth ($ Thousands)
Annual O&M Cost ($ Thousands) Supply, Treatment and Transmission Redundancy
Short-Term CIP and Stranded Costs Issues
Past Practice: Maintain All 5 Plants at Current Rated Capacity of 1,720 MGD
Maintains ability to expand the service area and respond to potential higher than forecast population growth. Does not require change in existing water rate elevation and distance formula.
Highest cost; capacity greatly exceeds the known 20-year potential for new customers and population growth; maintaining 5 plants is counter to goals of the staff optimization effort
$2,029,000 $54,870
Three supply intakes; treatment redundancy exceeds MDEQ and Ten States standards; condition assessment and rehabilitation or replacement of critical transmission mains will be required over the planning period. 96-inch transmission main will need division valves to facilitate preventive maintenance (common to all alternatives)
Requires over $700 million in expenditures for capital improvements to treatment plants in the first half of the planning period
New Baseline: Maintain All 5 Plants, but Reduced Total Rated Capacity of 1,000 MGD
Capacity is based on projected population forecasts; can accommodate expansion of service area for high probability new customers. Greatly reduces capital improvement costs compared to Past Practice.
Leaves five plants operating; exposes DWSD to higher costs for labor and future regulatory compliance; does not allow fulfillment of staff optimization goals; most plants will continue to operate at less than 40 percent capacity for most months of the year.
$1,530,000 $48,570
Three supply intakes; treatment capacity redundancy meets MDEQ and Ten States standards; condition assessment and rehabilitation or replacement of critical transmission mains will be required over the planning period.
Requires over $400 million in expenditures for capital improvements to treatment plants in the first half of the planning period
Repurpose the Northeast Plant and Reduce other Plants to a Total of 1,000 MGD
Avoids short term cost of previously postponed plant upgrade estimated at over $200 million; plant location has least impact on maintaining level of service to customers now supplied by this plant.
Requires immediate implementation of two capital projects totaling up to $90 million that are required during the planning period, but must be done at the start of the planning period.
$1,444,000 $47,190
Three supply intakes; treatment capacity redundancy meets MDEQ and Ten States standards; condition assessment and rehabilitation or replacement of critical transmission mains will be required over the planning period.
Least impact on short-term CIP; relative to other repurposing alternatives, this alternative has the lowest capital cost for new inter-plant water transmission mains.
Repurpose the Northeast and Southwest Plants, Adjust Other Plants to a Total of 1,000 MGD
Minimizes the number of treatment locations, therefore reduces cost of future regulatory-driven improvements and annual cost for labor and preventive maintenance.
Southwest has had recent upgrades and it has its own intake; preserving three intakes requires additional capital cost; largest number of customers is affected by any potential change in elevation and distance formula for water rates.
$1,439,000 $44,210
Requires new raw water transmission main from Southwest to Springwells to maintain three supply intakes; treatment capacity redundancy meets MDEQ and Ten States standards; condition assessment and rehabilitation or replacement of critical transmission mains will be required over the planning period.
Southwest plant has had over $60 million in residuals management facilities since 2004; these new facilities have remaining service life.
Repurpose the Springwells Plant, Adjust Other Plants to a Total of 1,000 MGD
Springwells WTP has highest capital cost, if the full plant capacity is needed. By repurposing, the potential complexities and cost of construction can be avoided.
Existing water supply tunnel and plant is at a strategic point for service to western suburbs; extensive new transmission mains required to replace the existing supply.
$1,488,000 $49,420
Three supply intakes; treatment capacity redundancy meets MDEQ and Ten States standards; condition assessment and rehabilitation or replacement of critical transmission mains will be required over the planning period; major new transmission mains are required to supply finished water to the Springwells high and intermediate lift stations.
Ongoing construction for project SP 563. 1958 Filter Rehabilitation, would have stranded costs of $87 million.

Page 96

Product Plan Section 6
Page 97
6.7 Proposed Treatment Programs Previous sections of this chapter and report have established the basic needs for treatment capacity,
operational efficiency, and regulatory compliance. This section identifies the major programs
required to meet these needs. In the context of this report, a “program” is a set of CIP projects and
annual O&M initiatives that collectively achieve an objective of this master plan. Four programs are
identified for treatment:
Program to Reduce Treatment Capacity
Program to Repurpose the Northeast Plant
Program for Regulatory Compliance
Program for Renewal, Reliability and Energy Management
Accompanying this master plan report is a 20-year Capital Improvement Plan (CIP) spreadsheet that
lists approximately 350 CIP projects. These projects are organized by program, including the four programs listed above for treatment, plus other programs for transmission, distribution, and metering
and non-revenue water.
6.8 Program to Reduce Treatment Plant Capacity The estimated maximum day treatment capacity for 2035 is estimated to be 1,040 MGD. This value is
based on subsequent refinement of 2035 water demands and hydraulic modeling subsequent to the
life-cycle cost evaluation. This number includes an allowance for emergency service for Flint and
Genesee County. There is no allowance for new customers joining the service area, but there is
projected growth in demand of existing customers. Trends in water use should be tracked annually
and assessed every 5 years, along with requests for service from new wholesale customers. The
projected 1,040 MGD maximum day capacity total should be reviewed again in the year 2020.
Table 6-8 presents the current rated capacities and optimized future capacities for treatment and
high lift pumping at each treatment plant.
Table 6-8: Future Optimized Treatment Capacity and High Lift Pumping Capacity
Plant
Existing Rated Treatment Capacity (MGD)
Existing High Lift Pumping Capacity (MGD, Firm)
April 2015 Operational Capacity (MGD)
Future Optimized Treatment Capacity (MGD)
Future Optimized Pumping Capacity (MGD, Firm)
Lake Huron 400 420 340 320 360
Northeast 300 556 240 0 260
Springwells 540 150 intermediate
520 high
350 360 100 intermediate
350 high
Southwest 240 250 240 120 165
Water Works Park
240 560 80 240 240
Total 1,720 2,456 1,250* 1,040 1,475
*Note: Operational capacity is determined by either construction, treatment or transmission constraints in a given month.

Product Plan Section 6
Page 98
DWSD should initiate actions in 2015 to achieve the optimized plant and pump station capacities by
the year 2020. This schedule is based on the completion dates of the 1958 filter rehabilitation project
at Springwells and the anticipated duration of new treatment process and production metering
projects at other plants. A description of the actions required at each plant and pump station is
presented below.
6.8.1 Lake Huron Treatment Substantial upgrades are planned in DWSD’s current CIP for FY2016 to FY2020. Ongoing construction
there could limit operational capacity. In the direct filtration mode of operation, all filters will be
required, but the rapid mix, flocculation and contact basins would be modified or eliminated from the
process. The piloting work for direct filtration is scheduled to start in 2025. Until that time, any
improvements for the rapid mix, flocculation, and contact basin should be made on the basis of a
service life of 10 years or less.
6.8.2 Lake Huron High Lift The existing firm capacity of the Lake Huron high lift pumping station is 420 MGD. Planning criteria
for this Master Plan Update have established firm capacity (largest unit out of service) as the basis for capacity measure. There are eight pumps rated at 60 MGD each. The future optimized firm capacity is
360 MGD. The reduction in firm capacity can be achieved by removing from service one pump when
the pump or motor require major repair.
6.8.3 Northeast Treatment This plant is proposed for repurposing; its high lift pumping and reservoir functions would continue
with finished water supplied from Water Works Park. A schedule and set of projects for repurposing
is presented later in this section. Repurposing can be achieved by 2020 or earlier. Between now and
the time of repurposing, the operating capacity of the Northeast WTP could be reduced to 225 MGD.
This reduction would be accomplished by a shut-down of one of the 4 parallel flocculation and
filtration process trains. As other prerequisite transmission projects for repurposing are completed,
the operating capacity at Northeast could be reduced to 150 MGD with a shut-down of two process
trains.
6.8.4 Northeast High Lift The existing firm capacity of the Northeast high lift pumping station is 556 MGD. Planning criteria for this Master Plan Update have established firm capacity (largest unit out of service) as the basis for capacity measure. There are twelve pumps rated at capacities of 49 to 52 MGD each. The future
optimized firm capacity is approximately 260 MGD. The reduction in firm capacity can be achieved by
removing from service up to six pumps when the pumps or motors require major repair.
6.8.5 Springwells Treatment Due to reconstruction of the 1958 filters, today’s operational capacity at Springwells is close to the
future optimized capacity. The reconstruction of the 1958 filters is scheduled to be completed by
2018. Some 1930 filters were rehabilitated during this project, and the 1930 filters were found to be
in good condition, or were cost-effectively reconstructed. Another review should be conducted in
2020 regarding the repurposing the Southwest plant. If the decision at that time is to maintain the
Southwest plant, then DWSD could replace additional 1930 filters and perform other upgrades at
Product Plan Section 6
Page 99
Springwells to reach a rated capacity of 360 MGD. If it is decided to repurpose the Southwest plant, then upgrades to Springwells would need a total capacity of 480 MGD. In this situation, a study should
be performed to determine the cost-effectiveness of a new 240 MGD plant at the Springwells location
to supplement the rehabilitated 1958 plant, relative to the cost of rehabilitating the 1930 plant.
6.8.6 Springwells High Lift The existing firm capacity of the Springwells high lift pumping station is 520 MGD. Planning criteria
for this Master Plan Update have established firm capacity (largest unit out of service) as the basis for capacity measure. There are eleven pumps: four with capacity of 40 MGD, one with a capacity of 50
MGD, and six with a capacity of 60 MGD. The future optimized firm capacity is approximately 350
MGD. The reduction in firm capacity can be achieved by removing from service three or four pumps
when the pumps or motors require major repair.
6.8.7 Springwells Intermediate Lift The existing firm capacity of the Springwells intermediate lift pumping station is 150 MGD. Planning
criteria for this Master Plan Update have established firm capacity (largest unit out of service) as the
basis for capacity measure. There are four pumps: three with capacity of 50 MGD and one with a
capacity of 60 MGD. The future optimized firm capacity is approximately 100 MGD. The reduction in
firm capacity can be achieved by removing from service one pump when the pump or motor requires
major repair.
Within the last few years, minimum nightly demand at the Springwells intermediate lift station has
dropped below the capacity of the smallest pump, and significant throttling of pumps is required at
night. New smaller pumps are required for minimum flows of approximately 20 MGD. Preliminary
analysis performed as part of this master plan indicates that two 20 MGD pumps could be installed
within the space of the one larger pump that is no longer needed. Alternatively, VFDs could be
considered on the existing pumps.
6.8.8 Southwest Treatment
The optimized future capacity for the Southwest water treatment plant is 120 MGD, or one-half of its
current rated capacity. The optimized capacity can be achieved by only scheduling new
improvements for two of the four parallel process trains. After review of the repurposing in 2020,
which would largely hinge on an updated forecast of new customers who seek to join the service area,
then two process trains could be shut down.
6.8.9 Southwest High Lift The existing firm capacity of the Southwest high lift pumping station is 250 MGD. Planning criteria for this Master Plan Update have established firm capacity (largest unit out of service) as the basis for capacity measure. There are seven pumps: four with capacity of 55 MGD, one with a capacity of 25
MGD, and two with a capacity of 30 MGD. The future optimized firm capacity is approximately 165
MGD. The reduction in firm capacity can be achieved by removing from service one 55 MGD pump
and one 30 MGD pump when the pumps or motors require major repair.
Product Plan Section 6
Page 100
6.8.10 Water Works Park Treatment The optimized future capacity for the Water Works Park water treatment plant is 240 MGD, which is
its current rated capacity. The optimized capacity can be achieved by eliminating the restrictions in
the transmission mains from the plant, and this is discussed later in the section on repurposing.
6.8.11 Water Works Park High Lift The existing firm capacity of the Water Works Park high lift pumping station is 560 MGD. Planning
criteria for this Master Plan Update have established firm capacity (largest unit out of service) as the
basis for capacity measure. There are eleven pumps: three with capacity of 80 MGD, four with a
capacity of 60 MGD, and four with a capacity of 40 MGD. The future optimized firm capacity is
approximately 280 MGD. The reduction in firm capacity can be achieved by removing from service the
three 80 MGD pumps and one of the 60 MGD pumps when the pumps or motors require major repair.
Within the last few years, minimum nightly demand at the Water Works Park high lift station pumping
has dropped below the capacity of the smallest pump, and significant throttling of pumps is required
at night. New pumping units are required for minimum flows of 20 to 60 MGD. Preliminary analysis
performed for this master plan indicates that two existing 40 MGD pumps could be replaced with two
20 MGD pumps and one variable frequency drive.
6.8.12 Summary of Plant and Pump Capacity Reduction The proposed capacity reduction program will reduce treatment plant capacity by approximately 700
MGD and high lift pumping capacity by approximately 1,000 MGD. DWSD will benefit in the short
term from reduced costs for preventive maintenance and potential for reduced electrical demand
charges, and in the long term from reduced capital improvement costs. Implementation of the
program for reducing plant capacity is expected to be carried out through a combination of funding
from: a) the O&M budget; b) Small Capital Projects funding; and c) new CIP projects to replacing
pumps at Water Works Park and Springwells to cost-effectively supply water during minimum
demand periods.
6.9 Program to Repurpose the Northeast Water Treatment Plant Changing the treatment and transmission system is complex and needs to be performed in a carefully
planned and sequenced approach.
The capital improvements required for repurposing the Northeast plant include the construction to
increase the capacity for finished water transmission main from Water Works Park to the Northeast
reservoir tanks. Also required is a change in valve positions at the North Service Center so that the
service area of the Lake Huron water treatment plant can be extended to the south. The capital
improvements and operational changes are described below.
6.9.1 Alternatives for Transmission from Water Works Park to the Northeast Plant
Three alternatives to convey finished water from Water Works Park the Northeast plant have been
identified. These alternatives vary in their transmission capacity and cost. This section describes the
alternatives outlines options, data collection underway, and a process to make a decision on one
alternative and start design first quarter of 2016.
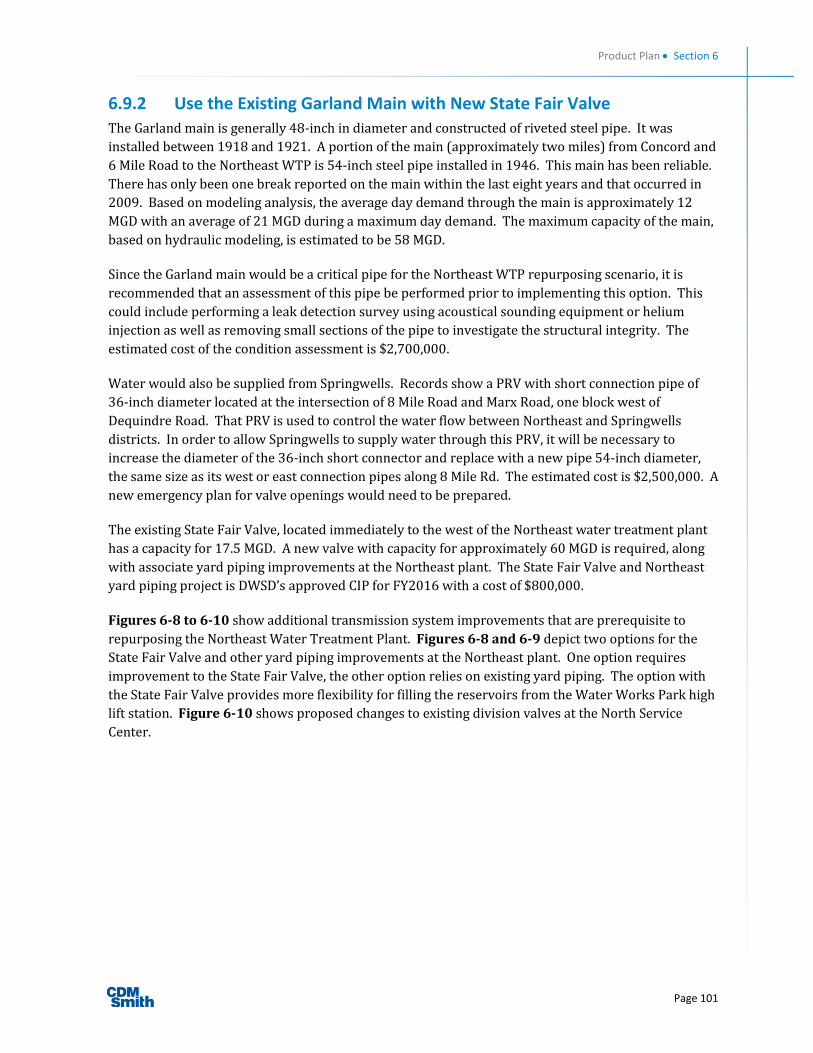
Product Plan Section 6
Page 101
6.9.2 Use the Existing Garland Main with New State Fair Valve
The Garland main is generally 48-inch in diameter and constructed of riveted steel pipe. It was
installed between 1918 and 1921. A portion of the main (approximately two miles) from Concord and
6 Mile Road to the Northeast WTP is 54-inch steel pipe installed in 1946. This main has been reliable.
There has only been one break reported on the main within the last eight years and that occurred in
2009. Based on modeling analysis, the average day demand through the main is approximately 12
MGD with an average of 21 MGD during a maximum day demand. The maximum capacity of the main,
based on hydraulic modeling, is estimated to be 58 MGD.
Since the Garland main would be a critical pipe for the Northeast WTP repurposing scenario, it is
recommended that an assessment of this pipe be performed prior to implementing this option. This
could include performing a leak detection survey using acoustical sounding equipment or helium
injection as well as removing small sections of the pipe to investigate the structural integrity. The
estimated cost of the condition assessment is $2,700,000.
Water would also be supplied from Springwells. Records show a PRV with short connection pipe of 36-inch diameter located at the intersection of 8 Mile Road and Marx Road, one block west of Dequindre Road. That PRV is used to control the water flow between Northeast and Springwells
districts. In order to allow Springwells to supply water through this PRV, it will be necessary to
increase the diameter of the 36-inch short connector and replace with a new pipe 54-inch diameter, the same size as its west or east connection pipes along 8 Mile Rd. The estimated cost is $2,500,000. A
new emergency plan for valve openings would need to be prepared.
The existing State Fair Valve, located immediately to the west of the Northeast water treatment plant
has a capacity for 17.5 MGD. A new valve with capacity for approximately 60 MGD is required, along
with associate yard piping improvements at the Northeast plant. The State Fair Valve and Northeast yard piping project is DWSD’s approved CIP for FY2016 with a cost of $800,000.
Figures 6-8 to 6-10 show additional transmission system improvements that are prerequisite to
repurposing the Northeast Water Treatment Plant. Figures 6-8 and 6-9 depict two options for the
State Fair Valve and other yard piping improvements at the Northeast plant. One option requires
improvement to the State Fair Valve, the other option relies on existing yard piping. The option with
the State Fair Valve provides more flexibility for filling the reservoirs from the Water Works Park high
lift station. Figure 6-10 shows proposed changes to existing division valves at the North Service
Center.

Product Plan Section 6
Page 102
Figure 6-8: Northeast WTP Treatment Closure Required Yard Piping Improvements, Option No. 1

Product Plan Section 6
Page 103
Figure 6-9: Northeast WTP Treatment Closure Required Yard Piping Improvements, Option No. 2
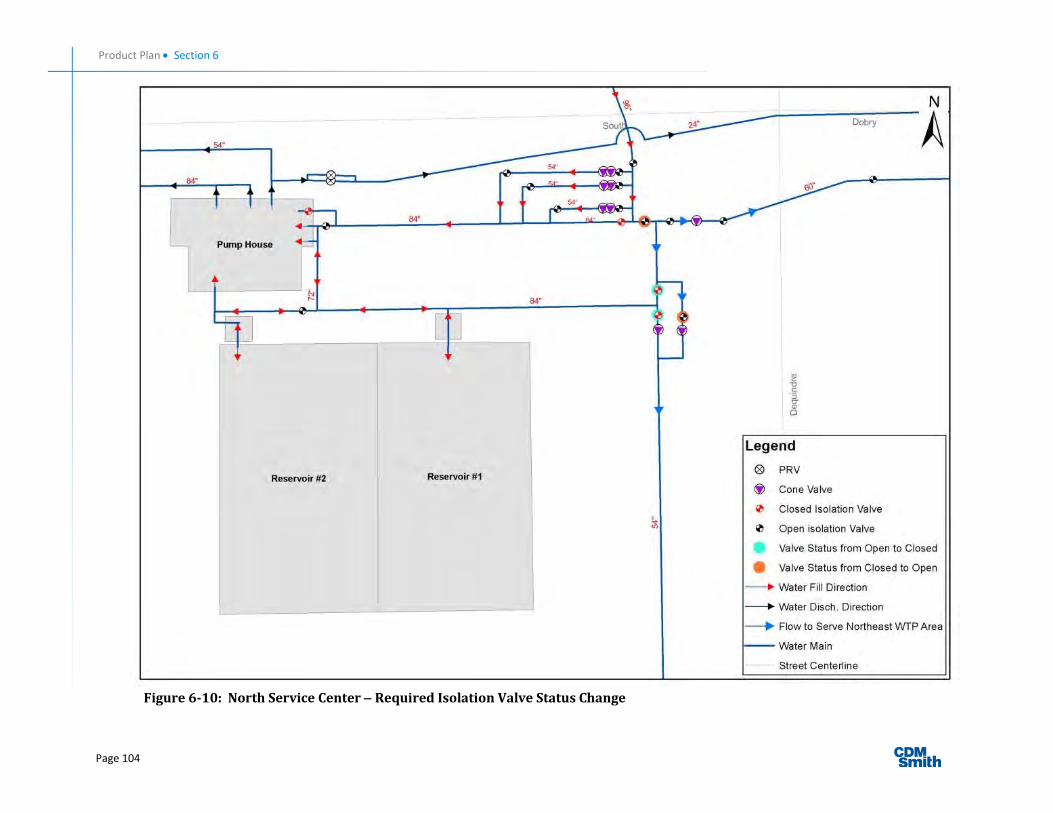
Product Plan Section 6
Page 104
Figure 6-10: North Service Center Required Isolation Valve Status Change
Product Plan Section 6
Page 105
Project WW-536, Yard Piping Improvements at Water Works Park would need to be completed, in
whole or in part, to allow 58 MGD to be conveyed to the Garland Main. The estimated cost for that project is $35,000,000. This project is discussed in more detail in Section 6.10.7. The total estimated
cost for this alternative is $41,000,000 and the capacity is 58 MGD, assuming that the condition
assessment shows that 58 MGD flow can be delivered reliably.
6.9.3 Rebuild Garland Main with New 60-inch Pipe This alternative is based on the possibility that the condition assessment of the Garland Main would
find the main in need of rehabilitation or replacement. Hydraulic modeling shows that a new 60-inch
main would have a capacity of approximately 80 MGD. The new main would be approximately 43,500
feet long and would follow the route of the existing Garland Main. The construction cost of this new
main is estimated to be $53,000,000.
The total estimated cost for this alternative includes the condition assessment and the State Fair Valve
replacement noted above, which yields a total of $56,500,000, and the capacity would be 80 MGD.
6.9.4 Construct New 84-Inch Main in the Existing Raw Water Tunnel This alternative provides for a larger main to be built by lining the existing raw water tunnel for the
Northeast plant.
The existing Northeast raw water tunnel was constructed in the early 1950’s. It was constructed as a
branch from the tunnel that connects Water Works Park to the Springwells plant. The Northeast raw
water tunnel has a finished interior diameter of 10-feet. It is constructed with a primary liner of circular concrete masonry units and a secondary liner of unreinforced concrete. In 1985, ground
subsidence on 7-Mile Road lead to an investigation and repairs to 250 to 500 feet of the tunnel with
new reinforced concrete.
The primary components of this alternative include:
1. Revision to the Water Works Park high lift station to optimize pumping capacity for conveying
finished water to Northeast. Revision may include replacement of select high lift pumping
units dedicated to this conveyance alternative if existing pumps cannot be modified to
accommodate new system curve envelope.
2. New 84-inch diameter pipe from the Water Works Park high lift station generally along
Pennsylvania Avenue to the existing junction chamber at Forest and Pennsylvania.
3. New 84-inch diameter liner pipe installed within the existing raw water tunnel from the
junction chamber to the Northeast low lift station.
4. New 84-inch diameter pipe through the yard of the Northeast plant from the low lift station to
the reservoirs.
5. New pressure sustaining valve system to maintain minimum of 35 psi in new finished water pipeline. [Further system analysis required to confirm.]
6. New connections to the Northeast reservoirs and addition of baffles in the reservoirs.
Product Plan Section 6
Page 106
7. This alternative would have capacity for approximately 150 MGD finished water transmission.
The finished water would be supplied to the Northeast reservoirs at a relatively even base
flow rate of 100 MGD and a minimum pressure of 35-psi in the direct bury portion of route.
Construction of this alternative is anticipated to be as follows:
1. Revision to the Water Works Park high lift station to optimize pumping capacity for conveying
finished water to Northeast would include new pumps, or possibly reconditioning of existing
suitable pumps from Water Works Park or another booster pump station, plus new pump
motors.
2. New 72-inch diameter pipe from the Water Works Park high lift station generally along
Pennsylvania Avenue to the existing junction chamber at Forest and Pennsylvania would
approximately 10,000 feet in length. It would be constructed by traditional cut and cover excavation, and either steel pipe or PCCP pipe would be used.
3. New 84-inch diameter liner pipe installed within the existing raw water tunnel from the
junction chamber to the Northeast low lift station would be approximately 26,800 feet in
length. The tunnel would be dewatered for construction of the new liner pipe. In 2015, a new
project has been started to inspect this tunnel and all other raw water tunnels and intakes.
Results from this inspection would be used to confirm the feasibility, construction techniques,
and cost estimate for this alternative. The new tunnel liner pipe would be installed through
two or more access shafts into the tunnel. The annular space between the new pipe and the
existing tunnel would be filled with grout.
4. New 72-inch diameter pipe through the low lift pump station and grounds of the Northeast plant from the low lift station to the reservoirs would be roughly 2,200 feet in length. It would
be constructed by traditional cut and cover excavation.
5. New pressure sustaining valve system within an existing building of the Northeast plant to
maintain minimum of 35 psi in new finished water pipeline. If a suitable building for this
application is not available along pipeline route a new building would be constructed.
6. DWSD is planning improvements within the Northeast reservoirs to improve water circulation
and avoid short-circuiting. Design of those improvements would be coordinated with the
design of the new 72-inch feed to the reservoirs.
Figure 6-11 shows a plan view of this alternative and Figure 6-12 shows a profile view. The
estimated construction cost of this alternative is $85,000,000, and the capacity is 150 MGD.
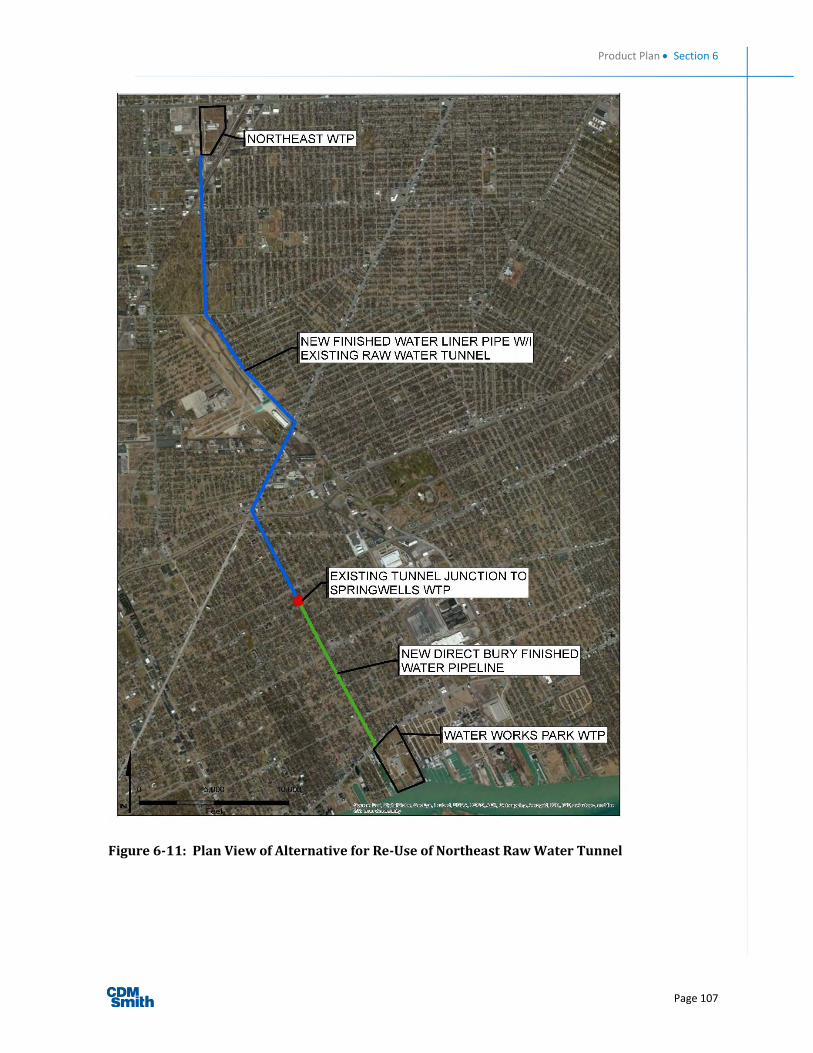
Product Plan Section 6
Page 107
Figure 6-11: Plan View of Alternative for Re-Use of Northeast Raw Water Tunnel

Product Plan Section 6
Page 108
Figure 6-12: Profile View of Re-Use of Northeast Raw Water Tunnel

Product Plan Section 6
Page 109
6.9.5 Comparison of Alternatives.
Table 6-9 presents a comparison of the alternatives.
Reuse of the existing Garland main is not seen as a long term alternative, given the age and diameter. The existing Garland main could be used for a short duration during construction of the tunnel reuse
alternative.
The advantages of the alternative for lining the tunnel relative to the replacement of the Garland Main
are as follows:
1. Re-use of the tunnel provides a higher capacity than re-use of the existing Garland Main
alternative.
2. In the emergency situation of a break on the 96-inch main near Romeo, when supply from
Lake Huron is cut-off, there would be sufficient water supply from Water Works Park to serve
average day demands for all customers south of Romeo.
3. The previously designed Yard Piping and metering project for Water Works Park could be
reduced in scope. The Venturi meters at the Northeast plant are being rehabilitated, so those
meters can be used for the 150 MGD of finished water from Water Works Park. Additional
meters at Water Works would only need 90 to 120 MGD capacity. Also, fewer new
transmission mains in the Water Works Park yard would need to be replaced.
4. The future cost of upgrades to the Water Works Park high lift station would be reduced,
because 150 MGD capacity would be devoted to supplying Northeast at a relatively low
pressure, while 90 MGD to 120 MGD capacity would be devoted to the Water Works Park City
of Detroit service area.
5. The alternatives provide a range of transmission capacity from 50 MGD to 150 MGD. A
capacity greater than 150 MGD is not feasible because 90 MGD of the Water Works Park plant
capacity is required for maximum day in the plant’s current service area.
The 150 MGD capacity alternative has the following advantages:
a. It is less costly to pump finished water from Water Works Park than from Lake Huron due
to the shorter distance, a lower static head, and the need for Lake Huron to use seasonal
intermediate pumping at Imlay City. On an annual average basis, the cost to pump from
Lake Huron is approximately $117/million gallons, while the cost to pump from Water Works Park is approximately $40/million gallons.
b. The estimated annual cost savings to pump 100 MGD from Water Works Park instead of Lake Huron is approximately $ 3 million. Due to this cost savings, the payback period is
less than 12 years for the additional cost to install a pipeline and pumping for 150 MGD
relative to the cost to install a system for 60 MGD.

Product Plan Section 6
Page 110
c. With 150 MGD transmission capacity from Water Works Park to the Northeast High Lift
Station, the following emergency capacity will exist:
Capacity to supply Oakland, Macomb, and Lapeer County customers with average day
demand if there is break on the 120-inch main
Capacity to supply Oakland and Macomb customers with average day demand if there
is a break on the 96-inch main.”
Table 6-9: Comparison of Alternatives for Transmission from WWP to Northeast
Alternative Capacity Requirements
Water Works Park Yard Piping Project
Estimated Construction Cost
$/MGD Capacity to Supply Northeast High Lift
Use Existing 48-inch Garland Main
58 Condition Assessment,
Improvement to State Fair Valve
Required $41,000,000 $0.71/MGD
Rebuild Garland Main with New 60-inch pipe
80 Condition Assessment, Improvement to State Fair Valve
Required $56,500,000 $0.71/MGD
Build new 72 to 84-inch main within existing Northeast raw water tunnel
150 Condition assessment of Garland main and raw water tunnel;
Improvement to State Fair Valve (required for the short-term use of the Garland main during construction in the raw water tunnel)
Partial required
$85,000,000 $0.57/MGD
6.9.6 Feasibility of Using the Existing Garland Main Prior to Condition Assessment
Then feasibility of decommissioning the Northeast Plant immediately and relying on the existing
Garland Main to supply finished water from Water Works Park treatment plant to the Northeast high
lift pumping station was considered. The advantage of this approach would be an immediate savings
in operation and maintenance costs, as well as savings in Small Capital Program capital costs to keep
equipment working at the Northeast plant over the short term. Annual savings could be $3,000,000 to
$5,000,000 annually. In order to use the existing Garland Main, the new State Fair valve project would
need to be designed and constructed at an estimated cost of $875,000. Also, some portion of the
previously designed Water Works Park Yard Piping Project may need to be constructed. Therefore, it
would take at least 18 months to complete that work.
There are risks to immediately decommissioning the Northeast plant, prior to completing a new
finished water transmission pipeline from Water Works Park to Northeast. The risks are due to the

Product Plan Section 6
Page 111
unknown condition of the existing Garland main, and the limited number of isolation valves on the 96-inch main, as described below. The capacity of the existing Garland Main is estimated to be
approximately 60 MGD. However, the main has not been tested at this flow rate and pressure for many years. Currently, the Northeast plant provides an average of 100 MGD water supply to its
service area. Therefore, the Lake Huron plant could provide approximately 50 MGD and the Water Works Park plant could provide approximately 50 MGD for average daily demand. In the summer, more water would need to be supplied from the Lake Huron plant.
The existing service area of the Northeast plant would be highly dependent on the reliability of both
the Garland Main and the 96-inch Main. The 96-inch Main experienced a leak on an air valve in March
2015. The repair was temporary and difficult due to the limited number of isolation gates on this
main. (Recommendations for 5 additional isolation gates are present in Section 7.10, and
recommendations for condition assessment of transmission mains are presented in Section 7.11).
Due to the age and unknown condition of the Garland Main, plus the recent leak on the 96-inch Main
and the known difficulty of repairing that main, it is likely that one or the other main could have a
service disruption of 1 to 2 weeks within the next few years. A shut down of either main for 1 or 2
weeks would require water use restrictions and potentially a boil water advisory for up to 1 million
people. With a water main shut down, the inconvenience to the public, economic hardship on
businesses, and public health risks for customers for even 1 week could, if quantified, exceed the
annual savings that would result from an early decommissioning of the plant.
The proposed 42-month schedule for condition assessment, installation of new isolation gates on the
96-inch main, fast track construction of a new 84-inch main in the Northeast raw water tunnel, pump
rehabilitation at Water Works Park high lift station, coupled with an immediate down-sizing of treatment operations at the Northeast plant provides a sequence of construction that minimizes risk,
increases long term benefits, and reduces short term treatment costs.
6.9.7 Modifications to the Water Works Park High Lift Station This project will replace or recondition pumps number 2, 3, 4 and 5 so that each new unit can pump 50
MGD to the Northeast plant. Firm capacity would be 150 MGD. This project will also replace pumps
number 11 and 12 with two new 20 MGD pumps for low demand periods at night. One pump would be
equipped with a VFD. All pump replacements, or pump reconditioning, can be accomplished with minimal changes to existing piping and pump and motor structural bases. All pumps would operate at lower speeds
than the existing pumps, and new motors would be provided.
Figure 6-13 shows a conceptual system head curve for the new pipeline to Northeast that was used to
estimate the configuration and capacity of the new 50 MGD pumps. Figure 6-14 shows a proposed layout of the new pumps.
6.9.8 Ongoing Investigation of the Raw Water Tunnel
DWSD has initiated work on the inspection of water intakes and tunnels under project CS-1623. The
inspection of the Northeast raw water tunnel is expected to be complete by the end of 2015. This
work is expected to confirm the feasibility and constructability of building a new transmission main in
the tunnel.
The Garland Main condition assessment should be performed concurrently during 2015.

Product Plan Section 6
Page 112
By the first quarter of 2016, there would be enough condition information available to make a
decision on which alternative to choose. At that time, DWSD should begin design for the selected
project.
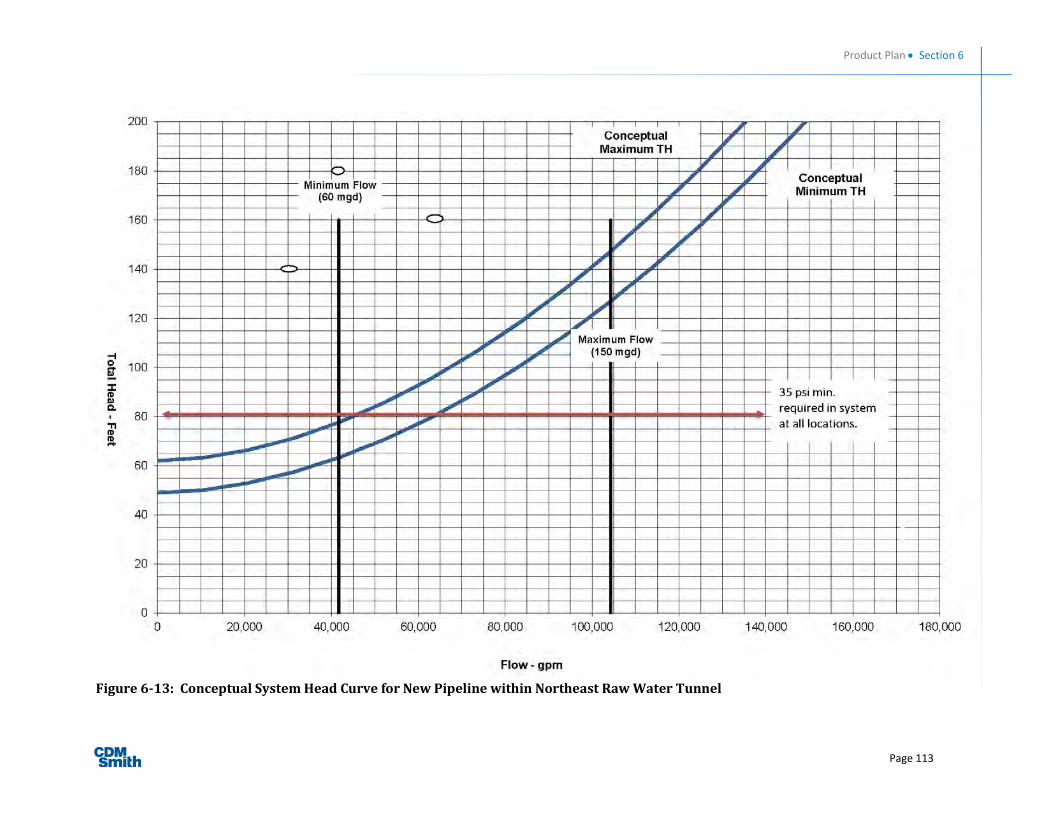
Product Plan Section 6
Page 113
Figure 6-13: Conceptual System Head Curve for New Pipeline within Northeast Raw Water Tunnel

Product Plan Section 6
Page 114
Figure 6-14: Concept for High Lift Pump Modifications at Water Works Park

Product Plan Section 6
Page 115
6.9.9 Water Works Park Yard Piping
Project WW-536 was designed in 2009 and DWSD received bids in March 2011. This is a multi-faceted project to improve transmission mains within the Water Works Park yard to make
improvements to drainage, roadways, electrical, distribution, water metering, and to the Belle Isle
intake.
There were 11 bids received ranging from approximately $31 million to $49 million. Six bids were in
excess of $40 million. DWSD currently plans to review the design, some of which is over 8 years old.
This master plan recommends that the review have the following objectives:
1. Review number and location of new transmission mains from the site. The original design
provided for water transmission to the historic service area of Water Works Park, but the
current and projected demands in the Downtown are lower than in previous decades. Most water will be conveyed to the Northeast plant, which will simplify the improvements within
the yard for transmission to the Downtown.
2. Review the production metering design. DWSD will soon begin a contract for Venturi meter rehabilitation at Northeast, Springwells, and Southwest. The new meters at the Northeast
plant will measure the finished water supplied from Water Works Park. New or refurbished
metering at the Water Works Park plant should consider whether the full plant flow should be
measured, or just the flow not measured at the Northeast plant.
3. Re-prioritize work unrelated to water transmission and metering. Much of this work could be
postponed for several years.
The cost estimates for the Garland Main Replacement and the reuse of the Northeast raw water tunnel
reuse already include the cost of new transmission from the WWP high lift station to the NE
reservoirs, so WW-536 is not required to implement either of those alternatives.
6.9.10 Additional Design Considerations The series of projects described in Sections 6.9.1 to 6.9.9 should be developed further through
advanced planning, or concurrently coordinated to the 30-percent design stage. Coordination of the
project designs through 30-percent will allow for optimization and value engineering that will provide
the most cost-effective and implementable construction projects.
Discussions with DWSD engineering staff late in the master planning process identified these
considerations and clarifications for design:
CIP Projects in TM-17 for the Northeast reservoir inlet outlet and outlet piping separation and
baffle project needs to be constructed with the repurposing program improvement. Also, the
PRV at Marx Street and 8-Mile Road needs inspection and testing, and a short reach of its
adjoining main needs an increase in diameter from 36-inches to 54-inches.
Final design of the pipeline with discharge to the reservoirs at Northeast should consider reservoir fill time, and end of pipe pressure control as the pipeline enters the reservoir.
Product Plan Section 6
Page 116
There is significant pipe capacity in place in the corridor from Water Works Park to Northeast. While cost estimates for the master plan have allowed for a new 72-inch to 84-inch main,
equivalent capacity could be achieved with a combination of the 48-inch Garland Main plus an
additional 42-inch main in the area.
Route options for use of the Northeast raw water tunnel versus open cut excavation from Forest
and Pennsylvania to Northeast should be fully explored. Recent tunnel investigation shows the
need for some tunnel repair. Also, given the 10-foot diameter, a significant volume of grout is
needed, which adds to the cost of the tunnel route. At the same, use of the tunnel is faster, requires fewer utility relocations and easements, and avoids the cost of abandoning the tunnel
(estimated to be up to $500 per foot, or $10 million).
Isolation valves for the 96-inch main, are urgently needed. These will be costly, and may need
to be phased with the relocation of the 96-inch main in project WS-622 at 24-Mile and
Dequinder. Therefore the proposed 20-year CIP shows 2 phases of the isolation valve project.
First phase to install at least 2 more valves, second phase to add up to 3, for a total of 5.
Springwells raw water tunnel repair should proceed over the next 5 years, but it is not deemed
necessary to complete this ahead of the repurposing project.
The alternative for constructing a second transmission main from the Lake Huron WTP was
considered in the Phase 1 portion of this master plan update, but it was not carried forward for further evaluation in Phase 2. A modified concept of a second feed from Lake Huron was discussed
with DWSD engineering staff. The modified concept would include a new transmission main generally
parallel to US-94 from the Lake Huron WTP to 24-Mile Road in Chesterfield. This modified concept would create a new transmission loop north of 24-Mile Road, and would rely on existing transmission
loops south of 24-Mile Road. The new transmission main parallel to US-94 would be an alternative to
building a new transmission main from Water Works Park to the Northeast WTP.
Further evaluation of this new alternative should consider the following advantages and
disadvantages:
Advantages: The second feed would provide redundancy to the Lake Huron plant supplying the
communities in Oakland and Macomb Counties, and it could eliminate the need for a future
expansion of the Rochester pump station. Furthermore, the second feed would allow for the re-routing of the 96-inch main that is currently under a landfill and an opportunity to reduce the
number of new isolation valves on the 96-inch main. The construction of a new 6-mile
transmission main from Water Work Park to Northeast would also not be required. Depending
on the results of a condition assessment study, rehabilitation of the Garland Main early in the
planning period may not be required.
Disadvantages: Extensive planning, design, and easement acquisition would be required for a
new 40 mile transmission main. There is a potential need for the proposed Chesterfield pump
station to boost pressure from the new main, so the new main would not necessarily eliminate
the proposed pumping station. There is a higher annual cost for pumping finished water approximately 60 miles from Lake Huron WTP versus 6 miles from Water Works Park WTP,
however the pumping strategy, including a potential reduced reliance on the Imlay City booster
Product Plan Section 6
Page 117
station, may reduce the cost differential. The Water Works Park plant would continue to
operate below its rated capacity due to limited demand in its service area.
6.9.11 Treatment Decommissioning Two events in the operating history of the Northeast WTP provide background for a decommissioning
plan.
1. During the early 1970’s when total summer system flow often exceeded one billion gallons
per day, finished water from Water Works Park was directed to the reservoirs at Northeast on
a regular basis. After improvements were made to Northeast, including the addition of the
third raw water conduit from the low lift to the filter building, the regular practice of filling the
reservoirs from Water Works Park was discontinued.
2. In 1985, the Northeast plant was temporarily shut-down to repair a reach of the raw water
tunnel near Outer Drive and Greiner Street, approximately one mile south of the plant. The
shutdown lasted approximately six months, and the plant was operated as a booster station.
Drinking water was supplied to the high lift from Water Works Park through the State Fair valve just south of the plant perimeter and the Lake Huron Water Plant through the reservoir fill valve on the north boundary of the plant.
The temporary shut-down in 1985 provides a basis for a future decommissioning plan for the
Northeast WTP.
One or more workshops should be held with DWSD personnel to review the decommissioning plan.
Additional studies may be needed to confirm certain aspects. After transmission improvements are
made, these should be fully tested under summer and non-summer demand conditions.
Prior to decommissioning, the transmission improvements described earlier need to be completed.
Once the transmission improvements are complete, the sequence of steps within the Northeast water treatment plant would be as follows:
1. The optimum time frame to initiate the process would be after the peak summer flows. In
general that would be after September 15th.
2. The new State Fair valve must be fully operational and Water Works Park must have the ability
to deliver the required supply of water. Both of these capabilities need to be tested prior to
beginning the decommissioning.
3. Depending on how the Northeast yard piping improvements are made, it may be necessary for the Lake Huron Water Plant Fill Valve to be exercised to verify it is operational.
4. Coordination with all the plants and System Control is essential. There will be a reversal of the
usual flow of water in parts of the system. This will probably require additional valve
positioning at Water Works Park and the suburbs north of Northeast.
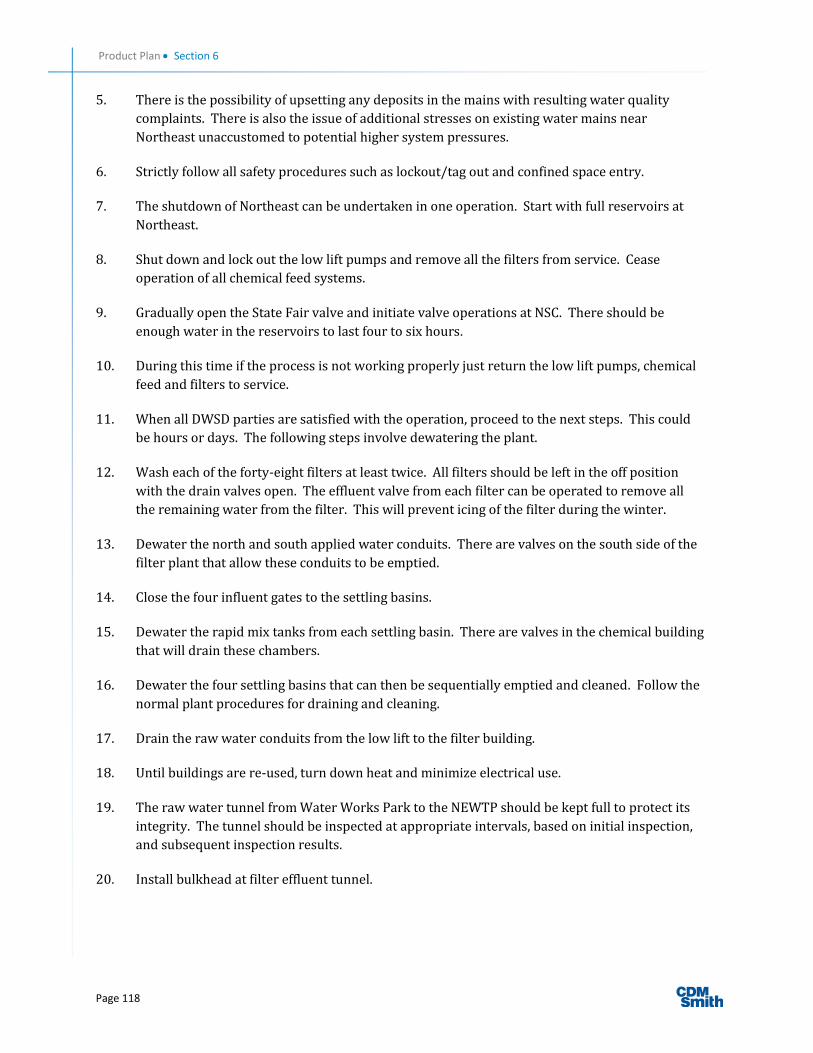
Product Plan Section 6
Page 118
5. There is the possibility of upsetting any deposits in the mains with resulting water quality
complaints. There is also the issue of additional stresses on existing water mains near Northeast unaccustomed to potential higher system pressures.
6. Strictly follow all safety procedures such as lockout/tag out and confined space entry.
7. The shutdown of Northeast can be undertaken in one operation. Start with full reservoirs at
Northeast.
8. Shut down and lock out the low lift pumps and remove all the filters from service. Cease
operation of all chemical feed systems.
9. Gradually open the State Fair valve and initiate valve operations at NSC. There should be
enough water in the reservoirs to last four to six hours.
10. During this time if the process is not working properly just return the low lift pumps, chemical
feed and filters to service.
11. When all DWSD parties are satisfied with the operation, proceed to the next steps. This could
be hours or days. The following steps involve dewatering the plant.
12. Wash each of the forty-eight filters at least twice. All filters should be left in the off position
with the drain valves open. The effluent valve from each filter can be operated to remove all the remaining water from the filter. This will prevent icing of the filter during the winter.
13. Dewater the north and south applied water conduits. There are valves on the south side of the
filter plant that allow these conduits to be emptied.
14. Close the four influent gates to the settling basins.
15. Dewater the rapid mix tanks from each settling basin. There are valves in the chemical building
that will drain these chambers.
16. Dewater the four settling basins that can then be sequentially emptied and cleaned. Follow the
normal plant procedures for draining and cleaning.
17. Drain the raw water conduits from the low lift to the filter building.
18. Until buildings are re-used, turn down heat and minimize electrical use.
19. The raw water tunnel from Water Works Park to the NEWTP should be kept full to protect its
integrity. The tunnel should be inspected at appropriate intervals, based on initial inspection,
and subsequent inspection results.
20. Install bulkhead at filter effluent tunnel.

Product Plan Section 6
Page 119
6.10 Program for Regulatory Compliance The program for regulatory compliance includes regulatory driven projects from the needs
assessment in TM-13, the goals of Chapter 5, plus the change to direct filtration for Lake Huron, as
discussed in TM-10.
There are 12 projects in the preliminary CIP driven by regulatory compliance objectives, and this
work spans the whole planning period.
6.10.1 Chlorine Conversion A major potential regulatory compliance project is conversion from chlorine gas as disinfectant. This
section discusses the status of chlorine gas conversion in the United States and a conceptual basis of design for future chlorine conversion for DWSD.
6.10.1.1 Status of Chlorine Gas Conversion in the United States
Nationwide, the Department of Homeland Security (DHS) is advocating for inherently safer technologies and potentially requiring water/wastewater utilities to eliminate chlorine gas. Many
plant operators prefer the simplicity and lower cost of chlorine gas for disinfection. The following is a
snapshot in 2015 regarding the status of chlorine conversion. In general, larger water utilities in the
midwest and northeast have not convert from chlorine gas.
West: Most water plants in California have converted from chlorine gas following a statewide
initiative in the early 1990’s. Denver completed chlorine conversion. The Trinity River Water
Authority serving Dallas and Ft Worth has performed planning for conversion from chlorine gas.
Southeast: Many plants in the Southeast have converted from chlorine gas to sodium hypochlorite, or on-site generation. Construction to convert from chlorine gas is underway in Knoxville, Tennessee.
New Orleans and Charlotte, North Carolina have not yet converted.
Midwest: Many small to mid-size water plants in the Midwest near schools, parks, etc. have made the
conversion to sodium hypochlorite. Indianapolis has converted its four water treatment plants.
Among major cities that have not converted from chlorine gas are: Chicago, Evanston, IL, Fort Wayne,
IN, Hammond, IN, and Minneapolis.
Northeast: Most water suppliers in New England have converted to sodium hypochlorite. Hartford,
CT has converted one plant and continues to use chlorine gas at another. Larger New England cities
that have not converted are Providence, RI, Springfield, MA, and Worcester, MA. New York City has
not converted from chlorine gas.
6.10.1.2 Concept Design for On Site Generation of Sodium Hypochlorite
A preliminary concept design for chlorine conversion for DWSD was developed around on-site
generation of sodium hypochlorite.
Salt in the form of brine would be purchased and stored at each plant. There would be two or three
brine tanks per facility, and each would be 12-feet diameter and 26-feet tall. Brine storage on site
would need to be sufficient to meet requirements for 30 days of chemical storage for average day
production.

Product Plan Section 6
Page 120
Reactors to generate sodium hypochlorite are as large as 2,000 pounds per day. Up to four reactors
would be needed per plant, including an allowance for one reactor out of service. Sizing of reactors
was based on an average 2 mg/L chlorine dose. Electrical costs are estimated at 1.8 Kw-hours per pound of chlorine.
Storage of liquid sodium hypochlorite on site would be in tanks of similar size to the brine tanks.
Ancillary equipment would include pumps, chillers, heaters, containment dikes, instrumentation and
control.
Concept level cost estimates for installations at all four plants are as follows:
Construction cost……………………………………………………………………………. $50,000,000
Annual costs for brine, electricity, operation and maintenance…………. $5,500,000
6.11 Program for Renewal, Reliability and Energy Management The program for treatment plant renewal, reliability and energy management includes the
replacement and upgrade of equipment for service life or process improvement and operational
efficiency.
There are approximately 74 projects in the preliminary CIP under this program. The scope and
schedule of these projects should be refined through asset management evaluations.


