WATER OPERATION AND MAINTENANCE BULLETIN No. 198 December 2001 IN THIS ISSUE. . . • Liquefaction Mitigation of a Silty Dam Foundation Using Vibro-Stone Columns and Drainage Wicks: A Case History at Salmon Lake Dam • Wire Rope Protection at Altus Dam • Reclamation Develops New Generator Safety Device UNITED STATES DEPARTMENT OF THE INTERIOR Bureau of Reclamation Available on the Internet at: http://www.usbr.gov/infrastr/waterbull
Transcript
W A T E R O P E R A T I O N
A N D M A I N T E N A N C E
B U L L E T I N
No. 198 December 2001
I N T H I S I S S U E . . .
• Liquefaction Mitigation of a Silty Dam Foundation Using Vibro-Stone Columns and Drainage Wicks: A Case History at Salmon Lake Dam
• Wire Rope Protection at Altus Dam
• Reclamation Develops New Generator Safety Device
UNITED STATES DEPARTMENT OF THE INTERIOR Bureau of Reclamation
Available on the Internet at: http://www.usbr.gov/infrastr/waterbull
For further information about the Water Operation andMaintenance Bulletin or to receive a copy of the index, contact:
Jerry Fischer, Managing EditorBureau of Reclamation
Inspections and Emergency Management GroupCode D-8470
PO Box 25007, Denver, Colorado 80225-0007Telephone: (303) 445-2748
This Water Operation and Maintenance Bulletin is published quarterly for the benefitof water supply system operators. Its principal purpose is to serve as a medium toexchange information for use by Bureau of Reclamation personnel and water usergroups in operating and maintaining project facilities.
The Water Operation and Maintenance Bulletin and subject index may be accessed onthe Internet at: http://www.usbr.gov/infrastr/waterbull
Although every attempt is made to ensure high quality and accurate information, theBureau of Reclamation cannot warrant nor be responsible for the use or misuse ofinformation that is furnished in this bulletin.
Cover photograph: Operation of rotor turning gear. The rim of thegenerator rotor is overhead.
Any information contained in this bulletin regarding commercial products may not beused for advertisement or promotional purposes and is not to be construed as an
endorsement of any product or firm by the Bureau of Reclamation.
UNITED STATES DEPARTMENT OF THE INTERIOR Bureau of Reclamation
WATER OPERATION AND MAINTENANCE BULLETINNo. 198—December 2001
CONTENTS
Page
Liquefaction Mitigation of a Silty Dam Foundation Using Vibro-Stone Columns and Drainage Wicks: A Case History at Salmon Lake Dam . . . . . . . . . . . . . . . . . . . . . . . . 1Wire Rope Protection at Altus Dam . . . . . . . . . . . . . . . . . . . . . . . . . . . . . . . . . . . . . . . . . . . 17Reclamation Develops New Generator Safety Device . . . . . . . . . . . . . . . . . . . . . . . . . . . . . 19
Available on the Internet at: http://www.usbr.gov/infrastr/waterbull
Water Operation and Maintenance Bulletin 1
1 Geotechnical Engineers, Bureau of Reclamation, Denver, Colorado.2 Project Manager, Hayward Baker, Santa Paula, California.3 Principal, URS Corporation, Oakland, California.
LIQUEFACTION MITIGATION OF A SILTY DAM FOUNDATION USING VIBRO-STONE COLUMNS AND DRAINAGE WICKS:
A CASE HISTORY AT SALMON LAKE DAM
by Ron Luehring1, Nathan Snorteland1, Mike Stevens2, Lelio Mejia3
Abstract
The use of stone columns, in combination with drainage wicks, can effectively mitigatethe liquefaction potential of silty soils. This paper presents the results of using over1,000 3.0- to 3.75-foot-diameter dry bottom-feed vibro-stone columns constructed in upto 60 feet of interbedded fluvial-lacustrine sandy and silty foundation materialsbeneath Salmon Lake Dam in north-central Washington. Standard Penetration Tests(SPTs) and Cone Penetrometer Tests (CPTs) were used for site characterization beforeand after stone column construction. Liquefaction potential was determined bycomparing measured values of penetration resistance to values required to resistliquefaction under the maximum credible earthquake (MCE). State-of-the-practicedata conversions were used to perform the liquefaction analysis on the basis of cleansand equivalent blowcounts. Post-construction site characterization indicates:(1) drainage (air and pore pressure relief) is provided by stone columns and drainagewicks during construction, (2) foundation treatment meeting Bureau of Reclamation(Reclamation) design objectives is achieved by soil densification between the columns,and (3) liquefaction can be mitigated using stone column treatment with measurabledensity increases, even in fine-grained silty soils. Key discussion is provided based onobservations related to the effect of nonplastic fines on liquefaction mitigation,foundation pore pressure response during construction, and influences of sequencingduring stone column construction. (Note: This article is printed as a followup to theoriginal article printed in the December 1998 bulletin, No. 186).
Background
Salmon Lake Dam is situated on a tributary of Salmon Creek about 15 miles northwest ofOkanogan in north-central Washington and immediately upstream of the town of Conconully(figure 1). Completed in 1921, the dam consists of a 30-foot-high zoned earthfill embank-ment with a crest length of 1,260 feet and a combined spillway/outlet works structure.
2 Water Operation and Maintenance Bulletin
Figure 1.—Location/vicinity map.
The dam foundation consists ofQuaternary fluvio-lacustrinesediments under most of theembankment to depths of up to297 feet. These sediments aregenerally cohesionless, inter-bedded to laminated silty sand,with interbeds and lenses of siltwith sand, sandy silt, poorlygraded sand, and silty sand withgravel.
Analysis of the earthquakecatalog led to the determinationof a maximum credibleearthquake (MCE) of ML 6.5for a random event at a distanceof 29 kilometers [1]. Themaximum peak horizontalbedrock acceleration for thissource was estimated to be 0.26 g[2]. This MCE can produce highexcess pore pressures and loss ofshear strength in foundationlayers susceptible to liquefaction.Significant foundation sitecharacterization (SPT, CPT,Becker Penetration Tests, andCrosshole Shearwave Tests) wascompleted for the CorrectiveAction Studies (CAS).N1(60)m/N1(60)r ratios were
computed for various earthquakes. Triggering analyses (ratios less than 1.0 to 1.2) indicatedwidespread distribution of potentially liquefiable foundation materials.
Structural Modifications
A comparison of liquefaction mitigation alternatives was made during the CAS design phaseof investigations and the selection of a preferred design alternative [2]. Alternatives werereviewed and checked by Woodward-Clyde Consultants and independently compared toother alternatives during a Safety of Dams Value Engineering Review [3].
Nonstructural modification alternatives included a permanent reservoir restriction and/or thepotential use of an early warning system. Of the 10 structural Safety of Dams (SOD)modifications investigated, the use of vibro-stone columns ($3.8 million) was selected as
the preferred alternative and ranked higher than dynamic compaction ($5.2 million) andexcavate and replace ($5.9 million) methods. Factors influencing the selection of thepreferred alternative included: foundation stratigraphy (sandy silt, silty sand, and silts withtreatment depths to 60 feet), groundwater levels within 3 feet below original ground, dewatering requirements, a confined construction area, a limited area for excavation, andresident encroachment immediately downstream of the dam toe.
In addition to treating the foundation using the dry bottom-feed vibro-stone columns methodof construction, the structural SOD modification included a 29-foot-high buttress and a19-foot-high stability berm "sandwiching" a two-stage filter and toe drain system on thedownstream excavated slope (figure 2). The downstream buttress was constructed to addressupstream slope stability.
The effectiveness or degree of densification resulting from the installation of vibro-stonecolumn systems is a function of soil type, silt and clay content, soil plasticity, pre-treatmentsoil density, vibrator type, volume of the stone, spacing between stone columns, andsequencing of stone column construction. The use of vibro-stone columns as a liquefactionmitigation alternative has several benefits (i.e., the vibrations created by the dry bottom feeddisplacement method densifies cohesionless sands and silty sands, added stone improvesdrainage characteristics of the treated soil for pore pressure release, and the stone columncreates a reinforcing element that results in reducing cyclic shear stress in the weakersurrounding soils) [4]. Energy created by this method is confined to depths and locations oftreatment and, thus, does not affect adjacent residences as other methods may.
Acknowledging the limits of the vibro-stone column equipment to densify silty soils,Reclamation recognized the need to test the equipment to ensure treatment capability withinthe gradational envelope of the foundation.
4 Water Operation and Maintenance Bulletin
Figure 3.—Designed and as-built stone column layouts and sequence comparisons.
A test section was constructed in July 1997 to investigate the effectiveness of vibro-stonecolumns as a ground-improvement method in the heterogeneous silty to silty sand foundationand to help optimize stone column treatment (i.e., diameter, spacing, sequence) design bycomparing pre- and post-test section foundation strengths (i.e., SPTs and CPTs) [4]. Beforethe SOD modification, additional verification testing was performed in the test section toevaluate the potential for strength increase over time (aging). Analysis of aging data isongoing and incomplete at the time of this paper.
Wick drains were installed on 3- or 6-foot spacings (depending on the row) to full stonecolumn depth and extended about 6 inches above the working surface. The SOD constructedfoundation treatment configuration consisted of six rows of 3.75- and 3.0-foot-diameter stonecolumns constructed on 6-foot centers in six rows, forming equilateral triangles with a row-to-row spacing of about 5.2 feet (normal to the dam’s centerline, as shown in figure 3). Thetwo rows of stone columns furthest upstream and downstream were constructed at 3.75-foot-diameter and the interior two rows at 3.0-foot diameter. Between stations 11+50 and 13+00,all stone columns constructed were 3.75-foot diameter to account for a perceived finer-grained foundation in this area. The target design depth for construction of all stone columnswas between 58 and 61 feet.
During construction of the first row of columns at the toe of the embankment, air wasobserved exiting through a crack on the downstream slope of the dam about 10 feet verticallyabove the downstream excavated toe, and a small "water spout" was seen flowing on theslope adjacent to where a closure column was being constructed nearest the toe. Thecontractor was required to cease construction, and the entire pattern was relocated down-stream about 5 feet. This change provided a row of wick drains upstream of the first stonecolumn row. The first row of stone columns was constructed in its entirety parallel to thecenterline of the dam and excavation cut slope to create a "wall" of columns to reinforce the
Water Operation and Maintenance Bulletin 5
cut slope, protect the dam embankment, and alleviate excess pore pressure buildup. No porepressure relief expressions were subsequently observed. A total of 1,020 stone columns(44,000 lineal feet of 3.75-foot-diameter stone columns and 16,800 lineal feet of 3.0-foot-diameter stone columns) were constructed by the specialty subcontractor, Hayward-Baker,Inc., requiring about 16,900 cubic yards of crushed stone.
Stone columns could not be constructed to the full design depth in some areas of thefoundation. The largest area was about 50 feet long near the left end of treatment. Thedepth of treatment was limited by the nearby presence of bedrock and dense soils in thefoundation as well as installation sequencing issues. Verification testing in the left abutmentarea indicated adequate treatment despite the inability to achieve the design depths. SPTblowcounts approaching or exceeding refusal and CPT tip resistance exceeding 300 tsf atdepth reflect the presence of dense soils and influences of bedrock in the foundation near theleft abutment.
Site Characterization (Pre- and Post-Construction)
Over the past 8 years, the foundation/embankment explorations of Salmon Lake Dam haveprogressed from a general geologic and materials investigation to a site-specific characteriza-tion geared towards quantitatively evaluating liquefaction triggering.
Two methods, SPT and CPT, were selected to provide site characterization before and aftersite remediation since both are considered reliable for sandy and low-plasticity silty soils. These methods are considered the most cost efficient and technically viable tools to provideinformation necessary to assess liquefaction "triggering" [5, 6, 7, 8].
Before foundation treatment, 11 SPT borings (2 SPT borings in the two test sections and9 SPT borings distributed across the downstream toe) were used to characterize the site todepths approaching 70 feet.
Because of a CPT's ability to achieve a nearly continuous record of penetration resistancewith documented repeatability in a very short time and low expense, they were used to supplement the SPTs site characterization. Forty CPT soundings (3 CPT soundings in eachof the two test sections and 34 CPT soundings distributed across the downstream toe) wereperformed before treatment.
Because of the silty nature of the foundation soils, verification testing to characterizefoundation improvement after stone column construction of "designated treated areas" wasconducted a minimum of 2 weeks after the construction of the last stone columns at each sitein an effort to allow pore pressures to dissipate before testing. Verification testing included17 SPT borings and 93 CPT soundings (18 post-test section CPT soundings, 12 CPTsoundings investigating the "aging" affect before construction, and 63 post-constructionsoundings) (figure 4).
6 Water Operation and Maintenance Bulletin
Figure 4.—Distribution of pre- and post-construction verification testing.
Behavior of Drainage Wicks and Piezometers
About 107,700 linear feet (1,982 wicks of varying length) of drainage wicks were locatedequidistant between the planned locations of the stone columns extending to the full designcolumn depths. The number of wick drains surrounding any stone column varied (figure 3).
Installation of the drainage wicks was expected to enhance reduction of air and waterpressures during the stone column construction process; the wicks protected other areas ofthe foundation and embankment from excess disturbance and/or hydraulic fracturing.
During the construction of any given stone column, up to 40 drainage wicks (roughly15-foot- diameter average influence zone) actively vented water and air to the surface from
Water Operation and Maintenance Bulletin 7
Foundation Response to Stone Column Construction
best fit line
0
2
4
6
8
10
12
0 20 40 60 80 100 120 140 160
Piezometer/Stone Column Distance - (ft)
Piez
omet
ric R
ise
- (ft)
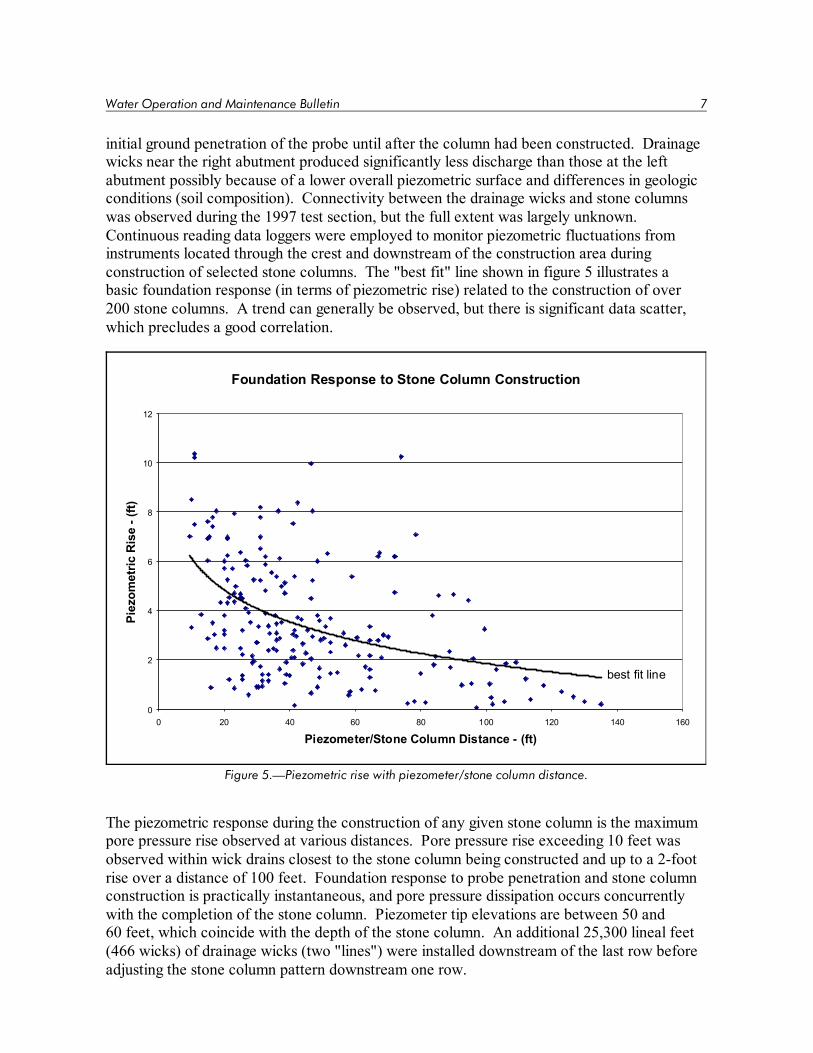
Figure 5.—Piezometric rise with piezometer/stone column distance.
initial ground penetration of the probe until after the column had been constructed. Drainagewicks near the right abutment produced significantly less discharge than those at the leftabutment possibly because of a lower overall piezometric surface and differences in geologicconditions (soil composition). Connectivity between the drainage wicks and stone columnswas observed during the 1997 test section, but the full extent was largely unknown. Continuous reading data loggers were employed to monitor piezometric fluctuations frominstruments located through the crest and downstream of the construction area duringconstruction of selected stone columns. The "best fit" line shown in figure 5 illustrates abasic foundation response (in terms of piezometric rise) related to the construction of over200 stone columns. A trend can generally be observed, but there is significant data scatter,which precludes a good correlation.
The piezometric response during the construction of any given stone column is the maximumpore pressure rise observed at various distances. Pore pressure rise exceeding 10 feet wasobserved within wick drains closest to the stone column being constructed and up to a 2-footrise over a distance of 100 feet. Foundation response to probe penetration and stone columnconstruction is practically instantaneous, and pore pressure dissipation occurs concurrentlywith the completion of the stone column. Piezometer tip elevations are between 50 and60 feet, which coincide with the depth of the stone column. An additional 25,300 lineal feet(466 wicks) of drainage wicks (two "lines") were installed downstream of the last row beforeadjusting the stone column pattern downstream one row.
8 Water Operation and Maintenance Bulletin
Methodology for Evaluation of Liquefaction Potential
Liquefaction Evaluation Based on SPT Data
The liquefaction potential evaluation compared the foundation material’s measured resistanceto liquefaction (represented by N1(60)m,(cs)) to values required (represented by N1(60)r,(cs)) to resistliquefaction under the MCE. The comparison was made on a clean sand basis. Since thefoundation has a significant percentage of materials with fines (minus No. 200), a finescorrection, �N1(60), is required and applied to the measured values. State-of-the-practicemethodologies were employed which relate cyclic shear stress to required corrected blow-counts for clean sands [8, 9]. The criteria used to identify triggering was when theN1(60)m/N1(60)r ratio � 1.0 to 1.2.
Figure 6 compares representative pre- and post-construction SPT blowcount data N1(60)m,(cs)
against required N(60)r,(cs) (liquefaction triggering threshold). Measured N1(60)m,(cs) values thatfall to the left of the required N1(60)r,(cs) line indicate potential for triggering of liquefaction. The majority of hollow shapes (or pre-treatment data) lie near or to the left of the liquefactiontriggering threshold line. The post-treatment data, represented by solid shapes, showsignificantly higher blowcounts and indicate foundation improvement by measureddensification increase.
An area of significant fines (silts and silty sands) is present between elevations 2275 and2260, whereas sandy lenses are apparent between elevations 2283 and 2280 and betweenelevations 2260 and 2248. The effectiveness of treatment of these areas is influenced by thefines content and is readily apparent.
Table 1 illustrates differences in foundation improvement (with material type) by comparing(N1)60 and (N1)60-cs. The percent of clay size materials (minus 0.005 m) was relatively lowregardless of the soil classification. The largest strength increase was exhibited by thesilty gravels followed by the silty sands, the poorly graded sands, and silts, respectively. Averaged across the site by elevation and weighted by the number of samples, the averageamount of improvement (N1)60 was about 95 percent.
Table 1.—Pre- and post-construction SPT (N1)60cs value comparison by material type
Average
Soil type
Averagepercentfines1
Averagepercent
clay(0.005m)1
Number ofpre-/post-
constructionsamples
Pre-(N1)60
Post-(N1)60
Percentincrease
SiltSilty sandPoorly graded sand with silt (SP-SM)Silty gravel with sand (GM)
654910
12
1152
3
70/48159/18551/35
4/6
121721
15
233340
52
889592
236
1 From post-construction SPT lab data only.
Water Operation and Maintenance Bulletin 9
Salmon Lake DamLiquefaction Triggering
2230
2235
2240
2245
2250
2255
2260
2265
2270
2275
2280
2285
2290
2295
2300
0 10 20 30 40 50 60 70 80 90 100
(N1)60CS (BPF)
Elev
atio
n (ft
)
Liquefaction Triggering Threshold Post-TreatmentPre-Treatment Average Post-TreatmentAverage Pre-Treatment
Figure 6.—Comparisons of pre- and post-construction SPT data.
CPT Methodology for Liquefaction Analysis
To evaluate liquefaction triggering in a method similar to that of the SPT, one must comparea measured penetration resistance (normalized and corrected to a clean sand equivalent,qc1N,m(cs) ) to a required value (qc1N,r(cs)).
If: qc1N,m(cs) � qc1N,r(cs) Then, no liquefactionqc1N,m(cs) � qc1N,r(cs) Then, potential for liquefaction
10 Water Operation and Maintenance Bulletin
Salmon Lake DamAverage Fines Content
2240
2245
2250
2255
2260
2265
2270
2275
2280
2285
2290
0 10 20 30 40 50 60 70 80 90 100
Fines Content (%)
Elev
atio
n (ft
)
Pre-Construction CPT AFC Post-Construction CPT AFCSPT Fines SPT Average FinesPost-Construction Average CPT AFC Pre-Construction Average CPT AFC
Figure 7.—CPT apparent/SPT laboratory fines content with elevation.
According to Robertson and Wride [9], it is possible to correct the measured CPT penetrationresistance to an equivalent clean sand value by estimating grain characteristics (apparentfines content [AFC]) directly from the CPT. However, it should be noted that estimates ofthe AFC from the CPT can be unreliable for determining the actual fines content in somecases and probably should not be used rigorously for this purpose. At this site, the methodgenerally underestimates the laboratory measured fines content (figure 7).
The CPT fines correction was computed from the equations proposed by Robertson andWride using the CPT friction ratio. A decision was made to defer to the AFC derivationusing the CPT friction ratio to maintain consistency with the liquefaction analysis methodapplied.
Water Operation and Maintenance Bulletin 11
Comparisons of AFC on companion CPT holes (pre- versus post-construction) generallyshow a decrease in fines after stone column construction, which would imply the foundationhas become coarser. Since the actual fines content of the materials is unlikely to havechanged significantly during treatment, the change in AFC must be associated with changesin the treated foundation differing stress conditions and is clearly artificial [10]. This pointsout the difficulties in predicting the fines content from these CPT parameters.
Since the calculated AFC after treatment was used to correct the post-construction CPT tipresistance to equivalent clean-sand values, and the AFC decreased after treatment (average5 percent), the corrected post-treatment CPT resistance values, qc1Ncs, are on a relative basisbiased on the conservative side. Thus, the actual level of foundation improvement is likely tobe slightly higher than that inferred by comparing the pre- and post-treatment values ofcorrected equivalent clean-sand CPT tip resistance.
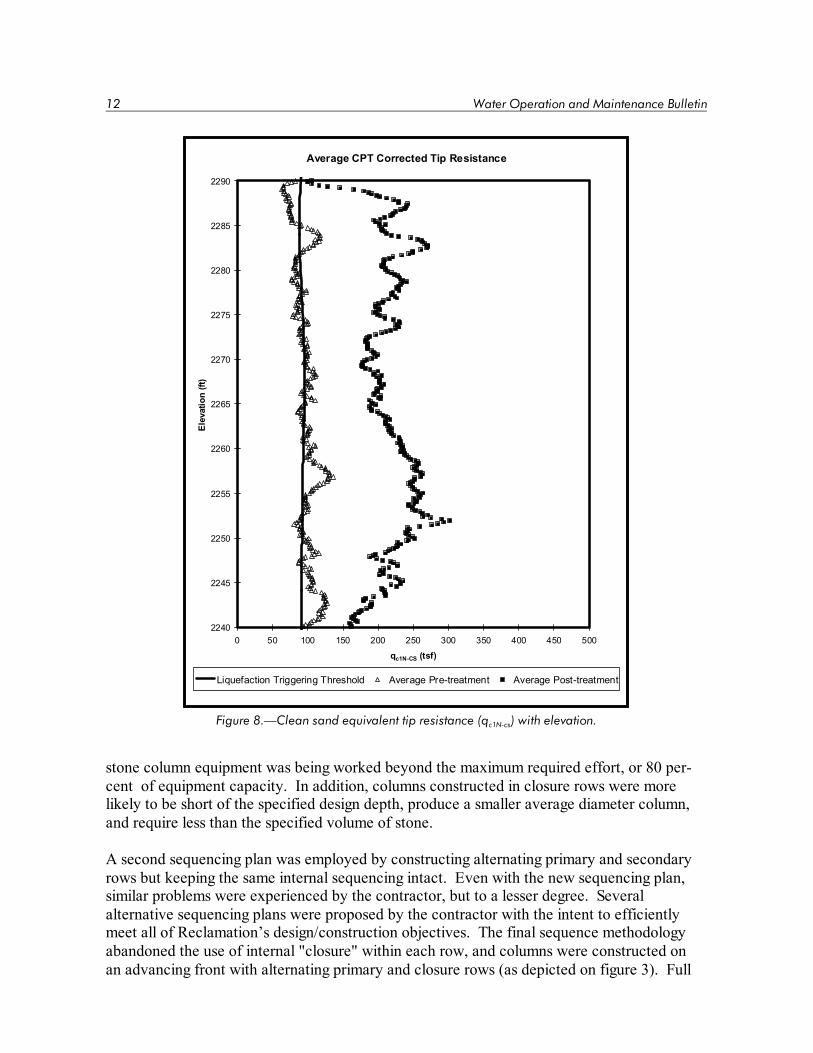
It is fortunate that the foundation improvement observed has been so significant that adifference in the measured stress condition (as reflected in the AFC) does not impact theconclusions on the adequacy of treatment (figure 8).
The level of foundation improvement can also be depicted by a comparison between averagepre- and post-treatment values of normalized CPT tip resistance, qc1N [10] (figure 9). Datashown is the average (at each elevation) of all applicable pre- and post-construction CPTdata.
A factor which may have influenced the overall foundation treatment performance is theeffect of grouping or confinement for large numbers of stone columns. According to Baez[4], "the effects of grouping (confinement) are evident in the resulting normalized penetrationresistance values for the spacings evaluated." This conclusion suggests that the use of a smalltest section may underestimate full production foundation improvement results.
Influences of Sequence
Near-optimal foundation improvement observed during the 1997 test section was attributed tousing an alternating row "advancing front" construction sequencing.
In this approach, alternate rows were constructed upstream to downstream sequentially(primary rows), with adjacent rows subsequently constructed (closure rows). Since closuresequencing in the test section appeared to have a beneficial effect in treatment, constructionspecifications for treating the entire foundation incorporated an additional sequencingrequirement maximizing the closure effect. Columns were constructed initially using a "hop-scotch" pattern from the outside inward for each row (see figure 3).
At the beginning of construction, five primary rows were constructed before initiation of theclosure rows followed by verification testing 10 days after completion of the closure rows. The specialty contractor voiced concern that by implementing the specified sequencing, the
12 Water Operation and Maintenance Bulletin
Average CPT Corrected Tip Resistance
2240
2245
2250
2255
2260
2265
2270
2275
2280
2285
2290
0 50 100 150 200 250 300 350 400 450 500
qc1N-CS (tsf)
Elev
atio
n (ft
)
Liquefaction Triggering Threshold Average Pre-treatment Average Post-treatment
Figure 8.—Clean sand equivalent tip resistance (qc1N-cs) with elevation.
stone column equipment was being worked beyond the maximum required effort, or 80 per-cent of equipment capacity. In addition, columns constructed in closure rows were morelikely to be short of the specified design depth, produce a smaller average diameter column,and require less than the specified volume of stone.
A second sequencing plan was employed by constructing alternating primary and secondaryrows but keeping the same internal sequencing intact. Even with the new sequencing plan,similar problems were experienced by the contractor, but to a lesser degree. Severalalternative sequencing plans were proposed by the contractor with the intent to efficientlymeet all of Reclamation’s design/construction objectives. The final sequence methodologyabandoned the use of internal "closure" within each row, and columns were constructed onan advancing front with alternating primary and closure rows (as depicted on figure 3). Full
Water Operation and Maintenance Bulletin 13
Average CPT Corrected Tip Resistance
2240
2245
2250
2255
2260
2265
2270
2275
2280
2285
2290
0 50 100 150 200 250 300 350 400 450 500
qc1N (tsf)
Elev
atio
n (ft
)
Liquefaction Triggering Threshold Average Pre-treatment Average Post-treatment
Figure 9.—Average corrected tip resistance (qc1N) with elevation.
depth of both primary and closure row columns was obtained with this procedure. Theclosure columns generally took approximately 25 to 50 percent more time to construct thanthe primary row columns.
Based on the performance of the foundation to treatment, there appears to be a soil-specificdensification limit that can be achieved when using vibro-stone construction for a givendiameter and spacing. From an engineering standpoint, it is reasonable to attempt toapproach this limit if the goal is to create a soil unit highly resistant to strength loss during aseismic loading. In an attempt to define such limits and their variance and/or distributionacross the site, sequencing that maximizes the effect of closure should certainly beconsidered at the initiation of construction. If it can be determined that treatment is notoptimally effective, sequence adjustments towards an "advancing front" can be made to
14 Water Operation and Maintenance Bulletin
ease the overworking of the foundation and the equipment. Adjustments should be made tomaximize the energy imparted to the foundation with effective and optimal use of theequipment.
Conclusions
The verification testing indicates that construction of the stone columns increased the SPTblows per foot (average (N1)60 increase of 95 percent) and CPT penetration resistance(average increase of about 180 percent for (qc1N)). On the average, the penetration resistanceof the treated soils is well above the threshold for liquefaction triggering during the designearthquake. In a few isolated and discontinuous soil intervals, the penetration resistance is ator near the threshold. However, the existence of these intervals is not considered detrimentalto the overall seismic performance of the structure. On average, soils were treated wellbeyond liquefaction triggering levels.
Although a test section was initially performed to establish effective column spacing anddiameter, the SOD foundation treatment performance appears to be magnified because of theeffect of mass grouping or confinement.
An evaluation of foundation "aging" after 3 years of the test section construction is ongoing,and results are currently inconclusive.
The average AFC (associated with CPT tip resistance and friction ratio) decreased about5 percent after the stone column treatment and is clearly artificial since it is unlikely that thematerial particle distribution between the columns actually changed during treatment. Sincepredicting AFC from CPT parameters can be unreliable in finer-grained soils (greater than20 to 30 percent fines), the level of foundation improvement as depicted by the comparisonsbetween the pre- and post-treatment values of normalized CPT tip resistance, qc1Ncs, withoutthe AFC adjustment (i.e., qc1N), can be questioned.
The fact that up to 40 drainage wicks (in a roughly 15-foot-diameter area of influence) wereactively venting air and water during the construction of any given stone column validatestheir use in protecting areas of the foundation and embankment from excess disturbance andhydraulic fracturing.
The effect of closure and proper sequencing can be highly beneficial in optimizingfoundation improvement but can also present construction difficulties, especially in soilswhere the treatment is found to be highly effective. Maximizing closure within each rowmay not be warranted at this site because it appears to "overwork" the soils, resulting inexcess pore pressures; unnecessarily overexercises the equipment; and increases productiontime. Modifying sequencing to approach an advancing front can reduce the constructiondifficulties while still achieving effective treatment. Future foundation treatment projectsshould consider construction of a strategic row or "wall" of stone columns parallel to theembankment toe and a reasonable and flexible construction sequencing strategy.
Water Operation and Maintenance Bulletin 15
References
[1] Torres, R.L., "Modification Decision Analysis," Decision Memorandum No. DEC-OZ-3620-1, Bureau of Reclamation, Technical Service Center, Denver, Colorado, October1993.
[2] Torres, R.L. and R.W. Luehring, "Corrective Action Study - Geotechnical Issues atSalmon Lake Dam," Technical Memorandum No. OZ-3620-5, Bureau of Reclamation,Technical Service Center, Denver, Colorado, April 15, 1997.
[3] Value Engineering Final Report, Salmon Lake Dam Modification, Technical ServiceCenter, Bureau of Reclamation, Denver, Colorado, April 30, 1997.
[4] Luehring, R.W. Stone Column Test Section "Salmon Lake Dam," TechnicalMemorandum No. OZ-8312-6, Bureau of Reclamation, Technical Service Center,May 6, 1998.
[5] Seed, R.B., "Recent Advances in Evaluation and Mitigation of Liquefaction Hazard,"University of California at Berkeley, Ground Stabilization and Seismic Mitigation,Theory and Practice, Portland, Oregon, November 6 and 7, 1996.
[6] Design Standards No. 13 - Embankment Dams, Chapter 13: Seismic Design andAnalysis, Bureau of Reclamation, draft June 16, 1999.
[7] Baez Satizabal, J.I., "A Design Model for the Reduction of Soil Liquefaction by Vibro-Stone Columns," University of Southern California PhD dissertation, December 1995.
[8] Youd, T.L. and I.M. Idriss, "Proceeding of the NCEER Workshop on Evaluation ofLiquefaction Resistance of Soils," Technical Report NCEER-97-0022, National Centerfor Earthquake Engineering Research, ISSN 1088-3800, December 31, 1997.
[9] Robertson, P.K. and C.E. Wride, "Cyclic Liquefaction and its Evaluation Based onthe SPT and CPT," Geotechnical Group, Department of Civil and EnvironmentalEngineering, University of Alberta, Edmonton, Alberta, Canada, June 1997.
[10] Mejia, L.H., "Independent A-E Consultant Review of Salmon Lake DamModifications," URS Corporation, January 10, 2001.
Water Operation and Maintenance Bulletin 17
WIRE ROPE PROTECTION AT ALTUS DAM
by Bill Bouley, Civil Engineer, Inspections and Emergency Management Group
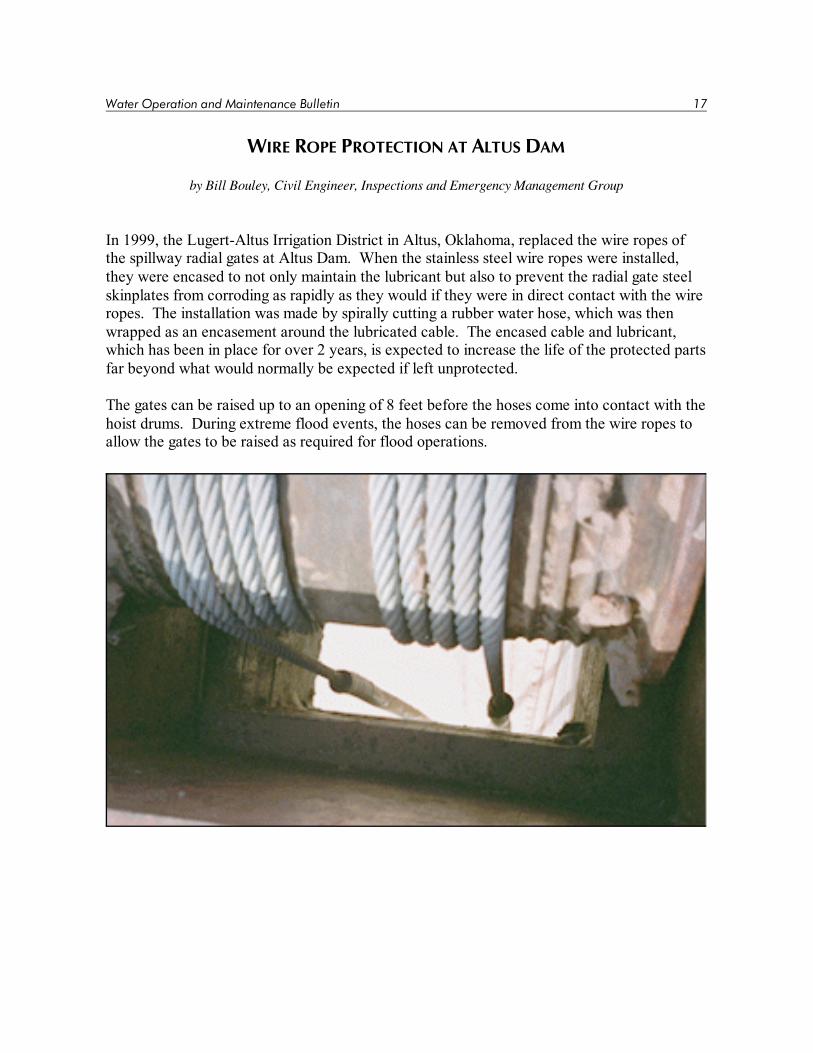
In 1999, the Lugert-Altus Irrigation District in Altus, Oklahoma, replaced the wire ropes ofthe spillway radial gates at Altus Dam. When the stainless steel wire ropes were installed,they were encased to not only maintain the lubricant but also to prevent the radial gate steelskinplates from corroding as rapidly as they would if they were in direct contact with the wireropes. The installation was made by spirally cutting a rubber water hose, which was thenwrapped as an encasement around the lubricated cable. The encased cable and lubricant,which has been in place for over 2 years, is expected to increase the life of the protected partsfar beyond what would normally be expected if left unprotected.
The gates can be raised up to an opening of 8 feet before the hoses come into contact with thehoist drums. During extreme flood events, the hoses can be removed from the wire ropes toallow the gates to be raised as required for flood operations.
Water Operation and Maintenance Bulletin 19
Glen Canyon Plant Mechanic Rick Benzeldemonstrates operation of the rotor turning gear.
The rim of the generator rotor is overhead.
RECLAMATION DEVELOPS NEW GENERATOR SAFETY DEVICE
by Bruce Lonnecker
The Bureau of Reclamation (Reclamation) owns and operates 194 hydroelectric generators at58 powerplants in 11 of the Western States. These generators have a total capacity to serveabout 14 million households. Hydroelectric generators have a massive rotating component,the rotor, which is connected to the turbine. The rotors in the eight generators at GlenCanyon Powerplant are typical of generators at many of the Reclamation powerplants. Theyare over 25 feet across and weigh over 110,000 pounds. As water is released and flowsthrough the turbine, the rotor is turned, and electric power is generated.
A new safety device has been developedfor use when maintaining Reclamation’shydroelectric generators. Reclamationdeveloped the Generator Rotor TurningGear, originally conceived by anotherutility, as a research project to improve theconvenience, precision, and especially thesafety of generator rotor turningoperations.
A potential safety hazard occurs whenlarge, synchronous generator rotors mustbe turned slowly and stopped at precisepositions for certain operations such asmaintenance, inspection, mechanicalalignment, and testing. Until now, rotors atReclamation plants have generally beenturned "by hand" or sometimes by usingwinches. These methods are difficult,cumbersome, and potentially dangerous. The rotor is made of steel, and its surface can bevery slippery if any oil is present. Also, there are many projections on top of the rotor, suchas fan blades, bolts, and nuts. When a generator rotor is turned by hand, several workersstand on the top of the rotor, brace their backs against some stationary structural component,and push with their feet on the projections, as if they were pushing a 110,000-pound stalledcar. As the rotor begins to turn, the workers must reposition their feet to get a new purchaseon the rotor and continue pushing.
Once turning, the inertia of the massive rotor tends to keep it in motion. It is not possible fora worker or even several workers to quickly stop the rotation of the rotor. Depending on itsspeed, the rotor may turn several times before it coasts to a stop. While moving, the rotor is asource of hazardous energy.
20 Water Operation and Maintenance Bulletin
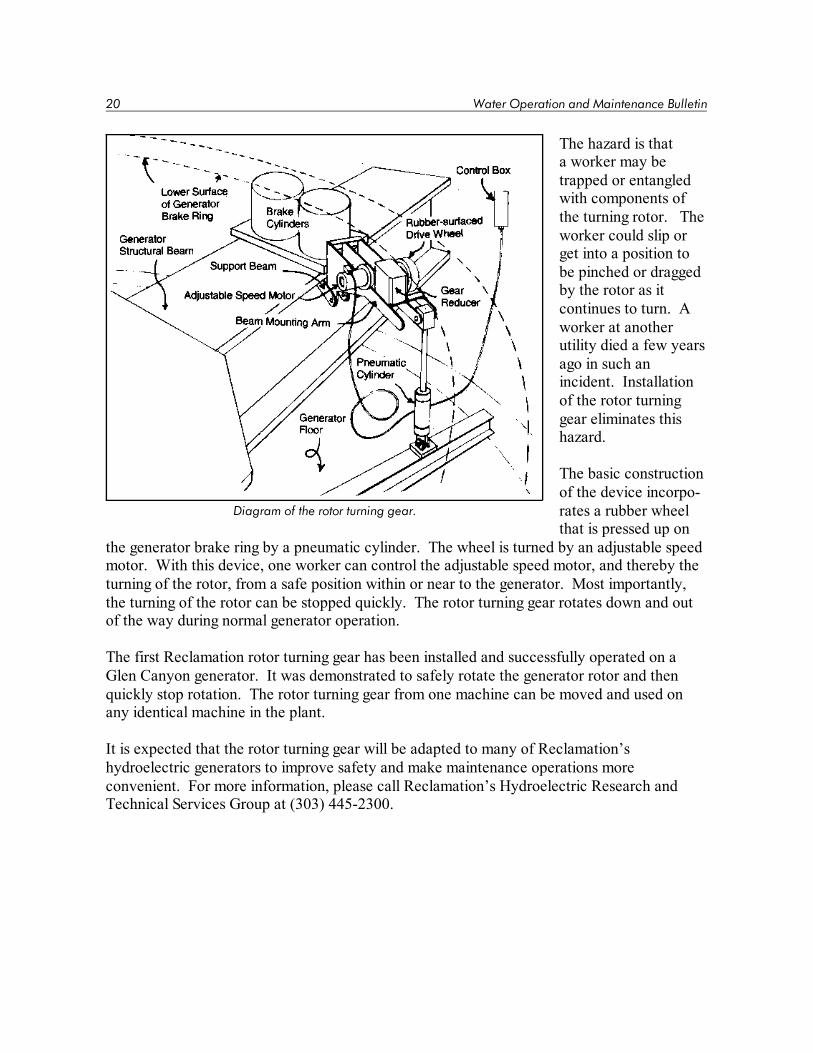
Diagram of the rotor turning gear.
The hazard is thata worker may betrapped or entangledwith components ofthe turning rotor. Theworker could slip orget into a position tobe pinched or draggedby the rotor as itcontinues to turn. Aworker at anotherutility died a few yearsago in such anincident. Installationof the rotor turninggear eliminates thishazard.
The basic constructionof the device incorpo-rates a rubber wheelthat is pressed up on
the generator brake ring by a pneumatic cylinder. The wheel is turned by an adjustable speedmotor. With this device, one worker can control the adjustable speed motor, and thereby theturning of the rotor, from a safe position within or near to the generator. Most importantly,the turning of the rotor can be stopped quickly. The rotor turning gear rotates down and outof the way during normal generator operation.
The first Reclamation rotor turning gear has been installed and successfully operated on aGlen Canyon generator. It was demonstrated to safely rotate the generator rotor and thenquickly stop rotation. The rotor turning gear from one machine can be moved and used onany identical machine in the plant.
It is expected that the rotor turning gear will be adapted to many of Reclamation’shydroelectric generators to improve safety and make maintenance operations moreconvenient. For more information, please call Reclamation’s Hydroelectric Research andTechnical Services Group at (303) 445-2300.
Mission
The mission of the Bureau of Reclamation is to manage, develop,and protect water and related resources in an environmentally andeconomically sound manner in the interest of the American public.
The purpose of this bulletin is to serve as a medium of exchanging operation andmaintenance information. Its success depends upon your help in obtaining andsubmitting new and useful operation and maintenance ideas.
Advertise your district’s or project’s resourcefulness by having an article published inthe bulletin—let us hear from you soon!
Prospective articles should be submitted to one of the Bureau of Reclamation contactslisted below:
Jerry Fischer, Technical Service Center, ATTN: D-8470, PO Box 25007, Denver,Colorado 80225-0007; (303) 445-2748, FAX (303) 445-6381; email: [email protected]