Page 1
7/30/2019 Water Pipelines Report
http://slidepdf.com/reader/full/water-pipelines-report 1/46
June 2012
Pipe Dream: Water SupplyPipeline Projects in the West
Autr
Denise Fort, University of New Mexico Law Schoo
Barry Nelson, Natural Resources Defense Counci
Reearc
Kelly Coplin, Natural Resources Defense Counci
Sharon Wirth, University of New Mexico Law Schoo
Page 2
7/30/2019 Water Pipelines Report
http://slidepdf.com/reader/full/water-pipelines-report 2/46
PAGE 2 | Pipe Dream: Water Supply Pipeline Projects in the West
Aut NRDCThe Natural Resources Deense Council is an international nonprot environmental organization with more than 1.3 million
members and online activists. Since 1970, our lawyers, scientists, and other environmental specialists have worked to protect
the world’s natural resources, public health, and the environment. NRDC has oces in New York City, Washington, D.C., Los
Angeles, San Francisco, Chicago, Montana, and Beijing. Visit us at www.nrdc.org.
AcknwedgmentThe Natural Resources Deense Council would like to thank the Pisces Foundation, The William and Flora Hewlett
Foundation, the TOSA Foundation, and an anonymous donor or supporting NRDC’s work on the intersection o water,climate, and energy issues.
This white paper also received substantial input and review rom a number o individuals. Their participation contributed
to the quality o the document and its recommendations. We acknowledge that they may not necessarily endorse all o the
recommendations, which are solely those o the Natural Resources Deense Council. In particular, we wish to thank our
peer reviewers: Robert Adler, University o Utah, S. J. Quinney College o Law; Lawrence J. MacDonnell, University o Wyoming
College o Law; Rita Maguire, Attorney and Former Director o Arizona Department o Water Resources; Stacy Tellinghuisen,
Western Resource Advocates; an anonymous reviewer; and NRDC sta, including Sheryl Carter, Steve Fleischli, and Ed Osann.
Cover photo on the let, credit: U.S. Bureau o Reclamation; Photo on the right: Los Angeles Aqueduct
© Natural Resources Deense Council, 2012.
Report available for download at www.nrdc.org
NRDC Director o Communications: Phil Gutis
NRDC Deputy Director o Communications: Lisa Goredi
NRDC Publications Director: Alex Kennaugh
NRDC Publications Editor: Carlita Salazar
Design and Production: Tanja Bos
Page 3
7/30/2019 Water Pipelines Report
http://slidepdf.com/reader/full/water-pipelines-report 3/46
PAGE 1 | Pipe Dream: Water Supply Pipeline Projects in the West
TAblE of CoNTENTs
Executive Summary .....................................................................................................................2
I. Introduction ..............................................................................................................................4
II. Pipeline Projects—Existing and in Development ....................................................................6
III. Sustainability o Water Sources ............................................................................................10
IV. Potential Alternatives, Including Water Use Efciency .............................................................16
V. Energy Use—Conventional and Renewables ...........................................................................20
VI. The Role o Federal Agencies .................................................................................................24
VII. Conclusions ..........................................................................................................................26
VIII. Recommendations ...............................................................................................................27
IX. Appendix A ............................................................................................................................29
X. Appendix B .............................................................................................................................31
Endnotes ...................................................................................................................................36
Page 4
7/30/2019 Water Pipelines Report
http://slidepdf.com/reader/full/water-pipelines-report 4/46
PAGE 2 | Pipe Dream: Water Supply Pipeline Projects in the West
EXECUTIVE sUMMARY
L
arge-scale water supply conveyance pipelines have long been an important tool or addressing
water needs in the western United States. These pipelines have traditionally been used as a
component in complex water projects constructed to capture, store, and move water to serve
urban and agricultural users. Traditional water projects have long been designed to tap into major
sources o water, requently through the construction o surace storage projects and associated
pipelines, canals, and pumping stations. Indeed, dams have oten been the most well known and
expensive eatures o large water projects, which oten came at high economic and environmental
costs. In the last 20 years, the construction o new dams has slowed to a trickle or a variety o
reasons, including the lack o available “ new” water, the growing costs o these projects, and a public
that is more protective o its rivers.
The western water landscape has changed dramatically
in recent years. This is a actor that should be seriously
considered by water managers as they design solutions
to meet the needs o the coming century. Today, the new
conditions acing water managers in the West may guide
us to new solutions. Indeed, many managers are shiting
ocus to groundwater storage, water recycling, and a suite o
water eciency tools. A number o water interests, however,
continue to propose a new generation o large scale water
conveyance projects around the West—some o which
may be signicantly less reliable than past projects, raising
important questions around their level o cost-eectiveness
and sustainability.
Some o the new water conveyance projects described in
this report could increase the water supply vulnerability,
over the long-term, o communities that rely upon them.
For example, or proposed projects or which groundwater
is key, it is important to note that in many parts o the
West, groundwater is withdrawn more quickly than natural
recharge can replenish the supply. Such groundwater mining
is inherently unsustainable.
Other proposed pipeline projects would tap into surace
water supplies rom rivers that are already under stress rom
existing users. In addition, climate change and other actors
suggest that water rom some sources will be less reliable
during the driest years and in the long-term. With more
stress on water sources, the competition rom established
users, oten with older priority dates, suggests more confict
in the uture or some proposed projects. When evaluating
proposed projects, it is important to remember that water
conveyance projects can only generate reliable water supplies
i they tap into reliable water sources. In short, water projects
that rely on unreliable sources could lead to uture shortages
or the very communities that pay or these expensive acilities
In addition, the energy costs o proposed conveyance
projects can be enormous, requiring the commitment o
massive quantities o power (and, except in rare cases,
greenhouse gas emissions) to pump and move water to the
Page 5
7/30/2019 Water Pipelines Report
http://slidepdf.com/reader/full/water-pipelines-report 5/46
PAGE 3 | Pipe Dream: Water Supply Pipeline Projects in the West
location where it would be used. An acre-oot (a) o water
weighs more than 1,360 tons. Thereore, the energy costs
associated with moving water are extraordinarily high. For
example, pumping water rom the San Francisco Bay-Delta
to Southern Caliornia requires approximately 3,200 kilowatthours (kwh) per a, the State Water Project the state’s single
largest user o electricity.1 Nonetheless, ederal, state, and
local water agencies continue to propose new pipeline
projects, oten with little analysis o energy requirements and
usually without incorporating the use o renewable energy.
The western United States already has more than its share
o water conficts and unsustainable uses. In designing new
projects, NRDC suggests that water managers ollow the old
adage: When you nd yoursel in a hole, the rst thing to do
is to stop digging. Today, water managers have a range o
alternatives to new pipeline projects, including urban and
agricultural water-use eciency, voluntary water transers,
water recycling, improved groundwater management, and
more. The success o eciency eorts can be seen today
across the West. Many o these less environmentally disruptive
alternatives are more reliable, more aordable, less vulnerable
to climate change impacts, and less energy intensive than
traditional water development projects.
This report provides a brie introduction to some o
the pipeline projects proposed recently in the West.
Also, it provides a summary o issues that have oten
been overlooked in proposed pipeline projects, and
recommendations or a more eective approach to
meeting the water needs o western communities. Our
recommendations, which address a broad range o issues,such as sustainability, cost, and energy use include:
n New water supply projects in the West should be
designed to reduce, rather than increase, the current
imbalances in water use, such as groundwater overdrat
and overcommitted surace water sources.
n Federal unds should be ocused on projects where
there is a strong ederal nexus, such as resolving Native
American water rights claims and addressing endangered
species issues. Also, state and ederal water supply
unding should be ocused on the most aordable and
reliable projects—those that increase the eciency o
water use and re-use, as opposed to traditional waterdevelopment, particularly in regions such projects would
be unsustainable.
n A beneciary-pays approach to nancing water projects
provides the best way to internalize the costs o water
projects and encourage ecient water use.
Page 6
7/30/2019 Water Pipelines Report
http://slidepdf.com/reader/full/water-pipelines-report 6/46
PAGE 4 | Pipe Dream: Water Supply Pipeline Projects in the West
n Proposed pipeline projects should include an analysis o
all o the ollowing issues:
• The capital, nancing, planning, mitigation,
operating, and maintenance costs o the proposed
project, in comparison with the benets. This should
include an analysis o the external costs o proposed
projects, such as environmental impacts.
• All feasible alternatives to the project, particularly urban and agricultural water-use eciency, water
recycling, urban stormwater capture, and voluntary
water transers.
• Energy use and energy sources.
• Potential new greenhouse gas emissions.
• The reliability of proposed water sources, including
the potential impacts o climate change on the water
sources.
• Potential impacts to existing water users and
communities.
• Potential impacts of proposed new transbasin
diversions on water use in the basin o origination.
n State water agencies, tribal governments,
environmentalists, and other stakeholders should work
collaboratively to investigate these issues, including
possible eects across political or hydrologic boundaries
n Given the number o proposed projects to divert water
rom the Colorado River, as well as into the Basin, the
Bureau o Reclamation’s (BOR) Colorado River Basin
Water Supply and Demand Study and subsequent eorts
should address the cumulative potential impacts o the
potential projects summarized in this report.
n Energy or uture pipeline projects should be provided
through investments in renewable energy sources. Also,
water agencies should invest in renewable sources to
provide the energy required or existing pipeline projects
such as Caliornia’s State Water Project.
n The new Principles and Guidelines or Water and Land
Related Resources that are under development by ederal
agencies should address the issues discussed in this
paper, to provide decision-makers a more complete
understanding o proposed projects.
n Federal agencies, particularly the BOR, should report the
energy usage o existing and new projects, as they comply
with President Obama’s Executive Order on Greenhouse
Gasses.
n Ratepayers should be provided with inormation
regarding these issues beore water utilities make
decisions on proposed water supply projects.
Page 7
7/30/2019 Water Pipelines Report
http://slidepdf.com/reader/full/water-pipelines-report 7/46
PAGE 5 | Pipe Dream: Water Supply Pipeline Projects in the West
N
ew water management strategies are needed in the western United States. With mounting
populations, over-tapped rivers, extended droughts and severely damaged aquatic
ecosystems, water managers ace increasing challenges in locating reliable water supplies or
their communities, to protect their natural systems, and to sustain local and regional economies.
I. INTRoDUCTIoN
In the last century, reservoirs and associated pipelines and
aqueducts were the dominant strategy or providing water
in the western United States. The BOR alone lists 339 dams
among its project acilities.2 The Corps o Engineers and
state and local water agencies have constructed hundreds o
additional acilities. Caliornia’s State Water Project includes
34 storage acilities and more than 700 miles o pipelines and
canals.3 These projects made possible the development o
many large western cities and extensive irrigated agriculture.
This traditional water supply development pattern has
slowed dramatically over the past two decades. There are
many reasons or this change. First, traditional inrastructure
projects are increasingly expensive and many ratepayers are
resistant to urther increases in water rates that have risen
dramatically in recent years. Further, in much o the West,
there is little “new” water to be developed by traditional water
projects. Indeed, many rivers have already hit clear limits in
terms o the water available or diversion. In addition, the
public is increasingly supportive o eorts to protect rivers
and wildlie. Finally, in much o the West, climate change is
anticipated to urther reduce available water supplies rom
traditional water projects. At the moment, western water managers are pursuing two
diametrically opposed strategies. On the one hand, many
water agencies are investing in water conservation, water
recycling, groundwater clean-up, and other tools designed to
increase the eciency with which we use existing supplies.
On the other hand, some water managers and private
entrepreneurs have oered a growing number o proposals
or public and private long-distance water supply pipelines—
usually without the surace storage projects that have been
so common over the past century. Some o these projects are
extremely large in scale and would stretch or hundreds o
miles. This new generation o long-distance pipelines raises a
host o questions or water policymakers and the public.
This analysis revealed that a range o key issues have oten
been overlooked in the analysis o these proposed projects.
These issues include:
n Serious questions about the reliability o surace and
groundwater sources or proposed pipeline projects,
including potential environmental impacts, existing constraints on water sources, and the likely impacts o
climate change on these supplies.
n Potential water user impacts, including impacts rom
proposed projects on other water users in overtapped
basins, as well as water rate impacts and potential long-
term water shortages or the communities that would
rely on proposed new projects.
n The high nancial and energy cost o many proposed
pipeline projects.
n The growing number o proven, cost-eective, alternative
approaches—particularly water use eciency—that
could oer greater potential to meet the needs o western
communities more cheaply and reliably.
This report concludes that many o the pipeline projects
under consideration today are dramatically dierent rom
those constructed in the past, in terms o sustainability o
water supplies, available alternatives, costs, environmental
impacts and energy use. The communities and agencies
that are considering these projects would be well served by a
careul analysis o the implications o these important choices.
Page 8
7/30/2019 Water Pipelines Report
http://slidepdf.com/reader/full/water-pipelines-report 8/46
PAGE 6 | Pipe Dream: Water Supply Pipeline Projects in the West
II. PIPElINE PRoJECTs: EXIsTING AND IN DEVEloPMENT
Tae A. Exiting Majr Pipeine Prject in te Wet
ProjectDeliveryVolume(afy)
TransbasinDiversion
Length (mi)
Little Snake-Douglas Creek Project, WY 21,000 Yes 21 miles diversion pipeline; 113 miles o delivery pipeline
The Colorado-Big Thompson Project, CO 213,000 Yes 35 miles o tunnels; 95 miles o canals
Additional Colorado Transbasin Diversions, CO. Grand
River Ditch, Harold D. Roberts Tunnel, Homestake Tunnel,Moat Water Tunnel and Twin Lakes Tunnel 150,000 Yes 56.6 miles o tunnels
San Juan-Chama Project, NM 86,210 Yes 27 miles o tunnels
Central Utah Project, UT 218,000 Yes More than 200 miles o aqueducts, tunnels, and canals
Central Arizona Project, AZ 1,500,000 Yes 335 miles o aqueducts, 15 miles o tunnels
Colorado River Aqueduct, CA 1,200,000 Yes242 miles o aqueduct; 63 miles o canals; 92 miles otunnels; 84 miles o buried conduit and siphons
Los Angeles Aqueduct, CA 254,000 Yes223 miles o canal and pipelines—frst aqueduct. 137miles—second aqueduct
Caliornia State Water Project, CA 2,400,000 Yes 700 miles o pipelines and canals
Central Valley Project, CA 5,300,000 Yes 500 miles o canals, conduits, tunnels, and related acilities
Hetch Hetchy Aqueduct, CA 165,000 No. Transer to adierent sub-basin
160 miles o pipeline
Mokelumne Aqueduct, CA 364,000No. Transer to adierent sub-basin
91 miles o pipeline
Portland Water Bureau, OR 132,000No. Transer to adierent sub-basin
26 miles o pipeline
Cedar River, WA 103,500 No 56 miles o pipelines
Mni Wiconi Rural Water System, SDProjected
8,591–12,474
No 4,400 miles o pipelines
Pipelines and aqueducts have been a amiliar part o the landscape in the western United
States or more than a century. Many o these projects involve surace reservoirs and transbasin
diversions. The American West is noteworthy in the history o water development, because the
West was where the world frst learned how to build dams on large river systems. In addition, the West
still contains some o the most ambitious water engineering projects on the globe (see fgure 1 and tableA).1 A summary o the existing projects listed on the next page can be ound in Appendix A.
Page 9
7/30/2019 Water Pipelines Report
http://slidepdf.com/reader/full/water-pipelines-report 9/46
PAGE 7 | Pipe Dream: Water Supply Pipeline Projects in the West
CEDAR RIVER
PORTLAND WATER BUREAU
MOKELUMNE
AQUEDUCTHETCH HETCHY
AQUEDUCTCENTRAL
UTAH
PROJECTLOS ANGELES
AQUEDUCT
STATE
WATER
PROJECT
CENTRAL
VALLEY
PROJECT
COLORADO RIVERAQUEDUCT SAN JUAN-CHAMA
PROJECT
COLORADO BIG
THOMPSON
PROJECT
LITTLE SNAKE-DOUGLAS
CREEK STAGE II
EXPANSION PROJECT
MNI WICONI
RURAL WATER
SYSTEM
Additional Colorado Transbasin Diversions
CENTRAL
ARIZONA
PROJECT
figure 1: Exiting Pipeine Prject
This paper summarizes 19 o the more prominent existing pipeline projects in the West. These projects were selected to include
the largest pipeline projects, as well as broad geographic representation. The projects are summarized in roughly clockwise order as
shown on fgure 1, beginning in the headwaters o the Colorado River.
Little Snake-Douglas Creek Project, WYn Communities Served: Cheyenne, Wyomingn Water Source: Douglas Creek Watershed and
Little Snake Watershed
The Colorado-Big Thompson Project, COn Communities Served: Colorado Front Range
and Plainsn Water Source: West Slope water rom
Colorado River headwaters
Additional Colorado Transbasin Diversions,CO. Grand River Ditch, Harold D. RobertsTunnel, Homestake Tunnel, Moffat WaterTunnel and Twin Lakes Tunneln Communities Served: Colorado Front Rangen Water Source: Colorado River Basin
San Juan-Chama Project, NMn Communities Served: Rio Grande Basinn Water Source: San Juan River Tributaries
Central Utah Project, UTn Communities Served: Uintah and Bonneville
Basins, and the Wasatch Frontn Water Source: Bonneville and Green River
Basins
Central Arizona Project, AZn Communities Served: Southern Arizonan Water Source: Colorado Rivern Southern Caliornia
Colorado River Aqueduct, CAn Communities Served: Southern Caliornian Water Source: Colorado River
Los Angeles Aqueduct, CAn Community Served: Los Angelesn Water Source: Mono Lake Basin
and Owens River
California State Water Project, CAn Communities Served: Caliornia’s Central
Valley, Alameda and Santa Clara Counties,cities on the northern edge o the San
Francisco Bay Area, Caliornia’s CentralCoast, Southern Caliornia
n Water Source: Sacramento-SanJoaquin Delta
Central Valley Project, CAn Communities Served: Central Valley, Central
Coast, and Santa Clara Countyn Water Source: Sacramento-San
Joaquin Delta
Hetch Hetchy Aqueduct, CAn Communities Served: San Francisco, San
Mateo, Santa Clara and Alameda Countiesn Water Source: Tuolumne River in Yosemite
National Park
Mokelumne Aqueduct, CAn Communities Served: East Bay communities,
including Oakland, Berkeley and Richmondn Water Source: Mokelumne River
Portland Water Bureau, ORn Communities Served: Portland, ORn Water Source: Bull Run watershed
Cedar River, WAn Communities Served: Seattle, WAn Water Source: Cedar River
Mni Wiconi Rural Water System, SDn Communities Served: South Dakotan Water Source: Missouri River
Page 10
7/30/2019 Water Pipelines Report
http://slidepdf.com/reader/full/water-pipelines-report 10/46
PAGE 8 | Pipe Dream: Water Supply Pipeline Projects in the West
WEBER SIPHON
PERIPHERAL
CANAL
EASTERN
NEVADA TO
LAS VEGAS
CADIZ
VALLEY
PROJECTSANTA FE
PECOS
NAVAJO
GALLUP
UVALDE COUNTY
SAN ANTONIO
NORTHERN
INTEGRATED
SUPPLY
PROJECT
FLAMING
GORGE
YAMPA RIVER
PUMPBACKNARROWS
PROJECT
LAKE
POWELL
MISSISSIPPI
RIVER PROJECT
LEWIS & CLARK
REGIONAL WATER SYSTEM
UTE LAKE
SOUTHERN DELIVERY
SYSTEM
Under Construction
Draft EIR or EIS Completed
In Planning
Conceptual Projects
figure 2: Prject in te Pipeine
Flaming Gorge, WY and COn Communities Served: The Front Range o
Colorado, and Wyomingn Water Source: Green Rivern Federal Funding: Funding not yet identifed
Lake Powell Project, AZ and UTn Communities Served: Utahn Water Source: Colorado Rivern Federal Funding: No
Yampa River Pumpback, COn Communities Served: The Front Range o
Coloradon Water Source: Yampa Rivern Federal Funding: No
Navajo-Gallup Project, NMn Communities Served: Eastern section o the
Navajo Nation, the southwestern part o theJicarilla Apache Nation, and the cityo Gallup
n Water Source: San Juan Rivern Federal Funding: Yes (100%)
Southern Delivery System, COn Communities Served: Colorado Springs and
surrounding communitiesn Water Source: Arkansas Rivern Federal Funding: No
Cadiz Valley Water Conservation, Recoveryand Storage Project, CAn Communities Served: Southern Caliornia
Water Districtsn Water Source: Groundwater rom Bristol,
Fenner, and Cadiz Watershedsn Federal Funding: No
Peripheral Canal/Tunnel, CAn Communities Served: Central Caliornia,
Southern Caliornia, and some NorthernCaliornia water agencies
n Water Source: Sacramento Rivern Federal Funding: No
Weber Siphon, WAn Communities Served: Agricultural land in the
Odessa Subregion in Washington Staten Water Source: Columbia Rivern Federal Funding: Yes (100%)
Lewis and Clark Regional Water System,SD, IA, and MNn Communities Served: South Dakota, Iowa,
Minnesotan Water Source: Aquier adjacent to the
Missouri River near Vermillion, SDn Federal Funding: Yes (80%)
Mississippi River/Ogallala Aquifer,Various statesn Communities Served: Colorado River Basin
communities, including Las Vegas, andwestern irrigation
n Water Source: Mississippi Rivern
Federal Funding: No
Narrows Project, UTn Communities Served: Sanpete County in Utahn Source: Price River, a tributary o the
Green Rivern Federal Funding: The applicants propose
unding rom the Small ReclamationProjects Act
Ute Lake Project, NMn Communities Served: Eight eastern New
Mexico communitiesn Water Source: Canadian Rivern Federal Funding: Yes (75%)
Santa Fe-Pecos, NMn Communities Served: Santa Fe and other
communities in the Rio Grande Basinn Water Source: Transer o Pecos River water
rights used or agriculturen Federal Funding: No
Eastern Nevada to Las Vegas, NVn Communities Served: Las Vegas and
surrounding communitiesn Water Source: Groundwater rom 5 Basins:
Snake Valley, Spring Valley, Cave Valley, DryLake Valley, and Delamar Valley
n Federal Funding: No
Northern Integrated Supply Project, COn Communities Served: 15 Northern Front
Range water providersn Water Source: Cache la Poudre Rivern Federal Funding: No
Uvalde County – San Antonio PipelineProject, TXn Communities Served: San Antonio, Texasn Water Source: Groundwater rom Edwards
Aquiern Federal Funding: No
Page 11
7/30/2019 Water Pipelines Report
http://slidepdf.com/reader/full/water-pipelines-report 11/46
PAGE 9 | Pipe Dream: Water Supply Pipeline Projects in the West
In recent years, a host o new water conveyance pipeline
projects have been proposed by western water managers
and entrepreneurs. (Please see gure 2 and table B. Appendix
B also includes a summary o the 15 proposed projects
presented in table B, which are at various stages o planning
and construction.)
PRoPosED MAJoR PIPElINE
PRoJECT IN ThE WEsTIn April o 2012, the BOR’s Colorado River Basin Water
Supply and Demand Study released a summary o more
than 140 options that have been submitted by stakeholders
to help resolve water supply and demand imbalances in the
basin.2 Thirty-one percent o the options received by BOR
included increasing available supply through a range o
strategies such as new pipelines, desalination in Southern
Caliornia and Mexico, water recycling, cloud seeding, and
watershed management. The list o pipeline-related options
includes proposals to import water rom rivers including
the Snake, the Columbia, the Clark’s Fork o the Yellowstone
River, the Missouri, the Mississippi, and the Bear. Many o
these proposals appear to be at a conceptual level. (With
the exception o the Mississippi River project, which has
been proposed elsewhere, these projects are not included in
gure 1 and table B. Brie summaries o these proposals are,
however, included in Appendix B.)3
There is a critical dierence between most o the proposed
pipeline projects summarized here and many o those
built in the past century. Most o the pipeline projects in
the past were constructed as part o larger water projects.
In particular, most o the existing projects were built in
conjunction with surace storage projects on major river
systems. These surace storage projects were expensive and
oten came at signicant environmental cost. Nevertheless,
they produced relatively reliable sources o water or pipelinesand aqueducts to carry to distant users. By comparison, most
o the new generation o pipeline projects do not include new
surace storage acilities. As the discussion in the next section
indicates, this change is, to a large extent, the result o the
ar less abundant water sources that this new generation o
pipeline projects propose to tap into.
Together, these new pipeline proposals represent a
signicant new phase in western water policy, which present
critical issues that must be closely examined beore new
projects and those under development are pursued urther.
Key issues include: 1) sustainability o water sources, including
environmental impacts, existing uses and climate change; 2)
transbasin diversions; 3) potential alternatives, including wateruse eciency; 4) renewable and conventional energy use; and
5) the role o ederal agencies. All o these issues are examined
in depth in the ollowing chapters.
Tae b. Prject in te Pipeine
Colorado River Basin Projects Delivery Volume (afy)TransbasinDiversion
Project Cost Length (mi)
Flaming Gorge Pipeline, WY and CO 250,000 Yes $6 BB 500
Lake Powell Pipeline Project, AZ and UT 100,000 No $1.064 BB 158
Yampa River Pumpback, CO 300,000 Yes$3.2 BB to Front Range
$3.9 BB to Denver250
Gallup-Navajo Pipeline Project, NM 35,893 Yes $864 MM 260
Narrows Project 5,400 Yes $40.3 MM 16.8
Total Proposed New Colorado River Diversions 691,293
Other Western Projects
Southern Delivery System, CO 52,900 No $1.1 BB 62
Ute Lake Pipeline Project, NM 16,450 No $500 MM87.5 miles o transmissionpipelines, 94.8 miles olateral pipelines
Santa Fe-Pecos Pipeline, NM 6,600 Yes Unknown 150
Eastern Nevada to Las Vegas Pipeline, NV
84,000 (SNWA projects a
maximum capacity o 217,655) Yes $3.5 BB 300
Cadiz Valley Water Conservation, Recovery and StorageProject, CA
50,000 Yes $536 MM 43
Peripheral Canal/Tunnel, CA Uncertain Yes $12 BB 37
Weber Siphon, WA 30,000 No $48 MM < 2
Lewis and Clark Regional Water System, SD, IA, and MN 24,770 No $433.85 MM 337
Mississippi River/Ogallala Aquier, various states Unknown Yes Unknown Unknown
Northern Integrated Supply Project, CO 40,000 No $490 MM 36 to 62
Uvalde County – San Antonio Pipeline Project, TX 40,000 Yes $250 MM 67 to 75
Page 12
7/30/2019 Water Pipelines Report
http://slidepdf.com/reader/full/water-pipelines-report 12/46
PAGE 10 | Pipe Dream: Water Supply Pipeline Projects in the West
Most previous pipeline projects have included large acilities—primarily surace storage
projects—to capture and store water to be conveyed to end users. By contrast, most o the
proposed pipeline projects summarized in this report are associated with ar less abundant
water sources than were water projects in the past.
III. sUsTAINAbIlITY of WATER soURCEs
Some o the proposed systems would carry water rom
groundwater basins that provide questionable long-term
yield. Others would carry surace water rom basins that
are already undergoing severe water stress. For example,
several o these projects would tap into the Colorado River
and existing Colorado River Basin storage projects (e.g.
Flaming Gorge and Lake Powell) that are in long-term
decline. The proposed Mississippi River project is certainly a
undamentally dierent proposal rom the rest o the projects
located in the more arid West. That project, however, aces a
wide range o additional challenges.
The act that only three o the proposed projects presentedin this report include new proposed surace storage acilities
is primarily because o a realization that there is limited
additional surace water yield to capture in the basins into
which these projects would tap.
As the West pursues ever more distant sources o water, the
issue o sustainability looms over the search or new water
supplies. The landscape acing this new generation o water
supply pipelines is undamentally dierent rom that acing
water managers in the past. A century and a hal ago, most
pioneering western water leaders aced a largely undeveloped
landscape and ew competing uses o water. Today, that
landscape has changed dramatically, leading to signicant
concerns regarding the extent and cost o additional waterrom western rivers and groundwater basins. Water projects
can only generate reliable water supplies i they tap into
reliable sources.
The sustainability o water supplies in the West should be
conronted by policymakers in a ar more ocused ashion
than it has to date. The hot spots or reliable supplies, such
as Los Angeles, Las Vegas, and Phoenix, and other major
metropolitan areas are well known, but medium, small, and
even rural areas are now conronting signicant potential
shortages o water. For example, Congress has just authorized
hundreds o millions o dollars to deliver water to the sparsely
populated Navajo reservation and or the small town o
Gallup, New Mexico. (This project was authorized to resolve
Indian water rights claims, which raises dierent issues rom
other ederally unded projects.)
Meeting water needs is challenged by population growth,
groundwater mining, competing demands or water rom
dierent sectors, ecosystem degradation, and increasingly
rom the eects o climate change. There is increasing
evidence that water use across much o the West, particularlythe Southwest, is signicantly out o balance. Our review
ound that many actors aecting long-term reliability have
been overlooked, or not analyzed in sucient detail. This
chapter summarizes a broad range o issues that aect the
sustainability o water rom proposed pipeline projects.
A. RElIAbIlITY of sURfACE
WATER soURCEs
Many surace water sources in the West are under severe
stress as a result o existing uses. Because the entire fow
o the Colorado and the Rio Grande Rivers are capturedupstream, these large rivers oten run dry beore they reach
the sea. As a result, there is no remaining “new” water to be
captured in these systems.
Indeed, existing supplies are predicted to decline over
time. For example, BOR recently determined that the long-
term average supply in the Colorado River Basin is less than
recent average water use.1 As discussed later, this imbalance
is projected to increase in the uture. As indicated by table
B, recently proposed new pipeline projects represent a
Page 13
7/30/2019 Water Pipelines Report
http://slidepdf.com/reader/full/water-pipelines-report 13/46
PAGE 11 | Pipe Dream: Water Supply Pipeline Projects in the West
Increase
+25%
+10%
+5%
+2%
-2%
-5%
-10%
-25%
Decrease
total additional potential demand o more than 690,000
a annually on the Colorado River. (These are not the only
proposals that would increase diversions rom the Colorado
River Basin. Two other water development projects in
Colorado that do not involve new pipelines, the Windy Gap
Firming Project and the Moatt Collection System Project,
would urther increase transbasin diversions by 33,000 a and
18,000 a per year, respectively.) 2
Because there is no “new” water to capture in the Colorado
River Basin, surace-storage projects would not increasethe net amount o water available or use. As a result, in
the short-term, these additional proposed Colorado River
Basin diversions would likely result in urther reductions o
stored water in a basin that has aced a dramatic reduction
in storage over the past decade. In the long-term, such
projects may increase the pressure on the supplies currently
used by others. Simply put, where there is no available new
supply, the water diverted by new projects must come rom
somewhere. This issue is perhaps most clear in the Colorado
River Basin, but it could be a challenge acing proposed
projects in other basins.
b. GRoUNDWATER MINING
Aquiers are used by many cities in the United States and
represent the source or about 20 percent o the nation’s
resh water withdrawals.3 Groundwater has allowed the
growth o western cities and enabled agriculture in areas
ar removed rom available surace waters. But, in the arid
West, many aquiers are being mined, and as they are drawn
down, current users will join those looking or alternative
water supplies. For example, in the past 50 years, Caliornia’s
Tulare Lake Basin has suered rom more than 60 million
a o cumulative overdrat.4 Additionally, the Ogallala
Aquier, which extends northward rom Western Texas to
South Dakota, is in a state o overdrat. The aquier could
be depleted in only a ew decades i withdrawals continue
unabated.5
The U.S. Geologic Survey (USGS) has determined that
declining groundwater levels is a widespread phenomenon
around the nation.6 As shown in gure 2 and explained in
table B, the Cadiz Valley project proposes to extract up to
50,000 ay—ten times one estimate o long-term recharge.The Las Vegas pipeline would also lead to long-term declines
in groundwater elevations.
I proposed pipeline projects tap into groundwater in an
unsustainable manner, these projects could lead to increased
water usage, ollowed by an inevitable reduction in supply.
Thus, these projects could increase uture water shortages.
This trend toward transbasin projects that rely on
groundwater represents a reversal o an historic pattern o
development. Projects like the Central Arizona Project, the
Central Valley Project, and Caliornia’s State Water Project
were designed in part to provide surace water to replace
unsustainable groundwater pumping. Today, as those surace
sources begin to hit limits, some proposed pipeline projectsare turning back to groundwater sources.
C. ClIMATE ChANGE
Climate change will have a range o impacts on water
supplies in the West. Higher temperatures will increase losses
o water through increased evaporation and transpiration,
which will aect agricultural irrigation and urban landscapes
particularly where turgrass is prevalent. In both cases,
increased temperatures will increase water demands,
figure 3: U.s. Cimate Cange science Prgram Prjectin r Reductin in fw by Mid Century
Page 14
7/30/2019 Water Pipelines Report
http://slidepdf.com/reader/full/water-pipelines-report 14/46
PAGE 12 | Pipe Dream: Water Supply Pipeline Projects in the West
unless there are changes in current management practices.
Changes in precipitation patterns and, in some locations,
total precipitation, are also expected to reduce available
water supplies in much o the West.7 Climate change could
also result in more requent prolonged dry periods and
severe droughts. This could lead to increased challenges or
agriculture, which is the largest consumer o water, and also
or municipal, industrial and other uses.
Additionally, unless current practices change, industrial
cooling could require increased water quantities due toincreased atmospheric and water temperatures.8
The U.S. Climate Change Science Program (USCCSP) has
projected that the Colorado River Basin is likely to ace a
decline in runo o -10 to -25 percent by mid-century as a
result o climate change impacts (see gure 3 ).9 The BOR
has adopted a relatively conservative approach, projecting
a 9 percent decline in water availability by mid-century (see
gure 4).10
The BOR has concluded recently that, by mid century,
the Colorado River may suer a shortall o 3.5 million acre
eet (ma ) or more annually “particularly when considering
potential changes in climate.”11 This trend o increasing
demand and decreasing supply in the Colorado River Basin isshown in gure 4.
These potential climate change eects extend across much
o the West. According to an analysis undertaken or NRDC,
more than 1,000 counties—one-third o the counties in the
nation—are likely to suer rom high to extreme water stress,
figure 4: future Ptentia Crad River bain srtage Prjected y te U.s. bureau Recamatin
Crad River bain study
when considering the results o climate change. Another
1,100 counties were predicted to suer rom moderate
water stress. These counties include much o the West
(see gure 5).12 Finally, climate change may reduce water
availability in groundwater basins in parts o the West.13
In short, climate change may decrease the potential water
available rom both surace and groundwater sources in the
West. Each o the proposed projects discussed here is at a
dierent stage in development. Nonetheless, the treatment o
the challenges posed by climate change or these projects wasmixed and, in general, lacked detail and adequate analysis.
Several o these documents simply mention that climate
change could have an impact on the project, without urther
analysis. For example:
n Lake Powell Project: The drat climate change study or
this project noted uture water shortages are expected
due to climate change.14 Specically, the analysis
concluded that “Additional potential uture curtailments
(due to climate change) could aect deliveries through
the Lake Powell Pipeline.” The analysis also concluded
that the “intake would be designed at an elevation which
would be physically capable o receiving water in times
o low storage.”15 NGOs have criticized the treatmento climate change in the Drat Environmental Impact
Statement (DEIA).16 The document does not quantiy
potential reductions in available water supplies.
n Ute Lake: The BOR’s analysis or the Ute Lake project
Page 15
7/30/2019 Water Pipelines Report
http://slidepdf.com/reader/full/water-pipelines-report 15/46
PAGE 13 | Pipe Dream: Water Supply Pipeline Projects in the West
figure 5: Water suppy sutainaiity Index at te Cunty leve (2050), incuding Cimate Cange Impact
inexplicably concluded that climate change would
lead to additional precipitation in the region.17 This
conclusion runs contrary to the bulk o scientic studies
o the likely eect o climate change on the southwestern
United States, such as the USCCSP, which projected a 5 to
10 percent reduction in runo in this region (see gure 4).n Cadiz Valley Project: This drat Environmental Impact
Report mentions climate change, cites the study
(discussed earlier) prepared or NRDC by TetraTech,
and concludes that local runo could be reduced.18 The
document does not quantiy this potential impact.
n Narrows Project: The BOR drat Environmental Impact
Statement (EIS) does not discuss the availability o
additional water in the Colorado River Basin, nor does
it cite any o the many studies that have concluded
that climate change is likely to signicantly reduce the
availability o water in the Colorado River Basin. Instead,
ollowing a generic discussion o possible climate-induced impacts, the document states that:
“Reclamation has undertaken steps to model
the eects o climate change on water delivery
systems on a regional basis and or its larger
reservoirs, such as Lake Powell and Flaming
Gorge Reservoir. To date, however, models have
not been developed with sucient detail or
sensitivity to capture small projects such as the
proposed Narrows Project.”19
Several o the projects analyzed include only a brie summary
o the range o impacts suggested by dierent climate
models. For example:
n Navajo-Gallup: The Final EIS or this project states that,
as a result o climate change:
“The impact to total runo to the San Juan River
is expected to be rom -38 percent to +8 percent.
These changes would reduce the available water
supply and aect the ability o the system to
meet the Flow Requirements promulgated by the
SJRBRIP. However the changes are suciently
complex that an estimation o the impact on
Flow Recommendations is not possible or a
detailed analysis.”20
This discussion includes a broad range o possible
climate change impacts on fow. However, as in the case
o the Ute Lake project, this discussion does not refect
the scientic consensus regarding the likelihood o areduction in total instream fows in this region.
n Las Vegas Pipeline: The DEIS includes a signicant
discussion o climate change and potential impacts on
regional hydrology and water available or the project.
However, the document concludes that:
“(T)here is insucient inormation available
to predict how changes in climate would
aect the rate o groundwater recharge in the
region. Because o the uncertainties regarding
Page 16
7/30/2019 Water Pipelines Report
http://slidepdf.com/reader/full/water-pipelines-report 16/46
PAGE 14 | Pipe Dream: Water Supply Pipeline Projects in the West
potential eects o climate change on the
groundwater fow system, it was not possible to
provide a reasonable or meaningul simulation
o the combined eects o pumping and
climate change on water resources.”21
Thus, the DEIS mentions the potential impact o climate
change on existing Southern Nevada Water Authority
supplies, but does not quantiy the potential impacts o
climate change on the water available in the groundwater
basins rom which the proposed project would pump.
Only the analysis or the Peripheral Canal included
quantied estimates o impacts on water availability or
the proposed project. The Bay-Delta Conservation Plan
(BDCP), which is analyzing a complex project (described
in Appendix B), including a large proposed tunnel, recently
released an administrative drat Eects Analysis (EA) that
includes a signicant investigation o the likely impacts o
climate change on the Bay-Delta system.22 These impacts
include a general drying trend, changes in the mix o rain
and snowpack, sea level rise, and increased temperatures.
The administrative drat EA includes signicant quantied
reductions in uture water yields rom the preliminary proposed project as the result o climate change impacts,
including changes in hydrology and sea level rise. This
analysis has been greatly acilitated by Caliornia’s extensive
adaptation planning on climate issues. A more detailed
appendix on potential climate change impacts is expected to
be released by BDCP in the near uture.
Predicting the likely impacts o climate change on water
supply availability is more dicult in some parts o the West.
Even in these areas, however, projects can address this risk—
by analyzing a range o scenarios, presenting the bulk o the
conclusions o scientic analyses, and analyzing the relative
condence o estimates rom the scientic community
regarding impacts on water availability.Given the cost o these projects and their importance to the
uture o communities planning them, the stakes are high.
Constructing new pipelines that rely on unreliable water
sources could have signicant long-term risks.
D. sTATE lEVEl ClIMATE AND
WATER ADAPTATIoN PlANNING
In April o 2012, NRDC released a report, Ready or Not:
An Evaluation o State Climate and Water Preparedness
Planning , which evaluates the eorts o all 50 states to
prepare adaptation strategies to address the likely impacts o climate change on water resources. The report includes our
preparedness categories to compare progress made among
states. Those categories include states that have undertaken
comprehensive adaptation planning, states with ragmented
adaptation planning, states with limited adaptation eorts
and those with no adaptation planning. O the 17 western
states, the report concludes that only three—Caliornia,
Oregon, and Washington—are among the nation’s most
prepared states, and adaptation planning eorts have stalled
in some areas in one o those states (Oregon).23 On the other
hand, 13 western states all into the last two categories—
states that have done nothing or very little to prepare or
water-related climate impacts. Those states include Arizona,
Kansas, Idaho, Montana, Nebraska, Nevada, New Mexico,
North Dakota, Oklahoma, South Dakota, Texas, Utah, and
Wyoming. It is noteworthy that most o the states in the
Interior West, where the impacts o climate on water supply
may be most proound, have done little to prepare. Indeed,
ve o the seven Colorado River Basin states are identied
among the states in the last two categories.Comprehensive state adaptation planning addresses a
broad range o the potential impacts o a warming climate
on aquatic ecosystems, water supply, and other water
resources. Many o those issues are central to the evaluation
o proposed pipeline projects. Clearly, addressing all o those
issues comprehensively at the project level is more dicult
without a broad state-wide adaptation ramework. Thus, the
lack o adaptation planning in most western states makes
it more dicult to adequately evaluate the climate issues
related to proposed new conveyance projects.
E. WATER UsER IMPACTsThere are several ways in which poorly conceived pipeline
projects could aect water users. First, in ully-appropriated
river systems, additional diversions will increase pressure on
existing water users. This risk is very clear today on some river
systems, such as the Colorado. Second, using groundwater
rom mined basins to support new urban growth is a recipe
or a uture crisis; by denition a mined basin will not provide
a secure water supply. In Caliornia, which lacks state-wide
groundwater management, and in other states with less than
ully protective groundwater management, such additional
pumping could threaten existing water users. And third, water
users who would rely on poorly conceived pipeline projects
could ace unreliable supplies and uture cost increases.
f. bIoDIVERsITY
The declining health o aquatic ecosystems highlights the
need to protect remaining unctioning ecosystems and to
restore rivers. Especially in the western United States, wildlie
species rely heavily upon aquatic habitats. For example, in
New Mexico, waterways comprise less than 2 percent o the
landscape, but are critical to a signicant number o
wildlie species.24
n Fity-ve percent o all wildlie species and 75 percent o
all vertebrates depend on waterways or survival.
n Eighty percent o all sensitive and specially classied
species (State or Federal threatened and endangered
listed species) rely on waterways at some point in their
lie cycle.
n Desert riparian ecosystems have the highest density
o breeding birds in North America, with at least 400
dierent bird species observed.
Page 17
7/30/2019 Water Pipelines Report
http://slidepdf.com/reader/full/water-pipelines-report 17/46
PAGE 15 | Pipe Dream: Water Supply Pipeline Projects in the West
The decline o aquatic-dependent species is partly or
wholly due to low-fow conditions in many river systems. In
river systems such as the Rio Grande, Colorado, Klamath,
Owens, San Francisco Bay-Delta, and many others, increasing
municipal and agricultural diversions have led to signicant
ecosystem impacts. Proposed projects that would increase
diversions rom already imperiled ecosystems should
careully examine likely current and uture constraints to
protect aquatic ecosystems. Poorly planned projects could
cause additional impacts on already degraded ecosystems,such as the San Francisco Bay-Delta. Such supplies could
also prove to be unreliable in the long-term because o the
likelihood o additional uture regulatory constraints.
G. PoPUlATIoN GRoWTh IN ThE WEsT
The western United States has grown at an explosive rate
over the last two decades. In the 1990’s the population o the
western United States grew by 19.7 percent, and an additional
13.7 percent in the 2000.25 The growth has primarily occurred
in what have been dubbed “urban archipelagos,” such as
Denver, Boise, Albuquerque, Las Vegas, Phoenix, and Tucson.
In the past decade, large metropolitan areas have grown at
more than twice the rate o “micro” areas (those with an urban
area population between 10,000 and 50,000 residents).26
n In the 2000s, the Las Vegas metropolitan area accounted
or 72 percent o Nevada’s 2010 population and 82percent o the state’s growth. Nevada led state population
growth in both decades at 66 percent in the 1990s and
then 35 percent in the 2000s.
n Arizona was second in state population growth, coming
in at 40 percent and 25 percent in the 1990s and 2000s,
respectively.
n Colorado ranked third, with 31 percent in the 1990s,
and 17 percent in the 2000s; and Utah saw growth o 30
percent and 24 percent during these decades.27
Rio Grande at Big Bend National Park, Texas
This growth is orecasted to continue through the 21st
century, with Nevada’s population projected to increase 23
percent by 2030, Colorado’s population projected to increase
by 55 percent by 2040, Arizona’s population to increase nearly
100 percent by 2050, and Utah’s population to increase by
over 110 percent by 2050.28 Caliornia’s population is also
projected to increase 60 percent by 2050.29 Pressure will
continue to grow or reliable water supplies or municipal
and industrial uses as western states become more and more
populated.The long-term consequences o the current economic
slow-down may be dierent across the West. Some regions
may experience lower growth than in recent decades. In these
areas past estimates o uture growth and water demand may
be inaccurate and in need o revision. Other regions may
recover more rapidly and return to rapid growth rates.
TRANsbAsIN DIVERsIoNs
Many o the existing and proposed projects described in this
report involve or would involve transbasin diversions, which
move water across hydrologic basins. Transbasin diversionsare an ongoing source o confict in western water policy.
A community that loses signicant water supplies can ace
a constrained uture and the bitter political divisions over
existing transbasin diversions refect that understanding.
Beore legislatures and courts gave a voice to smaller
communities, their opposition may not have been viewed as
signicant by project proponents, but circumstances have
changed. Even the relatively small pipeline rom a rural area
on the Pecos River to Santa Fe, New Mexico is being opposed
by citizens in the area o origin.30 As water resources become
more constrained across the West, confict around transbasin
diversions can be expected to increase, and will likely have
important implications or potential investments in this kindo traditional water development.
Some pipeline projects that transport water to distant
users rely on rights that are relatively junior in seniority, yet
also supply urban water uses that can be less fexible than
agricultural uses. Thus, new transbasin diversion projects
may present a rising number o signicant challenges,
as they increase reliance on imported water, increase the
challenges involved in bringing river and groundwater
basins into balance and increase the vulnerability o western
communities and economies.
Central Arizona Project
Page 18
7/30/2019 Water Pipelines Report
http://slidepdf.com/reader/full/water-pipelines-report 18/46
PAGE 16 | Pipe Dream: Water Supply Pipeline Projects in the West
T
he issues summarized in the previous chapter address the sustainability and cost o
proposed pipeline projects that would rely on surace and groundwater sources. Increasingly,
alternative approaches, particularly water use efciency, may provide more reliable and
cost-eective strategies to meet uture water supply needs. In designing water supply solutions,
a range o actions should be considered, with a ocus on the most aordable, eective solutions.1
As water managers evaluate ways to meet new needs, they should consider adopting a “least
cost frst” approach to water supply investments, similar in concept to Caliornia’s energy loading
order.2 Such a loading order approach ocuses agency investments on the most cost-eective and
environmentally preerable solutions beore turning to investments that are less cost-eective and
more environmentally damaging.
IV. PoTENTIAl AlTERNATIVEs,
INClUDING WATER UsE EffICIENCY
Analysis o the projects presented in this paper revealed
that most had very limited analysis o eciency as a
project alternative or component. For instance, curiously,
water conservation, as an alternative to the Cadiz Valley
groundwater pumping project, was rejected because the
region to be served by the project is already aggressively
pursuing conservation measures.3 Analysis o the project
ignored the act that some Southern Caliornia water
agencies are planning major additional investments in
conservation and other tools—and that additional cost-
eective investments are possible.4 Other examples o poor
or inadequate analysis or consideration o water eciency alternatives include:
n Navajo-Gallup: Analysis or this project concluded that
water use levels were already so low (110 gallons per
capita per day [gpcd] where piped water is available and
10 to 20 gpcd where water is hauled, among the lowest
levels in the southwest), that eorts to urther increase
conservation and eciency were simply unachievable.5
The analysis did not include an evaluation o agricultural
water conservation alternatives.
n The Lake Powell Pipeline: The alternatives analysis or
the Lake Powell Pipeline included a very limited analysis
o conservation potential, despite per capita water use as
high as 430 gallons per capita per day.6
n Narrows Project: The DEIS or the project states that
270 gallons per capita per day are “required” or Sanpete
County, Utah.7 This level o per capita usage is assumed
to remain unchanged, and that the region will see a 3
percent annual population growth rate until 2050.8 The
discussion o alternatives includes a modest discussion
o agricultural water conservation and no discussion o
opportunities to reduce per capita water use in the Mand I sector, despite very high per capita water use.9
Perhaps most striking o all o the project analyses reviewed
or this report is that or the Peripheral Canal; the current
evaluation o alternatives to canal project does not include an
analysis o water use eciency, water recycling, or other tools
as alternatives to be considered.
Only the Southern Delivery System included signicant
analysis o conservation alternatives. All alternatives
evaluated or this project include a conservation component,
Page 19
7/30/2019 Water Pipelines Report
http://slidepdf.com/reader/full/water-pipelines-report 19/46
PAGE 17 | Pipe Dream: Water Supply Pipeline Projects in the West
perhaps in recognition that water resources in Colorado are
already heavily tapped.10
The growing importance o eciency was highlighted
by the National Research Council, which determined
that the potential or new surace storage in the ColoradoRiver basin is “limited,” and that “(d)eclining prospects
or traditional water supply projects are perhaps more
correctly seen not as an end to “water projects” but as part
o a shit toward nontraditional means or enhancing water
supplies and better managing water demands.”11 Overall,
water management is transitioning rom traditional water
development to a ocus on improving water use eciency.
A. AGRICUlTURAl EffICIENCY
In the West, agriculture continues to be the dominant
consumer o water, continuing patterns that were establishedmany decades ago. Increasing agricultural water eciency
can be achieved by modernizing arming techniques,
including:
n Weather-based irrigation scheduling that uses local
weather inormation to determine the amount o water
needed
n Regulated decit irrigation (inducing water stress in
crops with drought-tolerant lie stages, sometimes
increasing crop quality while reducing irrigation
amounts)
n Switching rom gravity or food irrigation to sprinkler or
drip irrigation systems
n Switching to less water intensive crops
The Pacic Institute has estimated that these strategies can
result in annual savings o nearly 700,000 a in Caliornia.12
These and other management tools could reduce agricultural
water demands across the West and could improve the
sustainability o the agricultural economy. These savings
also could provide or dry-year or permanent transers to
urban water users and the environment. In some areas, long-
term or dry-year allowing can also provide water or other
uses, through voluntary transers. Implementing eciency
measures could also result in signicant savings by avoiding
the cost o additional water development.
b. URbAN WATER UsE EffICIENCY
Many studies have documented the potential water savings
rom investments in urban eciency. Improvements can be
achieved by:
n Upgrading homes that have old, inecient devices
to higher eciency xtures (low-fow toilets and
showerheads, aerating aucets, and low-use appliances)
n Alterations in commercial/industrial water use
(installation o water ecient devices)
n Conversion o lawns and gardens to xeriscaping
n Residential metering and sub-metering
n Leak detection
n Rate structures that better communicate and capture the
value o water (e.g., block rate pricing wherein lower rates
are charged or low to moderate use, creating a direct andimmediate economic incentive or conservation)
Applying these eciencies in Caliornia alone has been
estimated to result in water savings o 320,000 a per year,
2,300 GWh electricity savings per year, and 86.8 million
therms o natural gas savings per year.13
One obvious eciency to be gained is in xing leaks in
delivery systems. According to the Congressional Budget
Oce, many drinking water systems lose as much as 20
percent o treated drinking water each year due to leaks in
piping networks.14 One summary o the ailing inrastructure
or water delivery and treatment systems reports that an
estimated 50 major main breaks and 500 stoppages occur
or every 1,000 miles o pipe each year, amounting to anestimated 50,000 breaks and 500,000 stoppages annually
in the U.S.15 In 2009, Southern Caliornia Edison submitted
a report to the Caliornia Public Utility Commission with
an estimate o the potential water supply benets o leak
reduction in Caliornia.16 The report estimated that 870,000 a
is lost annually to leaks, and that 350,000 a could be cost-
eectively recovered through leak reduction eorts.
Urban eciency can also be increased through Low Impact
Development (LID, or green inrastructure) to mimic natural
inltration systems by capturing and reusing stormwater
runo.17 Runo diversion and capture prior to discharge to
surace waters can be used either to replenish groundwatersupplies through inltration or or gray water uses, like
landscape irrigation and toilet fushing. NRDC has estimated
that more than 400,000 a o water could be developed through
LID investments in Caliornia by 2030.18 In Caliornia, most
runo rom urban areas is discharged into the ocean. In the
Interior West, the capture o rainwater is being recognized
as a useul conservation practice, despite some concerns. In
Colorado and Utah, legislation was passed in 2009 making it
legal or homeowners to capture rainwater.19
Irrigation system in turnip feld
Page 20
7/30/2019 Water Pipelines Report
http://slidepdf.com/reader/full/water-pipelines-report 20/46
PAGE 18 | Pipe Dream: Water Supply Pipeline Projects in the West
Wastewater recycling and reuse is
another method to reduce the use o
imported water. Recycled water is a viable
alternative to imported water or uses that
range rom irrigating gol courses, parks,
and crops, to recharging groundwater,
mixing concrete, and even to frefghting.
The National Research Council recently
released a report that careully endorses
recycling o wastewater, noting the many
cities where it is now practiced.20 The
Caliornia Department o Water Resources
has estimated that 0.9 to 1.4 million a
o recycled water could be developed in
Caliornia by 2030.21 By way o comparison,
the annual water use o the City o Los
Angeles is less than 0.7 million a per year.
It is important to note that water recycling and low-impact
development can reduce downstream fows. Thereore, their
potential to produce “new” water varies across the West, with
the greatest potential in areas where urban runo and treated
wastewater are discharged to the ocean.
The promise o traditional development may be more
alluring to politicians and engineering rms, but experience
over the past two decades has shown that eciency and
reuse is the low hanging ruit.
C. EXAMPlEs of ThE bENEfITs of WATER
UsE EffICIENCY AND oThER Tools
Across the West and the nation, there are many examples o
successul water use eciency programs. For example, the
Pacic Institute has examined the water use o 100 municipal
agencies that rely on Colorado River water and determined
that, between 1990 and 2008, per capita water use in these
agencies declined, on average, by 1 percent per year during
this period. Per capita water use in some cities declined
ar more, including Albuquerque (38 percent reduction),
Southern Nevada (31 percent), Phoenix (30 percent), and San
Diego (29 percent). Twenty-eight o these agencies reduced
their total water deliveries, despite increases in population.22
Additional examples across the nation include:23
n Goleta, Caliornia : Future water shortages rom
population growth and an insucient water source
prompted Goleta to establish a water eciency program
that emphasized plumbing retrots, including high-
eciency toilets, high-eciency showerheads, and
increased rates. The program resulted in a 30 percent
drop in total district water use, a 50 percent drop in
per capita water use, and the city was able to delay a
wastewater treatment plant expansion.24
n Seattle, Washington : The 10-year goal o the Seattle Water
Partnership, which was launched in 2000, is to reduce
per capita consumption 1 percent year and achieve a
total savings o 11 million gallons per day (33.75 a) by
the end o 2010, at a total cost o $55 million dollars.25 By
the end o 2010, the program had achieved cumulativesavings o 9.56 mgd rom residential, commercial and
institutional customers at a cost o $35 million—results
that are more cost-eective than anticipated.
n Orange County, Caliornia : This community uses
advanced treatment technologies to puriy wastewater,
then allows it to percolate into the groundwater
basin or later use as potable water. The Groundwater
Replenishment System acility, which cost $481 million
to build, is the largest water recycling acility in the
world, producing 70 million gallons per day (214 a).26
Orange County is planning to expand this project to
100 million gallons per day (306 a). This system usesapproximately one-third the energy that would be
required to desalinate seawater.27
These examples demonstrate that investments in
eiciency and other water supply tools are proven, cost-
eective approaches to meeting water supply needs that
should be evaluated as a part o planning or any proposed
pipeline project.
Garden sprinkler system
Page 21
7/30/2019 Water Pipelines Report
http://slidepdf.com/reader/full/water-pipelines-report 21/46
PAGE 19 | Pipe Dream: Water Supply Pipeline Projects in the West
D. GAINs IN WATER UsE EffICIENCIEs
TRANslATE INTo IMPoRTANT
ENVIRoNMENTAl bENEfITs
Most major rivers in the United States are stressed by the
competing demands or hydroelectric and thermoelectric
power generation, municipal use, recreation, mineral
production, livestock, agriculture, and wildlie. In the
western United States in particular, population growth
and the dependence on reshwater withdrawals or thosepopulations have resulted in a trend o increasing demands
on increasingly stressed supplies.
Water use eciencies can help ameliorate the stresses o
overuse and curb urther degradation o rivers in a number
o ways.28 For instance, by reducing runo rom agricultural
lands, eciency improvements can lessen pesticides,
ertilizers, salts, and ne sediments rom surace erosion that
can contaminate surace and groundwater sources, increase
treatment costs or downstream users, and degrade sh and
wildlie habitat.
Water conservation can, under some circumstances,
also increase the amount o water let in the stream—also
reerred to as instream fows, which are environmentally important or:29
n Removing ne sediments that can cement river substrate
and smother sh and invertebrate eggs and larvae
n Maintaining suitable levels o water temperature,
dissolved oxygen, and water chemistry
n Establishing stream morphology, including the ormation
and maintenance o river bars and rife-pool sequences
n Maintaining riparian communities, preventing riparian
vegetation rom invading the channel and altering
stream orm and unction
n Flushing waste products and pollutants; and allowing and supporting sh passages and migrations
Investments in water use eciency can also alter the timing
o instream fow, contributing important environmental
benets. Although some withdrawn water may eventually
fow back to a stream system via surace runo or
groundwater percolation, there is a lag time between when
the water is withdrawn and when it fows back into the river.
This timing can be important because the natural lie cycles
o many aquatic and riparian species are adapted to either
avoid or exploit annual and seasonal variations in fows.
Finally, diversions rom waterways can pose a direct threat
to sh and wildlie populations. For example, large pumpsor the Caliornia State Water Project and Central Valley
Project have killed more than 110 million sh over the course
o 15 years, included many threatened and endangered
species, leading to expensive inrastructure retrots, legal
challenges, and controversial environmental restrictions
on withdrawals.30 Thereore, by compensating or lower
diversion levels, water eciency measures can benet sh
and wildlie.
It is important to note that all eciency investments
may not provide the above benets. Increasing water use
eciency can reduce water use, leaving more water available
to meet instream fow needs. However, wastewater reuse
and increases in eciency that increase consumptive use
and reduce return fows can have the eect o reducing
downstream fows. An armative program to protect
instream fows is a necessary component o sustainable water
management.
E. INCREAsED WATER UsE EffICIENCY CAN
REsUlT IN ENERGY EffICIENCY bENEfITs
Eciencies gained in water use requently result in
eciencies gained in energy use. This relationship is
highlighted in a 2011 report by the U.S. Government
Accountability Oce (GAO), which evaluated energy
eciency reductions via improvements in the urban water
liecycle, rom capture and pre-treatment to delivery, use,
post-treatment, and discharge.31 The GAO report detailed
gains to be made in the ollowing areas:
n Process optimization (implementing monitoring andcontrol systems, modiying pumping operations, and
reconguring aeration systems)
n Inrastructure improvements (equipment upgrades,
including right-sizing equipment, and improving
maintenance and leak detection)
n Water conservation
n Better energy management, beginning with energy audits
o treatment acilities
n Improved advanced treatment options to lessen energy-
intensive processes such as ultraviolet disinection
n Redesigning systems to better integrate drinking water, wastewater, and stormwater management
n Use o renewable energy in operations
Caliornia has also investigated the energy benets o
improvements in the water sector. As a result, the state has
included energy and greenhouse gas reductions rom the
water sector in the state’s greenhouse gas reduction strategy.
In that plan, the Caliornia Air Resources Board concluded
that the water sector can contribute 4.8 million metric tons
o carbon dioxide (CO2) emissions reduction by 2020, with
1.4 million metric tons o that reduction coming rom water
use eciency, and 2.0 million metric tons coming rom water
system energy eciency.32 The latter conclusion also suggestsopportunities or water projects and water agencies to install
system improvements, such as in-conduit hydropower
acilities and ecient pumps to reduce energy consumption.
Page 22
7/30/2019 Water Pipelines Report
http://slidepdf.com/reader/full/water-pipelines-report 22/46
PAGE 20 | Pipe Dream: Water Supply Pipeline Projects in the West
V. ENERGY UsE—CoNVENTIoNAl AND RENEWAblEs
The energy costs o capturing, storing, treating, and delivering water are very large. Pumping
and treating water or industrial and urban uses consumes between 2 and 3 percent o the
world’s energy, and can cost up to hal o a municipality’s total operating budget in developing
countries.1 In the United States, one estimate is that upwards o 13 percent o the total energy
consumption is water related.
2
Energy consumption or water delivery and wastewater treatment istypically 30 to 60 percent o U.S. city energy bills.3 The Caliornia Energy Commission has concluded
that in Caliornia 19 percent o electricity use, 30 percent o non-power plant related natural gas, and
88 million gallons o diesel uel are consumed annually or water related uses—including urban and
agricultural water use and including the energy costs related to transportation o water, end use (the
single largest actor) treatment and discharge.4
Long-distance water pipelines can consume large amounts o energy. C r e d i t : B O R
Page 23
7/30/2019 Water Pipelines Report
http://slidepdf.com/reader/full/water-pipelines-report 23/46
PAGE 21 | Pipe Dream: Water Supply Pipeline Projects in the West
Pipelines requently require substantial amounts o energy to
pump and transport water to out-o-basin users. For example,
in Caliornia, the State Water Project’s electricity use represents
the largest single consumer o electricity, amounting to 2 to 3
percent o the state’s entire electricity consumption.
The use o energy to pump water great distances has
another signicant consequence that exacerbates the
environmental consequences o pipelines. The production
o conventional energy requires copious amounts o water.
Energy and water are thus interrelated. Water use consumessignicant amounts o energy. We use energy to access many
water sources, and vice versa. For example, water is diverted
or electricity production at dams or hydroelectric power
generation, and to cool thermoelectric power plants, which
represent the single largest source o water withdrawals in the
United States.5 In addition, water is used in accessing some
natural gas deposits and would be used in rening oil shale.6
Energy is also used to treat water or use to distribute
it within a water district, heat it, and treat wastewater or
disposal. I new water sources, such as saline waters, are
tapped into, energy costs associated with treatment will
rise. Advanced treatment, recharge, and reuse also have
associated energy costs, although not necessarily higher thanimported supplies. Developing technologies to reduce the
energy costs o these processes is important, as is conserving
water—the surest way to reduce energy use.
Analysis o the proposed pipeline projects covered in
this paper reveal that despite the signicant energy costs
o water projects, many did not include a well-developed
analysis o energy consumption. For example, the Ute Lake
Pipeline Project eects analysis (EA) does not include a
detailed discussion o the project’s potential energy use.
The document does include a discussion o the potential
to include renewable energy acilities in the document.
However, to date, the project applicants have chosen not to
pursue renewable power acilities related to the project.The DEIS or the Narrows Project does not include a
discussion o the project’s energy requirements.
The Cadiz Valley Project appears not to include total energy
costs to reach end users. A drat EIR or the project was
released in December o 2011.7 In it, the project is estimated
to use 3,112 kWh/MG o water delivery (or 1,014 kWh/a).8
This number includes groundwater pumping and the energy
required to pump water to the Colorado River Aqueduct
(CRA). This total, however, does not include the energy cost
to pump the water through the Colorado River Aqueduct to
users in Southern Caliornia. The document acknowledges
that the energy used by the CRA is signicant—6.138 kWh/
MG at ull capacity.9 Water rom the Cadiz project would
not, however, be conveyed the ull length o the CRA. The
document does not quantiy the amount o energy that
would be required to convey water through part o the CRA
to end users. The energy discussion in this document ocuses
primarily on comparing energy use by the proposed project
to energy used by the State Water Project, one o the most
energy intensive water projects in the nation. The document
does not compare the proposed project’s energy use to the
many local water supply options in Southern Caliornia that
can consume a raction o the energy used by the SWP.
A number o project documents, such as those or the
Yampa River Pumpback and the Lake Powell Pipeline, include
peak energy requirements,10, 11 rather than total annual energy
requirements and per acre-oot energy requirements.12 Only
a ew projects analyzed projected actors including total
energy use, per acre-oot energy requirements and associated
greenhouse gas emissions. And very ew projects addressed
all o these issues. The per-acre-oot energy requirement
is particularly important to understand the potential orlong-term fuctuations in water costs as a result o changes in
electricity prices.
The Lewis and Clark Regional Water System is projected
to use, at completion, 24.2 GWh/y.13 These energy numbers
are derived rom the project’s Engineering Report analysis
o operating costs, which does not summarize these energy
demands, nor does it include a separate discussion o energy
use. The project’s ederal Finding o No Signicant Impact
does not include an analysis o energy use.
Other projects that did not adequately analyze projected
energy use include:
n
Northern Integrated Supply Project: projected to resultin an energy demand between 0.85 and 1.45 MWh/a.14
n Southern Delivery System: would require 4.63 MWh/a
upon delivery. The energy required to meet 2046 water
demands is projected to average 671 GWh per day, or 245
GWh per year. 15 This per acre-oot energy requirement is
approximately equivalent to the energy cost o desalinated
seawater and approximately 50 percent more than the
energy required to pump water rom the Bay-Delta to
Southern Caliornia. 16 This system would demand the
equivalent o the average daily per capita residential
electricity use o over 12,500 Coloradans.17
n
Las Vegas Pipeline: The June 2011 BLM DEIS preparedor the project indicates that the proposed pumping
acilities will require the continuous use o 97.2 MW o
power, including 51.9 MW or groundwater wells and
associated acilities.18 Power or the project would be
provided by the Silverhawk Generating Station, a natural
gas-powered acility with a capacity o 520 MW, 25
percent o which is owned by SNWA. The DEIS concludes
that this electrical generation will result in the release
o 327,000 tons o carbon dioxide per year—equal to the
emissions rom the electricity use o 35,000 homes.19
The document adds that these energy requirements and
greenhouse gas emissions may be reduced through the
use o solar power and in-conduit generating turbines.These estimates do not include energy use per acre-oot.
n Peripheral Canal: The BDCP concluded recently that the
preliminary proposed project (a 15,000 cs tunnel project)
would result in increased energy demands or pumping
ranging rom 2,027 to 2,319 GWh/y.20 This compares with
current net CVP energy use or water pumping o 814
GWh/y and SWP net energy use or pumping o 6,327
GWh/y. Thus, the project would represent nearly a one
third increase in combined energy use.
Page 24
7/30/2019 Water Pipelines Report
http://slidepdf.com/reader/full/water-pipelines-report 24/46
PAGE 22 | Pipe Dream: Water Supply Pipeline Projects in the West
The BDCP is pursuing a “dual conveyance” approach to
pumping, in which some CVP and SWP water would be
pumped through a new canal or tunnel, and other water
would continue to be pumped rom the existing CVP and
SWP diversion points in the South Delta. As indicated
above, water pumped through a new tunnel would require
a signicant amount o additional energy. This would add
to the SWP’s already large energy ootprint, particularly or
Delta water delivered to Southern Caliornia.
Some o these projects have not yet moved to theenvironmental analysis stage, so the energy costs have
not been considered. The Santa Fe-Pecos Pipeline, or
example, would climb nearly 4,000 eet in elevation to
reach its destination.21 This would be a lit double that o
the Caliornia State Water Project’s 2,000 oot lit over the
Techachapi Mountains—an extraordinarily energy-intensive
water project.22
The Mississippi River Project also has many options or
water diversion, delivery and exchange rom the Mississippi
River. Nevertheless, pumping water to “mile high” Denver,
one possible destination o a pipeline rom the Mississippi,
would include very high energy requirements. For example,
the City o Omaha, which lies at the confuence o the PlatteRiver and the Mississippi, lies 4,000 eet lower than Denver, at
an elevation o 1,090 eet.
In short, many o these proposed projects would be very
energy intensive. It is important to note that, in contrast,
some water use eciency alternatives can save signicant
amounts o energy.
A. ThE fEDERAl GoVERNMENT’s RolE IN
ThE ENERGY/WATER CoNNECTIoN
The ederal government currently does not compile
inormation on energy use by water projects, except or thequantity o hydropower rom BOR projects that is used to
deliver ederal water. There is limited inormation on current
and proposed projects concerning the substantial amount o
energy consumed by these acilities.
As discussed earlier, some pipeline projects require
large amounts o energy. The use o ossil uels to provide
this energy could increase greenhouse gas emissions,
contributing to the very warming that threatens western
water supplies. President Obama ordered ederal agencies to
create inventories o their greenhouse gas emissions under
Executive Order 13514 (October 5, 2009) and the Guidance
on Federal Greenhouse Gases Accounting and Reporting
(October 6, 2010). However the Department o Interior hasnot included in its inventory the greenhouse gas emissions
that result rom its water acilities or the projects that the
BOR unds. 23
The ederal government is also required by the National
Environmental Policy Act (NEPA) to provide environmental
reviews o major ederal actions that signicantly aect
the quality o the environment. Unortunately this NEPA
review is sometimes not suciently probing, with respect to
water alternatives or the use o renewable energy to power
conventional acilities. For example, the Navajo-Gallup
EIS does not include the use o renewable energy in its list
o alternatives.
b. RENEWAblEs AND WATER
PRoJECT ENERGY UsE
Pumping and moving water is very energy intensive and
using renewable sources to provide at least some o the
energy would be benecial. Much o the western UnitedStates receives abundant sunshine and wind. As a result,
the West has signicant potential or the development
o renewable energy sources, which signicantly reduce
greenhouse gas emissions. However, renewable energy
projects must be careully designed and selected. It is
important to note that solar technologies have very dierent
water requirements. For example, dry-cooled thermoelectric
solar can require some make up water or boiler systems
and water to wash heliostats. However, wet-cooled solar
has dramatically greater water requirements. As a result,
the Caliornia Energy Commission has adopted a policy
that represents a de acto prohibition on wet cooling or
solar acilities in Caliornia’s desert regions, except in very
limited circumstances. 24 In addition, large-scale wind, solar,
and transmission acilities must be cited careully to avoid
environmental impacts. 25
When determining whether wind or solar energy should
be used, cost may be a controlling actor. In 2009, renewable
energy accounted or 8 percent o total U.S. energy
consumption. O that percentage, only 9 percent was rom
wind, and 1 percent was rom solar energy (the remainder is
provided by hydropower, biomass, and geothermal sources).2
Although wind energy accounts or more energy production
than solar in the United States, solar energy technology is
improving rapidly. Large scale solar adoption is becoming more easible all o the time.27
Renewable energy sources, such as photovoltaic solar,
wind, and in-conduit hydropower to help power water
projects are increasingly being pursued across the world. A
ew examples include:
n Caliornia water agencies, currently the largest customer
group or solar installations, with 20 MW o generation
currently in operation or under construction, and nearly
50 MW in the proposal stage.28
n The Palmdale, Caliornia Water District, which uses a 950
kW wind turbine at its water treatment acility, providing
the majority o the energy required or operation o theacility. The district has installed a solar array system at
its shop acilities buildings to oset power costs.29
n The Las Vegas Valley Water District, operating solar
photovoltaic systems at six reservoirs and pumping
station sites since June 2007, with a combined capacity
o 3.1 MW. The system cost $23.4 million to build and
is being paid back through annual energy savings
o approximately $725,000 and through the sale o
renewable energy credits to local electric utilities,
Page 25
7/30/2019 Water Pipelines Report
http://slidepdf.com/reader/full/water-pipelines-report 25/46
PAGE 23 | Pipe Dream: Water Supply Pipeline Projects in the West
The Los Angeles aqueduct, unlike most proposed projects, does not require energy or pumping.
yielding a payback period o 11.6 years or a system with
a projected lietime o 35 years.30
n The largest seawater desalination project in the Southern
Hemisphere, which opened in 2006 in Perth, Australia,
with a daily capacity o 140,000 cubic meters. The acility is powered by energy rom a wind arm, making the acility
the largest desalination project in the world whose energy
needs are provided by renewable energy sources.31
C. RENEWAblEs, sToRAGE,
AND GRID INTEGRATIoN
It is important to note that many renewable energy sources
(e.g., wind and solar) are not continuous. Combining these
two sources could help some water agencies use renewable
power to meet water pumping needs. In either case, it could
be useul to have the ability to store renewable power orlater use. The primary technology to achieve this end is
pumped storage.
Some existing water projects have utilized pumped
storage projects, which have traditionally been designed to
allow water projects to generate and sell power during peak
demand periods and pump water rom a lower reservoir to a
higher one when power is less expensive. Such projects could
be designed to smooth out the peaks in wind and solar power
production, or example by pumping water during daylight
hours and periods o high winds. When energy is needed
during times o high demand, water in the higher elevation
reservoir would be released to generate electricity.
Caliornia’s State Water Project, or example, includesone o the largest pumped storage projects in the nation,
combining Pyramid Lake (1,495 MW) and Castaic Lake.32
Few new pumped storage acilities have been built since
the 1990s, but with the recent increased ocus on renewable
energy sources, pumped storage is again being pursued. For
example, permitting or three new systems is underway in
Oregon, the largest o which will have a 500 MW capacity and
storage potential o 16,000 MWh.33 Similar projects are being
evaluated in Caliornia, Wyoming, Hawaii, and elsewhere.34
Other newer technologies are emerging to store energy rom
renewables, including the use o compressed air, molten salt,
concrete and ice. 35
The use o renewable power or pumped storage should notbe used as justication or unsustainable or un-economic
water projects. However, existing water pipelines and uture
pipeline projects should be designed to include renewable
power as a source. For example, Caliornia’s State Water
Project consumes approximately 1.4 billion kWh annually
rom a coal-red plant in Nevada that it partially owns. This
power can and should be replaced with renewable sources.
Page 26
7/30/2019 Water Pipelines Report
http://slidepdf.com/reader/full/water-pipelines-report 26/46
PAGE 24 | Pipe Dream: Water Supply Pipeline Projects in the West
Federal agencies, including the BOR and the Corps o Engineers, have long played a central role
in the planning and development o water projects. In addition to the role o ederal agencies in
issuing permits and in energy issues (discussed in Chapter V), several current ederal activities
have important implications or proposed pipeline projects.
VI. ThE RolE of fEDERAl AGENCIEs
A. fEDERAl PRINCIPlEs AND GUIDElINEs
In December o 2009, the White House CEQ issued the
Proposed National Objectives, Principles and Standards or
Water and Related Resources Implementation Studies. These
Principles and Guidelines were rst adopted in 1973. They
serve as the oundation o ederal water planning eorts, and
have been largely unchanged or more than 25 years.1 The
original Principles and Guidelines guide the work o the BOR,
the U.S. Army Corps o Engineers, the Natural Resources
Conservation Service, and the Tennessee Valley Authority.
However, the revised drat document is expanded in scopeand is intended to cover all ederal agencies that undertake
water resource projects.
The Principles and Guidelines document does not yet
address the ull range o issues related to potential ederal
involvement in proposed water pipeline projects. For
example, the drat Principles and Guidelines document does
not use the word “energy” once. It does, however, list some
o its goals as to “protect and restore…the environment
while encouraging sustainable economic development” and
to avoid “adverse impacts to natural ecosystems wherever
possible and ully mitigating any unavoidable impacts.”2 The
incorporation o the changing western water landscape and
the issues discussed in this report would provide valuableguidance or ederal agencies that evaluate and und water
projects, including the BOR. Modernized Principles and
Guidelines should guide ederal agency involvement in all
types o water projects, including proposed pipeline projects.
b. fEDERAl fINANCING
With the high cost and diminished yield o traditional
water development, alternative water supply strategies
are increasingly cost-eective, including water recycling,
improved groundwater management, urban stormwater
capture and particularly urban and agricultural water use
eciency.3 Many o these projects are now more cost eective
than some traditional water development projects.
There is no single rule governing how much the ederal
government will contribute to states and local governments
to assist in the nancing o pipeline projects, or or othermeans o providing water. There has been an assumption
among many state and local leaders that the ederal
government will be involved in some ashion in large scale
water projects, although this unding may be ad hoc. For
example, the ederal government is committed to unding
75 percent o the Ute Lake Project in eastern New Mexico,
while the state government and involved communities are
each contributing 15 percent and 10 percent, respectively.4
The basis or ederal involvement is unclear; there are no
tribal water interests in the area. In many other areas, ederal
unding involvement is at substantially lower levels.
In the past, the ederal government (through the Bureau o
Reclamation and the Corps o Engineers) has devoted tens o billions o dollars to highly-subsidized water storage projects.
As a result o declining water availability, environmental
degradation and dramatically escalating costs, most people
agree that the 20th century dam building era is drawing to a
close. For example, in the Colorado River Basin, that era may
Page 27
7/30/2019 Water Pipelines Report
http://slidepdf.com/reader/full/water-pipelines-report 27/46
PAGE 25 | Pipe Dream: Water Supply Pipeline Projects in the West
have reached an end with the construction o the Animas La
Plata project in the Upper Basin and the Drop 2 Reservoir on
the Lower Colorado. Through the Bureau o Reclamation’s
Title XVI program and water conservation programs, the
Bureau has begun moving away rom its traditional role as a
dam-builder. Given the water challenges acing the West, the
Bureau’s role is likely to increasingly ocus on eciency and
reuse strategies.
Alternative water solutions, such as water use eciency,
may prove to be more reliable over the long-run, less likely to contribute to uture water conficts, less environmentally
damaging and more cost-eective. However, because the
Bureau does not provide such generous nancing or water
use eciency and other solutions, the ederal government’s
current nancing policies are encouraging more damaging,
expensive and unreliable solutions. I continued, this practice
is likely to encourage additional proposals or pipeline
projects around the West. Over the long-term, by encouraging
what may prove to be unsustainable sources, this ederal
unding could increase uture water shortages.
Many proposed projects lack a clear nexus to strong ederal
interests to justiy unding rom ederal taxpayers. Such
connections include resolving Native American water rightsclaims and addressing endangered species issues where there
is no clear responsible party. However, there is no ederal
interest in projects that place additional stress on over-
allocated surace supplies or overtapped groundwater basins.
C. ColoRADo RIVER bAsIN WATER sUPPlY
AND DEMAND sTUDY
This analysis has revealed that the Colorado River Basin is
the ocus o the largest concentration o proposed pipeline
projects in the West. Specically, Appendix B summarizes
ve proposals or new pipelines to divert water rom theColorado River and another seven proposals to divert water
into the Basin. Many o these proposed projects are large
individually. In addition, the cumulative impact o these
projects could be signicant.
The BOR’s Colorado River Basin Water Supply and Demand
Study is scheduled or completion in September o 2012.
That eort is working to characterize the water management
challenges acing the Basin. It is not yet clear i the Basin
Study eort will continue or what other planning eorts will
continue the eort begun by the Basin Study. Whatever the
orum, it is important that the projects and issues identied
in this report, including potential cumulative impacts, beaddressed careully.
Page 28
7/30/2019 Water Pipelines Report
http://slidepdf.com/reader/full/water-pipelines-report 28/46
PAGE 26 | Pipe Dream: Water Supply Pipeline Projects in the West
VII. CoNClUsIoNs
n Surace and groundwater sources and aquatic
ecosystems in the West are under signicant stress.
n Climate change is likely to reduce the available water in
much o the West, and present additional challenges to
maintaining healthy aquatic ecosystems.
n Rising costs and the declining availability o cost-
eective “undeveloped” water has reduced the numbero traditional surace storage projects in the West.
n There is a new generation o pipeline projects proposed
around the West. Many o these projects rely on water
sources that are ar less reliable than past water projects.
n Some o these projects have the potential to increase
confict and harm other existing water users.
n By increasing reliance on unsustainable water sources,
some o these projects could increase the water supply
and economic vulnerability o communities in the
long term.
n The analysis o proposed pipeline projects requently
overlooks key issues related to cost, reliability o water
sources, energy impacts and alternatives, particularly
improvements in water use eciency.
n The ederal government’s traditional role in unding
water inrastructure in the West, and its emerging role in
unding new pipeline projects, encourages inrastructure
solutions such as pipeline projects, rather than more
cost-eective solutions such as water use eciency.
There is a ederal interest in resolving Native American
water rights claims and addressing endangered species
issues where there is no clear responsible party. However,there is no ederal interest in projects that place
additional stress on overallocated surace supplies or
overtapped groundwater basins.
n Pipeline projects can be very energy intensive. The use
o ossil uel sources to provide this energy would urther
increase greenhouse gas emissions and urther increase
the pressure on western water resources by exacerbating
climate change.
n The volatility o energy prices suggests that the ultimate
volumetric cost o water rom new energy-intensive
pipeline projects could be highly variable.
n The use o renewable energy could reduce the carbonootprint o water conveyance projects in the West.
Page 29
7/30/2019 Water Pipelines Report
http://slidepdf.com/reader/full/water-pipelines-report 29/46
PAGE 27 | Pipe Dream: Water Supply Pipeline Projects in the West
NRDC recommends that local, state, and ederal agencies
utilize the ollowing approach in investigating and pursuing
proposed pipeline projects:
n New water supply projects in the West should be
designed to reduce, rather than increase, the current
imbalances in water use—such as groundwater overdrat
and overcommitted surace water sources.
n A beneciary pays approach to the nancing o water
projects is the best way to internalize the costs o water
projects and encourage ecient water use.
n Proposed pipeline projects should include an analysis o
all o the ollowing issues:
• The reliability of proposed water sources, including
existing demand, current constraints on proposed
surace sources, the sustainability o proposed
groundwater pumping, dry-year reliability,
ecosystem health and likely changes in hydrology
and demand caused by climate change.
• Potential impacts to existing water users andcommunities.
• Potential impacts of proposed new transbasin
diversions on water use in the basin o origination.
• The capital and operating cost of the proposed
project, in comparison with the benets. (This
should include an analysis o the external costs o
proposed projects, such as environmental impacts.)
• The alternatives to the project, particularly urban
and agricultural water use eciency, water recycling,
urban stormwater capture, and voluntary water
transers. Water managers should consider adopting
a “least cost rst” approach to water supply investments, similar in concept to Caliornia’s energy
loading order.
• Energy use and energy sources,including per acre-
oot and total annual energy use.
• Potential new greenhouse gas emissions.
n Energy or uture pipeline projects should be provided
through investments in renewable energy sources. (Such
VIII. RECoMMENDATIoNs
use o renewable power, however, should not justiy
uneconomic and unsustainable projects.) Water agencies
should also invest in renewable sources to provide the
energy required or existing pipeline projects, such as
Caliornia’s State Water Project.
A. loCAl AGENCIEs As a result o constraints on the ederal budget, it likely that
the vast majority o the unding or most new water supply
projects in the West will be borne by local agencies. Local
water users, o course, have a great deal at stake i they rely
on unsustainable sources. Ultimately, these communities
could suer increased water shortages and higher water
rates i they pursue poorly designed projects. Local agencies
also have the ability to pursue and invest in a broad range o
water solutions. (As explained below, this is not true, at the
moment, or ederal agencies.) In addition to considering
general recommendations above, local agencies should
ensure that rate payers are provided with inormation
regarding the above issues and the range o alternatives
beore water utilities make decisions on proposed new
pipeline projects.
b. sTATE AGENCIEs
State agencies oten play critical roles in studying nancing and implementing water supply projects.Projects such as Caliornia’s State Water Project representthe most dramatic examples. However, the growing needor cooperation among Colorado River Basin states toaddress the current and growing imbalance between
supply and demand also demonstrates the clear role orstate involvement in thoughtully addressing imbalancesbetween supplies and demand. In addition to considering the general recommendations above, state agenciesshould ensure the ollowing:
n Where proposed projects could have impacts to other
water users and across state lines, state water agencies
should actively investigate the issues summarized
above, in collaboration with tribal governments,
Page 30
7/30/2019 Water Pipelines Report
http://slidepdf.com/reader/full/water-pipelines-report 30/46
PAGE 28 | Pipe Dream: Water Supply Pipeline Projects in the West
environmentalists, and other stakeholders.
n All western states should undertake ambitious and
comprehensive eorts to prepare or the potential
impacts o climate change on water resources. These
adaptation eorts should address a ull range o potential
impacts on aquatic ecosystems, water supply and other
resources. Such adaptation planning eorts, as discussed
in NRDC’s report “Ready or Not: An Evaluation o State
Climate and Water Preparedness Planning ,” will allow
signicantly improved evaluations o proposed new conveyance projects and available alternatives.
n Scarce state water supply unding should be ocused on
the most aordable and reliable projects—those that
increase the eciency o water use and re-use.
C. fEDERAl AGENCIEs
The ederal government plays a ar larger role in water policy
than is oten realized. The BOR and the Corps o Engineers
nance and manage water storage and power on major
western rivers. Federal environmental laws aect water
policy, as does ederal management o tribal water. But one
o the most important roles in the next decades will be in
helping to determine how the western United States will
respond to the pressures bearing on western water resources.
Simply put, the ederal government can encourage local
communities to manage demand and support research into
new water technologies, or it can provide ederal unding
or water pipelines across great distances to water stressed
communities. The latter approach may, in many cases,
prove more costly, more environmentally damaging and less
reliable in the long-term. We suggest a more clearly dened
and limited ederal role. In addition to considering general
recommendations above, ederal agencies should ensure
the ollowing:
n Federal unds should be ocused on projects where
there is a strong ederal nexus, such as resolving Native
American water rights claims and addressing endangered
species issues where there is no clear responsible party.
n Scarce ederal water supply unding should also be
ocused on the most aordable and reliable projects —
those that increase the eciency o water use and re-use. Federal agencies should no longer und traditional
water development, particularly in regions where
such additional traditional development would be
unsustainable.
n Given the large number o proposed projects to divert
water rom the Colorado River, as well as into the Basin,
the BOR’s Colorado River Basin Water Supply and
Demand Study and subsequent eorts should address
the cumulative potential impacts o the potential
projects summarized in this report.
n President Obama’s Executive Order on Greenhouse
Gasses mandates that agencies seek means o reducing their carbon emissions. One o the stated goals o the
Order is to “make reduction o greenhouse gas emissions
a priority or Federal agencies.” Federal agencies,
particularly the Bureau o Reclamation and the Corps o
Engineers, should implement this Executive Order with
respect to their water responsibilities by reporting the
energy use and associated greenhouse gas emissions o
projects that they und.
n The new Principles and Guidelines or Water and Land
Related Resources (Principles and Guidelines) that are
under development by ederal agencies should address
the issues discussed in this paper, to give decision-makers
a more complete understanding o proposed projects.In particular, these principles should address the energy
issues raised by water projects, including proposed
pipeline projects.
Page 31
7/30/2019 Water Pipelines Report
http://slidepdf.com/reader/full/water-pipelines-report 31/46
PAGE 29 | Pipe Dream: Water Supply Pipeline Projects in the West
PIPElINE PRoJECTs IN oPERATIoN
Throughout the West, there is a vast number o existing water
projects that include pipelines and tunnels as signicant
project acilities. The ollowing list includes 19 o the more
prominent existing pipeline projects in the West. This
appendix does not include many large projects that do not
include signicant pipelines. It also excludes many small
projects. These projects were selected to include the largest
pipeline projects, as well as broad geographic representation.
This list provides a valuable baseline against which to
compare proposed new pipeline projects.
Little Snake-Douglas Creek Project: This project has been
in use by Cheyenne, Wyoming since the 1960s. Water is
collected in the Little Snake River Basin, located west o the
Continental Divide, transerred across the Divide through a
tunnel, and stored in Hog Park Reservoir, on the eastern side
o the Divide. This water is provided to the City o Cheyenne
through exchanges with other water users on tributaries o
the North Platte River.1 Stage II water diversion construction
began in 1982, enlarging reservoirs, laying new pipelinesand increasing diversions.2 Stage I and Stage II were
operated together or the rst time in 1992.3 The anticipated
average annual water yield rom Stage I and Stage II
together is 21,000 a.4
The Colorado-Big Thompson Project: This diversion project
collects Western Slope water rom the headwaters o the
Colorado River and diverts it to the Front Range and Plains. It
was built between 1938 and 1957, and provides 213,000 a o
water to 30 cities and towns. The water is used to help irrigate
approximately 693,000 acres o northeastern Colorado
armland. It consists o 35 miles o tunnels, 95 miles o canals,
and 700 miles o transmission lines. The project spans 150miles east to west, and 65 miles rom north to south.5
Additional Colorado Transbasin Diversions: Five additional
diversions rom the Western Slope to the Front Range
collectively divert approximately another 150,000 a per year
rom the Colorado River Basin.6 These diversions include
Grand River Ditch, Harold D. Roberts Tunnel, Homestake
Tunnel, Moat Water Tunnel, and Twin Lakes Tunnel.
IX. APPENDIX A
The San Juan-Chama Project: This project moves water rom
the San Juan River basin to the Rio Grande basin, providing
water to Albuquerque and Santa Fe, New Mexico. Overall,
the San Juan-Chama project provides 86,210 a per year to
water users in New Mexico, one-ourth o which is used or
irrigation.7
The project utilizes water rom the Navajo, Little Navajo, and
Blanco Rivers, all upper tributaries o the San Juan River, andtransports it to the Rio Grande basin. Water rom the rivers
is transerred via pipelines o varying lengths, the longest o
which is 12.8 miles, rom Heron Dam on Willow Creek. The
reservoir has a capacity o 401,320 a, or more than our years
o ull supply o the project.8
Central Utah Project (CUP): The CUP was originally
authorized as a BOR project in 1956. It is a complex project
with several authorized units, utilizing water rom the
Bonneville and Green River basins. The Bonneville Unit
is the largest and most complex o these units, including
transbasin water diversions, 10 reservoirs, and more than
200 miles o aqueducts, tunnels, and canals. Major reservoirsinclude Starvation Reservoir, with a capacity o 167,000
a; Jordanelle Reservoir, with a capacity o 363,000 a; and
Strawberry Reservoir, with a capacity o 1.1 ma. Strawberry
Aqueduct is 37 miles long and collects water rom tributaries
o the Dechesne River to deliver to Strawberry Reservoir.9 The
Jordan Aqueduct is 36 miles long and delivers approximately
70,000 a o water annually to the Salt Lake Valley rom the
Provo River and Jordanelle Reservoir. The CUP is working
to complete a system o more than 50 miles o additional
pipelines in the Utah Lake Basin.10 Collectively, the Bonneville
unit’s acilities are designed to provide municipal residents
with a total o 107,000 a o water annually, with another
111,000 a or agricultural water users.11
Central Arizona Project (CAP): The CAP was begun in 1973
and is among the largest and most expensive aqueduct
systems in the United States. It includes 335 miles o
aqueducts, 14 pumping stations, and 15 miles o tunnels that
are designed to lit and move 1.5 ma o water annually rom
Lake Havasu to central and southern Arizona.12,13 The project
Page 32
7/30/2019 Water Pipelines Report
http://slidepdf.com/reader/full/water-pipelines-report 32/46
PAGE 30 | Pipe Dream: Water Supply Pipeline Projects in the West
is substantially complete, but there are plans to build several
distribution systems or Native American communities which
could take another 10 to 20 years.14
The Colorado River Aqueduct: Completed in 1939, this
242 mile long aqueduct provides Southern Caliornia with
approximately 1.2 ma o water annually rom the Colorado
River. It includes nine reservoirs, ve pumping stations, 63
miles o canals, 92 miles o tunnels, and 84 miles o buried
conduit and siphons.15
Los Angeles Aqueduct: There are two Los Angeles aqueducts.
The rst was completed in 1913 or less than $23 million, and
includes 223 miles o aqueduct. The second was completed
in 1970. It cost nearly $89 million and includes 137 miles
o aqueduct.16 Both pipelines are gravity ed. Today, these
projects provide Los Angeles with an average o 254,000 a
per year, although there is signicant variation in deliveries
among years. 17
California’s State Water Project: This project includes 34
storage acilities and more than 700 miles o pipelines and
canals.18 In addition to providing water or agriculture in the
Central Valley through the Caliornia Aqueduct, the project
includes a series o pipelines, canals, and tunnels serving urban areas. The project includes the South Bay Aqueduct,
which is composed o a series o pipelines that reach rom
the Sacramento-San Joaquin Delta to Alameda and Santa
Clara Counties in the southern part o the San Francisco Bay
Area.19 The North Bay Aqueduct carries water to cities on the
northern edge o the San Francisco Bay Area.20 The Coastal
Branch reaches to Caliornia’s Central Coast, near the City
o Santa Barbara.21 Finally, the project includes the west and
east Branches, which pump water 2,000 eet up and over the
Techachapi Mountains to Southern Caliornia. On average,
the SWP delivers 2.4 ma o water.22
The Central Valley Project (CVP): The BOR’s CVP consistso 20 dams and reservoirs, 11 power plants, and 500 miles
o major canals, as well as conduits, tunnels, and related
acilities.23 The vast majority o this water is consumed
by agriculture in the Central Valley, however, the San
Felipe Division carries water through a 48 mile pipeline to
agricultural water users in the Central Coast area and to
urban water users in Santa Clara County.24 Between 2005 and
2010, the CVP delivered an average o 5.3 ma per year.25
The Hetch Hetchy Aqueduct: San Francisco’s 160-mile long
aqueduct diverts water rom Hetch Hetchy Reservoir in
Yosemite National Park and delivers about 165,000 a o Sierra
Nevada water per year to San Francisco, as well as parts o
San Mateo, Santa Clara, and Alameda counties. Annually, the
system generates more than 2 billion kwh o hydropower. The
aqueduct is dependent entirely on gravity to convey water. It
was built in the 1920s and 1930s.26
The Mokelumne Aqueduct: The 91 mile long Mokelumne
Aqueduct supplies water to the East Bay communities inCaliornia, including Oakland, Berkeley, Richmond, and parts
o Alameda and Contra Costa County. Initial construction
began in the 1920s and additional aqueducts and pipelines
were built as recently as the 1960s.27 Pardee Reservoir holds
210,000 a o water, which is used to regulate supply in winter
and spring. The district has rights o up to 364,000 a o water
on the Mokelumne River. 28
Portland Water Bureau: Three pipelines take water
approximately 26 miles rom two reservoirs in the Bull
Run watershed to provide domestic supplies or Portland,
Oregon.29 The project diverts approximately 132,000 a
annually.30
Cedar River: The City o Seattle receives some o its water
supply rom two 28-mile long pipelines rom the Cedar River
watershed, diverting approximately 92 million gallons per
day, or 103,500 a annually, to serve Seattle and surrounding
communities.31 The city also receives water rom the Tolt
River watershed.
Mni Wiconi Rural Water System: Providing water or Native
American communities in South Dakota, this project has
been in development or more than 20 years; construction
is scheduled to be completed in 2013 at a cost o more than
$400 million. The water system will provide communities
with Missouri River water to replace contaminatedgroundwater. Through a network o 4,400 miles o pipelines,
the project will serve more than 51,000 people in 10
counties.32 When completed, the system will provide between
8,591 and 12,474 a annually.33 The ederal government is
nancing the construction costs—some $350 million—
to provide water to the three reservations served. Local
ratepayers are required to pay back a low-interest state loan
and cover ongoing maintenance and operations costs.34
Page 33
7/30/2019 Water Pipelines Report
http://slidepdf.com/reader/full/water-pipelines-report 33/46
PAGE 31 | Pipe Dream: Water Supply Pipeline Projects in the West
X. APPENDIX b
PRoJECTs “IN ThE PIPElINE”
As described in Chapter 2, there is a growing list o proposed
water pipeline projects throughout the western United
States. The projects summarized in this appendix do not
represent a comprehensive list. They are also at various
stages o completion, ranging rom the early conceptual
stage o planning to ongoing construction. The ollowing
projects present a cross-section o pipeline projects
currently under consideration in the West.
ColoRADo RIVER bAsIN PRoJECTs
Five new water conveyance projects have been proposed
in the Colorado River Basin. Together, these projects would
increase diversions rom an already-overtapped Colorado
River Basin by more than 690,000 a per year—more than
double Nevada’s 300,000 a allocation.
Flaming Gorge Pipeline: A pipeline rom Flaming Gorge
reservoir has been proposed or several years, also dubbed
the Colorado-Wyoming Cooperative Supply Project and the
“Million Pipeline,” ater project supporter and entrepreneur
Alex Million. The project will likely mirror a prior proposal or
a 500-mile long pipeline to move approximately 250,000 a o
water annually rom the Green River above Flaming Gorge
to the Front Range. The project has been proposed by two
entities—Aaron Million and the Colorado-Wyoming Coalition,
a group o cities and utilities (primarily in Colorado). In
addition, the State o Colorado has sponsored a task orce
to investigate the potential benets and drawbacks o the
project.1 In February 2012, the Federal Energy Regulatory
Commission (FERC) dismissed the application or this project
as premature.2
On May 17 2012, FERC denied a request toreconsider the project.3
Lake Powell Pipeline Project: This project would provide
100,000 a annually o Colorado River water to communities
in Utah. It would include 120 miles o 66-inch diameter
pipeline rom the Lake Powell Glen Canyon dam site in
Arizona to Sand Hollow Reservoir near St. George, Utah,
and potentially an additional 38 miles o 30-inch diameter
pipeline rom Sand Hollow to Cedar City.4 The most current
cost estimate is almost $1.1 billion as o June 2008.5 In March
o 2012, the Utah Legislature rejected a proposal to dedicate
Utah sales tax revenues to the project.6 The EIS or the project
is scheduled to begin in mid-2012.7
Yampa River Pumpback: This proposed project, which was
the subject o a easibility study by the Northern Colorado
Water Conservancy District, would consist o a new 500,000
a reservoir and 250 miles o tunnels and pipelines through
the Continental Divide to carry up to 300,000 a o water tothe Front Range.8 The project could cost close to $4 billion. It
stalled in 2008, ater the completion o an initial study.
Navajo-Gallup Project: Congress authorized this project to
provide water to the Navajo Nation and nearby communities.
The proposed project will provide water or approximately
250,000 people by the year 2040. It will take water via
diversions rom the San Juan River in northern New Mexico
and divert it to the eastern section o the Navajo Nation, the
southwestern part o the Jicarilla Apache Nation, and the
City o Gallup. The proposed project would provide these
locations with a total o 35,893 a o Colorado River Basin
water annually.9
The preerred alternative or the Navajo-Gallup Project,
known as the San Juan River Public Service Company o
New Mexico alternative, includes 260 miles o pipeline, 24
pumping plants, and two water treatment plants. Based
on a 2007 estimate, the cost o the project is $864 million,
a considerable increase rom the 2005 estimate o $716
million.10 In 2009, Congress authorized construction o the
project, in part to resolve Indian water rights issues.
The EIS was issued March 2007.11 The EIS did not include
an analysis o the cost o a water conservation-based
alternative.12 The BOR has considered the use o renewable
energy in this project, but it would be more expensive thanthe hydropower that is available to the project.
Narrows Project: This project would divert water rom the
Price River (a tributary o the Green River in the Colorado
River Basin) to Sanpete County, Utah. It was rst investigated
by the Bureau o Reclamation in the 1930s.13 The proposal
would represent a transbasin diversion rom the Colorado
River Basin to the Great Basin and would involve three
tunnels, totaling 16.8 miles, as well as a new Narrows
Dam and 17,000 a reservoir.14 The project would divert a
Page 34
7/30/2019 Water Pipelines Report
http://slidepdf.com/reader/full/water-pipelines-report 34/46
PAGE 32 | Pipe Dream: Water Supply Pipeline Projects in the West
maximum o 5,400 a per year and an average o 5,136 a.
O that average amount, 855 a would be or municipal and
industrial uses, and 4,281 a or irrigation.15 Construction
costs or the project would total $40.3 million dollars, with
a proposed ederal loan providing a portion o this cost. The
document does not include a discussion o annual operating
costs.16 A drat EIS or the project was issued in March o 2010.
oThER WEsTERN PRoJECTs Although the Colorado River Basin has the most proposed
pipeline projects, there are additional projects located in
basins across the rest o the West:
Northern Integrated Supply Project: This project, proposed
by the Northern Colorado Water Conservancy District, would
provide up to 40,000 a o water rom the Cache la Poudre
River. The project would include a new 170,000 a Glade
Reservoir and a system o pipelines ranging rom 36 to 62
miles long to serve 15 water providers.17 The project would
cost approximately $490 million.18 A drat EIS was issued in
April o 2008 and a supplemental document is currently in
preparation.19
Mississippi River/Ogallala Aquifer: Pat Mulroy, general
manager o the Southern Nevada Water Authority, recently
reintroduced the decades-old idea o capturing foodwater
rom the Mississippi River and diverting it to the Ogallala
Aquier beneath the Central Plains in order to replenish it.
The Ogallala Aquier, which covers some 174,000 square miles
and includes portions o eight states, is suering rom high
levels o groundwater overdrat. This project could dwar
both the Hoover and Glen Canyon Dams in terms o cost.
This proposal would employ a complex series o multi-state
water transers, designed to reduce the transbasin use o
Colorado River water on the Front Range, reeing up wateror other communities in the Colorado River Basin, including
Las Vegas. Mulroy has said that, “We can’t conserve our way
out o a massive Colorado River drought” and believes that
pipeline projects such as this are necessary to prevent water
shortages. Years o study and multi-state negotiations would
be needed i this project were to be undertaken. A project o
this size and complexity aces an uncertain uture.20
Southern Delivery System: Designed to serve Colorado
Springs and surrounding communities, the Southern
Delivery System in Colorado will use a 62 mile pipeline
to transport 52,900 a per year rom the Arkansas River.
Construction began in 2010, and the system is slated to begin
delivering water in 2016.21
Ute Lake Project: In 2008, the Ute Water Commission granted
approval or a acility to take Canadian River water rom Ute
Lake or use in eight eastern New Mexico communities. The
project is now estimated to cost approximately $500 million.22
A drat environmental assessment concluded that there is
no signicant environmental impact to the project, despite
the energy required to pump and deliver water. The project
is designed to include 87.5 miles o transmission pipelines
ranging rom 30 to 54 inches and 94.8 miles o lateral
pipelines, rom 4 to 36 inches.23 The project is designed to
deliver 16,450 a o water per year.24 Proponents intend or the
ederal government to pay most o the costs o the project.
Although the project has been authorized, very little ederal
unding has been appropriated. Construction has begun in
an eort to secure the ederal unding. In this analysis, the
average elevation gain rom the Ute Lake Reservoir to the
seven participating community members o the Eastern
New Mexico Regional Water System project was estimatedto be approximately 535 eet. In May o 2012, local citizens
concerned about impacts on lake levels and the local
economy led two requests in state court or injunctions to
block construction o the project.25
Uvalde to San Antonio Pipeline: Private investors have
proposed a pipeline that would transport water rom the
Edwards Aquier in Uvalde County Texas to San Antonio. The
pipeline would be 67 to 75 miles long and would transport up
to 40,000 a o water per year. The project is estimated to cost
about a quarter o a billion dollars and the nancing would
be raised privately. There currently is a ban on pipelines to
transport Edwards Aquier water rom Uvalde County to
another county, but investors are trying to persuade statelawmakers to make an exception or this project.26
Santa Fe-Pecos Pipeline: Another proposed pipeline would
provide water to homes and businesses in Santa Fe and other
communities in the Rio Grande Basin rom Fort Sumner,
near the Pecos River. This project, which was proposed by
a private developer, would include 150 miles o pipeline.
Five armers in the Fort Sumner area have agreed to
transer rights to 6,600 a o Pecos River water to Santa Fe.
Opposition to the project includes local, state, and area
water agencies.27
Eastern Nevada to Las Vegas Pipeline: Nevada received a
300,000 a entitlement rom the Colorado River when it wasallocated among seven western states. Rapid growth has
led Las Vegas to seek new sources o water. The Southern
Nevada Water Authority (SNWA) is pursuing plans or an
almost 300-mile long pipeline project to pump water rom
groundwater basins in eastern and central Nevada (and
rom groundwater resources shared with Utah) per year. The
project would cost $3.5 billion to build.28 However, a 2011
report that the SNWA described as a “worst case” analysis
concluded that the project could cost as much as $7.3 billion
to build.29 The Nevada Supreme Court held up the project
in early 2010 when it ound violations o the rights o people
who had opposed the water rights or the proposed project.
(In 1989, SNWA’s predecessor led applications or these
water rights.) The Nevada Supreme Court ruled in 2010 that
the State Engineer must re-notice SNWA’s remaining water
rights or public comment.30 In March o 2012, the State
Engineer granted SNWA permission to divert 84,000 a per
year rom our rural valleys in Eastern Nevada, less than the
126,000 a that SNWA had originally sought.31 The DEIS or
the project includes projections o long-term drawdown o
groundwater levels.32
Page 35
7/30/2019 Water Pipelines Report
http://slidepdf.com/reader/full/water-pipelines-report 35/46
PAGE 33 | Pipe Dream: Water Supply Pipeline Projects in the West
Cadiz Valley Project: Cadiz, a publicly-traded rm, is seeking
to develop a project that would pump groundwater rom a
closed Mojave Desert basin in Southern Caliornia through
a 43-mile pipeline to the Colorado River Aqueduct. The
project would deliver up to 50,000 a per year to participating
water districts, which, according to Cadiz, include the Santa
Margarita Water District, Three Valleys Municipal Water
District, Suburban Water Systems, Golden State Water
Company, and Jurupa Community Services.33 The project,
which could also include a second phase with a storagecomponent, is a revised version o a project that was rejected
by the Metropolitan Water District o Southern Caliornia
in 2002.34 A retired United States Geological Services
hydrogeologist has concluded that annual groundwater
recharge is only approximately 5,000 a per year.35
The Peripheral Canal/Tunnel: The Bay-Delta Conservation
Plan (BDCP) is preparing a Habitat Conservation Plan
or Caliornia’s Bay-Delta estuary. BDCP is a state-ederal
partnership, nanced by water users. Under state law,
the BDCP plan must advance the dual goals o restoring
ecosystem health and increasing water supply reliability
or the Central Valley arms and Southern Caliornia and
Bay Area cities that depend on deliveries rom the Delta.It must also advance a state policy o reducing reliance on
Delta water supplies. BDCP is studying a possible new Delta
conveyance acility to carry water rom the Sacramento River
in the North Delta to the State Water Project and Federal
Central Valley Project pumps in the South Delta. (In 1982,
Caliornia voters deeated a previous proposal to construct
a Peripheral Canal in the Delta.) Stakeholders have oered
dierent, and sometimes conficting, reasons to construct a
new Delta acility, including reducing the risk to water supplies
rom sea level rise, earthquakes and potential Delta levee
ailures, increasing water exports, and helping to restore the
Bay-Delta estuary and its sheries. Many alternative Delta
conveyance approaches have been proposed, including
strengthening existing levees and building a pipeline, aqueduct
or tunnel with capacities ranging rom 3,000 to 15,000 cs.
At the moment, the BDCP is ocused primarily on a 15,000
cs, 37-mile long acility that would consist o twin tunnels
under the Delta, each 33 eet in diameter.36 The amount o
water that such a acility would produce is uncertain. Water
users who rely on Delta exports are seeking a signicant
increase in Delta pumping up to 5.9 million a—a 1.2 ma
increase, on average—compared with currently authorized
pumping levels.37 However, the State Water Resources Control
Board has determined that restoring the Bay-Delta ecosystem
would require a signicant reduction in total water diversionsin comparison with current levels.38 To date, the BDCP has
been unwilling to investigate water use eciency, water
recycling, and other water strategies in its development o
alternatives. The capital cost o the construction o a tunnel
could be $12 billion or more. Total annual costs o the
BDCP, including capital cost or a new acility, operations,
maintenance, habitat restoration, and nancing could reach
$948 million or 50 years.39
Weber Siphon: Currently under construction by the BOR,
the Weber Siphon is a $48 million project that would more
than double the capacity o this portion o the Columbia
Basin Project, adding 1,950 cs to create a total conveyance
capacity o 3,650 cs where the project crosses Interstate 90.40
This short project is designed to deliver 30,000 a o water to
10,000 acres o agricultural land in the Odessa Subregion in
Washington State.41 The project was unded by the American
Recovery and Reinvestment Act.
Lewis and Clark Regional Water System: When completed,the system will provide drinking water through 337 miles
o pipeline to over 300,000 people in South Dakota, Iowa,
and Minnesota.42 Construction is scheduled to be complete
in 2019, although progress has been slowed by the recent
ban on congressional earmarks.43 The ederal government
is providing 80 percent o the unding or the $430 million
dollar project.44 The project relies on water rom wells that tap
into an aquier adjacent to the Missouri River near Vermillion
South Dakota. Lewis & Clark’s member systems will use this
new source o water to either replace or supplement existing
sources o supply. The proposed maximum or the completed
system is 45 million gallons per day.45 The project’s 2002
Final Engineering Report projected the system’s demands toaverage 22.1 million gallons per day by 2030 (approximately
24,770 a per year).46
ColoRADo RIVER bAsIN
sTUDY PRoPosAls
As reerenced in Chapter 2 o this paper, the ollowing
projects were included in the BOR’s Colorado Basin Study
as stakeholder submissions. These supply augmentation
proposals include signicant new pipeline conveyance
acilities. Additional inormation about the submissions can
be ound on the bureau’s website.47
These projects are summarized below, but were not included
in gure 2 or table B in the body o the report.
Snake River Import: This proposal involves diverting water
rom the Snake River and delivering it to the Green River
Basin. Project submitters approximated that this could
provide 33,000 ay o water using existing storage, or 155,000
ay i new storage were constructed. This project would
require 26 miles o pipe and 6 miles o tunnel. The project’s
cost is estimated at $250 million, with $13 million per year
o operations and maintenance (O&M) costs. The water is
estimated to use 15.7 kWh per 1,000 gallons. This would
represent an energy ootprint o more than 5 mWh per a—
greater than the energy required to desalinate seawater.
Missouri River Import: This conceptual proposal advocates
that Missouri River and Mississippi River water be diverted
to the Colorado River, and that Nevada and Arizona
subsidize desalination plants along the Caliornia coast in
exchange or an equivalent share o Colorado River water
currently held by Caliornia.
Page 36
7/30/2019 Water Pipelines Report
http://slidepdf.com/reader/full/water-pipelines-report 36/46
PAGE 34 | Pipe Dream: Water Supply Pipeline Projects in the West
Bear River to Ham’s Fork Creek Import: This option involves
diverting water rom the Bear River, and diverting and
pumping it to the Green River Basin. The proposal estimates
that the project could provide 50,000 ay o water, that it
would require 11.5 miles o pipeline, and that it would cost
$314 million to build.
Clark’s Fork to Green River Import: This import would
divert water rom Clark’s Fork o the Yellowstone River in
Wyoming and deliver it to the Green River Basin. The project
submission estimates that this project would provide 75,000ay. Pipeline and tunnel length estimates range rom 140 to
225 miles. Energy requirement estimates range rom 83,000
hp to 90,000 hp.
Columbia River via a Submarine Pipeline: This proposal is
or an under-sea pipeline rom the mouth o the Columbia
River to Castaic Lake or MWD usage and to the All-American
Canal to oset diversions rom the Colorado River. The
proposal suggests studying diversions o 1,000,000 ay.
Missouri River Reuse Project: This proposal is to divert up
to 600,000 ay o water rom the Missouri River or reuse
within the Missouri River Basin o Kansas and Colorado. The
water would be used to ll surace reservoirs and recharge
depleted aquiers. Conveyance o the water across Kansas
and eastern Colorado would be through single or parallel
large-diameter pipelines.
Mississippi River to Colorado Front Range Pipeline:
This proposal would deliver 675,000 ay o water rom the
Mississippi River near Memphis to the Colorado Front Range
using the largest pipeline available—one 144” pipe. The
alignment option would require 660 miles o pipe and 150
miles o canal, as well as pumping stations capable o liting the water rom 200 eet above sea level to elevations between
4,000 and 5,800 eet above sea level. The total cost o the
project is estimated at $15.8 billion with annual O&M costs
at $541 million per year. Energy usage would be between 850
and 1,000 megawatts o generation. Mississippi River water
could be “moved” into the Colorado River Basin through
a series o exchanges with existing water users east o the
Rockies, reeing up Colorado River water that is currently
diverted to the Front Range.
Page 37
7/30/2019 Water Pipelines Report
http://slidepdf.com/reader/full/water-pipelines-report 37/46
Page 38
7/30/2019 Water Pipelines Report
http://slidepdf.com/reader/full/water-pipelines-report 38/46
PAGE 36 | Pipe Dream: Water Supply Pipeline Projects in the West
Endnte
CHAPTER I
1 Ronnie Cohen, Barry Nelson, Gary Wol, Energy Down the Drain ,
NRDC, 2004, Pages 2 and 37. Retrieved rom http://www.nrdc.org/water/conservation/edrain/edrain.pd ; R. C. Wilkinson,
Methodology or Analysis o The Energy Intensity o Caliornia’s
Water Systems, and an Assessment o Multiple Potential Benefts Through Integrated Water-Energy Efciency Measures , Exploratory
Research Project Supported by: Ernest Orlando Lawrence Berkeley
Laboratory, Caliornia Institute or Energy Eciency, January 2000,Retrieved rom http://eec.ucdavis.edu/events/documents/water-energy_ucsb_methodology-or-analysis-o-the-energy-intensity-o-
ca-water-systems.pd .
2 U.S. Bureau o Reclamation, “Bureau o Reclamation – Dams,”Retrieved rom http://www.usbr.gov/projects/dams.jsp , Published
January 24, 2008.
3 Caliornia Department o Water Resources, “Caliornia State Water
Project Overview,” Retrieved rom http://www.water.ca.gov/swp/ Published August 11, 2010.
CHAPTER II
1 As refected here, these existing projects represent a cross-section
o signicant water projects in the West that include pipelines as
important project acilities. Included here are the largest o thesepipeline projects, as well as additional projects, in order to include
greater geographic coverage. There are many additional smaller
projects, and others that rely on open canals rather than pipelines.
There are scores o surace storage projects across the West that donot include long-distance water conveyance acilities. The sample
o existing pipeline projects presented here provides a baseline o
historical water development against which to evaluate proposeduture projects.
2 Colorado River Basin Study Option Descriptions. Increase Supply.
March 12, 2012. Retrieved rom http://www.usbr.gov/lc/region/
programs/crbstudy/Descriptions_Report_27MAR2012.pd Accessed April 4, 2012.
3 The proposed projects presented here exclude a wide range o water
development proposals that do not include signicant new pipelineconveyance acilities. Clearly, the list presented in this paper is
clearly not a comprehensive list o the transbasin conveyance
projects under consideration by stakeholders in the West.
CHAPTER III
1 Monty Schmitt, Barry Nelson, Bobby McEnaney, Between a Rock
and Dry Place , Natural Resources Deense Council; 2011. Page 16.Retrieved rom http://www.nrdc.org/water/les/oilshalecobasin.
pd .
2 U.S. Bureau o Reclamation. Windy Gap Firm Project Drat Environmental Impact Statement, Executive Summary. DES 08-30.
Page ES-2. August 2008; Moatt Collection System Project Update.
Denver Water. Published July 18, 2011. Retrieved rom http://www.
water.denver.co.gov/SupplyPlanning/WaterSupplyProjects/Moat/Update/ Accessed March 21, 2012.http://www.northernwater.org/
docs/WindyGapFirming/WgpDeisExecSum.pd.*
3 Barber, N.L., Summary o estimated water use in the United States in 2005 : U.S. Geological Survey Fact Sheet 2009–3098 (2009), Retrieved
rom http://pubs.usgs.gov/s/2009/3098/.
4 Barry Nelson, “The 60 Million Acre-Foot Hole – A Memorable
Moment rom the Caliornia Assembly Groundwater Hearing,”NRDC Switchboard Sta Blog. Retrieved rom http://switchboard.
nrdc.org/blogs/bnelson/the_60_million_acre-oot_hole.html
Published February 2, 2011.
5 David E Kromm, Ogallala Aquier, Water Encyclopedia: Science and
Issues, Retrieved rom http://www.waterencyclopedia.com/Oc-Po/Ogallala-Aquier.html.
6 U.S. Geological Survey, Groundwater Watch, Retrieved rom http://
groundwaterwatch.usgs.gov/Net/OGWNetwork.asp?ncd=lwl
7 Barry Nelson, Monty Schmitt, Ronnie Cohen, Noushin Ketabi, In Hot Water , Natural Resources Deense Council; July 2007. pg.5.
Retrieved rom http://www.nrdc.org/globalWarming/hotwater/
contents.asp.
8 U.S. Environmental Protection Agency, Water Availability, Retrieved
rom http://www.epa.gov/climatechange/eects/water/availabilityhtml Published July 22, 2010.
9 Lettenmaier, D., D. Major, L. Po, and S. Running, 2008. WaterResources. In: The eects o climate change on agriculture, land
resources, water resources, and biodiversity in the United States.
A Report by the U.S. Climate Change Science Program and the
Subcommittee on Global Change Research. Washington, DC., USA,362 pp. Retrieved rom http://www.climatescience.gov/Library/
sap/sap4-3/nal-report/Water_SAP_4.3_Letter.pd Accessed June
18, 2012.
10 Ibid; U.S. Department o the Interior, Bureau o Land Reclamation.
Colorado River Basin Water Supply and Demand Study, June 2011,
retrieved rom http:// usbr.gov/lc/region/programs/crbstudy/
Report1/ StatusRpt.pd Accessed July 30, 2011.
11 U.S. Bureau o Reclamation, Colorado River Basin Water Supply and Demand Study: Public Input Sought or Options to Resolve
Water Supply and Demand Imbalances Fact Sheet, Retrieved romhttp://www.usbr.gov/lc/region/programs/crbstudy/FactSheet_
ImbalanceOptions.pd .
12 Chen, L., Girvetz, E., Mauerer, E. P., Nills, W. B., Grieb, T. M.,
Evaluating Sustainability o Projected Water Demands Under FutureClimate Change Scenarios, Prepared by Tetra Tech Inc., Laayette, CA
or the NRDC, July 2010, Retrieved rom http://rd.tetratech.com/
climatechange/projects/doc/Tetra_Tech_Climate_Report_2010_lowres.pd .
13 Zack Guido, Impacts: Water Supply , Southwest Climate Change
Network, Retrieved rom http://www.southwestclimatechange.org/
impacts/people/water-supply Published October 21, 2008.
14 Utah Board o Water Resources, Lake Powell Pipeline Drat Climate Change Study Report 19: Climate Change, March 2011, Retrieved
rom http://www.riversimulator.org/Resources/Purveyors/LPPipeli
ne/19DratClimateChangeReport.pd .
15 Id. at p.5-2.
16 See, http://www.powellpipelineacts.org/images/pd/Pipeline/
FERC_comments_FINAL_5-6-11_PDFJane.pd .
17 U.S. Bureau o Reclamation, Eastern New Mexico Rural Water SystemEnvironmental Assessment, Page 138. January 27, 2011. Retrieved
rom http://www.usbr.gov/uc/albuq/envdocs/ea/EasternNM/
Final-EA.pd .
18 Santa Margarita Water District, Cadiz Valley Water Conservation,Recovery, and Storage Project, Drat EIR, Page 4.19.13, December
2011, Retrieved rom http://www.smwd.com/assets/downloads/cadiz/Cadiz_Drat_Environmental_Impact_Report.pd .
19 U.S. Bureau o Reclamation, Narrows Project Supplemental Drat
Environmental Impact Statement. Page 1-25. March 2010. Retrieved
rom http://www.narrowsproject.com/Narrows_Drat_EIS_
March_2010.pd .
20 U.S. Bureau o Reclamation, Navajo-Gallup Water Supply Project
Final Environmental Impact Statement . Chapter V, Page 281,
July, 2009, Retrieved rom http://www.usbr.gov/uc/envdocs/eis/navgallup/FEIS/vol1/Volume1.pd .
Page 39
7/30/2019 Water Pipelines Report
http://slidepdf.com/reader/full/water-pipelines-report 39/46
PAGE 37 | Pipe Dream: Water Supply Pipeline Projects in the West
21 U.S. Bureau o Land Management, Southern Nevada Water Authority
Drat Environmental Impact Statement , Chapter 3, Section 3.3,
Water Resources, Aected Environment. Page 3.3-86. June 2011,http://www.blm.gov/pgdata/etc/medialib/blm/nv/groundwater_
development/snwa/drat_eis0.Par.93602.File.dat/g_3.3_Water_
Resources.pd Accessed on April 12, 2012.
22 Bay Delta Conservation Plan Drat Eects Analysis – Administrative Drat. February 2012. Page 5.2-6. Retrieved rom http://
baydeltaconservationplan.com/Libraries/Dynamic_Document_
Library/BDCP_Chapter_5_-_Eects_Analysis_2-29-12.sfb.ashx .
23 Ben Chou, Steve Fleischli, and Jenna Schroeder, Ready or Not: An Evaluation o State Climate and Water Preparedness Planning,New
York: NRDC, April 2012, Retrieved rom http://www.nrdc.org/water/
readiness/les/Water-Readiness-ull-report.pd.
24 National Wildlie Federation, Weakening the Clean Water Act: What
it Means or New Mexico, 2004, Retrieved rom http://www.nw.
org/wildlie/pds/CleanWaterActNewMexico.pd ; Partners or Fish
and Wildlie Program, 2005 Program Summary ,September 2005,Retrieved rom http://www.ws.gov/southwest/es/NewMexico/
documents/PFW_NM_summary_2005.pd ; Comprehensive
Wildlie Conservation Strategy or New Mexico (2006), New MexicoDepartment o Game and Fish, Santa Fe, New Mexico. 526 pp +
appendices; Partners or Fish and Wildlie Program. 2005 Program
Summary, September 2005, Retrieved rom http://www.ws.gov/southwest/es/NewMexico/documents/PFW_NM_summary_2005.pd .
25 U.S. Census Bureau, Population Change and Distribution: 1990 to 2000, Census 2000 Brie, Issued April 2001, C2KBR/01-02, Retrieved
rom http://www.census.gov/prod/2001pubs/c2kbr01-2.pd Accessed April 10, 2012.
26 U.S. Census Bureau, Population Distribution and Change: 2000 to
2010, Census 2010 Brie, Issued March 2011, C2010BR-01, Retrieved
rom http://www.census.gov/prod/cen2010/bries/c2010br-01.pd Accessed April 10, 2012.
27 All statistics rom the Census Bureau’s 2001 and 2011 publications
reerenced above.
28 Nevada State Demographer’s Oce, Nevada County Population Projections 2010 to 2030, October 1, 2011, Retrieved rom http://
nvdemography.org/wp-content/uploads/2011/09/2011-
Projections-Email-attachment-090911.pd (Accessed April 10,
2012); Colorado State Demography Oce,2010 Census dataor Colorado, Retrieved rom http://dola.colorado.gov/dlg/
demog/2010censusdata.html(Accessed April 10, 2012); ArizonaOce o Employment and Population Statistics, Population
Projections, Retrieved rom http://www.workorce.az.gov/
population-projections.aspx ( Accessed April 10, 2012); UtahGovernor’s Oce o Planning and Budget, Demographic and
Economic Projections, January 10, 2008, Retrieved rom
http://www.governor.utah.gov/dea/projections.html
(Accessed April 10, 2012).
29 Julie Grimm, “State nixes water-rights transer or proposed pipeline
rom Fort Sumner to Santa Fe,” The New Mexican, February 9, 2012,
Retrieved rom http://www.santaenewmexican.com/localnews/State-nixes-water-rights-transer-or-pipeline-project.
30 Ibid.
CHAPTER IV
1 Cooley, H., Christian-Smith, J., Gleick, P., Cohen, M., Heberger,M., Caliornia’s Next Million Acre-Feet: Saving Water, Energy, and
Money , Pacic Institute, Oakland, CA, September 2010, Retrieved
rom http ://www.pacinst.org/reports/next_million_acre_eet/next_million_acre_eet.pd .
2 Caliornia Energy Commission, Implementing Caliornia’s Loading
order or Electricity Resources, Sta Report, CEC-400-2005-042, July
2005, Retrieved rom http://www.energy.ca.gov/2005publications/CEC-400-2005-043/CEC-400-2005-043.PDF Accessed March 21,
2012.3 Santa Margarita Water District, Cadiz Valley Water Conservation,
Recovery and Storage Project. Drat Environmental Impact Report. Chapter 7: Alternatives Analysis, p.7-7. December 2011. Retrieved
rom http://www.smwd.com/assets/downloads/cadiz/Cadiz_Drat_
Environmental_Impact_Report.pd .
4 Barry Nelson, “Southern Caliornia’s New Wave o Local Supplies,”
Switchbooard NRDC Sta Blog. Retrieved rom http://switchboard.
nrdc.org/blogs/bnelson/southern_caliornias_new_wave_1.html
Published February 3, 2012.
5 Navajo Nation, City o Gallup, Jicarilla Apache Nation, U.S. Bureau
o Reclamation. Navajo-Gallup Water Supply Planning Report and
Final Environmental Impact Statement at IV-4. July 2009. Retrievedrom http://www.usbr.gov/uc/envdocs/eis/navgallup/FEIS/index.
html.6 Utah Board o Water Resources, Lake Powell Pipeline Drat
Study Report 22 Alternatives Development, Pages 1-3, March2011, Retrieved rom http://www.riversimulator.org/Resources/
Purveyors/LPPipeline/22DratAlternativesDevelopmentReportV3.
pd Accessed March 21, 2012.
7 Ibid. Page 1-7.
8 U.S. Bureau o Reclamation, Narrows Project Supplemental Drat
Environmental Impact Statement. Page 1-11. March 2010. Retrieved
rom http://www.narrowsproject.com/Narrows_Drat_EIS_March_2010.pd .
9 Ibid. Page 2-47.
10 U.S. Bureau o Reclamation, Southern Delivery System
Environmental Impact Statement, Pages 94-95. February 2008,Retrieved rom http://www.sdseis.com/les/FEIS/FEIS_text3.pd .
11 National Research Council, “4 Prospects or Conserving
and Extending Water Supplies,” Colorado River Basin Water
Management: Evaluating and Adjusting to Hydroclimatic Variability . Washington, DC: The National Academies Press, 2007.
1. Retrieved rom http://www.nap.edu/openbook.php?record_
id=11857&page=115.
12 Cooley, H., Christian-Smith, J., Gleick, P., Cohen, M., Heberger,M., Caliornia’s Next Million Acre-Feet: Saving Water, Energy, and
Money . Pacic Institute, Oakland, CA. September 2010, Retrieved
rom http ://www.pacinst.org/reports/next_million_acre_eet/next_million_acre_eet.pd .
13 Ibid.
14 Congressional Budget Oce, Future Investment in Drinking Water and Wastewater Inrastructure , November 2002, Retrieved romhttp://www.cbo.gov/sites/deault/les/cboles/tpdocs/39xx/
doc3983/11-18-watersystems.pd .
15 Sustainable Water Resources Management, Volume 3: Case Studies
on New Water Paradigm. EPRI, Palo Alto, CA and Tetra Tech: 2009,1020587. Retrieved rom http://www.decentralizedwater.org/
documents/DEC6SG06a/Case%20Studies%20on%20New%20
Water%20Paradigm.pd .
Page 40
7/30/2019 Water Pipelines Report
http://slidepdf.com/reader/full/water-pipelines-report 40/46
PAGE 38 | Pipe Dream: Water Supply Pipeline Projects in the West
16 Water Systems Optimization, Inc, Prepared or Southern Caliornia
Edison, Secondary Research or Water Leak Detection Program and
Water System Loss Control Study, Final Report, December 2009.
17 Natural Resources Deense Council, “Water Eciency Saves Energy:
Reducing Global Warming Pollution Through Water Use Strategies,”
March 2009.
18 Garrison, N., Wilkinson, R., Horner, R., How Greening Caliornia Cities can Address Water Resources and Climate Challenges in the 21st
Century, New York: Natural Resources Deense Council, August 2009.
Page 4. Retrieved rom http://www.nrdc.org/water/lid/les/lid.pd .
19 Kirk Johnson, “It’s Now Legal to Catch a Raindrop in Colorado,” The New York Times, June 28, 2009, Retrieved rom http://www.nytimes.
com/2009/06/29/us/29rain.html?_r=2Accessed March 20, 2012.
20 National Research Council, Water Reuse: Potential or Expanding the Nation’s Water Supply Through Reuse o Municipal Wastewater ,
Washington, DC: The National Academies Press, 2012, Retrieved
rom http://www.nap.edu/catalog.php?record_id=13303 .
21 Department o Water Resources, Caliornia Water Plan, Update 2009, Volume II – Resource Management Strategies, Chapter
11 – Recycled Municipal Water, Page 7, Retrieved rom http://
www.waterplan.water.ca.gov/docs/cwpu2009/0310nal/v2c11_recycmuniwtr_cwp2009.pd .
22 Michael Cohen, Municipal Deliveries o Colorado River Basin Water ,
Oakland: Pacic Institute, June 2011, Retrieved rom http://www.
pacinst.org/reports/co_river_municipal_.
23 U.S. Environmental Protection Agency, Oce o Water. Cases
in Water Conservation: How Efciency Program Help Water
Utilities Save Water and Avoid Costs. EPA832-B-02-003. July
2002. Retrieved rom http://www.epa.gov/WaterSense/docs/utilityconservation_508.pd.
24 Ibid.
25 Seattle Water Supply System Regional 1% Water Conservation
Program, Saving Water Partnership Annual Report and Ten Year Program Review, July 2011, Retrieved rom http://www.savingwater.
org/docs/2010_Annual_Report_Exec_Summary.pd Accessed March
26, 2012.
26 Groundwater Replenishment System, Facts and Figures, Retrieved
rom http://www.gwrsystem.com/about-gwrs/acts-a-gures.html27 Orange County Water District, “Press Release: OCWD Board o
Directors Approves Construction to expand World RenownedGroundwater Replenishment System,” March 28, 2011, Retrieved
rom http://www.ocwd.com/Press-Releases/ca-40.aspx.
28 Cooley, H., Christian-Smith, J., Gleick, P., Cohen, M., Heberger,
M., Caliornia’s Next Million Acre-Feet: Saving Water, Energy, and Money , Pacic Institute, Oakland, CA. September 2010, Retrieved
rom http://www.pacinst.org/reports/next_million_acre_eet/
next_million_acre_eet.pd.
29 See or example: Postel, S. and B. Richter, (2003), Rivers or Lie:
Managing or People and the Environment,Island Press, Covelo,
Caliornia.
30 Larry Walker Associates, A Review o Delta Fish Population Losses
rom Pumping Operations in the Sacramento-San Joaquin River Delta, Page 2, January 2010. Retrieved rom http://www.srcsd.com/
pd/dd/shlosses.pd Accessed on June 11, 2012.
31 United States Government Accountability Oce, Report to theRanking Member, Committee on Science, Space, and Technology,
House o Representatives. Energy-Water Nexus: Amount o Energy
Needed to Supply, Use, and Treat Water Is Location-Specifc and Can Be Reduced by Certain Technologies and Approaches. GAO-11-225. March
2011. Retrieved rom http://www.gao.gov/new.items/d11225.pd.
32 Caliornia Air Resources Board, Climate Change Scoping Plan , Pages
65-66, December 2008, Retrieved rom http://www.arb.ca.gov/cc/scopingplan/document/adopted_scoping_plan.pd Accessed
March 29, 2012.
CHAPTER V
1 USAID, Watergy: Water and Energy Efciency Project Handout, Retrieved rom http://www.usaid.gov/our_work/economic_growth_
and_trade/energy/publications/projects/global_watergy.pd.
2 Griths-Sattenspiel, B. and Wilson, W., The Carbon Footprint o
Water , Portland: The River Network, 2009. Retrieved rom http:// www.rivernetwork.org/resource-library/carbon-ootprint-water.
3 U.S. Environmental Protection Agency, Ensuring a Sustainable
Future: An Energy Management Guidebook or Wastewater and WateUtilities, January 2008, Retrieved rom http://www.epa.gov/owm/
waterinrastructure/pds/guidebook_si_energymanagement.pd.
4 Barry Nelson, Monty Schmitt, Ronnie Cohen, Noushin Ketabi, “In
Hot Water,” Natural Resources Deense Council, July 2007, Retrievedrom http://www.nrdc.org/globalWarming/hotwater/contents.asp.
5 USGS, Thermoelectric Power Use, Retrieved rom http://ga.water.
usgs.gov/edu/wupt.html Published March 9, 2012.
6 Gold, R., Campoy, A., “Oil’s Growing Thirst or Water,” Wall Street Journal, December 6, 2011, Retrieved rom http://online.wsj.
com/article/SB10001424052970204528204577009930222847246.html?mod=WSJ_hp_LEFTTopStories ; Schmitt, M., Nelson, B.,McEnaney, B., “Between a Rock and Dry Place ,” New York: Natural
Resources Deense Council; 2011. Retrieved rom http://www.nrdc.
org/water/les/oilshalecobasin.pd
7 Santa Margarita Water District. The Cadiz Valley Project. Retrievedrom http://www.smwd.com/operations/the-cadiz-valley-project.
html
8 Cadiz Valley Water Conservation, Recovery, and Storage Project Drat
EIR . ESA / 210324.4.7-22 Drat EIR. Retrieved rom http://www.cadizwaterproject.com/eir/downloads/4_07_GHG.pd It is unclear
i this includes any energy use associated with the 43 mile pipeline
to the Aqueduct.
9 Ibid. p.4.13-17.
10 The Yampa River Pumpback is projected to require a peak energy
use o between 115 and 188 MW Northern Colorado Water
Conservancy District,. Multi Basin Water Supply Investigation: Executive Summary,. December 2006. Retrieved rom http://www.
crwcd.org/media/uploads/YampaProjectExecutiveSummary.pd
11 The Lake Powell Pipeline Project is projected to require a peak net
energy use o between 150 and 200 Megawatts, including energy recovery eorts. Stacy Tellinghouse, Stacy. Western Resources
Advocates,. Pipelines and Power Plants: The Energy Needs o
the West’s Future Water Supplies,. Retrieved rom http://www. westernresourceadvocates.org/water/EnergyIntensityWaterReport.
pd.
12 Lewis and Clark Regional Water System Engineering Report ,
Appendix A, Page 32, Retrieved rom http://www.lcrws.org/pd/
EngineeringReport/appendixA.pd Accessed on April 13, 2012.
13 Stacy Tellinghouse, Western Resources Advocates, Water
Conservation = Energy Conservation, June 2009, Retrieved romhttp://www.westernresourceadvocates.org/water/CWCBe-wstudy.
pd citing Army Corps o Engineers, 2008, Northern Integrated
Supply Project Drat Environmental Impact Statement. Range
refects two possible congurations o the project, which depend on whether the project has a contract with the Bureau o Reclamation.
14 U.S. Bureu o Reclamation, Eastern Colorado Area Oce, Southern
Page 41
7/30/2019 Water Pipelines Report
http://slidepdf.com/reader/full/water-pipelines-report 41/46
PAGE 39 | Pipe Dream: Water Supply Pipeline Projects in the West
Delivery System, Final Environmental Impact Statement,December
2008, Retrieved rom http://www.sdseis.com/FEIS.html.
15 Cohen, R., Nelson, B., Wol, G. Energy Down the Drain , New York:NRDC; 2004, Page 12, Retrieved rom http://www.nrdc.org/water/
conservation/edrain/edrain.pd.
16 According to the U.S. Energy Inormation Administration, total
per capita energy consumption in Colorado was 290 million Btuin 2009, (U.S. Energy Inormation Administration. Colorado Data.
Retrieved rom http://www.eia.gov/state/state-energy-proles-
data.cm?sid=CO#Consumption Updated March 15, 2012. Accessed
April 6, 2012) That is 794,520.548 Btu per capita per day. The energy use o the proposed Southern Delivery System converted to Btu is
2,291,079,812.2621. 2,291,079,812.2621 Btu per day / 794,520.548Btu per capita per day = 2,883.6 people. Because only 22.9% o
Colorado’s energy demand is or residential use, to nd the amount
o energy demanded relative to equivalent per capita residentialuse, we divided 2,883.6 by 22.9% = 12,592.
17 Southern Nevada Water Authority, Southern Nevada Water Authority
Clark, Lincoln, and White Pine Counties Groundwater Development
Project, Conceptual Plan o Development. P.2-31. March 2011.Retrieved rom http://www.snwa.com/assets/pd/wr_gdp_concept_
plan_2011.pd.
18 U.S. Bureau o Land Management, Southern Nevada Water Authority
Drat Environmental Impact Statement , Chapter 3. June 2011,Retrieved rom http://www.blm.gov/pgdata/etc/medialib/blm/
nv/groundwater_development/snwa/drat_eis0.Par.96228.File.dat/e_3.1_Air_Resoruces.pd.
19 Bay Delta Conservation Plan Administrative Drat EIR/EIS, Pages 21-27, February 2012, Retrieved rom http://baydeltaconservationplan.
com/Libraries/Dynamic_Document_Library/EIR-EIS_
Chapter_21_-_Energy_2-29-12.sfb.ashx.
20 Julie Ann Grimm, “State Nixes Water-Rights Transer or Proposed
Pipeline rom Fort Sumner to Santa Fe,” SanteFeNewMexican.com,
Feb. 9, 2011, Retrieved rom http://www.santaenewmexican.com/localnews/State-nixes-water-rights-transer-or-pipeline-project
Accessed March 3, 2012.
21 Caliornia Department o Water Resources, “Caliornia State Water
Project Today,” Retrieved rom http://www.water.ca.gov/swp/swptoday.cm Published July 18, 2008.
22 U.S. Department o the Interior, Sustainability/Energy Scorecard ,
Retrieved rom http://www.doi.gov/greening/prm_matrix/index.
html.
23 32 Caliornia Energy Commission, Preliminary Sta Assessment,
Beacon Solar Energy Project, Application For Certifcation (08-AFC-
2), Kern County (Posted April 1, 2009), p.4.9-5, Retrieved rom http://
www.energy.ca.gov/sitingcases/beacon/documents/index.html.
24 Boyle, b., O’Shea, H., Delno, K., and Eaton, P. “Desert Development:
Smarter Way Needed.” U-T San Diego. February 18, 2011. Retrieved
rom http://www.utsandiego.com/news/2011/eb/18/a-smarter-approach-to-development-in-the-desert/?page=1#article Accessed
March 20, 2012.
25 U.S. Energy Inormation Administration, Renewable Energy
Consumption and Electricity Preliminary Statistics 2009. August2009, Retrieved rom http://www.eia.doe.gov/cnea/alternate/page/
renew_energy_consump/rea_prereport.html.
26 Jim Motavalli, “4 Energy Technologies That Could Replace Oil and
Coal,” The Daily Green . Nov. 24, 2010, Retrieved rom http://www.thedailygreen.com/environmental-news/latest/renewable-energy
-460510.
27 Carol Brzozowski, “Balancing Elements: Municipal water managerseducate the public about the relationship between water savings
and energy savings,” WaterEfciency.net. Vol.4, No. 3, 2010,
Retrieved rom http://digital.watereciency.net/publication/index
php?i=15083&m=&l=&p=4&pre=&ver=sw.
28 Palmdale Water District. History o the PWD. Retrieved rom http://
www.palmdalewater.org/HistoryPWD.aspx.
29 Lyn Corum, “Solar Cost Controller” WaterEfciency.net . April 30,
2008, Retrieved rom http://www.watereciency.net/WE/Articles/Solar_Cost_Controller_542.aspx.
30 “Perth Seawater Desalination Plant,” Water-Technology.net ,Retrieved rom http://www.water-technology.net/projects/perth//.
31 Hydroelectric Energy. Largest Pumped Storage Hydroelectric Plant.Retrieved rom http://hydroelectric-energy.blogspot.com/2011/03/
largest-pumped-storage-hydroelectric.html Accessed on June 11,
2012.
32 Lee Van der Voo,“ Gridfex plans gird-scale power storage inOregon,” Sustainable Business Oregon. April 21, 2011. Retrieved rom
http://www.sustainablebusinessoregon.com/articles/2011/04/
gridfex-plans-grid-scale-power.html.
33 “PG&E Planning a Major Pumped Storage Facility in Caliornia,”
Renewabl.com, August 24, 2010. Retrieved rom http://www.
renewbl.com/2010/08/24/pge-planning-a-major-pumped-storage-
acility-in-caliornia.html; MJ Clark, “Gridfex Energy Pursuing Wyo
Energy-Storage Projects,” Wyoming Business Report, January 12,2011, Retrieved rom http://www.wyomingbusinessreport.com/
article.asp?id=55516; Lanai 300 MW Energy Pumped Storage Projector Hawaii, Uruguay Energia, December 22, 2010, Retrieved rom
http://uruguayenergia.blogspot.com/2010/12/300mw-energy-
storage-project-or-hawaii.html.
34 National Renewable Energy Storage, Compressed Air Energy Storage, Retrieved rom http://www.nrel.gov/learning/eds_
compressed_air.html Published March 6, 2012, Accessed March
29, 2012; National Renewable Energy Storage, Parabolic TroughThermal Energy Storage Technology, Retrieved rom http://www.
nrel.gov/csp/troughnet/thermal_energy_storage.html Published
January 28, 2010, Accessed March 29, 2012; Ice Bear Energy StorageSystem, “Ice Energy,” Retrieved rom http://www.ice-energy.com/
ice-bear-energy-storage-system Accessed March 29, 2012.
CHAPTER VI -VII
1 Updated Principles and Guidelines or Water and Land RelatedResources Implementation Studies, Council on Environmental
Quality, The White House, Retrieved rom http://www.whitehouse.
gov/administration/eop/ceq/initiatives/PandG/ Accessed March26, 2012.
2 White House Council on Environmental Quality. Proposed National
Objectives, Principles and Standards or Water and Related Resources
Implementation Studies , Dec. 3, 2009, Retrieved rom http://www. whitehouse.gov/sites/deault/les/microsites/091203-ceq-revised-
principles-guidelines-water-resources.pd
3 The potential or eciency measures has been explored in recent
publications. See, or example, The Pacic Institute: More with Less: Agricultural Water Conservation and Eciency in Caliornia (2008);
Waste Not, Want Not: The Potential or Urban Water Conservation
in Caliornia (2003). Urban water eciency is now recognized as akeystone o water management in Southern Caliornia. See, Barry
Nelson, http://switchboard.nrdc.org/blogs/bnelson/southern_
caliornias_new_wave_1.html.
4 Kevin Wilson, “Ocials to Break Ground on Ute Water Pipeline
Project,” PNTOnline.com, August 6, 2011.
Page 42
7/30/2019 Water Pipelines Report
http://slidepdf.com/reader/full/water-pipelines-report 42/46
PAGE 40 | Pipe Dream: Water Supply Pipeline Projects in the West
CHAPTER IX, APPENDIX A
1 Prepared by JR Engineering, LLC or Wyoming Water Development
Commission, Laramie County Aquier Study Final Report, Cheyenne, Wyoming. February 2009. Retrieved rom http://library.wrds.uwyo.
edu/wwdcrept/Laramie_County/Laramie_County-Aquier_Study-
Final_Report-2009.pd.
2 Prepared by the Wyoming Water Planning Program State Engineer’sOce or the Governor’s Interdepartmental Water Conerence,
Summary and Analysis o the City o Cheyenne’s Proposed Stage II
Water System Expansion, December 1978.
3 Board o Public Utilities, Waterworks and Sewer Enterprise Funds o the City o Cheyenne, Wyoming, Comprehensive Annual Financial
Report or the Fiscal Year Ended June 30 2010, Retrieved rom http://
www.cheyennecity.org/DocumentView.aspx?DID=3904.
4 Ibid.
5 Northern Colorado Water Conservancy District, Colorado-Big
Thompson Project, Retrieved rom http://www.northernwater.org/
WaterProjects/C-BTProject.aspx.
6 Western Resources Advocates, Water on the Rocks: Oil Shale Water
Rights in Colorado, Boulder: Western Resources Advocates, 2009.
Page 34. Retrieved rom http://www.westernresourceadvocates.org/land/wotrreport/wotrreport.pd.
7 U.S. Bureau o Reclamation, San Juan-Chama Project,
Retrieved rom http://www.usbr.gov/projects/Project.jsp?proj_
Name=San+Juan-Chama+Project Published May 22, 2009.
8 Ibid.
9 Ibid.
10 Central Utah Project Completion Act Oce, Utah Drainage Basin
Water Delivery System, Retrieved rom http://www.cupcao.gov/
bonneville/uldbwds.html.
11 U.S. Bureau o Reclamation, Central Utah Project – Bonneville Unit,
Retrieved rom http://www.usbr.gov/projects/Project.jsp?proj_
Name=Central+Utah+Project+-+Bonneville+Unit Published May 27,2009.
12 U.S. Bureau o Reclamation, Central Arizona Project, Retrieved
rom http://www.usbr.gov/projects/Project.jsp?proj_
Name=Central+Arizona+Project, Published April 18, 2011.
13 Central Arizona Project, About Us, Retrieved rom http://www.cap-az.com/AboutUs.aspx.
14 Wikipedia, Central Arizona Project, Retrieved rom http://
en.wikipedia.org/wiki/Central_Arizona_Project Published Nov. 7,2010.
15 Association o Caliornia Water Agencies, Water or Tomorrow,
New York: Onward Publishing, Inc. in partnership with
National Geographic, 2009, Retrieved rom http://www. waterortomorrowmag.com/index.php/en/magazine/issue/1.
16 Los Angeles Department o Water and Power, First and Second Los
Angeles Aqueduct Facts, Retrieved rom http://wsoweb.ladwp.com/
Aqueduct/historyofaa/aqueductacts.htm.
17 Los Angeles Department o Water and Power, Los Angeles
Department o Water and Power Urban Water Management Plan,
2010, Page 110, Approved April 11, 2011, Retrieved rom http:// www.water.ca.gov/urbanwatermanagement/2010uwmps/Los%20
Angeles%20Department%20o%20Water%20and%20Power/
LADWP%20UWMP_2010_LowRes.pd.
18 Caliornia Department o Water Resources, Caliornia State WaterProject Overview, Retrieved rom http://www.water.ca.gov/swp/
Published Aug. 11, 2010.
19 Caliornia Department o Water Resources. South Bay Aqueduct
(Bethany Reservoir and Lake Del Valle) Factsheet, April 2011,Retrieved rom http://www.water.ca.gov/recreation/brochures/pd/
South-Bay-Aque.pd.
20 Solano County Water Agency, North Bay Aqueduct, Retrieved romhttp://www.scwa2.com/Projects_North_Bay_Aqueduct.aspx.
21 Caliornia Department o Water Resources, Caliornia State Water
Project – Coastal Branch Area, Retrieved rom http://www.water.ca.gov/swp/acilities/coastalbranch.cm.
22 Department o Water Resources, Caliornia State Water Project
–West Branch Area, Retrieved rom http://www.water.ca.gov/
swp/acilities/westbranch.cm; Department o Water Resources,Caliornia State Water Project – East Branch Area. Retrieved rom
http://www.water.ca.gov/swp/acilities/eastbranch.cm; Caliornia
Department o Water Resources Bay Delta Oce, Summary: Final State Water Project Delivery Reliability Report, 2009, September
27, 2010. Retrieved rom http://baydeltaoce.water.ca.gov/
swpreliability/FinalReliabiltyReportsummary092710.pd.
23 U.S. Bureau o Reclamation, Central Valley Project, Retrieved romhttp://www.usbr.gov/projects/Project.jsp?proj_Name=Central+Vall
ey+Project#Group39485 Published April 21, 2011.
24 U.S. Bureau o Reclamation, San Felipe Division Project, Retrieved
rom http://www.usbr.gov/projects/Project.jsp?proj_Name=SanFelipe Division Project Published April 21, 2011.
25 U.S. Bureau o Reclamation, CVP Water Contract Delivery
Inormation, Water Year 2005-2010, Prepared June 3, 2011, Retrievedrom http://www.usbr.gov/mp/PA/water/docs/CVP%20Water%20
Delivery.pd
26 Aquaornia: The Caliornia Water News Blog , The Hetch Hetchy Aqueduct. Retrieved rom http://aquaornia.com/where-does-caliornias-water-come-rom/the-hetch-hetchy-aqueduct
Published August 19, 2008.
27 Aquaornia: The Caliornia Water News Blog. The Mokelumne (East
Bay) Aqueduct. Retrieved rom http://aquaornia.com/where-does-caliornias-water-come-rom/the-mokelumne-east-bay-aqueduct
Published Aug. 19, 2008.
28 Wikipedia. List o Largest Reservoirs in Caliornia. http://en.wikipedia.org/wiki/List_o_largest_reservoirs_o_Caliornia
Accessed on March 3, 2012.
29 Wikipedia, Portland Water Bureau, Retrieved rom http://
en.wikipedia.org/wiki/Portland_Water_Bureau Published July 25,2011.
30 Harold Mansperger, The Bull Run Watershed: Our Treasured
Water Supply , Page 5, Campbell-McCrea, Geography o Oregon –
Geography 206. March 15, 2006. Retrieved rom http://www.pcc.edu/library/news/prize/bull_run_watershed.pd,
31 The Cedar River Watershed provides an approximate 2/3 o the total
water or the Seattle metropolitan area http://aculty.washington.edu/zerbe/PA_596/watershed/water_supply.htm, while the Tolt
River Watershed provides the remaining 1/3 o the water supply
http://www.seattle.gov/util/About_SPU/Water_System/Water_
Sources_&_Treatment/Tolt_River_Watershed/index.asp. According to Seattle Public Utilities, total 2003 SPU water demand was 140
mgd http://www.seattle.gov/util/About_SPU/Water_System/
History_&_Overview/DEMOGRAPHI_200312020908145.asp. O that 140 mgd, approximately 92 mgd came rom the Cedar River
Watershed, or approximately 103,500 acre eet per year.32 Mary Garrigan, “Mni Wiconi Water Reaching Pine Ridge
Reservation,” Rapid City Journal, August 19, 2008. Retrieved romhttp://rapidcityjournal.com/news/local/article_ca0ce382-c709-
5082-8c63-52e827e24a.html.
33 March 28, 2012 telephone communication with the Bureau o Reclamation, Dakota oce.
34 Phil Davies, “Pipe Dreams,” Fedgazette,The Federal Reserve Bank
o Minneapolis, September 1, 2005, Retrieved rom http://www.
minneapolised.org/publications_papers/pub_display.cm?id=1451
Page 43
7/30/2019 Water Pipelines Report
http://slidepdf.com/reader/full/water-pipelines-report 43/46
PAGE 41 | Pipe Dream: Water Supply Pipeline Projects in the West
CHAPTER X, APPENDIX B
1 John Orr, Flaming Gorge Pipeline: Colorado-Wyoming Coalition
Makes it Ofcial Becoming the Colorado-Wyoming Cooperative Water Supply Project, Coyote Gulch Blog, Retrieved rom http://
coyotegulch.wordpress.com/2010/03/26/faming-gorge-pipeline-
colorado-wyoming-coalition-makes-it-ocial-becoming-the-colorado-wyoming-cooperative-water-supply-project/ Published
March 26, 2010.
2 Aaron Million, “Pipeline Application Dismissed,” Coloradoan.com .
Feb. 24, 2012. Accessed March 20, 2012.
3 Ben Neary, “Feds again reject Wyoming-Colorado water pipeline.”Denver Post, May 17, 2012. http://www.denverpost.com/latin/
ci_20646898/ederal-agency-again-rejects-pipeline-plan, Accessed
on June 11, 2012.
4 Bureau o Land Management, Lake Powell Pipeline Project,
Retrieved rom http://www.blm.gov/ut/st/en/prog/more/lands_
and_realty/major_projects/lake_powell_pipeline.html Published April 1, 2008.
5 Utah Division o Water Resources, Lake Powell Pipeline Project
Updates, Utah.gov. Retrieved rom http://www.water.utah.gov/
lakepowellpipeline/projectupdates/deault.asp.
6 HB 174 Sales and Use Tax Allocation or Water Resources
Construction Fund – Painter P. Utah State Legislature, Retrieved
rom http://le.utah.gov/~2012/htmdoc/hbillhtm/HB0174.htm
Published March 12, 2012. Accessed on March 20, 2012.
7 Utah Department o Water Resources, Lake Powell Pipeline
Project Updates. Retrieved rom http://www.water.utah.gov/
LakePowellPipeline/ProjectUpdates/deault.asp, Accessed on June11, 2012.
8 Zach Fridell, “Yampa pumpback stalled, Front Range water district
not yet pursuing pipeline project,” Steamboat Today , July 6, 2008,
Retrieved rom http://www.steamboattoday.com/news/2008/ jul/06/yampa_pumpback_stalled/; Northern Colorado Water
Conservancy District. Multi Basin Water Supply Investigation
Executive Summary. December 2006. Retrieved rom http://www.crwcd.org/media/uploads/YampaProjectExecutiveSummary.pd
Accessed April 4, 2012; Colorado River Water District, Study Shows
Diverting Yampa Water Could Help Colorado Meet Future Water
Demand, Retrieved rom http://www.crwcd.org/media/uploads/ YampaProjectPressRelease.pd.
9 Bureau o Reclamation, Navajo-Gallup Water Supply Project
Planning Report and Drat Environmental Impact Statement,Retrieved rom http://www.usbr.gov/uc/envdocs/eis/navgallup/
DEIS/index.html Published Nov. 6, 2007.
10 U.S. Department o the Interior, “Press Release: Salazar Signs
Decision on Navajo-Gallup Water Supply Project, Clearing the Way or Historic Water Rights Settlement,” Retrieved rom http://www.
doi.gov/news/pressreleases/2009_10_01_releaseA.cm Published
Oct. 2, 2009; Kathy Helms, “Navajo-Gallup water project cost rising to over $716M,” Gallup Independent Web Edition , Published on
May 1, 2007.
11 U.S. Bureau o Reclamation, Navajo-Gallup Water Supply Project
Drat Environmental Impact Statement, Chapter 4, March 2007,Retrieved rom http://www.usbr.gov/uc/envdocs/eis/navgallup/
DEIS/vol1/ch4.pd.
12 U.S.Bureau o Reclamation, Navajo-Gallup Water Supply Project
Drat Environmental Impact Statement , Volume 2, Chapter 9, TheUnit Cost o Projected Water, Page 131. March 2007. Retrieved
rom http://www.usbr.gov/uc/envdocs/eis/navgallup/DEIS/vol2/
Appdx-A/ch9.pd. The preerred alternative is ound at http://www.usbr.gov/uc/envdocs/eis/navgallup/DEIS/vol1/exec-summ.pd.
13 U.S. Bureau o Reclamation, Narrows Project Supplemental DratEnvironmental Impact Statement. Page 1-2. March 2010. Retrieved
rom http://www.narrowsproject.com/Narrows_Drat_EIS_
March_2010.pd.
14 Ibid. Page 2-4.
15 Ibid. Page 2-5.
16 Ibid. Page 2-31
17 Northern Water. Northern Integrated Supply Project Overview.
Retrieved rom http://www.northernwater.org/WaterProjects/NISP.
aspx/; U.S. Army Corps o Engineers, Omaha District. Northern Integrated Supply Project, Drat Environmental Impact Statement.
Page 2-43. April 2008. Retrieved rom http://www.northernwater.
org/docs/NISP/Environment/nisp_Drat_EIS.apr08.pd.
18 Monty Whaley, “No Surprises as Price or NISP Water Project or
Northern Colorado Keeps Rising.” The Denver Post. March 30, 2010,
Retrieved rom http://www.denverpost.com/news/ci_14782253.
19 The Northern Colorado Water Conservancy District, Retreievedrom “http://www.northernwater.org/WaterProjects/
NISPEnvironment.aspx, Accessed on June 11” http://www.
northernwater.org/WaterProjects/NISPEnvironment.aspx Accessedon June 11, 2012.
20 Henry Brean, “Mulroy Advice or Obama: Tap Mississippi
Floodwaters,” Las Vegas Review-Journal. January 12, 2009, Retrieved
rom http://www.lvrj.com/news/37431714.html.
21 Colorado Springs Utilities, Southern Delivery System Project
Description, Retrieved rom http://www.sdswater.org/
ProjectOverview.aspx.
22 Adam Bennet, “Hundreds Protest Ute Lake Pipeline,” Myhighplains.com , Aug. 12, 2011, Retrieved rom http://myhighplains.com/
ulltext/?nxd_id=209027.
23 Eastern New Mexico Rural Water System, About the Project,
Retrieved rom http://www.enmrwa.com/deault_les/Page360.htm Accessed April 3, 2012.
24 U.S. Bureau o Reclamation, Albuquerque Area Oce, Finding
o No Signifcant Impact Eastern New Mexico Rural Water Supply Environmental Assessment, Jan. 27, 2011, Retrieved rom http://
www.usbr.gov/uc/albuq/envdocs/ea/EasternNM/Final-EA.pd.
25 News Channel 10, “Ute Lake water pipeline project on hold
ollowing injunctions”, published on May 16, 2012, Accessed athttp://www.newschannel10.com/story/18449848/ute-lake-water-
pipeline-project-haulted-ollowing-injunctions.
26 Thomas, Mike. “Partnership seeks to develop $250 million water
pipeline.” San Antonio Business Journal. Feb. 8, 2009, Retrievedrom http://www.bizjournals.com/sanantonio/stories/2009/02/09/
story12.html.
27 Associated Press, “Foes o Water Pipeline Increase,” Albuquerque
Journal Online Edition . March 7, 2010. Retrieved rom http://www.abqjournal.com/news/state/0722845state03-07-10.htm.
28 Southern Nevada Water Authority. Groundwater Development
Project. Retrieved rom http://www.snwa.com/ws/uture_gdp.html
29 Brean, Henry. “Water Authority: New Report o $7.4 Billion PipelineCost is Worst-Case Analysis.” Las Vegas Review-Journal. August
23, 2011. Retrieved rom http://www.lvrj.com/news/water-
authority-new-report-o-7-3-billion-pipeline-cost-is-worst-case-analysis-128231803.html Accessed March 20, 2012.
30 Emily Green, Las Vegas Pipeline Loses Its Water, Chance o Rain
Blog, Retrieved rom http://chanceorain.com/2010/01/las-vegas-
pipeline-loses-its-water/ Published January 28, 2010.
Page 44
7/30/2019 Water Pipelines Report
http://slidepdf.com/reader/full/water-pipelines-report 44/46
PAGE 42 | Pipe Dream: Water Supply Pipeline Projects in the West
31 Cy Ryan, “Long-Awaited Water-Pipeline Decision to Follow
Hearing.” Las Vegas Sun. Sept. 21, 2011. Retrieved rom http://www.
lasvegassun.com/news/2011/sep/21/water-pipeline-decision/.
32 Bureau o Land Management, Drat EIS, Southern Nevada Water
Authoirty Groundwater Development Project Right-o-Way
Predicted Change in Groundwater Levels, Figure F3 2.7-2, June 2011.Retrieved rom http://www.blm.gov/pgdata/etc/medialib/blm/
nv/groundwater_development/snwa/drat_eis0.Par.76596.File.
dat/Appendix%20F3.3.7%20-%20Predicted%20Change%20in%20
Groundwater%20Levels.pd Accessed on April 12, 2012.
33 Cadiz Inc. Water Project, Retrieved rom http://cadizinc.com/water-project/.
34 Bill Wallace and Charles Burress, “Los Angeles Rejects Plan to
‘Bank’ Water Under Mojave Desert, Project’s Financial Feasibility Questioned,” San Francisco Chronicle, October 9, 2002. Retrieved
rom http://articles.sgate.com/2002-10-09/bay-area/17566180_1_
keith-brackpool-cadiz-cadiz-project-mwd.
35 Michael Campana, The Cadiz Project: Some Documents or Your
Reading Pleasure, Water Wired Blog, August 7, 2009. Retrieved rom
http://aquadoc.typepad.com/waterwired/2009/08/the-cadiz-
project-some-documents-or-your-reading-pleasure.html AccessedMarch 20, 2012.
36 Caliornia Natural Resources Agency, Highlights o the Bay Delta
Conservation Plan. December 2010. Pages 29 and 35. Retrieved
rom http://www.resources.ca.gov/docs/Highlights_o_the_BDCP_FINAL_12-14-10_2361.pd.
37 Doug Obegi, An Additional 391 Billion Gallons o Water rom
the Delta isn’t “More Water”? NRDC Switchboard Sta Blog.Retrieved rom http://switchboard.nrdc.org/blogs/dobegi/an_
additional_391_billion_gall.html Published November 21, 2011.
38 State Water Resources Control Board. San Fracisco Bay/Sacramento
– San Joaquin Delta Estuary (Bay-Delta) Program. http://www.swrcb.ca.gov/waterrights/water_issues/programs/bay_delta/
deltafow/ Published August 25, 2010.
39 Barry Nelson, Financing the Delta Plan – Conveyance and UrbanUsers. NRDC Switchboard Sta Blog, Retrieved rom http://
switchboard.nrdc.org/blogs/bnelson/nancing_the_delta_plan_-_
con.html, Published February 28, 2011.
40 Center or Environmental Law and Policy, Weber Siphon and the
Columbia Basin Project, Retrieved rom http://www.columbia-institute.org/weber-siphon/cbp/expansion.html.
41 Oce o the Inspector General, U.S. Department o the Interior,
Recovery and Oversight Advisory: Weber Siphon Complex. Report No.
ROO-ROA-USBR-4002-2010, December 2010. Retrieved rom http:// www.recovery.gov/Accountability/inspectors/Documents/USBR-
4002%20F12-13-10.pd.
42 Lewis and Clark Regional Water System, The Plan, Retreved romhttp://www.lcrws.org/index.php?option=com_content&task=view&
id=22&Itemid=42 Accessed April 10, 2012.43 Mark Steil, “Earmarks Ban Slows Water Supply System,” PostBulletin
com , March 17, 2012. Retrieved rom http://www.postbulletin.com/news/stories/display.php?id=1490271 April 10, 2012.
44 Dollars calculated to 2012 dollars to refect infation using the
Bureau o Labor Statistics conversion calculator: http://www.
bls.gov/data/infation_calculator.htm 1993 projected cost was$272.8 million – rom Lewis and Clark Regional Water Supply
System. Funding. Retrieved rom http://www.lcrws.org/index.
php?option=com_content&task=view&id=23&Itemid=431993 Accessed April 10, 2012.
45 Lewis and Clark Regional Water System. The Plan. Retrieved rom
http://www.lcrws.org/index.php?option=com_content&task=view&
id=22&Itemid=42 Accessed April 10, 2012.
46 Lewis and Clark Rural Water System Final Engineering Report. Prepared by Banner Associates, Inc. and HDR Engineering, Inc. or
Lewis and Clark Rural Water System. May 2002. Chapter 2, Page12. Retrieved rom http://www.lcrws.org/pd/EngineeringReport/
chapter2.pd Accessed April 10, 2012.
47 Colorado River Basin Study Option Descriptions, Increase Supply,
March 12, 2012, Retrieved rom http://www.usbr.gov/lc/region/programs/crbstudy/Descriptions_Report_27MAR2012.pd
Accessed April 4, 2012.
Page 45
7/30/2019 Water Pipelines Report
http://slidepdf.com/reader/full/water-pipelines-report 45/46
Page 46
7/30/2019 Water Pipelines Report
http://slidepdf.com/reader/full/water-pipelines-report 46/46
Natura Reurce Deene Cunci
40 West 20th Street
New York, NY 10011
212 727-2700
Fax 212 727-1773
Beijing
Chicago
Los Angeles
Montana
San Francisco
Washington


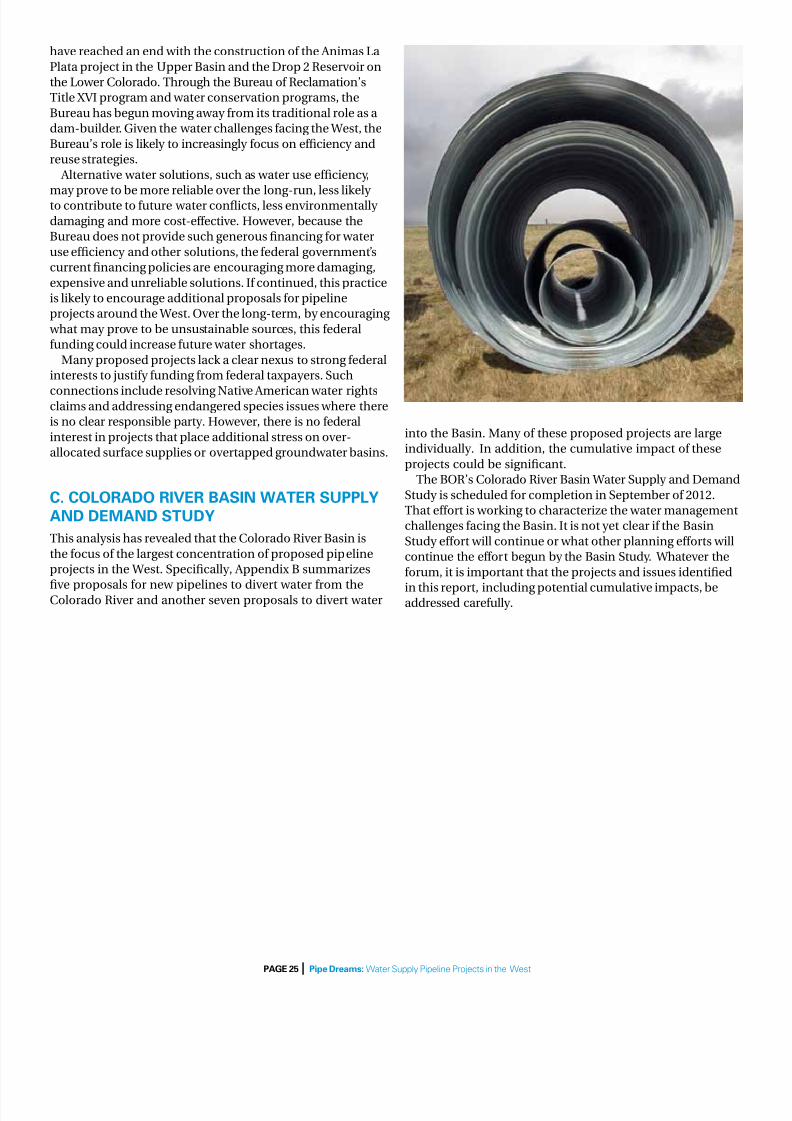


![Pipelines stress analysis Report [Mechatronics]](https://static.documents.pub/doc/80x56/577d25a91a28ab4e1e9f5c0f/pipelines-stress-analysis-report-mechatronics.jpg)


