Page 1
Renewable energies | Eco-friendly production | Innovative transport | Eco-efficient processes | Sustainable resources
© 2
010
-IFP
Ene
rgie
s no
uvel
les,
Rue
il-M
alm
aiso
n, F
ranc
e
Water Production associated to CO2 injection into a saline aquifer
Nico2las MaurandDennis Rivadeneira
Page 2
© 2
010
-IFP
Ene
rgie
s no
uvel
les,
Rue
il-M
alm
aiso
n, F
ranc
e
2
Overview
Model setup and parameters Overpressure and CO2 Storage Capacity Management
Stopping CO2 injection Resident brine production
Water Production Management Desalination of the resident water production Residual concentrated brine reinjection
Economical aspects Final Conclusions
Page 3
© 2
010
-IFP
Ene
rgie
s no
uvel
les,
Rue
il-M
alm
aiso
n, F
ranc
e
3
Model set up
x y zNumber 50 50 10
Length (m) 250 250 20
Grid
Boundaries No flow conditions for
every one. No heat and fluid
exchange with the upper and lower layers
Parameters and Conditions Average Value
Porosity [%] 20
Permeability [mD] 200
Anisotropy ratio 0.1
Thickness [m] 200
Initial reservoir temperature Thickness [°C] 70
Initial reservoir pressure Thickness [bar] 100 at 1000m
Rock compressibility Thickness [1/bar] 4.35E-5
Irreducible water saturation [%] 15
Critical gas saturation [%] 5
Maximum water relative permeability 0.9
Maximum gas relative permeability 0.55
Salinity [g/l] 50
Page 4
© 2
010
-IFP
Ene
rgie
s no
uvel
les,
Rue
il-M
alm
aiso
n, F
ranc
e
4
Overview
Model setup and parameters Overpressure and CO2 Storage Capacity Management
Stopping CO2 injection Resident brine production
Water Production Management Desalination of the resident water production Residual concentrated brine reinjection
Economical aspects Final Conclusions
Page 5
© 2
010
-IFP
Ene
rgie
s no
uvel
les,
Rue
il-M
alm
aiso
n, F
ranc
e
5
Solution 1: Stopping CO2 injection Conditions
1 Mt/y CO2 during 20 years Overpressure evolution during 10 years
0
10
20
30
40
50
60
70
0 5 10 15 20 25 30Time [years]
Ove
rpre
ssur
e [b
ars]
Shut-in Pressure
63
64
65
66
20 22 24 26 28 30Time [years]
Ove
rpre
ssur
e [b
ars]
ONLY 2 BARS of REDUCTION !!
Page 6
© 2
010
-IFP
Ene
rgie
s no
uvel
les,
Rue
il-M
alm
aiso
n, F
ranc
e
6
Solution 2: Water productionIdea: Avoiding overpressure Reservoir pressure 138.5 bars
Reservoir temperature 70 °cRho Water – res. conditions 1.02 g/cm3Rho Gaz – res. conditions 0.543 g/cm3
1.87 Water Tons
1 CO2 Tons
1.84 CO2 m3
1.84 Water m3
Page 7
© 2
010
-IFP
Ene
rgie
s no
uvel
les,
Rue
il-M
alm
aiso
n, F
ranc
e
7
Solution 2: Water production
Simulation parameters 1500 m Injector-producers 1 Mt/y CO2 during 30 years BHFP producers 100/72bars Case 1 to 6 wells
Overpressure decrease – constant injection rate
Page 8
© 2
010
-IFP
Ene
rgie
s no
uvel
les,
Rue
il-M
alm
aiso
n, F
ranc
e
8
Solution 2: Water production
Simulation parameters 1500 m Injector-producers 1 Mt/y CO2 during 30 years BHFP producers 100/72bars Case 1 to 6 wells
Overpressure decrease – constant injection rate
0
10
20
30
40
50
60
70
80
90
100
0 1 2 3 4 5 6Number of production wells
Water Production (M
tons)
0
10
20
30
40
50
60
70
80
90
100
Ove
rpre
sure
(Bar
s)
Overpressure 100 bars Overpressure 72 bars
Water Production 100 bars Water Production 72 bars
-30% -65% -75%
Page 9
© 2
010
-IFP
Ene
rgie
s no
uvel
les,
Rue
il-M
alm
aiso
n, F
ranc
e
9
Solution 2: Water production
Simulation parameters 1500 m Injector-producers 50 bars overpressure allowed BHFP producers 100 bars Case 1 to 6 wells 30 years of simulation
CO2 storage capacity increase – constant injection pressure
0
20
40
60
80
100
120
140
0 1 2 3 4 5 6Number of Wells
Mas
s (M
tons
)
CO2 injected Water production
x2.5
x5.9
x4.3
Page 10
© 2
010
-IFP
Ene
rgie
s no
uvel
les,
Rue
il-M
alm
aiso
n, F
ranc
e
10
Overview
Model setup and parameters Overpressure and CO2 Storage Capacity Management
Stopping CO2 injection Resident brine production
Water Production Management Desalination of the resident water production Residual concentrated brine reinjection
Economical aspects Final Conclusions
Page 11
© 2
010
-IFP
Ene
rgie
s no
uvel
les,
Rue
il-M
alm
aiso
n, F
ranc
e
11
Desalination of the resident water production Technologies
Reverse Osmosis (47%) [40-50 g/l] Multi-stage Distillation (37%) [> 50 g/l] Nanofiltration (16%)
Always residual concentrated brine Reject to the sea
Take into account the local policies
Reinjection in geological formation
Reservoir Water
Irrigation water [0.5 g/l]
Residual brine [359 g/l] Max sat. NaCl in Water
Ideal Desalination Process
Reservoir salinity [g/l]
Resid. brine Re-injected
Mass [%]
Irrigation water Mass
[%]
35 12 88
50 17 83
89 30 70
120 40 60
150 49 51
170 55 45
200 62 38
Page 12
© 2
010
-IFP
Ene
rgie
s no
uvel
les,
Rue
il-M
alm
aiso
n, F
ranc
e
12
4500 m
2000 m
Residual concentrated brine reinjectionSimulation Model
Page 13
© 2
010
-IFP
Ene
rgie
s no
uvel
les,
Rue
il-M
alm
aiso
n, F
ranc
e
13
Residual concentrated brine reinjectionSimulation
OK Reinjection scenario 5 spot model 1 Mt/y CO2
30 y simulation
Both scenarios have the same water production history
NO Reinjection scenario OK Reinjection scenario
56% of reduction in average!!
36% of reduction in average!!
BASE CASE: No water productionNo brine reinjection
11 bars of difference
Page 14
© 2
010
-IFP
Ene
rgie
s no
uvel
les,
Rue
il-M
alm
aiso
n, F
ranc
e
14
Residual concentrated brine reinjectionSimulation CO2 capacity for NO reinjection and OK reinjection Scenario
Maximum Overpressure allowed is 50 bars
0
20
40
60
80
100
120
140
160
180
0 1 2 3 4 5 6Number of Wells
Accu
mul
ated
Mas
s (M
tons
)CO2 injected-ReinjectionScenario
Waterproduction-ReinjectionScenario
CO2 injected-NO ReinjectionScenario
Waterproduction-NOReinjectionScenario
Increase in water production
Increase in CO2 injection
Page 15
© 2
010
-IFP
Ene
rgie
s no
uvel
les,
Rue
il-M
alm
aiso
n, F
ranc
e
15
Residual concentrated brine reinjectionSimulation CO2 capacity for NO reinjection and OK reinjection Scenario
Maximum Overpressure allowed is 50 bars
0
20
40
60
80
100
120
140
160
180
0 1 2 3 4 5 6Number of Wells
Accu
mul
ated
Mas
s (M
tons
)
CO2 injected-ReinjectionScenario
Waterproduction-ReinjectionScenario
CO2 injected-NO ReinjectionScenario
Waterproduction-NOReinjectionScenario
NO Reinjection Scenario
OK Reinjection Scenario
Number of wells
Comparison with zero wells
case (CO2 injected mass)
Comparison with zero wells case (CO2 injected
mass)
0 1,00 1,00
1 1,82 1,55
2 2,53 2,45
3 3,49 3,27
4 4,30 4,575 5,09 5,32
6 5,91 5,985 spot
configuration
Page 16
© 2
010
-IFP
Ene
rgie
s no
uvel
les,
Rue
il-M
alm
aiso
n, F
ranc
e
16
Overview
Model setup and parameters Overpressure and CO2 Storage Capacity Management
Stopping CO2 injection Resident brine production
Water Production Management Desalination of the resident water production Residual concentrated brine reinjection
Economical aspects Final Conclusions
Page 17
© 2
010
-IFP
Ene
rgie
s no
uvel
les,
Rue
il-M
alm
aiso
n, F
ranc
e
17
Scenarios 100Mt CO2 injectedPassive Management Active Management
"brine reinjection"Active Management
"brine rejected to sea"
300 km pipe (100 km + 4x50km)
4 sites: 4 CO2 injection wells
need rig move
200 km pipe (100 km + 100km)
1 site :1 CO2 injection well 4 prod. well 1 Wat prod. well
150 km pipe (100 km + 50km)
1 site :1 CO2 injection well
4 prod. well
Page 18
© 2
010
-IFP
Ene
rgie
s no
uvel
les,
Rue
il-M
alm
aiso
n, F
ranc
e
ONSHORE Economical Analysis(€/ton) (€/ton) (€/ton)
CO2 Capture 4000.0 40.0 CO2 Capture 4000.0 40.0 CO2 Capture 4000.0 40.0Onshore transport 318.0 3.2 Onshore transport 212.0 2.1 Onshore transport 159.0 1.6Offshore transport 0.0 0.0 Offshore transport 0.0 0.0 Offshore transport 0.0 0.0
Transport 318.0 3.2 Transport 212.0 2.1 Transport 159.0 1.6Caracterisation cost 40.8 0.4 Caracterisation cost 10.2 0.1 Caracterisation cost 10.2 0.1
Drilling cost 9.7 0.1 Drilling cost 11.5 0.1 Drilling cost 9.7 0.1Monitoring cost 196.0 2.0 Monitoring cost 49.0 0.5 Monitoring cost 49.0 0.5
CO2 Storage 246.5 2.5 CO2 Storage 70.7 0.7 CO2 Storage 68.9 0.7Water Desalination Cost - primary treatment 0 0 Water Desalination Cost - primary treatment 126 1.3 Water Desalination Cost - primary treatment 0 0.0Water treatement Cost - secondary treatment 0 0 Water treatement Cost - secondary treatment 239.4 2.4 Water treatement Cost - secondary treatment 0 0.0
total expenses including industrial water 4564.5 45.6 total expenses including industrial water 4408.7 44.1 total expenses including industrial water 4227.9 42.3total expenses including drinkable water 4564.5 45.6 total expenses including drinkable water 4648.1 46.5 total expenses including drinkable water 4227.9 42.3
(€/ton) (€/ton) (€/ton)CO2 avoided 3000.0 30.0 CO2 avoided 3000.0 30.0 CO2 avoided 3000.0 30.0Industrial Water Revenue 0.0 0.0 Industrial Water Revenue 55.9 0.6 Industrial Water Revenue 0.0 0.0drinkable Water Revenue 0.0 0.0 drinkable Water Revenue 503.1 5.0 drinkable Water Revenue 0.0 0.0
total revenues including industrial water 3000.0 30.0 total revenues including industrial water 3055.9 30.6 total revenues including industrial water 3000.0 30.0total revenues including drinkable water 3000.0 30.0 total revenues including drinkable water 3503.1 35.0 total revenues including drinkable water 3000.0 30.0
CO2 Capture + Transport + Storage Balance (M€) (€/ton) CO2 Capture + Transport + Storage Balance (M€) (€/ton) CO2 Capture + Transport + Storage Balance (M€) (€/ton)Total cost 4564.5 45.6 Total cost 4648.1 46.5 Total cost 4227.9 42.3Cost - Total revenues (CO2+industrial Water) 1564.5 15.6 Cost - Total revenues (CO2+industrial Water) 1592.2 15.9 Cost - Total revenues (CO2+industrial Water) 1227.9 12.3Cost - Total revenues (CO2+drinkable Water) 1564.5 15.6 Cost - Total revenues (CO2+drinkable Water) 1145.0 11.5 Cost - Total revenues (CO2+drinkable Water) 1227.9 12.3
Revenues (M€) Revenues (M€) Revenues (M€)
PCRM Scenario 4 CO2 injector ACRM Scenario (Brine reinjection) ACRM Scenario (Rejecting water to the sea)
Expenses (M€) Expenses (M€) Expenses (M€)
Page 19
© 2
010
-IFP
Ene
rgie
s no
uvel
les,
Rue
il-M
alm
aiso
n, F
ranc
e
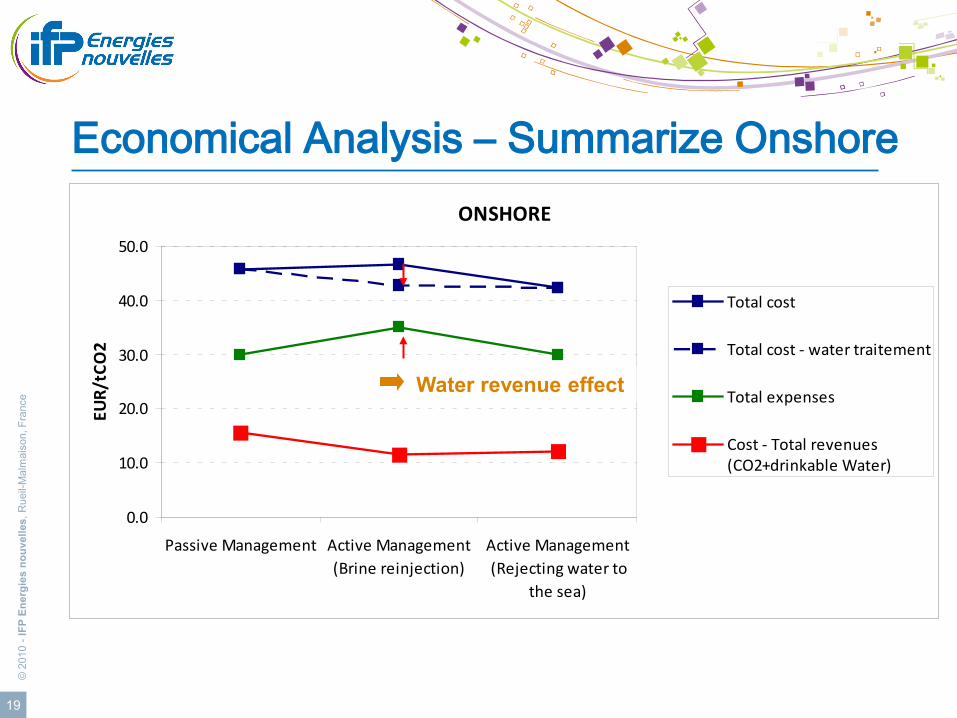
ONSHORE
0.0
10.0
20.0
30.0
40.0
50.0
Passive Management Active Management(Brine reinjection)
Active Management(Rejecting water to
the sea)
EUR/
tCO
2
Total cost
Total cost - water traitement
Total expenses
Cost - Total revenues(CO2+drinkable Water)
19
Economical Analysis – Summarize Onshore
Water revenue effect
Page 20
© 2
010
-IFP
Ene
rgie
s no
uvel
les,
Rue
il-M
alm
aiso
n, F
ranc
e
20
Overview
Model setup and parameters Overpressure and CO2 Storage Capacity Management
Stopping CO2 injection Resident brine production
Water Production Management Desalination of the resident water production Residual concentrated brine reinjection
Economical aspects Final Conclusions
Page 21
© 2
010
-IFP
Ene
rgie
s no
uvel
les,
Rue
il-M
alm
aiso
n, F
ranc
e
21
Final conclusions
Water production decreases largely reservoir overpressure
Water production increases largely CO2 storage capacity
Effects in overpressure and storage capacity from brine reinjection
are not considerable
Active reservoir management could be economically feasible,
comparing with passive management.
Page 22
© 2
010
-IFP
Ene
rgie
s no
uvel
les,
Rue
il-M
alm
aiso
n, F
ranc
e
www.ifpenergiesnouvelles.com