1 Water Productivity of Cotton in the Humid Southeast – Experimentation Hamid J. Farahani, Ph.D., Water Management Engineer USDA-NRCS East National Technology Support Center. 2901 E. Lee Street, Suite 2100, Greensboro, NC 27401; [email protected]; 336-370-3350 Ahmad Khalilian, Ph.D., Professor Clemson University, Edisto Research & Education Center, 64 Research Road, Blackville, SC 29817; [email protected]; 803-284-3343 Ext. 230 Xin Qiao, Doctoral Graduate Student Clemson University, Edisto Research & Education Center, 64 Research Road, Blackville, SC 29817; [email protected]Abstract: Global challenge for the coming decades will be increasing food and fiber production with less water. This can be partially achieved by increasing crop water productivity (WP) - yield or biomass produced per unit water used. While there is abundant information on cotton water use and yield relationship in arid regions, relevant information in humid regions is not as well developed. The objective of this study was to quantify cotton water use and in-season growth parameters in the humid Southeast U.S.A., where water conservation is an emerging issue. Irrigation experiments were conducted in 2009 to 2011 under field conditions as well as under an automatic rainout shelter at a Clemson University research site near Blackville, SC. Season-long data were collected under irrigation regimes ranging from dryland (i.e., no irrigation) to fully irrigated. Cotton seasonal water use ranged from 320 mm at 33% irrigation to 718 mm at full irrigation. Water productivity in the three years ranged from 0.52 to 0.71 kg of seed cotton per m 3 of water applied (irrigation and rainfall). Water productivity normalized for local climate was nearly the same during the three years, averaging 12.5 g/m 2 . Cotton WP and water use values quantified in this study are useful for modeling yield response to water stress and evaluate effects of alternate irrigation regimes and intermittent drought on cotton productivity. Keywords: Water productivity, Water use efficiency, Cotton, Evapotranspiration, Irrigation Introduction Cotton (Gossypium hirsutum L) is cultivated in many countries under both rainfed and irrigated conditions. In the U.S.A., cotton is grown in 17 states across a vast region known as the Cotton Belt. Use of irrigation has been increasing across the humid areas of the Cotton Belt for the last 20 years. In the Cotton Belt as with many parts of the world, irrigated cotton is a considerable water user, but for good reasons. Irrigation can boost yield as well as stabilize yield and quality by ensuring adequate soil water during the entire growing season or at least during critical growth stages in areas where water resources are limited.
Transcript
1
Water Productivity of Cotton in the Humid Southeast – Experimentation
Hamid J. Farahani, Ph.D., Water Management Engineer
USDA-NRCS East National Technology Support Center. 2901 E. Lee Street, Suite 2100, Greensboro, NC 27401; [email protected]; 336-370-3350
Ahmad Khalilian, Ph.D., Professor
Clemson University, Edisto Research & Education Center, 64 Research Road, Blackville, SC 29817; [email protected]; 803-284-3343 Ext. 230
Xin Qiao, Doctoral Graduate Student
Clemson University, Edisto Research & Education Center, 64 Research Road, Blackville, SC 29817; [email protected]
Abstract: Global challenge for the coming decades will be increasing food and fiber production with less water. This can be partially achieved by increasing crop water productivity (WP) - yield or biomass produced per unit water used. While there is abundant information on cotton water use and yield relationship in arid regions, relevant information in humid regions is not as well developed. The objective of this study was to quantify cotton water use and in-season growth parameters in the humid Southeast U.S.A., where water conservation is an emerging issue. Irrigation experiments were conducted in 2009 to 2011 under field conditions as well as under an automatic rainout shelter at a Clemson University research site near Blackville, SC. Season-long data were collected under irrigation regimes ranging from dryland (i.e., no irrigation) to fully irrigated. Cotton seasonal water use ranged from 320 mm at 33% irrigation to 718 mm at full irrigation. Water productivity in the three years ranged from 0.52 to 0.71 kg of seed cotton per m3 of water applied (irrigation and rainfall). Water productivity normalized for local climate was nearly the same during the three years, averaging 12.5 g/m2. Cotton WP and water use values quantified in this study are useful for modeling yield response to water stress and evaluate effects of alternate irrigation regimes and intermittent drought on cotton productivity.
Keywords: Water productivity, Water use efficiency, Cotton, Evapotranspiration, Irrigation
Introduction
Cotton (Gossypium hirsutum L) is cultivated in many countries under both rainfed and irrigated conditions. In the U.S.A., cotton is grown in 17 states across a vast region known as the Cotton Belt. Use of irrigation has been increasing across the humid areas of the Cotton Belt for the last 20 years. In the Cotton Belt as with many parts of the world, irrigated cotton is a considerable water user, but for good reasons. Irrigation can boost yield as well as stabilize yield and quality by ensuring adequate soil water during the entire growing season or at least during critical growth stages in areas where water resources are limited.
A useful relationship between yield and water use is crop water use efficiency or water productivity (WP). A more biological definition of WP is given as biomass or yield produced per unit of transpiration (Steduto et. al., 2007). There is limited control on the part of the irrigator to alter this efficiency. However, WP defined as “the aboveground dry matter or yield (kg) produced per unit land area (m2) per unit of water applied (m)” is more informative as it is largely influenced by the performance of the irrigation system and the degree of water losses beyond crop transpiration. Regardless of the units used, quantification of WP under field conditions is challenging as estimates of crop transpiration and/or evapotranspiration (ET) are needed. This is even more challenging in regions with frequent rainfall, such as in the Southeast due to difficult-to-determine contribution of rainfall to soil water storage.
For the Cotton-Belt, cotton ET increases by about two-fold from the humid East to the arid West. For example, cotton in the desert Southwest requires as high as 1000 mm of water per season for long season varieties while mostly between 500 and 650 mm in the humid Southeast. In Southeast Coastal plains, Bellamy (2009) measured seasonal cotton ET values of about 570 mm using a 1 m2 lysimeter. In Georgia, Suleiman et al. (2007) used FAO-56 crop coefficient procedure to estimate ET values of 370, 584, and 640 mm for 40%, 60%, and 90% irrigation treatments, respectively. Modern, water efficient cotton varieties tend to provide at least 27 kg (60 pounds) of lint and 41 kg (90 pounds) of seed for every 25 mm (1 inch) of water used. Data from a wide number of locations shows cotton WP values ranging from 0.41-0.95 kg/m3 for seed cotton yield (Zwart and Bastiaanssen, 2004). Bellamy (2009) and Khalilian et al. (2012) reported WP of cotton from 0.42 to 0.66 kg/m3 for different cotton varieties grown in SC. While there is a large collection of information for yield and water use related to cotton in arid regions, relevant information under humid conditions is not as well developed.
The main objective of this study was to determine water use, WP, and in-season plant growth parameters of cotton in the humid Southeast. The experiments were conducted in 2009 and 2010 under field environments and in 2011under a controlled environment utilizing an automated rainout shelter at a research facility near Blackville, SC. The data was subsequently utilized in a companion study to model cotton yield response to water using the recently released AquaCrop model by the Food and Agriculture Organization (FAO) of the United Nations. Results from the second study are presented in Qiao (2012) and Qiao et al. (2012, in this proceedings).
Methods and Materials
Field experiments were conducted at the Edisto Research and Education Center (EREC) of Clemson University near Blackville, South Carolina (see Qiao, 2012 for detail). Replicated tests were conducted in three season-long experiments during 2009 to 2011 growing seasons to determine water use, WP, and growth parameters of cotton under different irrigation regimes ranging from no irrigation (dryland) to meeting 100% of full cotton water requirements. Experiments in 2009 and 2010 were conducted on a typical coastal plain soil (Barnwell loamy sand), in a field named "E5". Experiments in 2011 were conducted in field plots with Wagram sand under an automated rainout shelter that covered the plots during rainfall events.
Deltapine Land (DP 0935 B2RF) cotton variety was planted on May 22, 2009 and on June 7, 2010 at 96 cm row spacing. Fertilizers, herbicide and insecticide were applied as needed. In 2009, the experimental site was divided into twelve 7.9 m long plots. Field was disked and
3
subsoiled to a depth of 30cm before planting. Four treatments of 0, 33, 66, and 100% irrigation were planned in 2009, but excessive rainfall during the season made it impossible to maintain irrigation treatments, with all treatments then regarded as well-watered. In 2010, the experimental site was divided into 9 plots. Each plot was 20 m long, 36 rows wide. A 3 m alley between each plot was used to separate test plots. The nine plots were grouped into 3 blocks with irrigation treatments of 0%, 75%, and 100% randomly assigned to each plot.
Data collected from the rainout shelter experiment in 2011 was used to parameterize the AquaCrop model mainly because the shelter data was of higher detail than the field E5 data and the rainfall complications were eliminated by the shelter. The area under the rainout shelter (Figure 1, left) was divided into nine (4-rows by 5m) plots and the three irrigation treatments (33, 66, and 100% of the full irrigation) were replicated three times. The cotton variety DP 0924 B2RF was planted on 16 May using a four-row JD planter and carried to yield using recommended practices for seeding and nutrient application and insect and weed control. Cotton was hand harvested on Oct 6, 2011.
The shelter was moved by two independent, twin-drive mechanisms, one on each side of the building. The shelter could move at 15 m/min on a metal railway built on concrete, and could cover the whole plot in approximately one min.
Figure 1. View of the rainout shelter plots (left) and the linear move system with LEPA (right)
This rainout shelter was automated by using a rain-clik sensor (Hunters Rain-clik sensor, Hunters Inc.), which triggered a relay to start the motors and move the shelter to cover the plots from rainfall. When the rainfall stopped, the rain-clik disks shrank by drying and released the micro switch, causing the motors to run in reverse returning the plots to uncovered conditions. The drying process took about 30 minutes under normal conditions.
In all experiments, volumetric soil water content (SWC) was measured at 15 cm intervals by a 503DR Hydroprobe neutron probe. Readings were taken in the mid-morning and before irrigation. For field E5, readings were taken at weekly interval to the depth of 90 cm. For the rainout shelter, readings were taken to the depth of 60 cm. The neutron probe readings were taken once a week in all plots and twice a week in the 100% irrigation treatment plots.
4
In all fields, irrigation was initiated as soon as possible after soil water content in the root zone approached 50% of available soil water. A linear move irrigation system with LEPA nozzles was used for irrigation of plots in field E5 (Figure 1, right). At the rainout shelter, cotton was irrigated using drip tapes with 30 cm spacing emitters (1.16 L/hr flow rate). Drip laterals were placed on the soil surface next to the row. For the 100% treatment, irrigation was initiated after 50% of available water was depleted. Irrigation was then applied to bring the soil water contents to field capacity. In other treatments at the shelter, irrigation occurred at the same time but the duration was reduced to 33% and 66% of the full irrigation.
Cotton growth development was monitored in terms of growth stages, canopy cover, and aboveground dry biomass. Canopy development was monitored by AccuPAR LP–80 (Decagon Devices, Inc.) as well as a digital camera at the same time on weekly intervals. AccuPAR LP–80 measures Photosynthetically Active Radiation (PAR) in the 400-700 nm wavebands. When readings were taken, the photosynthetic bar was located at the center of the plant row (Figure 2). Readings were taken both above and below the plant canopy near solar noon in each plot and canopy cover was calculated as one minus the ratio of the PAR readings.
Figure 2. Measurement of PARabove (left) and PARbelow (right) at the shelter plots
Digital photos were also taken vertically downward at the center of plant row in each plot. A 96-cm stick was placed in the middle. Photos were then cropped exactly to 96-cm width. VegMeasure version 1.6 (VegMeasure Project, Oregon State University) was used to analyze the pictures for green cover.
During the growing seasons, two plants were sampled each week from each plot for biomass determination. Plant samples were dried at 65℃ for 48 hours to get dry weight of biomass (g). Aboveground dry biomass was multiplied by plant population to obtain aboveground dry biomass per unit area (g/m2). Yield was obtained by plant sampling at the end of season.
Soil water budget method was used to estimate actual crop evapotranspiration (ET). Reference ETo was calculated using FAO-56 approach with all required meteorological variables secured from an on-site, advanced NOAA weather station. Two WP definitions were quantified in this
5
study, The first is defined by:
1
where “total water applied” is rainfall plus irrigation. The second WP definition is referred to as normalized WP (WP*; normalized by ETo for local climate) and was calculated using:
2
Where B is aboveground dry biomass per unit area (g/m2). In Equation 2, the denominator is the unit-less normalized crop ET in the period when dry biomass is accumulated.
Results and Discussion
The maximum air temperature during the growing seasons ranged from 14 to 39 oC, while minimum air temperature ranged from -1 to 26 oC. Total solar radiation ranged from 2 to 30 MJ/d/m2 with reference ET ranging from 1 to 7 mm per day during the three years (Figure 3).
Figure 3. Daily Reference Evapotranspiration (mm) from May 2009 to October 2011
Total rainfall during the growing seasons was 371 and 544 for 2009 and 2010, with rainfall excluded in the 2011 shelter experiments. Soil water at various depths was averaged to calculate profile SWC of the top 60cm soil. Figure 4 presents trend of profile SWC in field E5 during 2009 for days after planting (DAP).
6
Figure 4. Profile soil water content and irrigation and rainfall amounts at field E5 in 2009
Figure 5 presents the same trend of profile SWC for different irrigation treatments in field E5 in 2010. There were four irrigation events during 2010, with the difference in amount of irrigation applied to 100% and 0% equal to 63 mm. The total rainfall during growing season was 544 mm. which was large enough to reduce treatment effects. Cumulative ET during 2010 growing season was 617, 594, and 538 mm in treatments of 100%, 75%, and 0%, respectively (Figure 5). The difference in cumulative ET among different treatments was mainly due to irrigation. It is noted that cumulative ET for irrigated cotton was less than ETo by at least 100 mm water.
7
Figure 5. Profile soil water content (top) and cumulative cotton ET (bottom) for the three treatments at field E5 in 2010
Irrigation treatments at the rainout shelter plots started 36 DAP. Volumetric SWC in the sandy Wagram soil varied between a high of 11% and a low of 6%, with the lowest values recorded in the 33% treatment. As shown in Figure 6, cumulative ET for the 100, 66, and 33% irrigation treatments at the shelter were 717, 517, and 321mm, respectively, with the differences mainly due to different amount of irrigation applied and differences in crop canopy size.
Figure 6. Cumulative cotton ET for the three irrigation treatments at the rainout shelter in 2011
Canopy Cover (CC)
Canopy cover was measured by a digital camera during 2009 in field E5 (Fig. 7). As shown, CC approached maximum values of about 85% by 60 DAP, and senescence started around 108 DAP.
8
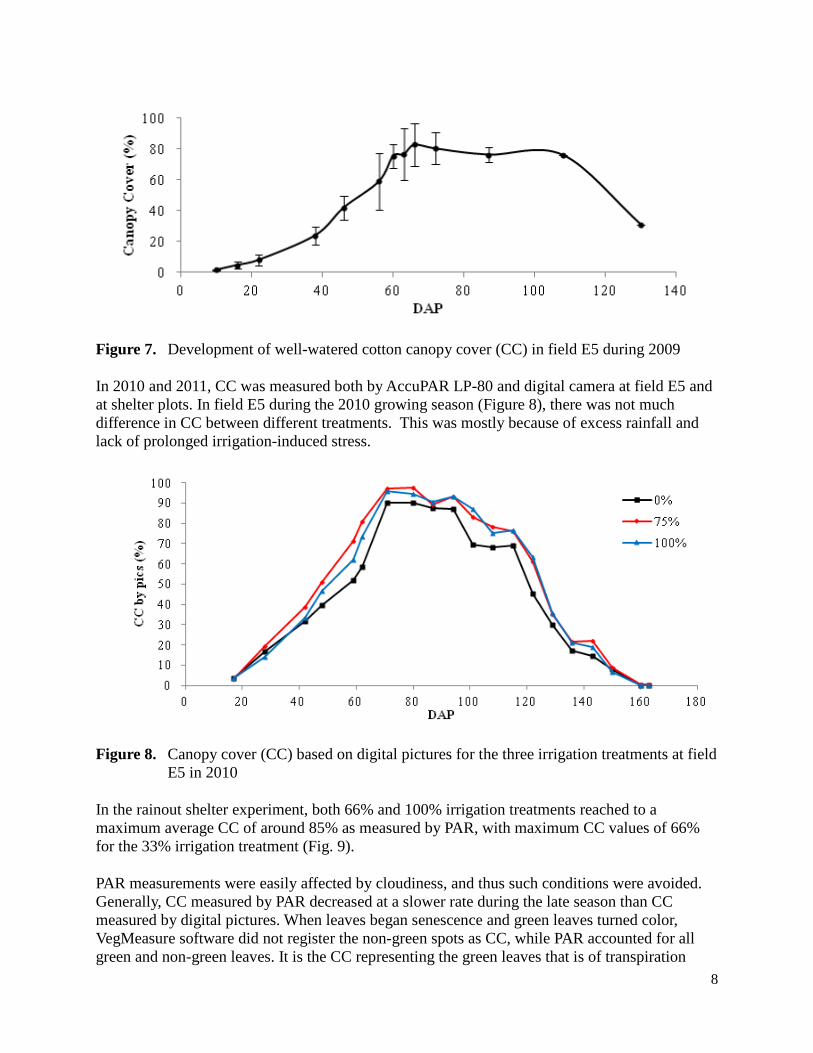
Figure 7. Development of well-watered cotton canopy cover (CC) in field E5 during 2009
In 2010 and 2011, CC was measured both by AccuPAR LP-80 and digital camera at field E5 and at shelter plots. In field E5 during the 2010 growing season (Figure 8), there was not much difference in CC between different treatments. This was mostly because of excess rainfall and lack of prolonged irrigation-induced stress.
Figure 8. Canopy cover (CC) based on digital pictures for the three irrigation treatments at field E5 in 2010
In the rainout shelter experiment, both 66% and 100% irrigation treatments reached to a maximum average CC of around 85% as measured by PAR, with maximum CC values of 66% for the 33% irrigation treatment (Fig. 9).
PAR measurements were easily affected by cloudiness, and thus such conditions were avoided. Generally, CC measured by PAR decreased at a slower rate during the late season than CC measured by digital pictures. When leaves began senescence and green leaves turned color, VegMeasure software did not register the non-green spots as CC, while PAR accounted for all green and non-green leaves. It is the CC representing the green leaves that is of transpiration
9
consequence, suggesting the utility of a simple digital camera in CC measurement.
Figure 9. Canopy cover (CC) based on PAR data for the three irrigation treatments at rainout shelter in 2011
Biomass and Water Productivity
For the 2009 field E5 data, normalized WP (WP*) was calculated to be 12.9 g/m2 by regression of aboveground dry biomass versus sum of ET/ETo with R2 of 0.787 (shown in Figure 10).
Figure 10. Normalized WP (slope of line) cotton using the 2009 E5 data
In 2010, developments of aboveground dry biomass for different irrigation treatments in field E5 are shown in Figure 11. Up to 90 DAP, there were small differences in aboveground biomass between the three irrigation treatments, but continuously higher values were found for the 75% and 100% treatments after that.
10
Figure 11. Aboveground dry biomass of cotton under three irrigation treatments in field E5 during 2010
Normalized WP of cotton in 2010 was 12 g/m2, with an R2 of 0.646 (Figure 12). Considering the large variability in plant biomass under field conditions, the WP value in 2010 was nearly the same as WP value in 2009 (12.9 g/m2).
Figure 12. Normalized WP (slope) using the 2010 data at field E5
At the shelter, total aboveground biomass was similar in the 66% and 100% treatments, but substantially lower in the 33% irrigation treatment. Maximum values were 1183 in 33%, 1469 in 66%, and 1392 g/m2 in 100% treatments, with values in the 33% treatment being consistently lower values than the other two treatments. Normalized WP of cotton in 2011 shelter experiment (Figure 13) was 12.7 g/m2, which was quite similar to the 2010 value of 12 g/m2 and 2009 value of 12.9 g/m2. This apparent constancy of normalized WP (or conservative behavior as discussed in Steduto et al. 2007) is encouraging since it offers a simple biomass or even yield response to
11
water model (i.e., by using a harvest index value).
Figure 13. Normalized WP (slope) of 2011 cotton at the rainout shelter experiment
Table 1 summarizes cotton yield, water applied and WP (yield per total applied water) in the three experiments. Statistical analysis showed no significant differences in yields or WP between treatments in 2010. In 2011, yields of the 100% and 66% treatments were significantly higher than those obtained for the 33% treatment. However, there were no significant difference in seed cotton yields between the 66% and 100% irrigation treatments in 2011. As noted, WP values in kg of lint plus seed per m3 of water applied ranged from 0.53 to 0.71. This range is well within the global range of 0.41-0.95 kg/m3 reported in Zwart and Bastiaanssen (2004) and also consistent with values reported in Bellamy (2009) and Khalilian et al. (2012) for other cotton varieties in South Carolina. Considering the higher yield and WP values for the 66 and 75% treatments as compared to the 100% treatment suggest advantages to deficit irrigation in cotton. However, we feel that additional seasons of data under a range of irrigation are needed to better understand the behavior of deficit irrigated cotton in the humid regions.
Table 1. Cotton yield (lint and seed), seasonal irrigation, precipitation, and ET amounts, and WP values for the three experiments in 2009-2011
Note: I = irrigation, P = precipitation. When rainout shelter was operational, rain was not counted (except 76 mm early in season). “WP” values were calculated as yield per total water applied (I+P).
12
Conclusions
The normalized WP values for cotton under the three experiments were quite the same at 12.9, 12, and 12.7 g/m2, with an average value of 12.5 g/m2. These values are lower than literature suggested WP value of 15 g/m2 for C3 plants, but not too far off considering that we used ET in place of T in Equation 2. This apparent conservative behavior of normalized WP is encouraging, suggesting the use of normalized WP as a simple biomass model which can be equally a yield model by using an expected value for cotton harvest index. The utility of this simple model can be recognized in predicting yield response to deficit irrigation and drought stress. Future work in this area is suggested herein.
References:
Allen, R.G., Periera, L.S., Raes, D., Smith, M., 1998. Crop evapotranspiration; Guidelines for computing crop water requirements. Irrigation and Drainage Paper No. 56, United Nations, Food and Agricultural Organization, Rome.
Bellamy, C.A., 2009. Sensor-based soil water monitoring to more efectively manage agricultural water resources in coastal plain soils. Master Thesis. Clemson, SC: Clemson University, Department of Biosystems Engineering.
Qiao, X., 2012. Parameterization of FAO AquaCrop model for irrigated cotton in the humid Southeast U.S.A. Master Thesis. Clemson, SC: Clemson University, Department of Biosystems Engineering.
Khalilian, A., Han, Y., Henderson, W., 2012. Water use efficiency of different cotton cultivars. Proceedings of the Beltwide Cotton Conferences, Orlando, Florida, January 4-7, 2012, pp. 517-521.
Steduto, P., Hsiao, T.C., Fereres, E., 2007. On the conservative behavior of biomass water productivity. Irrigation Sci 25, 189-207.
Suleiman, A.A., Soler, C.M.T., Hoogenboom, G., 2007. Evaluation of FAO-56 crop coefficient procedures for deficit irrigation management of cotton in a humid climate. Agr Water Manage 91, 33-42.
Zwart, S.J., Bastiaanssen, W.G.M., 2004. Review of measured crop water productivity values for irrigated wheat, rice, cotton and maize. Agr Water Manage 69, 115-133.