Page 1
FINAL
Piney Run Reservoir WQA of Eutrophication Document version: September 27, 2004
Water Quality Analysis of Eutrophication for Piney Run Reservoir, Carroll County, MD
FINAL
Prepared by:
Maryland Department of the Environment Montgomery Park Business Center
1800 Washington Boulevard, Suite 540 Baltimore, Maryland 21230-1718
Submitted to:
Water Protection Division U.S. Environmental Protection Agency, Region III
1650 Arch Street Philadelphia, PA 19103-2029
September 2004
Submittal Date: September 30, 2004 Approval Date: January 20 ,2005
Document version: September 27, 2004
Page 2
FINAL
Piney Run Reservoir WQA of Eutrophication Document version: September 27, 2004
Table of Contents List of Figures.................................................................................................................................................................i
List of Tables..................................................................................................................................................................i
List of Abbreviations .................................................................................................................................................... ii
EXECUTIVE SUMMARY ......................................................................................................................................... iii
1.0 INTRODUCTION...........................................................................................................................................1
2.0 GENERAL SETTING.....................................................................................................................................2
3.0 WATER QUALITY CHARACTERIZATION...............................................................................................5
4.0 ASSESSMENT OF EUTROPHICATION......................................................................................................7 4.1 NUTRIENTS..................................................................................................................................................7 4.2 DISSOLVED OXYGEN...................................................................................................................................7 4.3 CHLOROPHYLL A .........................................................................................................................................7 4.4 CONCLUSION...............................................................................................................................................8
5.0 RECOMMENDATION...................................................................................................................................8
6.0 PUBLIC PARTICIPATION............................................................................................................................8
REFERENCES ............................................................................................................................................................10
Appendix A ................................................................................................................................................................A1
Appendix B.................................................................................................................................................................B1
Page 3
FINAL
Piney Run Reservoir WQA of Eutrophication Document version: September 27, 2004
i
List of Figures
Figure 1: Location Map of Piney Run Reservoir in Carroll County, Maryland ................................3 Figure 2: Predominant Land Use in the Piney Run Reservoir Watershed.........................................4 Figure 3: Land Use in the Drainage Basin of Piney Run Reservoir ..................................................5
List of Tables Table 1: Current Physical Characteristics of Piney Run Reservoir ..................................................2
Page 4
FINAL
Piney Run Reservoir WQA of Eutrophication Document version: September 27, 2004
ii
List of Abbreviations CC-WRPP Carroll County Water Resource Planning Division cfs Cubic Feet per Second COMAR Code of Maryland Regulation CWA Clean Water Act DNR Department of Natural Resources DO Dissolved Oxygen EPA Environmental Protection Agency m Meters MDE Maryland Department of the Environment mg/l Milligrams Per Liter mi2 Square miles NCHF North Central Hardwood Forest NGP Northern Glaciated Plain NLF Northern Lakes and Forest TKN Total Kjeldahl Nitrogen TMDL Total Maximum Daily Load TN Total Nitrogen TP Total Phosphorus TSI Trophic State Index WCBP Western Corn Belt Plains WPP Watershed Protection Plan WQLS Water Quality Limited Segment µg/l Micrograms Per Liter
Page 5
FINAL
Piney Run Reservoir WQA of Eutrophication Document version: September 27, 2004
iii
EXECUTIVE SUMMARY Section 303(d) of the federal Clean Water Act (CWA) and the U.S Environmental Protection Agency’s (EPA) implementing regulations direct States to identify and list waters, known as water quality limited segments (WQLSs), in which current required controls of a specified substance are inadequate to achieve water quality standards. For each WQLS, the State is to either establish a Total Maximum Daily Load (TMDL) of the specified substance that the waterbody can receive without violating water quality standards, or demonstrate that water quality standards are being met. Piney Run Reservoir in the South Branch Patapsco River watershed (02-13-09-08) was identified on Maryland’s 1998 list of WQLSs as being impaired by nutrients and sediments. The sediment impairment was addressed in the “Water Quality Analysis of Sedimentation for Piney Run Reservoir in Carroll County, Maryland,” approved by EPA in November 2003. The current report provides an analysis of recent nutrient-related monitoring data, which show that water quality parameters associated with nutrients fall within the State’s standards at the present time. Piney Run Reservoir thus currently meets its designated use. However, the reservoir is borderline between mesotrophic and eutrophic status with respect to nutrient supply, biological productivity, water clarity, and oxygen depletion in the hypolimnion. Because the data fall just within the State’s water quality standards and the watershed is located in a rapidly developing area, Maryland Department of the Environment (MDE) will require that Carroll County develop a Watershed Protection Plan (WPP), otherwise MDE will develop a TMDL to assure the necessary protections. The WPP is to protect the quality of the water supply source, manage a recreational water resource, and monitor the effects of changes in the watershed that might generate new pollutant sources. MDE believes such a plan is needed to ensure that there is no additional degradation of water quality that could threaten the reservoir, and will protect water quality sooner and more effectively than a TMDL. Barring the receipt of any contradictory data, this report will be used to remove Piney Run Reservoir from the 303(d) list on the understanding that a WPP will be completed. Although the waters of Piney Run Reservoir do not display signs of eutrophication caused by excessive nutrients, the State reserves the right to require additional pollution controls in the watershed if evidence suggests that nutrients from the basin are contributing to downstream water quality problems.
Page 6
FINAL
Piney Run Reservoir WQA of Eutrophication Document version: September 27, 2004
1
1.0 INTRODUCTION Section 303(d) of the federal Clean Water Act (CWA) and U.S. Environmental Protection Agency (EPA)'s implementing regulations direct each State to identify and list waters, known as water quality limited segments (WQLSs), in which current required controls of a specified substance are inadequate to achieve water quality standards. This list of impaired waters is commonly referred to as the “303(d) list”. For each WQLS, the State is to either establish a Total Maximum Daily Load (TMDL) of the specified substance that the waterbody can receive without violating water quality standards, or demonstrate that water quality standards are being met. A segment identified as a WQLS might not require the development and implementation of a TMDL if current information contradicts the previous finding of an impairment. Based on EPA’s guidance for water quality-based decisions, the reasons obviating the need for a TMDL are as follows: (1) recent data indicate that the impairment no longer exists (i.e., water quality standards are being met); (2) more recent and updated water quality modeling demonstrates that the waterbody attains standards; (3) refinements to water quality standards, or the interpretation of those standards, result in the attainment of the standard; and (4) corrections are made to errors in the original listing. Scenario 1 applies to Piney Run Reservoir. However, recent information shows that the reservoir is at the threshold of impairment and, therefore, warrants a Watershed Protection Plan (WPP). Piney Run Reservoir, in the South Branch Patapsco River watershed (02-13-09-08), was identified on Maryland’s 1998 303(d) list of WQLSs as being impaired by nutrients and sediments. The 1998 listing was prompted by an assessment of data associated with Piney Run Reservoir (Maryland Department of Natural Resources [DNR], 1995). This report provides more recent information that describes Piney Run Reservoir as being close to, but not exceeding, the applicable water quality standards associated with nutrient loading. The sediment impairment was addressed separately in 2003. The reservoir is borderline between mesotrophic and eutrophic with respect to nutrient supply, biological productivity, water clarity, and oxygen depletion in the hypolimnion. Because the current water quality is close to the threshold of criteria for nutrients and the watershed lies in a rapidly developing area, Piney Run Reservoir warrants a WPP to protect the lake and to prevent any increase in phosphorus loads. The remainder of this report describes the general setting of the Piney Run Reservoir watershed, presents a discussion of the water quality characterization process, and provides conclusions with regard to the characterization. The data suggest that Piney Run Reservoir is at or near its capacity to assimilate nutrient loads without violating water quality standards.
Page 7
FINAL
Piney Run Reservoir WQA of Eutrophication Document version: September 27, 2004
2
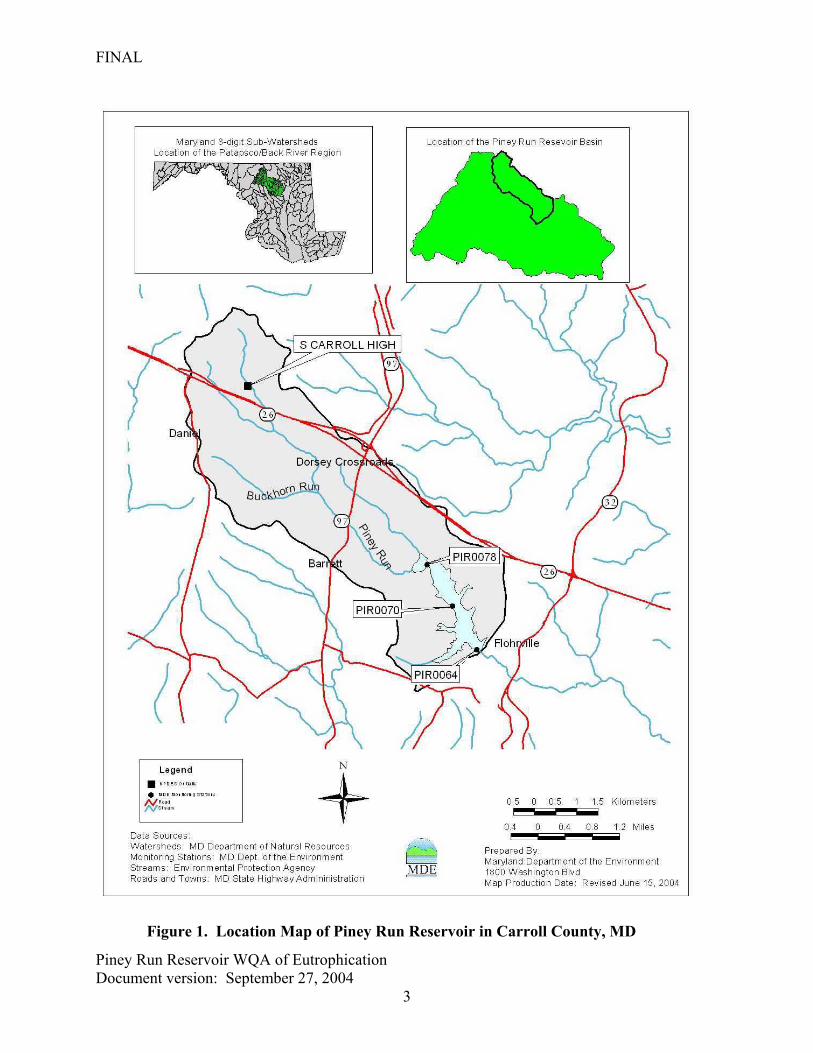
2.0 GENERAL SETTING Piney Run Reservoir is an impoundment located near Eldersburg in Carroll County, Maryland (Figure 1). The impoundment, which is owned by the Carroll County Commissioners, lies on Piney Run, a tributary of the South Branch of the Patapsco River. An earthen dam was installed in 1974 for the purpose of water supply, flood control and creating the lake for recreational uses. Piney Run Reservoir lies in the Piedmont ecoregion, which occurs between the Appalachian Mountains and the Atlantic Coastal Plain on the East Coast. Topography is rolling to moderately hilly, soils are varied, the land use is a mixture of forest, agricultural and developed, and there are few natural lakes (none in Maryland). The soils immediately surrounding the lake are the Glenelg-Chester-Manor association (Soil Conservation Service, 1969). These soils are generally well drained, chiefly rolling and hilly, micaceous soils that are deep over mica schist. The outer watershed area is comprised of soils of the Glenelg-Manor-Mt. Airy association. These soils are well drained and somewhat excessively drained, mainly hilly soils that are deep and moderately deep over schist. Inflow to the lake is primarily via Piney Run and one unnamed tributary. Discharge from the reservoir is to Piney Run, which discharges to the South Branch Patapsco River. Land use in the watershed draining to Piney Run Reservoir is predominantly agricultural (Figure 2). Land use distribution in the watershed is approximately 24% developed, 22% forested/herbaceous, 4% open water, and 50% agricultural (Figure 3) (Maryland Department of Planning, 1997). There is one point source contribution within the watershed. The South Carroll High School Wastewater Treatment Plant (NPDES Permit MD0024589) is operated by Carroll County Bureau of Utilities. Treated effluent is discharged into Piney Run. This facility has a permitted flow discharge of 50,000 GPD. Monitored parameters include BOD, TSS, TP, TN, and flow (see Appendix A). Several relevant statistics for Piney Run Reservoir are provided below in Table 1.
Table 1. Current Physical Characteristics of Piney Run Reservoir
Location: Carroll County, MD lat. 39.39o long. 76.98o
Surface Area: 298 acres = (12,763,080ft2) = (1,185,729m2) Length: 1.24 mi Maximum Width: 1200 feet Average Lake Depth: 26 feet Maximum Depth: 54.4 feet Purpose Water Supply, Recreation and Flood Control Basin Code 02-13-09-08 Volume of Lake: 7,748 acre-feet (9,557,017 m3)
Drainage Area to Lake: 10.4 mi2 Average Discharge: 12.8 cfs
Page 8
FINAL
Piney Run Reservoir WQA of Eutrophication Document version: September 27, 2004
3
Figure 1. Location Map of Piney Run Reservoir in Carroll County, MD
Page 9
FINAL
Piney Run Reservoir WQA of Eutrophication Document version: September 27, 2004
4
Figure 2. Predominant Land Use in the Piney Run Reservoir Watershed
Page 10
FINAL
Piney Run Reservoir WQA of Eutrophication Document version: September 27, 2004
5
Water4%
Forest/Herbaceous
22%
Urban24%
Mixed Agriculture
50%
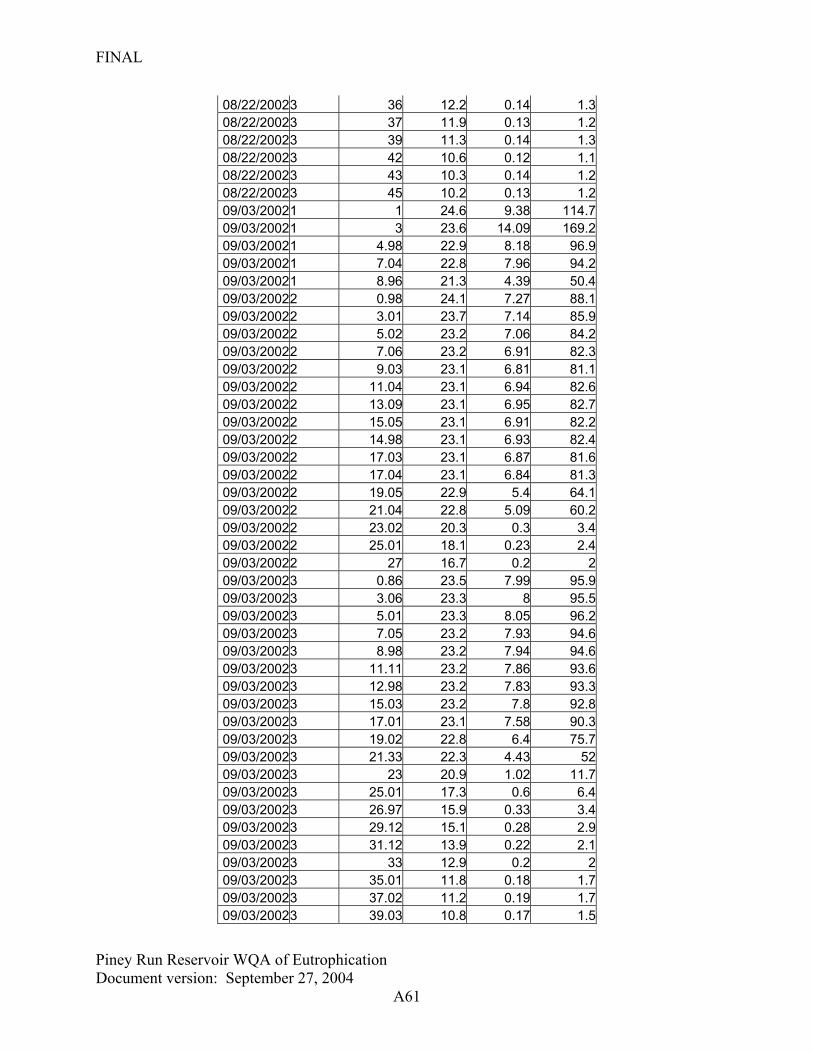
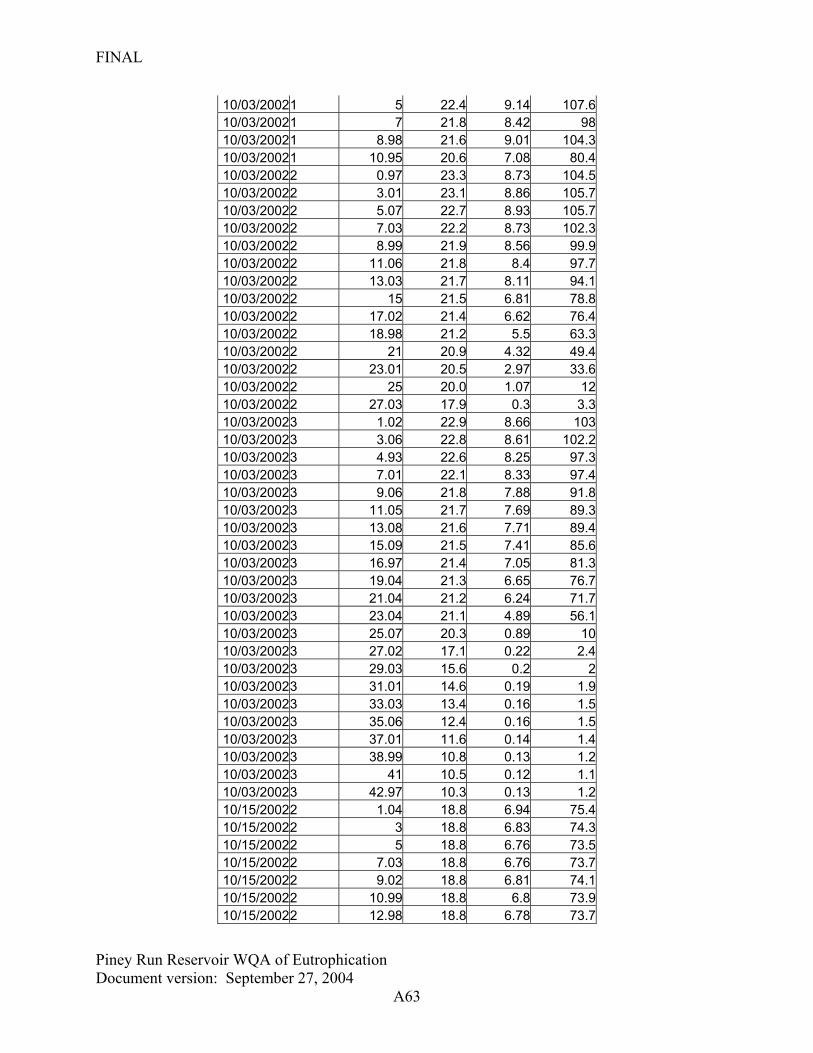
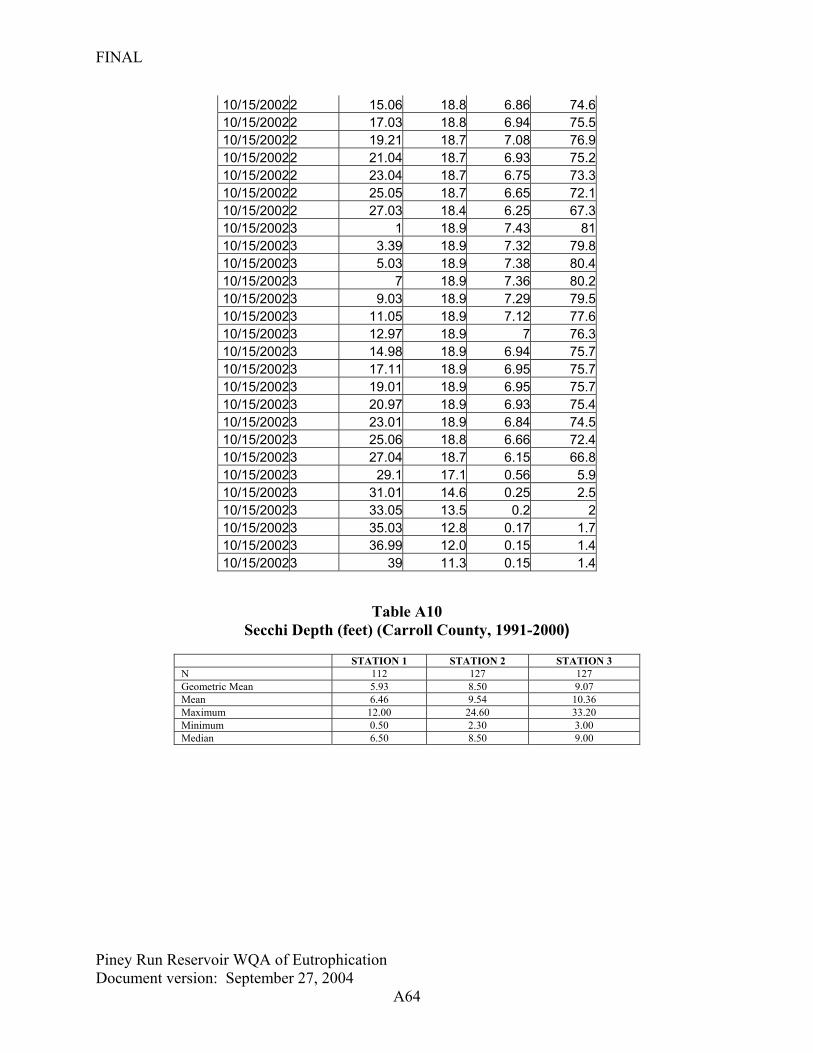
3.0 WATER QUALITY CHARACTERIZATION Piney Run Reservoir was identified in the Maryland Lake Water Quality Assessment Report (DNR, 1993) as having nuisance levels of algae and dissolved oxygen (DO) levels below 2.0 mg/l in the lower one-half to two-thirds of the water column during stratification. As a result of this evaluation, Piney Run Reservoir was added to Maryland’s 1998 303(d) list. Piney Run Reservoir was monitored in October, November and December of 1999 and in 2000 (January through August) (MDE, 2000). Water samples were collected from a vertical profile of the water column. The Chesapeake Biological Laboratory analyzed samples for total phosphorus (TP), soluble orthophosphorus, nitrate and nitrite, total nitrogen (TN), total organic solvents and chlorophyll a. Physical measurements of depths, water temperatures, pH, conductivity and DO were recorded in the field from mainly the surface, and occasionally from middle and lower portions of the water column. Detailed water quality data are presented in Tables A1 through A11 (Appendix A). Carroll County Water Resource Planning Division’s available monitoring data from 1991 to 2002 were also examined.
3.1 WATER QUALITY STANDARDS A water quality standard is the combination of a designated use for a particular body of water and the water quality criteria established to protect that use. Designated uses include activities such as swimming, drinking water supply, and trout propagation and harvest. Water quality criteria consist of narrative statements and numeric values designed to protect the designated uses. Criteria may differ among waters with different designated uses. Maryland’s General Water Quality Criteria prohibit pollution of waters of the State by any material in amounts sufficient to create a nuisance or interfere directly or indirectly with designated uses. See Code of Maryland Regulations (COMAR) 26.08.02.03B(2). Excessive eutrophication, indicated by elevated levels of chlorophyll a, can produce nuisance levels of algae that interfere with designated uses such as fishing and swimming. Maryland’s water
Figure 3. Land Use in Drainage Basin of Piney Run Reservoir
Page 11
FINAL
Piney Run Reservoir WQA of Eutrophication Document version: September 27, 2004
6
quality standards presently do not impose a limit on the concentration of nutrients in the water column.1 Rather, Maryland manages nutrients indirectly by limiting their effects expressed in terms of excess algal growth and low DO. Piney Run Reservoir, an impoundment on a tributary of the Piney Run near Eldersburg, has been designated a Use III-P waterbody, pursuant to which it is protected for water contact recreation, natural trout waters and public water supply. See COMAR 26.08.02.02B. Use III-P waters are subject to a DO criterion of not less than 5.0 mg/l at any time, with minimum daily average of not less than 6 mg/l (COMAR 26.08.02.03-3E) unless natural conditions result in lower levels of DO (COMAR 26.08.02.03A). The DO concentration in the deeper portions of reservoirs occasionally falls below 5.0 mg/l due to natural thermal stratification. The Use III-P designation requires that the reservoir not become eutrophic. An endpoint, seeking to preserve and enhance the mesotrophic status of the reservoir, is a maximum permissible chlorophyll a level of 10 µg/l. This corresponds approximately to a Carlson’s Trophic State Index (TSI) of 53, which is at the boundary between mesotrophic and eutrophic condition (Carlson, 1977). Although designated as a drinking water supply, the reservoir is not currently used for that purpose. Other states have adjusted their trophic-state expectation for lakes or impoundments with differing uses. Minnesota, for example, uses an ecoregion-based approach. Heiskary (2000) reports that individuals utilizing lakes for recreational purposes (water contact, fishing) demanded relatively clear, less enriched lakes in the Northern Lakes and Forest (NLF) and North Central Hardwood Forest (NCHF) ecoregions. In the Western Corn Belt Plains (WCBP) and Northern Glaciated Plains (NGP) ecoregions, however, users accepted relatively greater enrichment and less clarity. Under Minnesota’s classification system, lakes in the NLF and NCHF ecoregions are considered to fully meet use support with Trophic State Indices (TSIs) of about 53 and 57, respectively. Lakes in the other two ecoregions, both of which are largely agricultural, are considered to fully support use with TSIs of about 60 (Heiskary, 2000).
1 Maryland limits the ammonia form of nitrogen from wastewater treatment plants, due to its toxic effects on some aquatic organisms.
Page 12
FINAL
Piney Run Reservoir WQA of Eutrophication Document version: September 27, 2004
7
4.0 ASSESSMENT OF EUTROPHICATION
4.1 Nutrients Nitrogen and phosphorus are essential nutrients for algae growth. However, common types of algae require different amounts of these two nutrients. If one nutrient is available in great abundance relative to the other nutrient, then the nutrient that is less available restricts the amount of plant matter that can be produced, regardless of the amount of the other nutrient that is available. This latter nutrient is called the “limiting nutrient”. In general, an N:P ratio in the range of 5:1 to 10:1 by mass is associated with plant growth being limited by neither phosphorus nor nitrogen. If the N:P ratio is greater than 10, phosphorus tends to be limiting, and if the N:P ratio is less than 5, nitrogen tends to be limiting (Chiandani et al., 1974). Examination of the TN:TP ratio indicates that Piney Run Reservoir is phosphorus limited; thus, efforts to manage nutrients should be focused on phosphorus. As mentioned earlier, Maryland’s water quality standards presently do not place a limit on the concentration of nutrients in the water column. Rather, Maryland manages nutrients indirectly by limiting their effects expressed in terms of excess algal growth and low DO.
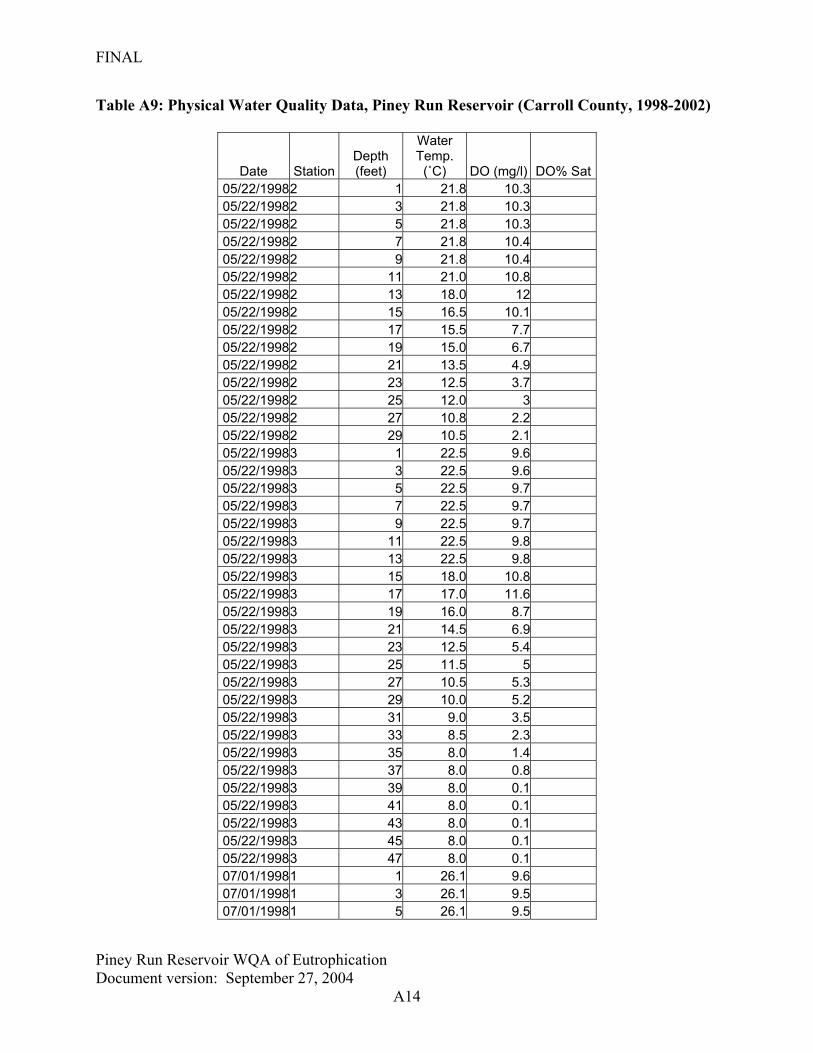
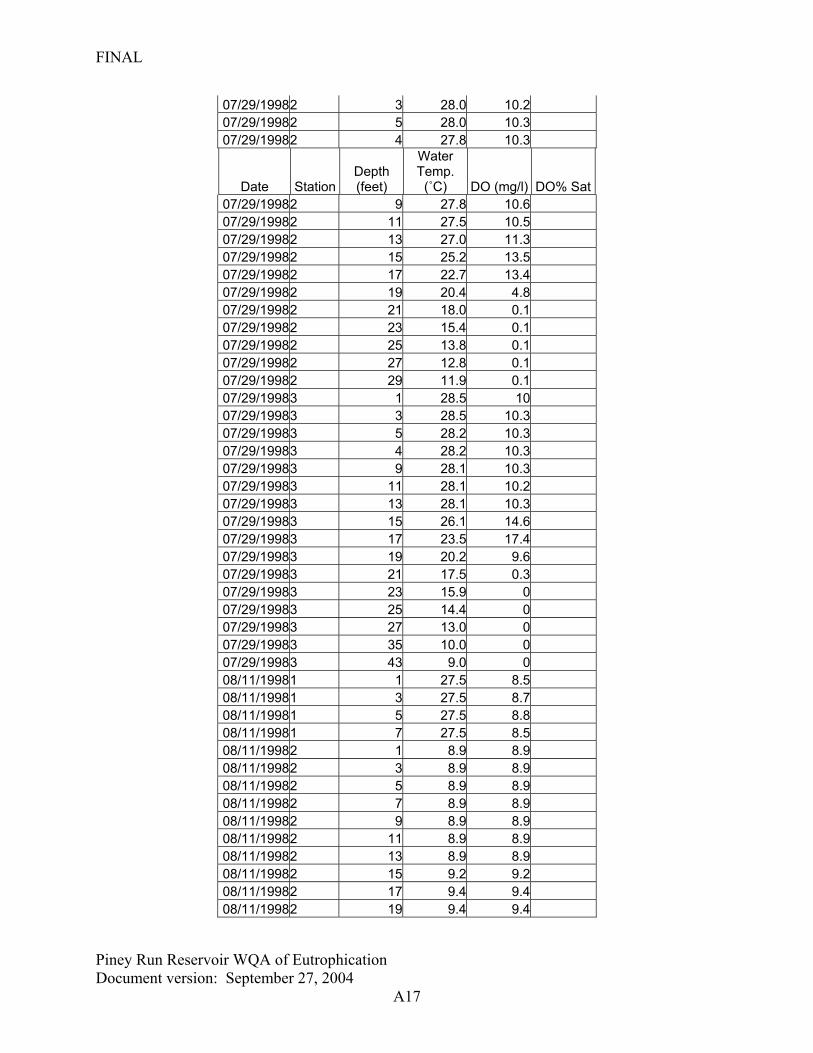
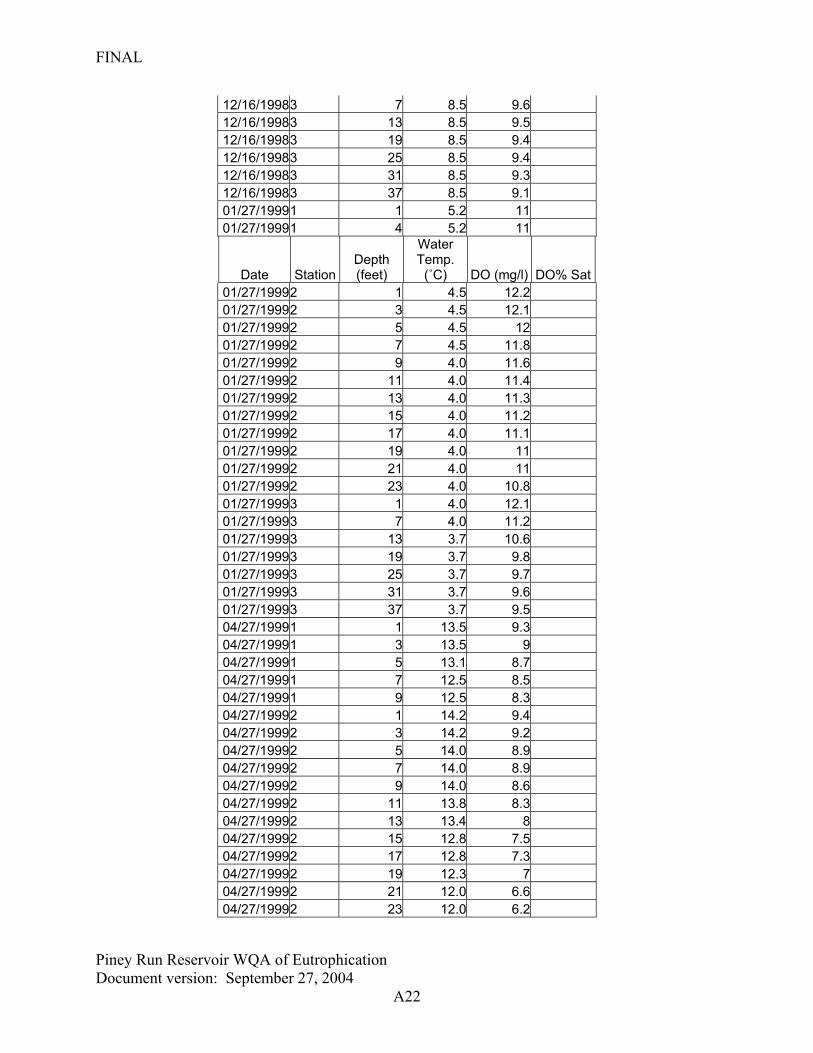
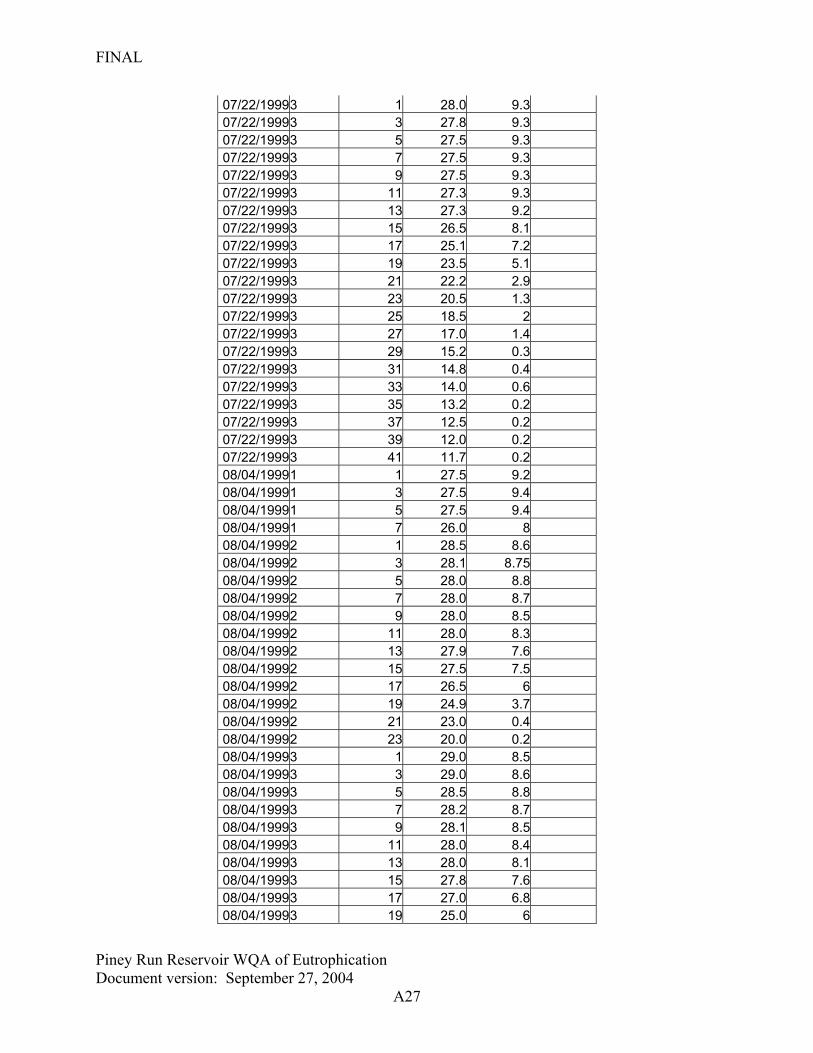
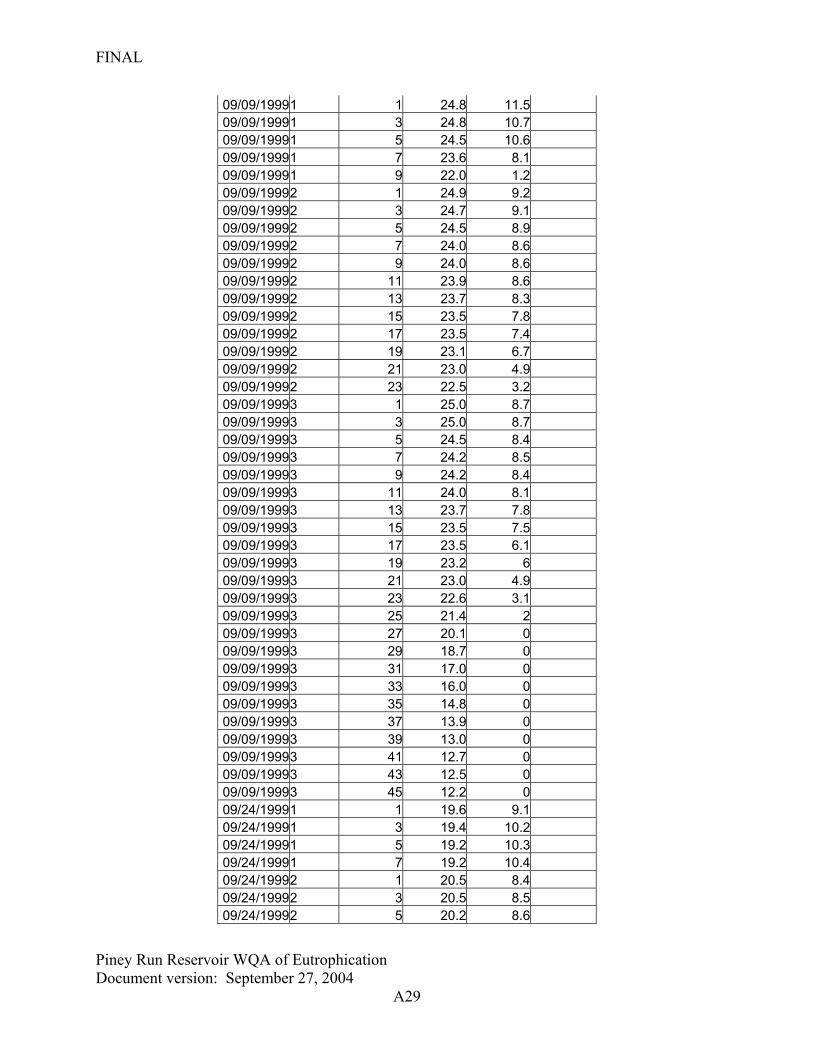
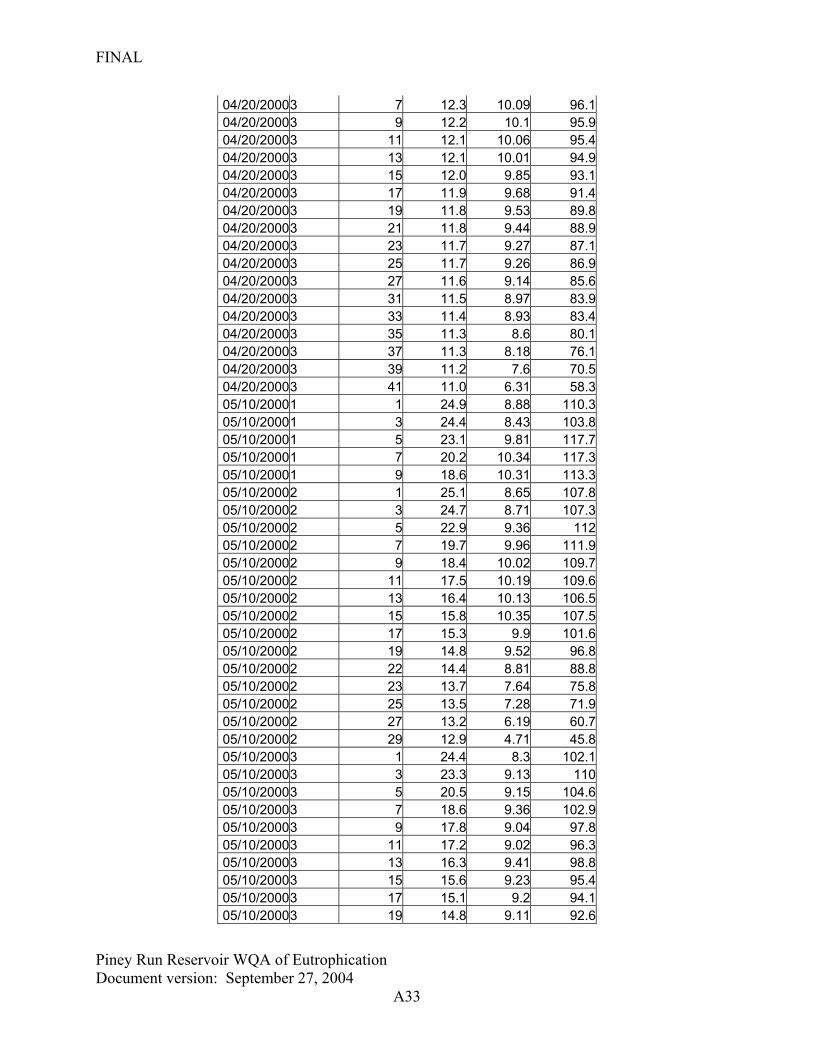
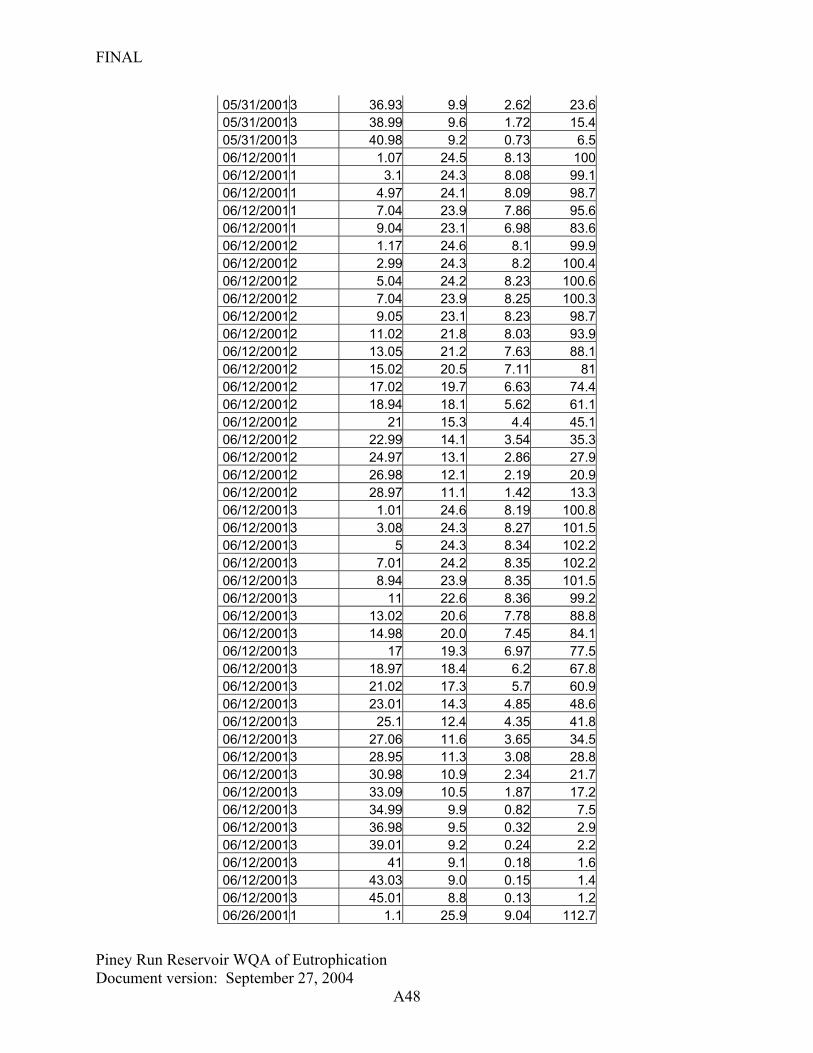
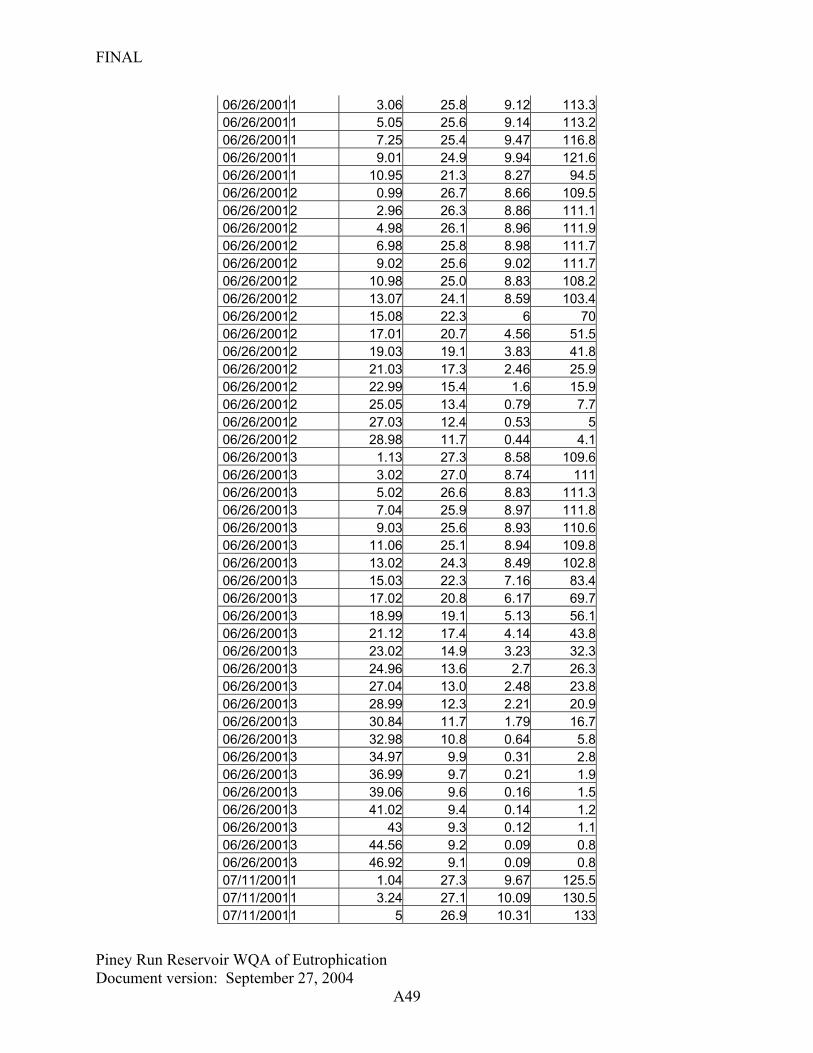
4.2 Dissolved Oxygen Water temperatures taken during the sampling period ranged from 20.5°C to 29.5°C in the surface water depth (0 to1foot column); 9.3°C to 24.2°C in the 21 to 35 foot water column; and 8.8°C to 14.3°C in the 37 to 47 foot water column (CC-WRPD, 2001 (data goes to 2002)) (Table A9). DO concentrations ranged from 0 to greater than 10 mg/l along the vertical profile. During the 2001 sampling period (July through September), DO concentrations as high as 9.2 mg/l were observed at the surface (0 -1foot depth) of Piney Run Reservoir, with DO values as low as 0.04 mg/l at a depth of 41 to 47 feet. Summer depth/DO profiles in other years were similar (see Table A9). Thermal stratification is a natural phenomenon that occurs seasonally in deeper lakes. The stratification of lakes isolates the deep water from the surface water, preventing the exchange of oxygen. This results in some degree of low DO in the water below the layer of stratification. Oxygen depletion occurs discontinuously, coincident with the depth at which thermal stratification was observed (i.e., about 22 feet and below) during the sampling events. Observed hypolimnetic DO concentrations fall below 10% saturation. This observation suggests that the reservoir is at the threshold of eutrophy (Table A9).
4.3 Chlorophyll a Instantaneous chlorophyll a concentrations ranging from 0.0 to 77.25 µg/l were observed in Piney Run Lake (CC-WRPD, 2001; MDE, 2002) (Figure 1A). While not extreme when compared to peak concentrations (10 to 275 µg/l) in eutrophic lakes (Olem and Flock, 1990), a
Page 13
FINAL
Piney Run Reservoir WQA of Eutrophication Document version: September 27, 2004
8
chlorophyll a concentration of 10 µg/l is typically associated with the boundary between eutrophic and mesotrophic states of a lake (Chapra, 1997). MDE analyzed growing-season chlorophyll a data (May through October) collected by Carroll County, and MDE. About 10 percent of the combined data (13 of 124) were abovethe 10mg/l target2. Considering only growing season data collected by both agencies, 9.7 percent of the chlorophyll a data exceeded 10 µg/l.
4.4 Conclusion The data presented in this report indicate that water quality parameters associated with nutrient loading in Piney Run Reservoir fall just within the State’s standards. Barring any contradictory future data, this information provides sufficient justification to revise Maryland’s 303(d) list to remove the nutrient listing for Piney Run Reservoir. The data presented in this report, however, do suggest that Piney Run Reservoir is at the threshold of euthrophy, as indicated by chlorophyll a concentrations occasionally exceeding 10 µg/l. Similarly, the hypolimnetic DO concentrations approaching zero indicate that the lake is approaching eutrophic status.
5.0 RECOMMENDATION Because Piney Run Reservoir is at the threshold of impairment, and because the watershed lies in a rapidly developing area, MDE will require that a Watershed Protection Plan (WPP) be developed by Carroll County for Piney Run Reservoir or MDE will develop a TMDL. The WPP will address current, potential and new phosphorus loadings, and must ensure that phosphorus loadings will not increase. MDE believes that a detailed WPP, combined with a Water Quality Analysis, will better protect the reservoir against further degradation because nonpoint sources dominate the phosphorus loading in the watershed, and the legal requirements for nonpoint source reductions under a TMDL are not clear. The proposed plan will need to be comprehensive in scope, including detailed monitoring, anti-degradation language, and expectations regarding best management practices including those for new development. MDE’s current watershed cycling strategy targets the Upper Western Shore region—which includes the Piney Run watershed—for sampling again in 2007; substantial progress toward the goal of the WPP is expected to be apparent at that time. A formal TMDL will be developed in the event Piney Run Reservoir becomes impaired in the future.
6.0 PUBLIC PARTICIPATION Public notification of the State's intent to address the nutrient listing was conducted in a variety of ways. The Department first met with Carroll County staff in 2002 to discuss MDE's intention
2 Carroll County upgraded analytical techniques and switched chlorophyll analysis to Chesapeake Biological Laboratory (Solomons, MD) in 1998; MDE considered data from this point forward in its analyses. The County did not report chlorophyll data to MDE for 2001, and modified stations for 2002; these data are tabulated separately.
Page 14
FINAL
Piney Run Reservoir WQA of Eutrophication Document version: September 27, 2004
9
to address the nutrient impairment listing. Identified stakeholders (including local government contacts, tributary team chairs, and interested parties) were formally notified of MDE's intent to develop a nutrient WQA in March 2004. Following this initial contact, these stakeholders were again notified on April 26, 2004 when the document began Interagency Review. The document went through a public comment period from July 19, 2004 to August 17, 2004 where the document was placed in the Carroll County Public Library, MDE's website and notices were published in the Carroll County Times. Following the public comment period, comments were reviewed and addressed through a comment response document. The documents were then submitted to EPA Region III at which time stakeholders were notified of this action. Once the document was approved by EPA Region III, stakeholders were notified of the action and the finalized document was posted on MDE's website.
Page 15
FINAL
Piney Run Reservoir WQA of Eutrophication Document version: September 27, 2004
10
REFERENCES Carlson, R.E. A trophic state index for lakes. Limnology and Oceanography 22:361-369. 1977. Carroll County Government Water Resource Planning Division (CC-WRPD). An assessment of
water quality conditions in the Piney Run Reservoir, 2001. Chapra, Steven C. Surface Water Quality Modeling. McGraw – Hill. 1997. Chianudani, G. and M. Vighi, "The N:P Ratio and Tests with Selanastrum to Predict
Eutrophication in Lakes", Water Research, Vol. 8, pp 1063-1069. 1974. COMAR 26.08.08.02.02B, 26.08.02.03-3E, 26.08.02.03A, 26.08.02.03.B(2). Heiskary, Steve. Minnesota Pollution Control Agency. Personal communication. 2000. Maryland Department of the Environment, Water Quality Monitoring Data, 2000. Maryland Department of Planning, 1997. Maryland Department of the Natural Resources. Maryland Lake Water Quality Assessment,
1991 Interim Report, 1993. Olem, H. and G. Flock. Editors. Lake and Reservoir Restoration Guidance Manual. 2nd Edition.
EPA 440/4-90-006. Prepared by N. Am. Lake Management Society for U.S. Environmental Protection Agency, Washington, D.C. 1990.
U.S. Department of Agriculture, Soil Conservation Service, Soil Survey of Carroll County,
Maryland, August 1969.
Page 16
FINAL
Piney Run Reservoir WQA of Eutrophication Document version: September 27, 2004
A1
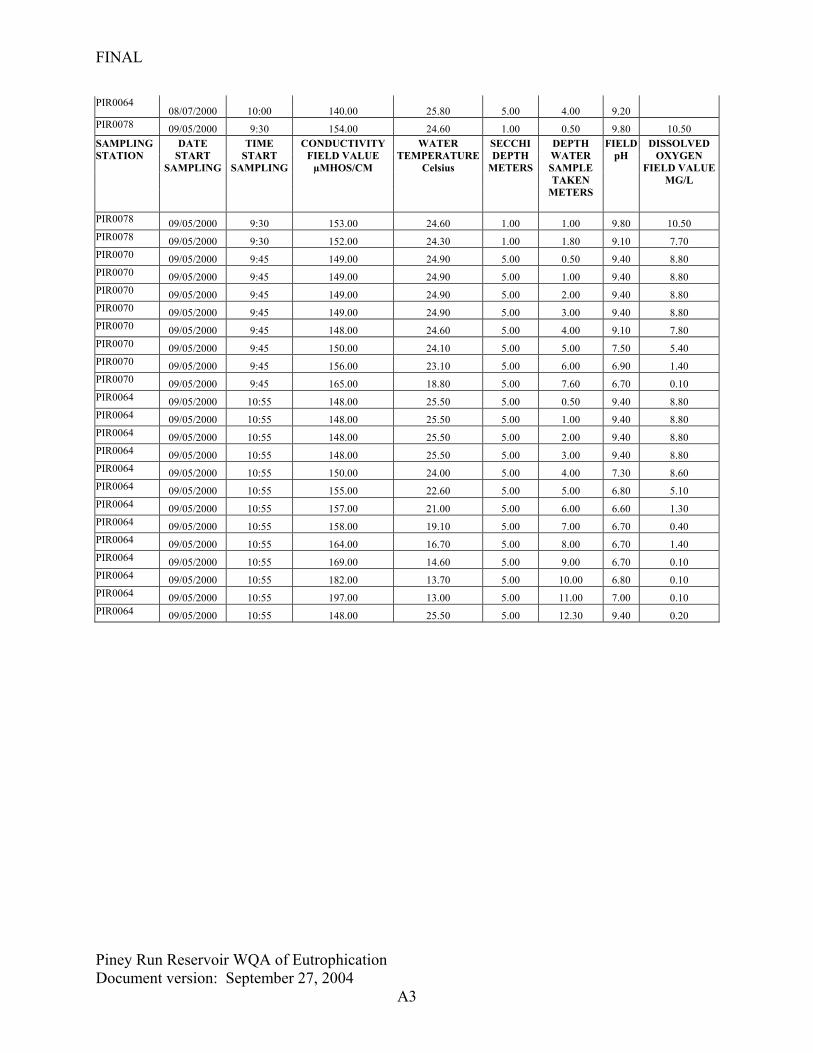
Appendix A Table A1: Physical Water Quality Data— Piney Run Reservoir (MDE, 2000)
SAMPLING STATION
DATE START
SAMPLING
TIME START
SAMPLING
CONDUCTIVITY FIELD VALUE
µMHOS/CM
WATER TEMPERATURE
Celsius
SECCHI DEPTH
METERS
DEPTH WATER SAMPLE TAKEN
METERS
FIELD pH
DISSOLVED OXYGEN
FIELD VALUE MG/L
PIR0078 03/13/2000 9:25 150.00 6.90 1.40 0.50 7.10 11.20 PIR0078 03/13/2000 9:25 150.00 6.90 1.40 1.00 7.10 11.20 PIR0078 03/13/2000 9:25 150.00 6.80 1.40 2.60 7.10 11.20 PIR0070 03/13/2000 9:35 150.00 7.50 1.80 0.50 7.20 11.40 PIR0070 03/13/2000 9:35 150.00 7.50 1.80 1.00 7.20 11.40 PIR0070 03/13/2000 9:35 150.00 7.30 1.80 3.00 7.20 11.30 PIR0070 03/13/2000 9:35 150.00 7.20 1.80 5.00 7.10 11.20 PIR0070 03/13/2000 9:35 150.00 7.10 1.80 7.00 7.10 11.20 PIR0070 03/13/2000 9:35 150.00 6.90 1.80 9.00 7.10 11.20 PIR0064 03/13/2000 9:50 150.00 7.90 1.80 0.50 7.30 11.60 PIR0064 03/13/2000 9:50 150.00 7.90 1.80 1.00 7.30 11.60 PIR0064 03/13/2000 9:50 150.00 7.80 1.80 4.00 7.20 11.60 PIR0064 03/13/2000 9:50 150.00 7.50 1.80 7.00 7.10 11.50 PIR0064 03/13/2000 9:50 150.00 7.20 1.80 10.00 7.10 11.10 PIR0064 03/13/2000 9:50 150.00 7.90 1.80 13.00 7.30 10.80 PIR0078 04/10/2000 8:30 150.00 10.70 2.20 0.50 7.30 10.10 PIR0078 04/10/2000 8:30 150.00 10.70 2.20 1.00 7.30 10.10 PIR0078 04/10/2000 8:30 150.00 10.00 2.20 2.40 7.30 10.20 PIR0070 04/10/2000 8:45 150.00 11.10 2.60 0.50 7.40 10.10 PIR0070 04/10/2000 8:45 150.00 11.10 2.60 1.00 7.40 10.20 PIR0070 04/10/2000 8:45 150.00 11.10 2.60 3.00 7.30 10.10 PIR0070 04/10/2000 8:45 150.00 11.10 2.60 6.00 7.30 10.10 PIR0070 04/10/2000 8:45 150.00 11.00 2.60 7.40 7.00 10.10 PIR0064 04/10/2000 9:00 150.00 11.40 2.60 0.50 7.50 10.20 PIR0064 04/10/2000 9:00 150.00 11.40 2.60 1.00 7.40 10.20 PIR0064 04/10/2000 9:00 150.00 11.40 2.60 4.00 7.40 10.10 PIR0064 04/10/2000 9:00 150.00 11.30 2.60 8.00 7.30 10.10 PIR0064 04/10/2000 9:00 150.00 10.90 2.60 10.00 7.10 9.60 PIR0064 04/10/2000 9:00 150.00 11.40 2.60 12.60 7.40 8.90 PIR0078 05/08/2000 9:45 155.00 22.00 3.10 0.50 7.80 9.80 PIR0078 05/08/2000 9:45 155.00 21.40 3.10 1.00 7.70 9.90 PIR0078 05/08/2000 9:45 155.00 20.40 3.10 1.50 7.70 10.20 PIR0070 05/08/2000 10:00 150.00 24.70 5.00 0.50 7.70 9.40 PIR0070 05/08/2000 10:00 150.00 21.40 5.00 1.00 7.70 9.90 PIR0070 05/08/2000 10:00 150.00 18.30 5.00 2.00 7.70 10.30 PIR0070 05/08/2000 10:00 150.00 16.50 5.00 3.00 7.60 10.30 PIR0070 05/08/2000 10:00 150.00 15.60 5.00 4.00 7.60 10.40 PIR0070 05/08/2000 10:00 150.00 14.80 5.00 5.00 7.40 10.00 PIR0070 05/08/2000 10:00 155.00 14.30 5.00 6.00 7.20 9.50
Page 17
FINAL
Piney Run Reservoir WQA of Eutrophication Document version: September 27, 2004
A2
PIR0070 05/08/2000 10:00 155.00 13.70 5.00 7.60 7.10 8.80 SAMPLING STATION
DATE START
SAMPLING
TIME START
SAMPLING
CONDUCTIVITY FIELD VALUE
µMHOS/CM
WATER TEMPERATURE
Celsius
SECCHI DEPTH
METERS
DEPTH WATER SAMPLE TAKEN
METERS
FIELD pH
DISSOLVED OXYGEN
FIELD VALUE MG/L
PIR0064 05/08/2000 10:15 150.00 22.50 7.50 0.50 7.60 9.10 PIR0064 05/08/2000 10:15 150.00 16.50 7.50 1.00 7.30 8.80 PIR0064 05/08/2000 10:15 150.00 14.90 7.50 3.00 7.10 9.00 PIR0064 05/08/2000 10:15 150.00 13.50 7.50 5.00 7.00 8.80 PIR0064 05/08/2000 10:15 155.00 12.60 7.50 7.00 6.90 8.20 PIR0064 05/08/2000 10:15 155.00 11.90 7.50 9.00 6.60 6.90 PIR0064 05/08/2000 10:15 160.00 10.80 7.50 11.00 6.50 4.30 PIR0064 05/08/2000 10:15 150.00 20.60 7.50 13.40 7.30 1.00 PIR0078 07/24/2000 10:20 151.00 25.50 3.00 0.50 9.70 11.20 PIR0078 07/24/2000 10:20 151.00 25.50 3.00 1.00 9.70 11.20 PIR0078 07/24/2000 10:20 153.00 25.40 3.00 2.10 9.80 12.20 PIR0070 07/24/2000 10:35 148.00 25.60 5.00 0.50 9.50 10.00 PIR0070 07/24/2000 10:35 148.00 25.60 5.00 1.00 9.50 10.00 PIR0070 07/24/2000 10:35 148.00 25.60 5.00 3.00 9.40 9.90 PIR0070 07/24/2000 10:35 149.00 23.80 5.00 5.00 7.60 8.40 PIR0070 07/24/2000 10:35 159.00 17.60 5.00 7.00 6.60 0.13 PIR0070 07/24/2000 10:35 167.00 14.80 5.00 8.50 6.70 0.17 PIR0064 07/24/2000 10:50 147.00 25.50 6.50 0.50 9.20 9.00 PIR0064 07/24/2000 10:50 147.00 25.50 6.50 1.00 9.20 9.00 PIR0064 07/24/2000 10:50 145.00 25.30 6.50 2.00 9.00 9.00 PIR0064 07/24/2000 10:50 147.00 20.40 6.50 4.00 7.60 8.90 PIR0064 07/24/2000 10:50 154.00 17.40 6.50 6.00 6.60 10.10 PIR0064 07/24/2000 10:50 159.00 13.80 6.50 8.00 6.60 0.40 PIR0064 07/24/2000 10:50 168.00 12.70 6.50 10.00 6.60 0.12 PIR0064 07/24/2000 10:50 147.00 25.50 6.50 12.00 9.20 0.13 PIR0078
08/07/2000 9:10 143.00 25.60 0.50 9.40 - PIR0078
08/07/2000 9:10 147.00 25.60 1.00 9.60 - PIR0078
08/07/2000 9:10 143.00 25.50 2.00 9.60 PIR0078
08/07/2000 9:10 143.00 25.50 3.00 9.50 PIR0070
08/07/2000 9:25 143.00 25.80 5.50 0.50 9.30 PIR0070
08/07/2000 9:25 144.00 25.80 5.50 1.00 9.30 PIR0070
08/07/2000 9:25 144.00 25.70 5.50 2.00 9.30 PIR0070
08/07/2000 9:25 146.00 25.70 5.50 3.00 9.30 PIR0070
08/07/2000 9:25 140.00 25.60 5.50 4.00 9.20 PIR0064
08/07/2000 10:00 140.00 25.90 5.00 0.50 9.10 PIR0064
08/07/2000 10:00 141.00 25.60 5.00 1.00 9.20 PIR0064
08/07/2000 10:00 144.00 25.60 5.00 2.00 9.20 PIR0064
08/07/2000 10:00 143.00 25.50 5.00 3.00 8.70
Page 18
FINAL
Piney Run Reservoir WQA of Eutrophication Document version: September 27, 2004
A3
PIR0064 08/07/2000 10:00 140.00 25.80 5.00 4.00 9.20
PIR0078 09/05/2000 9:30 154.00 24.60 1.00 0.50 9.80 10.50 SAMPLING STATION
DATE START
SAMPLING
TIME START
SAMPLING
CONDUCTIVITY FIELD VALUE
µMHOS/CM
WATER TEMPERATURE
Celsius
SECCHI DEPTH
METERS
DEPTH WATER SAMPLE TAKEN
METERS
FIELD pH
DISSOLVED OXYGEN
FIELD VALUE MG/L
PIR0078 09/05/2000 9:30 153.00 24.60 1.00 1.00 9.80 10.50 PIR0078 09/05/2000 9:30 152.00 24.30 1.00 1.80 9.10 7.70 PIR0070 09/05/2000 9:45 149.00 24.90 5.00 0.50 9.40 8.80 PIR0070 09/05/2000 9:45 149.00 24.90 5.00 1.00 9.40 8.80 PIR0070 09/05/2000 9:45 149.00 24.90 5.00 2.00 9.40 8.80 PIR0070 09/05/2000 9:45 149.00 24.90 5.00 3.00 9.40 8.80 PIR0070 09/05/2000 9:45 148.00 24.60 5.00 4.00 9.10 7.80 PIR0070 09/05/2000 9:45 150.00 24.10 5.00 5.00 7.50 5.40 PIR0070 09/05/2000 9:45 156.00 23.10 5.00 6.00 6.90 1.40 PIR0070 09/05/2000 9:45 165.00 18.80 5.00 7.60 6.70 0.10 PIR0064 09/05/2000 10:55 148.00 25.50 5.00 0.50 9.40 8.80 PIR0064 09/05/2000 10:55 148.00 25.50 5.00 1.00 9.40 8.80 PIR0064 09/05/2000 10:55 148.00 25.50 5.00 2.00 9.40 8.80 PIR0064 09/05/2000 10:55 148.00 25.50 5.00 3.00 9.40 8.80 PIR0064 09/05/2000 10:55 150.00 24.00 5.00 4.00 7.30 8.60 PIR0064 09/05/2000 10:55 155.00 22.60 5.00 5.00 6.80 5.10 PIR0064 09/05/2000 10:55 157.00 21.00 5.00 6.00 6.60 1.30 PIR0064 09/05/2000 10:55 158.00 19.10 5.00 7.00 6.70 0.40 PIR0064 09/05/2000 10:55 164.00 16.70 5.00 8.00 6.70 1.40 PIR0064 09/05/2000 10:55 169.00 14.60 5.00 9.00 6.70 0.10 PIR0064 09/05/2000 10:55 182.00 13.70 5.00 10.00 6.80 0.10 PIR0064 09/05/2000 10:55 197.00 13.00 5.00 11.00 7.00 0.10 PIR0064 09/05/2000 10:55 148.00 25.50 5.00 12.30 9.40 0.20
Page 19
FINAL
Piney Run Reservoir WQA of Eutrophication Document version: September 27, 2004
A4
Table A2
Water Quality (Nutrient) Data, Piney Run Reservoir (MDE, 2000)
SAMPLING STATION
DATE START
SAMPLING
TIME START
SAMPLING
DEPTH WATER SAMPLE TAKEN
METERS
TOTAL NITROGEN
mg/L
TOTAL PHOSPHORUS
mg/L
TN:TP
PIR0078 03/13/2000 9:25 0.50 2.04 0.02 118.84
PIR0070 03/13/2000 9:35 0.50 1.91 0.01 135.74
PIR0064 03/13/2000 9:50 0.50 1.92 0.02 106.24
PIR0064 03/13/2000 9:50 13.00 1.93 0.02 100.47
PIR0078 04/10/2000 8:30 0.50 2.02 0.01 140.42
PIR0070 04/10/2000 8:45 0.50 1.99 0.01 141.35
PIR0064 04/10/2000 9:00 0.50 1.96 0.02 121.05
PIR0064 04/10/2000 9:00 12.60 1.99 0.01 147.55
PIR0078 05/08/2000 9:45 0.50 2.00 0.01 153.75
PIR0070 05/08/2000 10:00 0.50 1.94 0.01 249.32
PIR0064 05/08/2000 10:15 0.50 1.95 0.01 234.46
PIR0064 05/08/2000 10:15 13.40 1.51 0.04 36.54
PIR0078 07/24/2000 10:20 0.50 1.44 0.02 88.28
PIR0070 07/24/2000 10:35 0.50 1.36 0.01 149.65
PIR0064 07/24/2000 10:50 0.50 1.36 0.01 208.68
PIR0064 07/24/2000 10:50 12.00 1.04 0.02 68.18
PIR0078 08/07/2000 9:10 0.50 1.27 0.01 121.67
PIR0070 08/07/2000 9:25 0.50 1.26 0.01 161.72
PIR0064 08/07/2000 10:00 0.50 1.33 0.01 138.82
PIR0064 08/07/2000 10:00 4.00 1.30 0.03 40.25
PIR0078 09/05/2000 9:30 0.50 1.17 0.02 51.27
PIR0070 09/05/2000 9:45 0.50 1.00 0.01 97.14
PIR0064 09/05/2000 10:55 0.50 0.99 0.01 127.00
PIR0064 09/05/2000 10:55 12.30 1.07 0.04 28.81
Page 20
FINAL
Piney Run Reservoir WQA of Eutrophication Document version: September 27, 2004
A5
Table A3: Water Quality (Nutrient) Data,
Piney Run Reservoir (Carroll County, 1994-2000)
Date TP (Station 1)
TN (Station 1)
TP (Station 2)
TN (Station 2)
TP (Station 2-25 )
TN (Station 2-25)
TP (Station 3)
TN (Station 3)
TP (Station 3-19)
TN (Station 3-19)
TP (Station 3-40)
TN (Station 3-40)
3/30/94 0.05 2.20 0.03 2.20 0.03 2.20 0.05 2.40 0.05 2.304/12/94 0.02 1.90 0.04 1.70 0.02 2.00 0.03 2.10 0.02 1.704/28/94 0.02 2.80 0.04 2.60 0.24 2.60 0.02 2.60 0.03 2.205/11/94 0.01 2.00 0.01 1.80 0.02 1.30 0.01 1.70 0.02 1.205/24/94 0.01 1.80 0.01 1.70 0.02 1.70 0.01 1.80 0.02 1.006/7/94 0.01 2.30 0.01 2.40 0.01 1.80 0.01 2.10 0.01 1.60
6/22/94 0.02 2.10 0.01 2.20 0.02 1.70 0.01 2.10 0.03 1.307/14/94 0.02 1.70 0.01 1.70 0.01 1.20 0.02 2.00 0.02 1.507/26/94 0.07 1.10 0.02 1.20 0.02 1.20 0.01 1.10 0.03 1.108/23/94 0.01 2.20 0.01 1.20 0.04 1.30 0.01 1.30 0.02 0.808/31/94 0.01 1.00 0.01 1.40 0.05 1.20 0.05 1.30 .01 0.809/14/94 0.01 1.50 0.01 1.10 0.01 1.50 0.01 1.10 0.02 0.80
09/27/94 0.02 1.70 0.01 0.90 0.02 1.30 0.01 0.80 0.12 1.2010/12/94 0.01 0.90 0.01 0.90 --- --- 0.01 0.80 0.05 0.6011/16/94 0.01 0.01 --- --- 0.01 0.01 12/12/94 0.02 1.60 0.02 1.10 --- --- 0.01 0.70 0.02 0.901/12/95 0.02 1.60 0.02 1.30 --- --- 0.02 1.20 0.02 1.303/17/95 0.03 2.70 0.03 2.00 0.02 1.60 0.04 1.90 0.02 1.704/6/95 0.03 2.70 0.02 1.60 --- --- 0.03 1.70 .03 1.80
4/28/95 0.01 1.60 0.01 1.60 0.01 1.50 0.01 1.60 0.02 1.605/8/95 0.04 1.60 0.01 1.50 0.01 1.70 0.03 1.40 0.02 1.40
5/23/95 0.01 1.70 0.01 1.50 0.01 1.40 0.01 0.80 0.01 0.906/1/95 0.07 2.10 0.01 2.20 0.02 1.20 0.01 2.30 0.09 1.50
6/14/95 0.01 1.30 0.03 2.00 0.08 0.80 0.05 1.20 0.12 0.407/10/95 0.01 1.50 0.01 2.90 0.01 1.30 0.01 1.00 0.10 1.307/19/95 0.01 1.60 0.15 1.60 0.01 1.30 0.03 1.40 0.02 1.10
08/23/95 0.11 1.10 0.28 4.50 0.10 1.00 0.09 0.90 0.13 1.4009/06/95 0.03 1.70 0.08 1.80 0.03 1.70 0.11 1.60 0.05 1.6009/20/95 0.19 1.50 0.03 1.50 0.26 1.30 0.13 1.40 4.90 1.40
Page 21
FINAL
Piney Run Reservoir WQA of Eutrophication Document version: September 27, 2004
A6
10/04/95 --- --- 0.02 2.00
Date TP (Station 1)
TN (Station 1)
TP (Station 2)
TN (Station 2)
TP (Station 2-25 )
TN (Station 2-25)
TP (Station 3)
TN (Station 3)
TP (Station 3-19)
TN (Station 3-19)
TP (Station 3-40)
TN (Station 3-40)
10/18/95 0.04 1.70 0.04 1.40 0.05 1.40 0.04 1.50 3.10 1.1011/02/95 --- --- 0.01 2.10 11/20/95 0.28 1.50 0.02 1.60 0.01 1.30 0.08 1.10 03/13/96 0.02 2.00 0.02 2.10 0.01 1.90 0.02 2.00 0.02 1.8004/12/96 0.02 2.90 0.01 3.70 0.06 3.00 0.17 2.00 0.01 2.3005/08/96 0.04 2.00 0.05 1.60 0.05 1.60 0.08 1.60 --- 05/22/96 0.30 1.70 0.30 2.10 0.60 1.60 0.50 2.00 0.40 1.8006/05/96 0.01 1.20 0.15 2.00 0.15 1.60 0.14 2.70 0.15 1.3006/26/96 0.05 3.10 0.07 2.50 0.03 1.90 0.03 2.30 0.03 1.7007/10/96 0.01 4.60 0.01 4.10 0.03 1.40 0.01 5.00 0.08 4.1007/24/96 0.18 2.50 0.01 2.00 0.01 1.50 0.15 2.10 0.06 2.1008/09/96 0.01 1.30 0.24 1.50 0.60 1.20 0.01 1.50 0.48 0.9008/23/96 0.24 1.10 0.06 2.40 0.07 1.00 0.21 1.90 0.12 1.6009/16/96 0.23 1.50 0.07 1.20 0.07 1.40 0.21 1.10 0.12 2.5009/30/96 0.42 1.70 0.02 1.60 0.23 1.80 0.03 2.00 0.98 1.3010/23/96 0.07 1.60 0.04 1.60 0.06 1.70 0.14 1.50 0.07 3.2010/31/96 0.12 1.70 0.06 1.50 0.21 1.60 0.22 1.7011/26/96 0.35 0.09 1.60 0.05 1.40 0.15 2.00 0.09 1.9012/18/96 0.11 1.80 0.05 2.70 0.05 2.60 0.05 2.60 0.06 2.40
04/17/97 0.01 2.50 0.03 2.50 0.02 2.60 05/07/97 0.27 2.80 0.32 2.80 0.44 2.80 0.66 2.8005/29/97 0.08 4.30 0.19 2.10 0.20 2.20 0.10 2.10 0.52 1.7006/11/97 0.01 3.70 0.11 1.90 0.13 1.80 0.01 2.10 0.43 2.2006/25/97 0.04 3.40 0.04 1.70 0.41 1.70 0.03 2.30 0.81 1.6007/16/97 0.08 4.20 0.05 2.20 0.05 2.00 0.04 2.40 0.11 2.3007/30/97 0.02 3.40 0.01 1.90 0.05 1.50 0.05 1.90 0.10 1.6008/13/97 0.25 2.50 0.03 1.40 2.29 1.10 0.86 1.40 0.18 1.5008/26/97 3.22 2.30 0.08 1.30 2.34 1.00 1.54 1.20 0.58 1.5009/17/97 0.01 2.90 0.10 1.10 0.13 1.80 0.01 1.10 0.04 2.1010/02/97 0.03 2.50 0.06 1.20 0.07 1.30 0.02 1.40 0.06 1.80
Page 22
FINAL
Piney Run Reservoir WQA of Eutrophication Document version: September 27, 2004
A7
10/15/97 0.16 2.70 0.10 1.20 0.11 1.50 0.01 1.30 0.11 1.90
10/29/97 0.01 2.70 0.01 1.20 0.01 1.50 0.01 1.40 0.29 2.00
Date TP (Station 1)
TN (Station 1)
TP (Station 2)
TN (Station 2)
TP (Station 2-25 )
TN (Station 2-25)
TP (Station 3)
TN (Station 3)
TP (Station 3-19)
TN (Station 3-19)
TP (Station 3-40)
TN (Station 3-40)
11/12/97 0.01 3.20 0.01 1.70 0.01 1.50 0.01 1.60 0.01 1.8011/25/97 0.05 2.50 0.04 1.10 0.04 1.40 0.02 1.40 0.03 1.6012/17/97 0.03 1.20 0.02 1.20 0.04 1.10 0.02 1.2001/22/98 0.01 1.80 0.01 0.90 0.01 0.90 0.04 1.00 0.06 0.8002/18/98 0.11 1.80 0.01 0.80 0.10 1.00 0.13 1.20 0.14 1.00
0.00 0.00 0.00 0.0005/22/98 0.00 0.00 0.00 0.0007/01/98 0.00 0.00 0.00 0.0007/15/98 0.00 0.00 0.00 0.0007/29/98 0.00 0.00 0.00 0.0008/11/98 0.00 0.00 0.00 0.0008/26/98 0.00 0.00 0.00 0.0009/08/98 0.00 0.00 0.00 0.00
09/30/1998 0.01 1.23 0.01 1.08 1.26 0.01 1.10 0.02 1.5911/04/1998 0.01 1.11 0.02 1.06 1.06 0.01 1.12 0.01 1.07 0.05 1.3212/16/1998 0.01 1.33 0.01 1.21 1.25 0.01 1.20 0.01 1.23 0.01 1.22
01/28/99 0.03 2.80 0.02 1.57 1.59 0.02 1.55 0.02 1.54 0.02 1.5402/15/99 0.00 0.00 0.00 0.00 0.00 0.0003/15/99 0.00 0.00 0.00 0.00 0.00 0.0004/27/99 0.01 1.92 0.01 1.88 1.85 0.01 1.94 0.01 1.78 0.01 1.7505/12/99 0.01 1.84 0.01 1.75 1.49 0.01 1.82 0.01 1.75 0.01 1.6206/08/99 0.01 1.76 0.01 1.70 1.61 0.01 1.77 0.01 1.80 0.02 1.5406/23/99 0.01 1.57 0.01 1.56 1.25 0.00 1.50 0.00 1.47 0.01 1.4207/07/99 0.01 1.36 0.01 1.34 1.25 0.01 1.38 0.00 1.37 0.02 1.3207/22/99 0.02 1.18 0.01 1.21 1.40 0.01 1.20 0.01 1.19 0.03 1.2408/04/99 0.04 1.14 0.01 1.24 1.05 0.01 1.07 0.01 1.08 0.01 1.0808/19/99 0.02 1.03 0.01 0.88 1.21 0.01 0.91 0.01 0.96 0.03 0.9809/09/99 0.01 0.81 0.01 0.75 1.01 0.01 0.92 0.01 0.89 0.02 0.8609/24/99 0.02 0.93 0.02 0.89 0.83 0.01 0.85 0.01 0.83 0.02 1.0510/07/99 0.03 1.20 0.01 0.85 0.88 0.01 0.86 0.01 0.82 0.02 1.12
Page 23
FINAL
Piney Run Reservoir WQA of Eutrophication Document version: September 27, 2004
A8
10/28/99 0.01 1.07 0.01 0.92 0.93 0.02 0.97 0.01 0.93 0.01 0.90
11/18/99 0.03 1.35 0.02 0.96 0.98 0.02 1.11 0.02 0.87 0.02 0.9112/21/99 0.02 1.17 0.00 0.00
Date TP (Station 1)
TN (Station 1)
TP (Station 2)
TN (Station 2)
TP (Station 2-25 )
TN (Station 2-25)
TP (Station 3)
TN (Station 3)
TP (Station 3-19)
TN (Station 3-19)
TP (Station 3-40)
TN (Station 3-40)
01/19/00 0.02 1.49 0.02 1.44 0.0004/20/00 0.02 2.08 0.01 1.98 0.01 1.93 0.01 1.92 0.01 1.8605/10/00 0.01 2.31 0.01 2.09 0.01 2.00 0.01 1.99 0.02 1.6705/26/00 0.05 2.03 0.04 1.96 0.03 1.93 0.02 1.83 0.02 1.6106/09/00 0.01 1.89 0.01 1.91 0.01 1.85 0.01 1.89 0.01 1.6006/23/00 0.01 1.66 0.01 1.60 0.01 1.70 0.01 1.74 0.01 1.3307/06/00 0.01 1.44 0.01 1.45 0.01 1.44 0.01 1.70 0.01 1.4007/18/00 0.00 0.00 0.00 0.00 0.0008/03/00 0.02 1.27 0.01 1.18 0.01 1.23 0.02 1.47 0.03 0.9308/17/00 0.01 1.13 0.01 1.24 0.01 1.23 0.01 1.27 0.02 0.9809/07/00 0.02 1.08 0.01 0.98 0.01 0.97 0.01 1.00 0.03 0.9509/20/00 0.01 0.07 0.01 0.92 0.01 0.94 0.01 0.91 0.03 1.0110/04/00 0.02 0.96 0.01 0.88 0.02 0.92 0.01 0.90 0.02 1.1110/18/00 0.02 1.24 0.01 0.94 0.01 0.91 0.01 0.89 0.03 1.0911/03/00 0.02 1.24 0.01 0.92 0.01 0.90 0.01 0.90 0.01 0.9011/17/00 0.01 0.88 12/15/00 0.01 0.98
Page 24
FINAL
Piney Run Reservoir WQA of Eutrophication Document version: September 27, 2004
A9
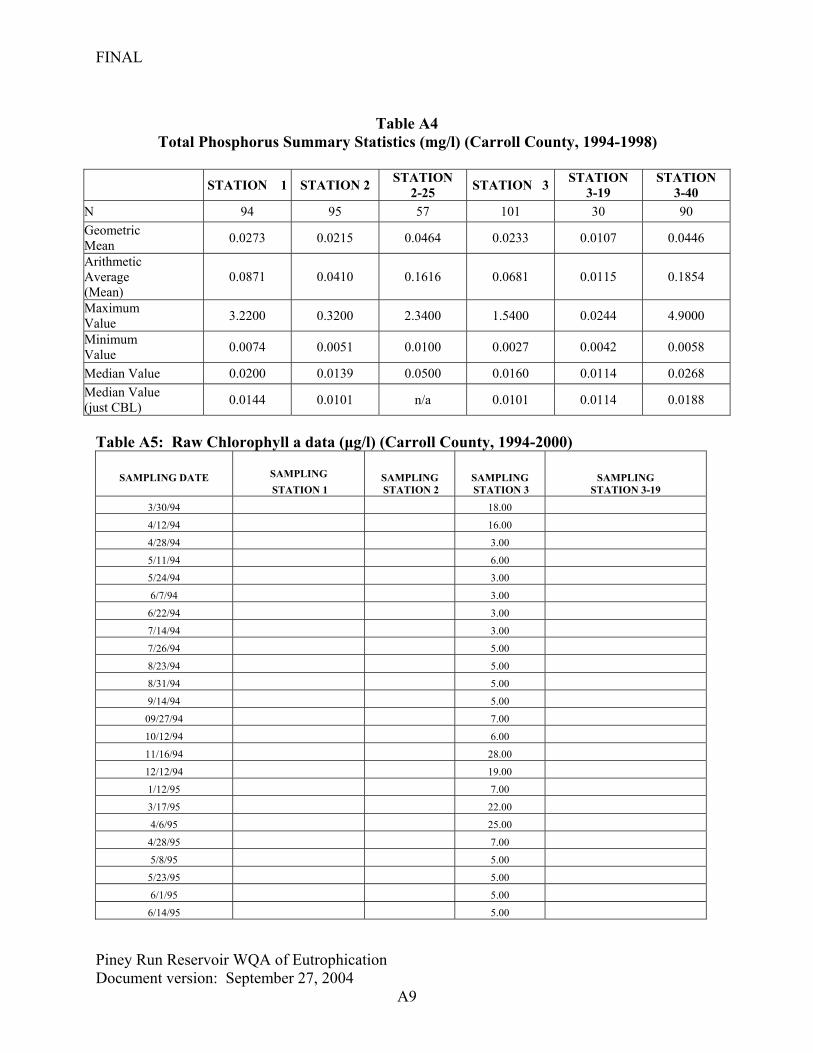
Table A4
Total Phosphorus Summary Statistics (mg/l) (Carroll County, 1994-1998)
STATION 1 STATION 2 STATION 2-25 STATION 3 STATION
3-19 STATION
3-40 N 94 95 57 101 30 90 Geometric Mean 0.0273 0.0215 0.0464 0.0233 0.0107 0.0446
Arithmetic Average (Mean)
0.0871 0.0410 0.1616 0.0681 0.0115 0.1854
Maximum Value 3.2200 0.3200 2.3400 1.5400 0.0244 4.9000
Minimum Value 0.0074 0.0051 0.0100 0.0027 0.0042 0.0058
Median Value 0.0200 0.0139 0.0500 0.0160 0.0114 0.0268 Median Value (just CBL) 0.0144 0.0101 n/a 0.0101 0.0114 0.0188
Table A5: Raw Chlorophyll a data (µg/l) (Carroll County, 1994-2000)
SAMPLING DATE
SAMPLING STATION 1
SAMPLING STATION 2
SAMPLING STATION 3
SAMPLING STATION 3-19
3/30/94 18.00
4/12/94 16.00
4/28/94 3.00
5/11/94 6.00
5/24/94 3.00
6/7/94 3.00
6/22/94 3.00
7/14/94 3.00
7/26/94 5.00
8/23/94 5.00
8/31/94 5.00
9/14/94 5.00
09/27/94 7.00
10/12/94 6.00
11/16/94 28.00
12/12/94 19.00
1/12/95 7.00
3/17/95 22.00
4/6/95 25.00
4/28/95 7.00
5/8/95 5.00
5/23/95 5.00
6/1/95 5.00
6/14/95 5.00
Page 25
FINAL
Piney Run Reservoir WQA of Eutrophication Document version: September 27, 2004
A10
7/10/95 5.00
SAMPLING DATE
SAMPLING STATION 1
SAMPLING STATION 2
SAMPLING STATION 3
SAMPLING STATION 3-19
7/19/95 5.00
08/23/95 5.00
09/06/95 13.00
09/20/95 11.00
10/04/95 18.00
10/18/95 5.00
11/02/95 5.00
11/20/95 5.00
03/13/96 30.00
05/08/96 5.00
05/22/96 5.00
06/26/96 5.00
07/10/96 6.00
07/24/96 5.00
08/09/96 12.00
08/23/96 6.00
09/16/96 5.00 11.50
09/30/96 12.00 15.20
10/23/96 6.00 15.10
10/31/96 7.20 6.20
12/18/96 5.00
05/07/97 5.00
05/29/97 5.00
06/11/97 5.00
07/16/97 5.00
07/30/97 5.00
08/13/97 6.70
08/26/97 5.00
09/17/97 6.80
10/02/97 8.20
10/15/97 9.00
10/29/97 5.00
11/12/97 5.00
11/25/97 6.50
12/17/97 5.00
01/22/98 5.00
02/18/98 7.80
09/30/98 3.51 3.92 4.10
11/04/98 4.20 5.84 4.52 4.34
12/16/98 9.41 8.98 7.85 8.06
01/27/99 12.45 23.62 18.79
04/27/99 2.72 1.77 1.37 1.80
05/12/99 2.48 1.17 0.82 1.55
Page 26
FINAL
Piney Run Reservoir WQA of Eutrophication Document version: September 27, 2004
A11
06/08/99 2.20 1.94 1.40 2.35
06/23/99 2.80 2.50 2.28 2.86
SAMPLING DATE
SAMPLING STATION 1
SAMPLING STATION 2
SAMPLING STATION 3
SAMPLING STATION 3-19
07/07/99 2.67 2.59 1.58 1.39
07/22/99 2.74 3.36 1.55 1.05
08/04/99 1.50 2.08 2.28 2.68
08/19/99 4.39 4.45 6.76
09/09/99 2.75 2.53 1.61 2.48
09/24/99 5.45 4.61 2.74 3.40
10/07/99 11.33 5.22 4.49 4.84
10/28/99 15.12 10.73 15.38 11.35
11/18/99 15.56 19.59 19.48 12.83
12/21/99 4.67
01/19/00 10.72 6.42
04/20/00 3.67 6.40 3.34 2.93
05/10/00 5.69 1.73 0.77 1.34
05/26/00 15.57 14.89 7.49 3.77
06/09/00 2.85 2.62 2.66 4.09
06/23/00 4.41 3.78 3.93 9.11
07/06/00 1.82 1.35 1.98 7.17
08/03/00 4.17 3.56 1.63 15.11
08/17/00 5.40 4.05 4.01 13.41
09/07/00 8.18 4.65 3.78 6.65
09/20/00 6.67 4.50 4.38 1.40
10/04/00 21.35 7.23 8.18 7.13
10/18/00 17.47 8.75 4.74 1.53
11/03/00 5.09 6.30 4.96 8.56
11/17/00 3.86
12/15/00 4.22
Table A6: Chlorophyll a Summary Statistics (µg/l), (Carroll County, 1994-2000) STATION 1 STATION 2 STATION 3 STATION 3-19 N 41 34 84 29Geometric Mean 5.67 4.88 5.12 4.07Mean 7.35 6.58 6.66 5.39Maximum 30.00 23.62 28.00 15.11Minimum 1.50 1.17 0.77 1.05Median 5.00 4.56 5.00 4.09Median (just CBL) 4.41 4.22 3.97 4.09
Page 27
FINAL
Piney Run Reservoir WQA of Eutrophication Document version: September 27, 2004
A12
Table A7: Water Quality (Chlorophyll) Data Piney Run Reservoir (Carroll County, 2002)
Station Date Total P (mg /L)
Station Date Chl. a (ug/L)
1 04/17/02 0.011 1 04/17/02 1.550
2 04/17/02 0.010 2 04/17/02 1.900
2-25 04/17/02 0.012 2-25 04/17/02
3 04/17/02 0.023 3 04/17/02 4.430
3-19 04/17/02 0.016 3-11 04/17/02 1.300
3-40 04/17/02 0.019 3-19 04/17/02
4 04/17/02 0.016 3-40 04/17/02
1 05/01/02 0.019 4 04/17/02 4.450
2 05/01/02 0.013 1 05/01/02 2.240
2-25 05/01/02 0.014 2 05/01/02 1.700
3 05/01/02 0.016 2-25 05/01/02
3-19 05/01/02 0.017 3 05/01/02 1.600
3-40 05/01/02 0.016 3-11 05/01/02 1.510
1 07/11/02 0.024 3-19 05/01/02 1.690
2 07/11/02 0.009 1 07/11/02 3.650
2-25 07/11/02 0.020 2 07/11/02 2.500
3 07/11/02 0.010 2-25 07/11/02
3-19 07/11/02 0.014 3 07/11/02 2.750
3-40 07/11/02 0.034 3-11 07/11/02 7.460
4 07/11/02 0.014 3-19 07/11/02 3.500
3 08/08/02 0.009 3-40 07/11/02
3-19 08/08/02 0.012 4 07/11/02
3-40 08/08/02 0.027 1 08/08/02 3.730
4 08/08/02 0.009 2 08/08/02 2.840
1 09/03/02 0.052 2-25 08/08/02
2 09/03/02 0.013 3 08/08/02 3.400
2-25 09/03/02 0.023 3-11 08/08/02 3.280
3 09/03/02 0.015 3-19 08/08/02 3.500
3-19 09/03/02 0.012 3-40 08/08/02
3-40 09/03/02 0.044 4 08/08/02
4 09/03/02 0.014 1 09/03/02 10.280
1 10/03/02 0.027 2 09/03/02 7.130
2 10/03/02 0.014 2-25 09/03/02
2-25 10/03/02 0.015 3 09/03/02 8.600
Page 28
FINAL
Piney Run Reservoir WQA of Eutrophication Document version: September 27, 2004
A13
3 10/03/02 0.011 3-11 09/03/02 9.120 Station Date Total P
(mg /L) Station Date Chl. a
(ug/L)
3-40 10/03/02 0.041 3-40 09/03/02
4 10/03/02 0.013 4 09/03/02
Table A8 Water Quality (Chlorophyll a) Data, Piney Run Reservoir (MDE, 2000)
SAMPLING STATION
SAMPLE DATE
SAMPLE TIME
SAMPLE DEPTH
(m)
ACTIVE CHLOROPHYLL a
(µg/L)
PHEOPHYTIN a (µg/L)
PIR0078 03/13/2000 9:25 0.50 6.35 0.97 PIR0070 03/13/2000 9:35 0.50 6.31 1.71 PIR0064 03/13/2000 9:50 0.50 6.92 1.20 PIR0064 03/13/2000 9:50 13.00 5.55 1.03 PIR0078 04/10/2000 8:30 0.50 4.49 0.30 PIR0070 04/10/2000 8:45 0.50 4.67 0.17 PIR0064 04/10/2000 9:00 0.50 4.49 0.09 PIR0064 04/10/2000 9:00 12.60 4.27 0.06 PIR0078 05/08/2000 9:45 0.50 2.24 0.02 PIR0070 05/08/2000 10:00 0.50 1.50 0.00 PIR0064 05/08/2000 10:15 0.50 - - PIR0064 05/08/2000 10:15 13.40 - - PIR0078 07/24/2000 10:20 0.50 4.19 0.52 PIR0070 07/24/2000 10:35 0.50 4.64 0.91 PIR0064 07/24/2000 10:50 0.50 2.09 0.21 PIR0064 07/24/2000 10:50 12.00 3.89 0.61 PIR0078 08/07/2000 9:10 0.50 4.49 0.30 PIR0070 08/07/2000 9:25 0.50 3.42 0.17 PIR0064 08/07/2000 10:00 0.50 0.00 4.19 PIR0064 08/07/2000 10:00 4.00 77.25 3.34 PIR0078 09/05/2000 9:30 0.50 4.70 1.28 PIR0070 09/05/2000 9:45 0.50 4.06 0.13 PIR0064 09/05/2000 10:55 0.50 2.99 0.15 PIR0064 09/05/2000 10:55 12.30 4.27 0.81
Page 29
FINAL
Piney Run Reservoir WQA of Eutrophication Document version: September 27, 2004
A14
Table A9: Physical Water Quality Data, Piney Run Reservoir (Carroll County, 1998-2002)
Date StationDepth (feet)
Water Temp. (˚C) DO (mg/l) DO% Sat
05/22/19982 1 21.8 10.3 05/22/19982 3 21.8 10.3 05/22/19982 5 21.8 10.3 05/22/19982 7 21.8 10.4 05/22/19982 9 21.8 10.4 05/22/19982 11 21.0 10.8 05/22/19982 13 18.0 12 05/22/19982 15 16.5 10.1 05/22/19982 17 15.5 7.7 05/22/19982 19 15.0 6.7 05/22/19982 21 13.5 4.9 05/22/19982 23 12.5 3.7 05/22/19982 25 12.0 3 05/22/19982 27 10.8 2.2 05/22/19982 29 10.5 2.1 05/22/19983 1 22.5 9.6 05/22/19983 3 22.5 9.6 05/22/19983 5 22.5 9.7 05/22/19983 7 22.5 9.7 05/22/19983 9 22.5 9.7 05/22/19983 11 22.5 9.8 05/22/19983 13 22.5 9.8 05/22/19983 15 18.0 10.8 05/22/19983 17 17.0 11.6 05/22/19983 19 16.0 8.7 05/22/19983 21 14.5 6.9 05/22/19983 23 12.5 5.4 05/22/19983 25 11.5 5 05/22/19983 27 10.5 5.3 05/22/19983 29 10.0 5.2 05/22/19983 31 9.0 3.5 05/22/19983 33 8.5 2.3 05/22/19983 35 8.0 1.4 05/22/19983 37 8.0 0.8 05/22/19983 39 8.0 0.1 05/22/19983 41 8.0 0.1 05/22/19983 43 8.0 0.1 05/22/19983 45 8.0 0.1 05/22/19983 47 8.0 0.1 07/01/19981 1 26.1 9.6 07/01/19981 3 26.1 9.5 07/01/19981 5 26.1 9.5
Page 30
FINAL
Piney Run Reservoir WQA of Eutrophication Document version: September 27, 2004
A15
07/01/19981 7 25.3 9.4
Date StationDepth (feet)
Water Temp. (˚C) DO (mg/l) DO% Sat
07/01/19981 9 25.1 9.3 07/01/19982 1 26.4 9.6 07/01/19982 3 26.4 9.6 07/01/19982 5 26.4 9.6 07/01/19982 7 26.2 9.6 07/01/19982 9 26.0 9.5 07/01/19982 11 26.0 9.1 07/01/19982 13 23.2 12.2 07/01/19982 15 21.5 10.2 07/01/19982 17 19.8 8.6 07/01/19982 19 18.0 4.1 07/01/19982 21 16.5 0.2 07/01/19982 23 15.0 0.3 07/01/19982 25 13.5 0.2 07/01/19982 27 11.5 0.2 07/01/19982 29 11.0 0.2 07/01/19983 1 26.5 9.4 07/01/19983 3 26.5 9.5 07/01/19983 5 26.5 9.5 07/01/19983 7 26.5 9.5 07/01/19983 9 26.5 9.5 07/01/19983 11 26.5 9.5 07/01/19983 13 26.5 9.5 07/01/19983 15 22.0 10.6 07/01/19983 17 20.1 8 07/01/19983 19 18.5 4.1 07/01/19983 21 16.0 0.2 07/01/19983 23 14.5 1.3 07/01/19983 25 13.5 0.6 07/01/19983 27 13.0 0.1 07/01/19983 29 11.7 0.1 07/01/19983 31 11.0 0.1 07/01/19983 33 10.4 0.1 07/01/19983 35 10.0 0.1 07/01/19983 37 9.8 0.1 07/01/19983 39 9.5 0.1 07/01/19983 41 9.0 0.1 07/01/19983 43 9.0 0.1 07/01/19983 45 8.8 0.1 07/01/19983 47 8.8 0 07/15/19981 1 27.4 11.2 07/15/19981 3 27.4 11.3 07/15/19981 5 27.2 11.3
Page 31
FINAL
Piney Run Reservoir WQA of Eutrophication Document version: September 27, 2004
A16
07/15/19981 7 27.2 10.8 07/15/19981 9 26.5 9.6
Date StationDepth (feet)
Water Temp. (˚C) DO (mg/l) DO% Sat
07/15/19982 1 27.1 11.2 07/15/19982 3 27.1 11.5 07/15/19982 5 27.0 11.5 07/15/19982 7 26.9 11.8 07/15/19982 9 26.5 12.5 07/15/19982 11 26.0 13 07/15/19982 13 25.1 11.4 07/15/19982 15 23.6 11.4 07/15/19982 17 21.6 9.5 07/15/19982 19 19.1 2.9 07/15/19982 21 16.5 0.2 07/15/19982 23 14.5 0.2 07/15/19982 25 13.8 0.2 07/15/19982 27 13.1 0.2 07/15/19983 1 26.9 11.8 07/15/19983 3 26.5 12.2 07/15/19983 5 26.5 12.2 07/15/19983 7 26.2 12.2 07/15/19983 9 26.2 12.3 07/15/19983 11 26.0 12.7 07/15/19983 13 25.0 12.4 07/15/19983 15 23.1 12.5 07/15/19983 17 21.6 11.7 07/15/19983 19 20.0 7.9 07/15/19983 21 17.5 0.4 07/15/19983 23 15.0 0.2 07/15/19983 25 13.4 0.2 07/15/19983 27 12.0 0.2 07/15/19983 31 10.8 0.2 07/15/19983 33 10.2 0.2 07/15/19983 35 9.8 0.2 07/15/19983 37 9.5 0.2 07/15/19983 39 9.3 0.2 07/15/19983 41 9.3 0.2 07/15/19983 43 9.0 0.2 07/15/19983 45 9.0 0.2 07/29/19981 1 27.6 10.3 07/29/19981 3 27.6 10.2 07/29/19981 5 27.6 10.2 07/29/19981 4 27.6 10.2 07/29/19981 9 27.6 10.1 07/29/19982 1 28.0 10.2
Page 32
FINAL
Piney Run Reservoir WQA of Eutrophication Document version: September 27, 2004
A17
07/29/19982 3 28.0 10.2 07/29/19982 5 28.0 10.3 07/29/19982 4 27.8 10.3
Date StationDepth (feet)
Water Temp.
(˚C) DO (mg/l) DO% Sat 07/29/19982 9 27.8 10.6 07/29/19982 11 27.5 10.5 07/29/19982 13 27.0 11.3 07/29/19982 15 25.2 13.5 07/29/19982 17 22.7 13.4 07/29/19982 19 20.4 4.8 07/29/19982 21 18.0 0.1 07/29/19982 23 15.4 0.1 07/29/19982 25 13.8 0.1 07/29/19982 27 12.8 0.1 07/29/19982 29 11.9 0.1 07/29/19983 1 28.5 10 07/29/19983 3 28.5 10.3 07/29/19983 5 28.2 10.3 07/29/19983 4 28.2 10.3 07/29/19983 9 28.1 10.3 07/29/19983 11 28.1 10.2 07/29/19983 13 28.1 10.3 07/29/19983 15 26.1 14.6 07/29/19983 17 23.5 17.4 07/29/19983 19 20.2 9.6 07/29/19983 21 17.5 0.3 07/29/19983 23 15.9 0 07/29/19983 25 14.4 0 07/29/19983 27 13.0 0 07/29/19983 35 10.0 0 07/29/19983 43 9.0 0 08/11/19981 1 27.5 8.5 08/11/19981 3 27.5 8.7 08/11/19981 5 27.5 8.8 08/11/19981 7 27.5 8.5 08/11/19982 1 8.9 8.9 08/11/19982 3 8.9 8.9 08/11/19982 5 8.9 8.9 08/11/19982 7 8.9 8.9 08/11/19982 9 8.9 8.9 08/11/19982 11 8.9 8.9 08/11/19982 13 8.9 8.9 08/11/19982 15 9.2 9.2 08/11/19982 17 9.4 9.4 08/11/19982 19 9.4 9.4
Page 33
FINAL
Piney Run Reservoir WQA of Eutrophication Document version: September 27, 2004
A18
08/11/19982 21 2.2 2.2 08/11/19982 23 0.6 0.6 08/11/19982 25 0.4 0.4 08/11/19982 27 0.4 0.4
Date StationDepth (feet)
Water Temp.
(˚C) DO (mg/l) DO% Sat 08/11/19982 29 0.4 0.4 08/11/19983 1 27.0 8.9 08/11/19983 3 27.0 8.9 08/11/19983 5 27.0 8.9 08/11/19983 7 27.0 8.9 08/11/19983 9 27.0 8.8 08/11/19983 11 27.0 8.8 08/11/19983 13 27.0 8.8 08/11/19983 15 27.0 8.8 08/11/19983 17 27.0 8.9 08/11/19983 19 22.0 14.2 08/11/19983 21 20.0 7.1 08/11/19983 23 17.0 0.2 08/11/19983 25 15.0 0.3 08/11/19983 27 13.0 0.3 08/11/19983 29 12.5 0.2 08/11/19983 31 12.0 0.2 08/11/19983 33 11.0 0.2 08/11/19983 35 11.0 0.2 08/11/19983 37 10.0 0.2 08/11/19983 39 10.0 0.2 08/11/19983 41 10.0 0.2 08/11/19983 43 10.0 0.2 08/11/19983 45 10.0 0.2 08/11/19983 47 9.0 0.2 08/26/19981 1 27.9 10 08/26/19981 3 27.9 10.1 08/26/19981 5 27.9 9.9 08/26/19981 7 27.6 9.6 08/26/19981 9 27.6 9.5 08/26/19982 1 27.8 10.2 08/26/19982 3 27.8 10.2 08/26/19982 5 27.5 10.2 08/26/19982 7 27.5 10.2 08/26/19982 9 27.5 10.1 08/26/19982 11 26.8 10.1 08/26/19982 13 26.2 9.6 08/26/19982 15 25.6 8.8 08/26/19982 17 25.1 8.4 08/26/19982 19 24.2 8.8
Page 34
FINAL
Piney Run Reservoir WQA of Eutrophication Document version: September 27, 2004
A19
08/26/19982 21 21.5 10.5 08/26/19982 23 19.3 3 08/26/19982 25 15.0 0 08/26/19982 27 13.7 0 08/26/19982 29 12.2 0 08/26/19983 1 28.0 10.2 08/26/19983 3 27.7 10.3 08/26/19983 5 27.7 10.3 08/26/19983 7 27.5 9.9 08/26/19983 9 27.0 9.6 08/26/19983 11 27.0 10.7 08/26/19983 13 26.5 10.2 08/26/19983 15 26.1 9.4 08/26/19983 17 25.5 8.9 08/26/19983 19 23.8 11 08/26/19983 21 20.1 12.7 08/26/19983 23 18.4 7.8 08/26/19983 25 15.2 0 08/26/19983 27 14.0 0 08/26/19983 29 13.0 0 08/26/19983 31 12.0 0 08/26/19983 33 11.2 0 08/26/19983 35 10.7 0 08/26/19983 37 10.2 0 08/26/19983 39 10.0 0 08/26/19983 41 9.8 0 08/26/19983 43 9.8 0 09/08/19981 1 25.5 9.1 09/08/19981 3 25.5 9.1 09/08/19981 5 25.5 9 09/08/19981 7 25.1 8.9 09/08/19981 9 25.0 8.2 09/08/19982 1 25.5 9.4 09/08/19982 3 25.5 9.4 09/08/19982 5 25.5 9.4 09/08/19982 7 25.5 9.3 09/08/19982 9 25.5 9.3 09/08/19982 11 25.5 9.2 09/08/19982 13 25.5 9 09/08/19982 15 25.5 9.2 09/08/19982 17 25.2 8.6 09/08/19982 19 24.6 7.7 09/08/19982 21 22.0 9.2 09/08/19982 23 18.0 0.6 09/08/19982 25 16.0 0.1 09/08/19982 27 14.5 0 09/08/19983 1 26.0 9.7
Page 35
FINAL
Piney Run Reservoir WQA of Eutrophication Document version: September 27, 2004
A20
09/08/19983 3 25.8 9.7 09/08/19983 5 25.8 9.6 09/08/19983 7 25.8 9.6 09/08/19983 9 25.8 9.6 09/08/19983 11 25.8 9.6 09/08/19983 13 25.8 9.6
Date StationDepth (feet)
Water Temp.
(˚C) DO (mg/l) DO% Sat 09/08/19983 15 25.8 9.5 09/08/19983 17 25.8 9.5 09/08/19983 19 25.8 9.4 09/08/19983 21 25.8 9.2 09/08/19983 23 20.3 8.3 09/08/19983 25 17.5 0 09/08/19983 27 15.5 0 09/08/19983 29 14.3 0 09/30/19981 1 23.0 8.3 09/30/19981 3 23.0 8.3 09/30/19981 5 23.0 8.2 09/30/19981 7 22.8 8.2 09/30/19982 1 23.2 8.6 09/30/19982 3 23.2 8.6 09/30/19982 5 23.0 8.5 09/30/19982 7 23.0 8.5 09/30/19982 9 23.0 8.3 09/30/19982 11 22.8 8.2 09/30/19982 13 22.8 7.6 09/30/19982 15 22.5 7 09/30/19982 17 22.3 6.7 09/30/19982 19 22.3 6.5 09/30/19982 21 22.0 5.5 09/30/19982 23 21.5 3.7 09/30/19982 25 18.3 0 09/30/19983 1 23.5 8.6 09/30/19983 3 23.0 8.6 09/30/19983 5 23.0 8.6 09/30/19983 7 22.8 8.6 09/30/19983 9 22.8 8.6 09/30/19983 11 22.8 8.5 09/30/19983 13 22.6 8.4 09/30/19983 15 22.6 8 09/30/19983 17 22.6 7.8 09/30/19983 19 22.5 6.9 09/30/19983 21 21.7 3.3 09/30/19983 23 20.4 0 09/30/19983 25 19.2 0
Page 36
FINAL
Piney Run Reservoir WQA of Eutrophication Document version: September 27, 2004
A21
09/30/19983 27 17.5 0 09/30/19983 29 14.5 0 09/30/19983 31 12.9 0 09/30/19983 33 12.1 0 09/30/19983 35 11.5 0 09/30/19983 37 11.2 0 09/30/19983 39 10.9 0 09/30/19983 41 10.5 0 09/30/19983 43 10.5 0 11/04/19981 1 13.0 8.7 11/04/19981 3 13.0 8.7 11/04/19981 5 13.0 8.7 11/04/19981 7 12.5 8.9 11/04/19981 9 12.0 8.9 11/04/19982 1 13.8 8.4 11/04/19982 5 13.8 8.4 11/04/19982 7 13.8 8.4 11/04/19982 9 13.8 8.4 11/04/19982 11 13.8 8.4 11/04/19982 13 13.8 8.3 11/04/19982 15 13.8 8.3 11/04/19982 19 13.8 8.3 11/04/19982 23 13.5 8.2 11/04/19982 25 13.5 8.2 11/04/19982 27 13.5 8.1 11/04/19983 1 13.9 8 11/04/19983 5 13.9 7.9 11/04/19983 9 13.9 7.9 11/04/19983 13 7.8 11/04/19983 17 13.9 7.8 11/04/19983 21 13.9 7.8 11/04/19983 25 13.9 7.7 11/04/19983 29 13.9 7.7 11/04/19983 33 13.9 7.5 11/04/19983 37 13.9 7.5 11/04/19983 40 11.3 0 12/16/19981 1 7.5 10.1 12/16/19981 3 7.5 10 12/16/19981 5 7.5 10 12/16/19981 7 7.5 10.2 12/16/19981 9 6.0 10.2 12/16/19982 1 8.5 9.7 12/16/19982 7 8.5 9.7 12/16/19982 13 8.5 9.5 12/16/19982 19 8.5 9.3 12/16/19982 25 8.1 9.2 12/16/19983 1 8.5 9.7
Page 37
FINAL
Piney Run Reservoir WQA of Eutrophication Document version: September 27, 2004
A22
12/16/19983 7 8.5 9.6 12/16/19983 13 8.5 9.5 12/16/19983 19 8.5 9.4 12/16/19983 25 8.5 9.4 12/16/19983 31 8.5 9.3 12/16/19983 37 8.5 9.1 01/27/19991 1 5.2 11 01/27/19991 4 5.2 11
Date StationDepth (feet)
Water Temp.
(˚C) DO (mg/l) DO% Sat 01/27/19992 1 4.5 12.2 01/27/19992 3 4.5 12.1 01/27/19992 5 4.5 12 01/27/19992 7 4.5 11.8 01/27/19992 9 4.0 11.6 01/27/19992 11 4.0 11.4 01/27/19992 13 4.0 11.3 01/27/19992 15 4.0 11.2 01/27/19992 17 4.0 11.1 01/27/19992 19 4.0 11 01/27/19992 21 4.0 11 01/27/19992 23 4.0 10.8 01/27/19993 1 4.0 12.1 01/27/19993 7 4.0 11.2 01/27/19993 13 3.7 10.6 01/27/19993 19 3.7 9.8 01/27/19993 25 3.7 9.7 01/27/19993 31 3.7 9.6 01/27/19993 37 3.7 9.5 04/27/19991 1 13.5 9.3 04/27/19991 3 13.5 9 04/27/19991 5 13.1 8.7 04/27/19991 7 12.5 8.5 04/27/19991 9 12.5 8.3 04/27/19992 1 14.2 9.4 04/27/19992 3 14.2 9.2 04/27/19992 5 14.0 8.9 04/27/19992 7 14.0 8.9 04/27/19992 9 14.0 8.6 04/27/19992 11 13.8 8.3 04/27/19992 13 13.4 8 04/27/19992 15 12.8 7.5 04/27/19992 17 12.8 7.3 04/27/19992 19 12.3 7 04/27/19992 21 12.0 6.6 04/27/19992 23 12.0 6.2
Page 38
FINAL
Piney Run Reservoir WQA of Eutrophication Document version: September 27, 2004
A23
04/27/19992 25 12.0 6.1 04/27/19993 1 15.3 9.7 04/27/19993 3 14.9 9.3 04/27/19993 5 14.9 9.1 04/27/19993 7 14.8 8.9 04/27/19993 9 14.8 9 04/27/19993 11 14.8 8.7 04/27/19993 13 14.6 8.6 04/27/19993 15 14.5 8.5 04/27/19993 17 13.7 8.4 04/27/19993 19 13.0 8.3 04/27/19993 21 12.5 8.1 04/27/19993 23 12.2 7.8 04/27/19993 25 12.1 7.6 04/27/19993 27 12.0 7.4 04/27/19993 29 12.0 7.2 04/27/19993 31 11.9 6.8 04/27/19993 33 11.9 6.1 04/27/19993 35 11.5 5.6 04/27/19993 37 11.2 4.6 04/27/19993 39 9.8 2.4 04/27/19993 41 9.0 2.3 05/12/19991 1 20.1 9 05/12/19991 3 20.1 8.7 05/12/19991 5 19.9 8.6 05/12/19992 1 20.1 9 05/12/19992 3 20.0 8.9 05/12/19992 5 20.0 8.7 05/12/19992 7 19.8 8.8 05/12/19992 9 19.4 8.7 05/12/19992 11 19.0 8.7 05/12/19992 13 18.5 8.6 05/12/19992 15 17.7 8.8 05/12/19992 17 16.8 8.8 05/12/19992 19 15.6 8.4 05/12/19992 21 14.8 7.5 05/12/19992 23 13.5 5.3 05/12/19992 25 13.0 4 05/12/19992 27 12.6 3 05/12/19992 29 12.5 2.9 05/12/19993 1 20.8 9.1 05/12/19993 3 20.1 8.9 05/12/19993 5 19.9 8.8 05/12/19993 7 19.5 8.8 05/12/19993 9 19.5 8.6 05/12/19993 11 19.2 8.5 05/12/19993 13 18.5 8.7
Page 39
FINAL
Piney Run Reservoir WQA of Eutrophication Document version: September 27, 2004
A24
05/12/19993 15 17.7 8.9 05/12/19993 17 16.0 8.8 05/12/19993 19 15.2 8.8 05/12/19993 21 14.9 8.6 05/12/19993 23 14.0 8.3 05/12/19993 25 13.5 7.9 05/12/19993 27 13.0 7.2 05/12/19993 29 12.5 5.8 05/12/19993 31 12.0 4.5 05/12/19993 33 11.5 3.4
Date StationDepth (feet)
Water Temp.
(˚C) DO (mg/l) DO% Sat 05/12/19993 35 11.2 2.5 05/12/19993 37 11.0 1.9 05/12/19993 39 10.7 1.6 06/08/19991 1 25.5 10 06/08/19991 3 25.5 10 06/08/19991 5 25.0 8.97 06/08/19992 1 26.0 9.3 06/08/19992 3 26.0 9.3 06/08/19992 5 25.8 9.4 06/08/19992 7 25.8 9.7 06/08/19992 9 25.0 9.7 06/08/19992 11 24.2 9.6 06/08/19992 13 23.5 9.3 06/08/19992 15 22.3 9.2 06/08/19992 17 21.0 8.7 06/08/19992 19 19.6 7.1 06/08/19992 21 18.8 6.5 06/08/19992 23 17.1 4.4 06/08/19992 25 15.3 2.6 06/08/19993 1 26.8 8.9 06/08/19993 3 26.8 8.9 06/08/19993 5 26.5 8.9 06/08/19993 7 26.5 8.9 06/08/19993 9 26.5 9 06/08/19993 11 26.5 9.1 06/08/19993 13 24.5 9 06/08/19993 15 23.5 9.2 06/08/19993 17 22.0 9.3 06/08/19993 19 19.1 7.6 06/08/19993 21 18.0 6.8 06/08/19993 23 17.0 5.5 06/08/19993 25 15.4 4.6 06/08/19993 27 14.4 3.8 06/08/19993 29 13.8 3.1
Page 40
FINAL
Piney Run Reservoir WQA of Eutrophication Document version: September 27, 2004
A25
06/08/19993 31 13.1 2.2 06/08/19993 33 12.5 1.2 06/08/19993 35 12.2 0.3 06/08/19993 37 11.9 0.3 06/08/19993 39 11.3 0.3 06/23/19991 1 24.5 10.4 06/23/19991 3 23.9 10.4 06/23/19991 5 23.5 9.6 06/23/19992 1 24.0 9 06/23/19992 3 23.6 9.1 06/23/19992 5 23.1 9 06/23/19992 7 23.0 9.1 06/23/19992 9 22.8 9.1 06/23/19992 11 22.5 8.7 06/23/19992 13 22.4 8.4 06/23/19992 15 22.2 7.9 06/23/19992 17 22.0 7.6 06/23/19992 19 21.5 5.2 06/23/19992 21 19.5 3.4 06/23/19992 23 17.8 2.1 06/23/19993 1 24.5 9.4 06/23/19993 3 23.9 9.4 06/23/19993 5 23.5 9.3 06/23/19993 7 23.1 9.3 06/23/19993 9 23.0 9.2 06/23/19993 11 22.9 9.1 06/23/19993 13 22.8 8.9 06/23/19993 15 22.5 8.8 06/23/19993 17 22.0 7.8 06/23/19993 19 20.2 5.9 06/23/19993 21 19.0 3.6 06/23/19993 23 17.6 3.3 06/23/19993 25 16.4 2.6 06/23/19993 27 15.2 2.1 06/23/19993 29 14.3 1.4 06/23/19993 31 13.3 0.7 06/23/19993 33 12.5 0.2 06/23/19993 35 12.0 0.2 06/23/19993 37 11.7 0.2 06/23/19993 39 11.4 0.2 07/07/19991 1 28.9 9.2 07/07/19991 3 28.9 9.2 07/07/19991 5 28.7 9.2 07/07/19991 7 28.2 8.5 07/07/19992 1 29.0 9.2 07/07/19992 3 29.0 9.2 07/07/19992 5 29.0 9.3
Page 41
FINAL
Piney Run Reservoir WQA of Eutrophication Document version: September 27, 2004
A26
07/07/19992 7 29.0 9.4 07/07/19992 9 28.9 9.5 07/07/19992 11 27.5 10.2 07/07/19992 13 26.0 9.4 07/07/19992 15 24.8 8.7 07/07/19992 17 23.7 7.9 07/07/19992 19 22.4 5.9 07/07/19992 21 20.8 3.2 07/07/19992 23 19.1 1.2 07/07/19992 25 17.2 0.5 07/07/19992 27 16.2 0.3 07/07/19993 1 29.5 9.4 07/07/19993 3 29.5 9.2 07/07/19993 5 29.2 9 07/07/19993 7 29.2 9.1 07/07/19993 9 29.2 9.1 07/07/19993 11 29.2 9.1 07/07/19993 13 27.5 8.7 07/07/19993 15 25.5 8.6 07/07/19993 17 23.8 7.7 07/07/19993 19 22.0 5.8 07/07/19993 21 20.5 3.9 07/07/19993 23 18.9 1.3 07/07/19993 25 17.5 0.7 07/07/19993 27 16.0 0.5 07/07/19993 29 14.5 1.4 07/07/19993 31 13.7 0.3 07/07/19993 33 13.1 0.3 07/07/19993 35 12.8 0.1 07/07/19993 37 12.4 0.1 07/07/19993 39 12.0 0.1 07/22/19991 1 27.9 9.2 07/22/19991 3 27.9 9.2 07/22/19991 5 27.5 9 07/22/19991 7 27.3 8.6 07/22/19992 1 28.0 9.2 07/22/19992 3 27.8 9.3 07/22/19992 5 27.8 9.3 07/22/19992 7 27.8 9.3 07/22/19992 9 27.5 9.1 07/22/19992 11 27.5 8.8 07/22/19992 13 27.0 8.5 07/22/19992 15 26.5 7.7 07/22/19992 17 25.5 6.7 07/22/19992 19 24.5 5.3 07/22/19992 21 22.0 1.7 07/22/19992 23 20.1 1.1
Page 42
FINAL
Piney Run Reservoir WQA of Eutrophication Document version: September 27, 2004
A27
07/22/19993 1 28.0 9.3 07/22/19993 3 27.8 9.3 07/22/19993 5 27.5 9.3 07/22/19993 7 27.5 9.3 07/22/19993 9 27.5 9.3 07/22/19993 11 27.3 9.3 07/22/19993 13 27.3 9.2 07/22/19993 15 26.5 8.1 07/22/19993 17 25.1 7.2 07/22/19993 19 23.5 5.1 07/22/19993 21 22.2 2.9 07/22/19993 23 20.5 1.3 07/22/19993 25 18.5 2 07/22/19993 27 17.0 1.4 07/22/19993 29 15.2 0.3 07/22/19993 31 14.8 0.4 07/22/19993 33 14.0 0.6 07/22/19993 35 13.2 0.2 07/22/19993 37 12.5 0.2 07/22/19993 39 12.0 0.2 07/22/19993 41 11.7 0.2 08/04/19991 1 27.5 9.2 08/04/19991 3 27.5 9.4 08/04/19991 5 27.5 9.4 08/04/19991 7 26.0 8 08/04/19992 1 28.5 8.6 08/04/19992 3 28.1 8.75 08/04/19992 5 28.0 8.8 08/04/19992 7 28.0 8.7 08/04/19992 9 28.0 8.5 08/04/19992 11 28.0 8.3 08/04/19992 13 27.9 7.6 08/04/19992 15 27.5 7.5 08/04/19992 17 26.5 6 08/04/19992 19 24.9 3.7 08/04/19992 21 23.0 0.4 08/04/19992 23 20.0 0.2 08/04/19993 1 29.0 8.5 08/04/19993 3 29.0 8.6 08/04/19993 5 28.5 8.8 08/04/19993 7 28.2 8.7 08/04/19993 9 28.1 8.5 08/04/19993 11 28.0 8.4 08/04/19993 13 28.0 8.1 08/04/19993 15 27.8 7.6 08/04/19993 17 27.0 6.8 08/04/19993 19 25.0 6
Page 43
FINAL
Piney Run Reservoir WQA of Eutrophication Document version: September 27, 2004
A28
08/04/19993 21 23.9 2.8 08/04/19993 23 21.1 2.8 08/04/19993 25 19.8 1.7 08/04/19993 27 18.0 2.2 08/04/19993 29 16.5 1.1 08/04/19993 31 15.1 1.1 08/04/19993 33 14.2 0.2 08/04/19993 35 13.9 0.1 08/04/19993 37 13.0 0.1 08/04/19993 39 12.3 0.1 08/04/19993 41 12.0 0.1 08/04/19993 43 11.9 0.1 08/19/19991 1 26.8 9.8 08/19/19991 3 26.3 9.6 08/19/19991 5 26.5 8.9 08/19/19992 1 27.4 9.3 08/19/19992 3 27.4 9.3 08/19/19992 5 27.4 9.3 08/19/19992 7 27.3 9.2 08/19/19992 9 27.3 9.1 08/19/19992 11 27.1 8.7 08/19/19992 13 27.0 8 08/19/19992 15 26.8 7.2 08/19/19992 17 26.6 5.5 08/19/19992 19 25.5 1 08/19/19992 21 23.9 0.3 08/19/19992 23 22.7 0 08/19/19993 1 28.0 9.3 08/19/19993 3 28.0 9.3 08/19/19993 5 28.0 9.3 08/19/19993 7 27.8 9.2 08/19/19993 9 27.5 9.2 08/19/19993 11 27.5 8.7 08/19/19993 13 27.0 7.1 08/19/19993 15 26.8 6.5 08/19/19993 17 26.5 6.3 08/19/19993 19 25.8 1.7 08/19/19993 21 24.2 0.3 08/19/19993 23 21.6 0.3 08/19/19993 25 20.2 0 08/19/19993 27 18.5 0 08/19/19993 29 17.0 0 08/19/19993 31 15.0 0 08/19/19993 33 14.5 0 08/19/19993 35 13.7 0 08/19/19993 37 12.7 0 08/19/19993 39 12.5 0
Page 44
FINAL
Piney Run Reservoir WQA of Eutrophication Document version: September 27, 2004
A29
09/09/19991 1 24.8 11.5 09/09/19991 3 24.8 10.7 09/09/19991 5 24.5 10.6 09/09/19991 7 23.6 8.1 09/09/19991 9 22.0 1.2 09/09/19992 1 24.9 9.2 09/09/19992 3 24.7 9.1 09/09/19992 5 24.5 8.9 09/09/19992 7 24.0 8.6 09/09/19992 9 24.0 8.6 09/09/19992 11 23.9 8.6 09/09/19992 13 23.7 8.3 09/09/19992 15 23.5 7.8 09/09/19992 17 23.5 7.4 09/09/19992 19 23.1 6.7 09/09/19992 21 23.0 4.9 09/09/19992 23 22.5 3.2 09/09/19993 1 25.0 8.7 09/09/19993 3 25.0 8.7 09/09/19993 5 24.5 8.4 09/09/19993 7 24.2 8.5 09/09/19993 9 24.2 8.4 09/09/19993 11 24.0 8.1 09/09/19993 13 23.7 7.8 09/09/19993 15 23.5 7.5 09/09/19993 17 23.5 6.1 09/09/19993 19 23.2 6 09/09/19993 21 23.0 4.9 09/09/19993 23 22.6 3.1 09/09/19993 25 21.4 2 09/09/19993 27 20.1 0 09/09/19993 29 18.7 0 09/09/19993 31 17.0 0 09/09/19993 33 16.0 0 09/09/19993 35 14.8 0 09/09/19993 37 13.9 0 09/09/19993 39 13.0 0 09/09/19993 41 12.7 0 09/09/19993 43 12.5 0 09/09/19993 45 12.2 0 09/24/19991 1 19.6 9.1 09/24/19991 3 19.4 10.2 09/24/19991 5 19.2 10.3 09/24/19991 7 19.2 10.4 09/24/19992 1 20.5 8.4 09/24/19992 3 20.5 8.5 09/24/19992 5 20.2 8.6
Page 45
FINAL
Piney Run Reservoir WQA of Eutrophication Document version: September 27, 2004
A30
09/24/19992 7 20.2 8.5 09/24/19992 9 20.1 8.3 09/24/19992 11 20.1 8.3 09/24/19992 13 20.1 8.2 09/24/19992 15 20.1 8.2 09/24/19992 17 20.1 7.7 09/24/19992 19 20.0 7.4 09/24/19992 21 20.0 7.6 09/24/19992 23 20.0 7.3 09/24/19992 25 19.8 7 09/24/19992 27 19.5 7 09/24/19993 1 20.5 7.9 09/24/19993 3 20.1 7.9 09/24/19993 5 20.0 7.9 09/24/19993 7 20.0 7.8 09/24/19993 9 20.0 7.8 09/24/19993 11 19.9 7.7 09/24/19993 13 19.9 7.7 09/24/19993 15 19.8 7.7 09/24/19993 17 19.8 7.6 09/24/19993 19 19.8 7.5 09/24/19993 21 19.8 7.5 09/24/19993 23 19.8 7.5 09/24/19993 25 19.8 7.4 09/24/19993 27 19.8 7.4 09/24/19993 29 19.7 7.4 09/24/19993 31 19.5 6.6 09/24/19993 33 19.4 5 09/24/19993 35 17.9 0 09/24/19993 37 15.8 0 09/24/19993 39 14.7 0 09/24/19993 41 13.6 0 10/07/19991 1 17.1 10.5 10/07/19991 3 17.1 10.2 10/07/19991 5 17.0 10.4 10/07/19991 7 17.0 10.4 10/07/19992 1 18.5 8.1 10/07/19992 3 18.5 8 10/07/19992 5 18.5 8 10/07/19992 7 18.5 7.9 10/07/19992 9 18.5 7.7 10/07/19992 11 18.5 7.6 10/07/19992 13 18.5 7.5 10/07/19992 15 18.5 7.3 10/07/19992 17 18.5 7.2 10/07/19992 19 18.5 7.1 10/07/19992 21 18.5 6.9
Page 46
FINAL
Piney Run Reservoir WQA of Eutrophication Document version: September 27, 2004
A31
10/07/19992 23 18.5 6.8 10/07/19992 25 18.5 6.7 10/07/19992 27 18.5 6.4 10/07/19993 1 18.7 7.8 10/07/19993 3 7.8 10/07/19993 5 18.7 7.8 10/07/19993 7 7.8 10/07/19993 9 18.7 7.8 10/07/19993 11 7.8 10/07/19993 13 18.7 7.8 10/07/19993 15 7.8 10/07/19993 17 18.7 7.8 10/07/19993 19 7.8 10/07/19993 21 18.7 7.8 10/07/19993 23 7.8 10/07/19993 25 18.7 7.8 10/07/19993 27 7.8 10/07/19993 29 18.7 7.7 10/07/19993 31 7.6 10/07/19993 33 18.5 7.4 10/07/19993 35 6 10/07/19993 37 18.3 4.8 10/07/19993 39 0.2 10/07/19993 41 15.0 0.2 10/28/19991 1 14.0 11.1 10/28/19991 3 14.0 11.4 10/28/19991 5 13.8 11 10/28/19991 7 13.5 11.4 10/28/19991 9 13.5 11.7 10/28/19992 1 14.5 9.8 10/28/19992 5 14.5 9.8 10/28/19992 9 14.5 9.6 10/28/19992 13 14.2 9.4 10/28/19992 17 14.2 9.4 10/28/19992 21 14.2 9.2 10/28/19992 25 14.2 9.1 10/28/19993 1 14.8 9.9 10/28/19993 5 14.5 9.8 10/28/19993 9 14.5 9.6 10/28/19993 13 14.2 9.5 10/28/19993 17 14.2 9.4 10/28/19993 21 14.2 9.3 10/28/19993 25 14.2 9.3 10/28/19993 29 14.2 9.2 10/28/19993 33 14.2 9.1 10/28/19993 37 14.2 9 10/28/19993 41 14.1 8.5
Page 47
FINAL
Piney Run Reservoir WQA of Eutrophication Document version: September 27, 2004
A32
11/28/19991 1 9.3 11 11/28/19991 3 9.3 10.9 11/28/19991 5 8.6 10.6 11/28/19991 7 8.2 10.3 11/28/19991 9 8.0 9.8 11/28/19991 11 7.8 9.8 11/28/19992 1 10.5 9.8 11/28/19992 5 10.5 9.8 11/28/19992 9 10.0 9.6 11/28/19992 13 10.0 9.4 11/28/19992 17 9.8 9.4 11/28/19992 21 9.8 9.2 11/28/19993 1 10.8 10.4 11/28/19993 5 10.5 9.9 11/28/19993 9 10.5 9.7 11/28/19993 13 10.5 9.6 11/28/19993 17 10.5 9.5 11/28/19993 21 10.2 9.5 11/28/19993 25 10.2 9.3 11/28/19993 29 10.2 9.3 11/28/19993 33 10.2 9.3 11/28/19993 37 10.2 9.3 11/28/19993 41 10.2 9.3 04/20/20001 1 12.9 10.22 98.6 04/20/20001 3 12.4 10.26 98.1 04/20/20001 5 12.4 10.16 96.9 04/20/20001 7 12.2 9.98 94.8 04/20/20001 9 11.8 9.57 90.2 04/20/20002 1 13.2 10.26 99.7 04/20/20002 3 13.2 10.25 99.6 04/20/20002 5 13.1 10.2 99.4 04/20/20002 7 12.9 10.24 99.0 04/20/20002 9 12.8 10.24 98.6 04/20/20002 11 12.6 10.16 97.2 04/20/20002 13 12.5 10.08 96.3 04/20/20002 15 12.4 10.01 95.6 04/20/20002 17 12.3 9.85 93.9 04/20/20002 19 12.1 9.69 91.7 04/20/20002 21 12.0 9.77 92.4 04/20/20002 23 12.0 9.75 92.2 04/20/20002 25 12.0 9.74 92.0 04/20/20002 27 11.8 9.2 86.7 04/20/20002 29 11.7 8.98 84.3 04/20/20002 31 11.4 8.5 79.4 04/20/20003 1 13.1 10.26 99.4 04/20/20003 3 12.6 10.22 97.9 04/20/20003 5 12.4 10.25 97.8
Page 48
FINAL
Piney Run Reservoir WQA of Eutrophication Document version: September 27, 2004
A33
04/20/20003 7 12.3 10.09 96.1 04/20/20003 9 12.2 10.1 95.9 04/20/20003 11 12.1 10.06 95.4 04/20/20003 13 12.1 10.01 94.9 04/20/20003 15 12.0 9.85 93.1 04/20/20003 17 11.9 9.68 91.4 04/20/20003 19 11.8 9.53 89.8 04/20/20003 21 11.8 9.44 88.9 04/20/20003 23 11.7 9.27 87.1 04/20/20003 25 11.7 9.26 86.9 04/20/20003 27 11.6 9.14 85.6 04/20/20003 31 11.5 8.97 83.9 04/20/20003 33 11.4 8.93 83.4 04/20/20003 35 11.3 8.6 80.1 04/20/20003 37 11.3 8.18 76.1 04/20/20003 39 11.2 7.6 70.5 04/20/20003 41 11.0 6.31 58.3 05/10/20001 1 24.9 8.88 110.3 05/10/20001 3 24.4 8.43 103.8 05/10/20001 5 23.1 9.81 117.7 05/10/20001 7 20.2 10.34 117.3 05/10/20001 9 18.6 10.31 113.3 05/10/20002 1 25.1 8.65 107.8 05/10/20002 3 24.7 8.71 107.3 05/10/20002 5 22.9 9.36 112 05/10/20002 7 19.7 9.96 111.9 05/10/20002 9 18.4 10.02 109.7 05/10/20002 11 17.5 10.19 109.6 05/10/20002 13 16.4 10.13 106.5 05/10/20002 15 15.8 10.35 107.5 05/10/20002 17 15.3 9.9 101.6 05/10/20002 19 14.8 9.52 96.8 05/10/20002 22 14.4 8.81 88.8 05/10/20002 23 13.7 7.64 75.8 05/10/20002 25 13.5 7.28 71.9 05/10/20002 27 13.2 6.19 60.7 05/10/20002 29 12.9 4.71 45.8 05/10/20003 1 24.4 8.3 102.1 05/10/20003 3 23.3 9.13 110 05/10/20003 5 20.5 9.15 104.6 05/10/20003 7 18.6 9.36 102.9 05/10/20003 9 17.8 9.04 97.8 05/10/20003 11 17.2 9.02 96.3 05/10/20003 13 16.3 9.41 98.8 05/10/20003 15 15.6 9.23 95.4 05/10/20003 17 15.1 9.2 94.1 05/10/20003 19 14.8 9.11 92.6
Page 49
FINAL
Piney Run Reservoir WQA of Eutrophication Document version: September 27, 2004
A34
05/10/20003 21 14.3 9.02 90.6 05/10/20003 23 13.9 8.46 84.3 05/10/20003 25 13.7 8.3 82.2 05/10/20003 27 13.5 8.2 80.9 05/10/20003 29 13.3 7.92 77.8 05/10/20003 31 13.1 7.67 75 05/10/20003 33 12.7 6.98 67.7 05/10/20003 35 12.3 5.88 56.5 05/10/20003 37 12.1 5.08 48.5 05/10/20003 39 11.4 2.35 22.2 05/10/20003 41 11.2 1.73 16.1 05/10/20003 43 11.1 1.05 9.8 05/26/20001 1 20.1 8.82 99.4 05/26/20001 3 20.1 8.83 99.4 05/26/20001 5 19.9 8.86 99.5 05/26/20001 7 19.8 8.88 99.4 05/26/20001 9 19.4 8.36 92.8 05/26/20002 1 20.6 8.92 101.6 05/26/20002 3 20.5 8.92 101.3 05/26/20002 5 20.5 8.91 101.1 05/26/20002 7 20.4 8.87 100.5 05/26/20002 9 20.4 8.84 100.1 05/26/20002 11 20.1 8.55 96.3 05/26/20002 13 19.5 8.29 92.2 05/26/20002 15 18.5 7.24 78.9 05/26/20002 17 16.8 7.49 78.9 05/26/20002 19 15.7 7.68 78.8 05/26/20002 21 15.0 6.59 66.8 05/26/20003 1 21.1 8.82 101.3 05/26/20003 3 21.0 8.96 102.7 05/26/20003 5 20.9 9.04 103.4 05/26/20003 7 20.9 9.1 104.1 05/26/20003 9 20.8 9.18 104.8 05/26/20003 11 20.8 9.2 105.1 05/26/20003 13 20.8 9.25 105.6 05/26/20003 15 20.8 9.21 105.1 05/26/20003 17 17.2 8.4 89.1 05/26/20003 19 15.9 7.85 81.2 05/26/20003 21 15.1 6.92 70.2 05/26/20003 23 14.4 6.65 66.6 05/26/20003 25 14.1 6.12 60.8 05/26/20003 27 13.6 5.6 55 05/26/20003 29 13.3 5.04 49.2 05/26/20003 31 12.8 3.77 36.5 05/26/20003 33 12.6 3 28.6 05/26/20003 35 12.4 2.55 24.4 05/26/20003 37 12.4 2.18 20.8
Page 50
FINAL
Piney Run Reservoir WQA of Eutrophication Document version: September 27, 2004
A35
05/26/20003 39 12.3 2.24 21.7 05/26/20003 41 12.2 1.8 17.1 05/26/20003 43 11.9 0.88 8.3 06/09/20001 1 21.7 8.83 101.9 06/09/20001 3 21.7 8.87 102.4 06/09/20001 5 21.5 8.81 101.6 06/09/20001 7 20.9 9.17 104.4 06/09/20001 9 20.5 8.73 98.4 06/09/20002 1 21.8 8.97 103.7 06/09/20002 3 21.7 8.98 103.6 06/09/20002 5 21.4 8.99 103.4 06/09/20002 7 21.2 8.94 102.2 06/09/20002 9 20.7 8.86 100.4 06/09/20002 11 20.4 8.67 97.5 06/09/20002 13 20.2 8.4 94.1 06/09/20002 15 19.9 7.99 89.1 06/09/20002 17 18.9 6.24 68.2 06/09/20002 19 18.0 5.46 58.6 06/09/20002 21 16.2 4.29 44.2 06/09/20002 23 14.8 2.71 27.2 06/09/20002 25 14.2 2.59 25.6 06/09/20002 27 13.9 2.07 20.4 06/09/20003 1 22.2 9 104.9 06/09/20003 3 22.0 8.97 104.1 06/09/20003 5 21.9 8.98 104 06/09/20003 7 21.8 9.05 104.6 06/09/20003 9 21.6 8.94 103.2 06/09/20003 11 21.2 9.06 103.5 06/09/20003 13 20.9 9.1 103.6 06/09/20003 15 20.6 8.85 99.8 06/09/20003 17 19.6 7.84 86.9 06/09/20003 19 17.5 5.32 56.4 06/09/20003 21 15.8 5.19 53.3 06/09/20003 23 15.1 4.98 49.9 06/09/20003 25 14.5 4.59 45.7 06/09/20003 27 14.0 4.03 39.7 06/09/20003 29 13.7 3.3 32.3 06/09/20003 31 13.3 2.68 26 06/09/20003 33 13.1 2.42 23.4 06/09/20003 35 12.8 1.55 14.9 06/09/20003 37 12.6 0.88 8.4 06/09/20003 39 12.4 0.36 3.4 06/23/20001 1.09 25.3 8.66 108.1 06/23/20001 3.01 25.3 8.71 108.7 06/23/20001 5 25.2 8.57 106.7 06/23/20001 6.96 24.9 8.76 108.4 06/23/20001 9.01 24.6 8.54 105
Page 51
FINAL
Piney Run Reservoir WQA of Eutrophication Document version: September 27, 2004
A36
06/23/20002 0.98 25.6 8.39 105.2 06/23/20002 2.96 25.6 8.38 105.1 06/23/20002 4.98 25.5 8.46 105.9 06/23/20002 7.07 25.4 8.44 105.4 06/23/20002 9.01 25.2 8.62 107.3 06/23/20002 11.01 24.2 8.63 105.6 06/23/20002 13.08 23.1 7.67 91.7 06/23/20002 15.05 21.2 5.7 65.8 06/23/20002 17.05 20.0 4.91 55.4 06/23/20002 19.04 18.6 3.31 36.2 06/23/20002 21.02 17.3 2.24 23.9 06/23/20002 22.99 15.7 1.08 11.1 06/23/20002 25.06 14.9 0.77 7.8 06/23/20002 27.02 14.6 0.48 5 06/23/20003 0.99 25.7 8.35 104.9 06/23/20003 3 25.7 8.33 104.5 06/23/20003 5.08 25.6 8.35 104.8 06/23/20003 7.01 25.6 8.4 105.3 06/23/20003 8.97 25.6 8.43 105.6 06/23/20003 10.87 25.5 8.39 105 06/23/20003 13.04 25.3 8.39 104.7 06/23/20003 15.02 22.3 7.07 83.4 06/23/20003 16.99 20.5 5.71 65 06/23/20003 18.95 19.2 4.32 47.9 06/23/20003 21.02 17.2 2.68 28.6 06/23/20003 23.15 15.4 2.04 21 06/23/20003 25.04 15.0 2.21 22.4 06/23/20003 27.1 14.6 1.82 18.3 06/23/20003 28.99 14.3 1.66 16.6 06/23/20003 31.08 13.9 1.15 11.4 06/23/20003 33.02 13.4 0.61 6 06/23/20003 35.02 12.9 0.08 0.8 06/23/20003 37.04 12.8 0 0 06/23/20003 39.03 12.6 0 0 07/06/20001 1.04 26.9 9.49 121.5 07/06/20001 2.97 26.8 9.53 121.8 07/06/20001 5.02 26.7 10.57 134.7 07/06/20001 7.05 26.5 11.56 146.8 07/06/20001 9.08 26.4 11.79 149.5 07/06/20001 11.03 24.4 9.16 112 07/06/20002 1.03 27.2 8.87 114 07/06/20002 2.89 27.2 8.91 114.6 07/06/20002 5.02 27.2 8.98 115.5 07/06/20002 6.98 27.2 9.12 117.2 07/06/20002 9.02 27.1 9.06 116.2 07/06/20002 10.98 26.6 8.89 113.2 07/06/20002 13.06 25.6 8.61 107.4
Page 52
FINAL
Piney Run Reservoir WQA of Eutrophication Document version: September 27, 2004
A37
07/06/20002 15.04 23.8 8.49 102.7 07/06/20002 16.95 21.9 6 70 07/06/20002 19.01 20.1 3.47 39.1 07/06/20002 21.05 18.5 1.32 14.4 07/06/20002 22.99 17.1 0.52 5.5 07/06/20002 24.98 15.3 0.29 2.9 07/06/20002 27.06 14.7 0.24 2.4 07/06/20003 1.06 27.8 8.58 111.6 07/06/20003 2.97 27.7 8.56 111 07/06/20003 5.04 27.6 8.56 111 07/06/20003 7.01 27.6 8.61 111.4 07/06/20003 9.06 27.5 8.62 111.5 07/06/20003 11.08 26.4 8.67 110 07/06/20003 13.05 25.9 7.98 100.2 07/06/20003 14.98 24.4 8.27 101.2 07/06/20003 17.03 22.2 6.67 78.2 07/06/20003 18.86 19.7 3.96 44.2 07/06/20003 20.99 18.1 1.84 19.8 07/06/20003 22.99 16.8 0.96 10.1 07/06/20003 25 15.7 0.45 4.6 07/06/20003 27 15.1 0.33 3.3 07/06/20003 29 14.6 0.23 2.3 07/06/20003 30.99 14.2 0.2 2 07/06/20003 32.97 13.8 0.12 1.2 07/06/20003 34.98 13.2 0.57 5.5 07/06/20003 37.02 12.6 0.4 3.9 07/18/20001 1 26.1 9.92 125 07/18/20001 2.89 25.9 9.63 120.9 07/18/20001 5.01 25.8 9.86 123.7 07/18/20001 7.03 25.8 9.8 122.8 07/18/20001 9.01 25.7 10.46 130.6 07/18/20002 1.06 26.7 8.83 112.6 07/18/20002 3.07 26.5 8.98 114 07/18/20002 4.95 26.4 9.05 114.7 07/18/20002 6.93 26.3 9.18 116.1 07/18/20002 8.88 26.3 9.23 116.7 07/18/20002 11.03 26.1 9.63 121.3 07/18/20002 12.98 25.9 9.01 113.2 07/18/20002 14.98 25.6 8.72 108.9 07/18/20002 17.03 24.3 8.79 107.1 07/18/20002 19.1 22.5 8.93 105.2 07/18/20002 21.01 19.9 4.5 50.4 07/18/20002 23.01 18.4 0.86 9.7 07/18/20002 25 16.4 0.05 0.5 07/18/20002 26.96 15.2 0.02 0.2 07/18/20003 1.04 27.0 8.63 110.6 07/18/20003 3 26.8 8.75 111.9
Page 53
FINAL
Piney Run Reservoir WQA of Eutrophication Document version: September 27, 2004
A38
07/18/20003 5.09 26.7 8.89 113.3 07/18/20003 7.01 26.5 8.86 112.5 07/18/20003 9.02 26.4 8.83 112 07/18/20003 11.01 26.3 8.65 109.5 07/18/20003 13.09 26.0 8.56 107.8 07/18/20003 15.06 25.4 8.28 103.1 07/18/20003 17.08 24.7 8.33 102.4 07/18/20003 18.95 23.3 8.8 105.4 07/18/20003 21.01 19.9 4.35 48.7 07/18/20003 23.09 17.8 0.39 4.1 07/18/20003 25.02 16.6 0.22 2.3 07/18/20003 27.07 15.8 0.15 1.6 07/18/20003 29.03 14.9 0.1 1 07/18/20003 30.98 14.4 0.1 1 07/18/20003 32.96 14.1 0.09 0.9 07/18/20003 34.93 13.7 0.23 2.2 07/18/20003 36.99 13.3 0 0 07/18/20003 39.02 12.8 0 0 07/18/20003 41.03 12.6 0 0 08/03/20001 1.02 27.4 10.9 140.8 08/03/20001 3.05 27.4 10.88 140.4 08/03/20001 5.05 27.4 10.6 136.8 08/03/20001 7.05 27.1 10.91 139.7 08/03/20001 9.06 24.0 7.43 90.1 08/03/20001 10.94 22.1 1.48 17.3 08/03/20002 0.98 27.2 9.78 125.6 08/03/20002 3.15 27.2 9.94 127.7 08/03/20002 5.04 27.0 9.62 123.3 08/03/20002 7.02 26.9 9.36 119.7 08/03/20002 9.08 26.4 9.83 124.7 08/03/20002 11.04 25.7 10.23 128 08/03/20002 13.02 25.4 10.04 125 08/03/20002 15.08 24.9 9.05 111.6 08/03/20002 17.06 24.4 8.46 103.2 08/03/20002 19.06 23.6 8.72 104.9 08/03/20002 21.07 22.1 7.37 86.1 08/03/20002 23.04 19.9 0.62 7 08/03/20002 25.29 18.1 0.09 0.9 08/03/20002 26.88 16.7 0.04 0.5 08/03/20003 1.02 26.6 9.25 117.6 08/03/20003 3.01 26.6 9.28 117.9 08/03/20003 5.38 26.5 9.23 117.1 08/03/20003 7.07 26.4 9.23 117.1 08/03/20003 9.06 26.4 9.16 116.1 08/03/20003 11.08 26.4 9.05 114.6 08/03/20003 13.25 25.7 8.66 108.4 08/03/20003 15 25.1 7.83 97
Page 54
FINAL
Piney Run Reservoir WQA of Eutrophication Document version: September 27, 2004
A39
08/03/20003 17.03 24.1 8.3 100.7 08/03/20003 19.12 23.5 9.25 111.1 08/03/20003 21.1 22.2 9.38 110.1 08/03/20003 23.07 20.4 1.4 15.8 08/03/20003 25.06 18.6 0.18 2 08/03/20003 27.16 16.3 1.11 11.6 08/03/20003 29.01 15.1 0.04 0.4 08/03/20003 31 14.4 0.02 0.2 08/03/20003 33.1 14.1 0 0 08/03/20003 35.17 13.8 0.01 0.1 08/03/20003 37.14 13.4 0 0 08/03/20003 39.03 12.9 0 0 08/03/20003 41.03 12.7 0 0 08/17/20001 1 25.4 10.63 132 08/17/20001 3 25.1 11.39 140.8 08/17/20001 5 24.8 12.56 154.5 08/17/20001 7 24.7 11.08 135.8 08/17/20001 9 22.2 4.51 52.9 08/17/20002 1 26.2 8.54 107.7 08/17/20002 3 26.0 8.72 109.6 08/17/20002 5 25.8 8.74 109.6 08/17/20002 7 25.7 8.88 111 08/17/20002 9 25.6 8.95 111.6 08/17/20002 11 25.6 9.05 112.7 08/17/20002 13 25.4 9.36 116.4 08/17/20002 15 25.4 9.38 116.4 08/17/20002 17 25.3 9.19 114.1 08/17/20002 19 25.0 8.86 109.3 08/17/20002 21 23.6 7.17 86.5 08/17/20002 23 21.8 3.01 34.9 08/17/20002 25 20.3 1.53 17.3 08/17/20002 27 17.3 0.16 1.7 08/17/20003 1 27.0 8.96 114.6 08/17/20003 3 26.8 8.64 110.2 08/17/20003 5 26.7 8.59 109.4 08/17/20003 7 26.7 8.64 110 08/17/20003 9 26.5 8.76 111 08/17/20003 11 25.8 8.89 111.4 08/17/20003 13 25.7 8.89 111.2 08/17/20003 15 25.7 8.79 109.8 08/17/20003 17 25.6 8.76 109.3 08/17/20003 19 25.1 9.41 116.3 08/17/20003 21 22.9 9.56 113.5 08/17/20003 23 21.3 3.56 41 08/17/20003 25 19.3 1.94 21.6 08/17/20003 27 17.7 0.28 3 08/17/20003 29 16.5 0.03 0.3
Page 55
FINAL
Piney Run Reservoir WQA of Eutrophication Document version: September 27, 2004
A40
08/17/20003 31 15.5 0.01 0.1 08/17/20003 33 14.2 0.01 0.1 08/17/20003 35 13.7 0.02 0.2 08/17/20003 37 13.5 0.02 0.2 08/17/20003 39 13.3 0 0 09/07/20001 1 23.4 10.29 121.4 09/07/20001 3 23.3 10.53 124.1 09/07/20001 5 22.4 11.25 130.4 09/07/20001 7 22.3 11.41 132.1 09/07/20001 9 20.7 1.55 17.4 09/07/20002 1 24.0 8.2 97.9 09/07/20002 3 24.0 7.94 94.8 09/07/20002 5 24.0 7.91 94.4 09/07/20002 7 24.0 7.91 94.4 09/07/20002 9 23.9 7.95 94.9 09/07/20002 11 23.9 8.01 95.5 09/07/20002 13 23.9 8.01 95.4 09/07/20002 15 23.9 8.01 95.4 09/07/20002 17 23.9 7.93 94.5 09/07/20002 19 23.6 4.73 56 09/07/20002 21 23.1 1.33 15.6 09/07/20002 23 22.4 0.86 10 09/07/20002 25 21.4 0.04 0.4 09/07/20002 27 19.1 0.02 0.3 09/07/20003 1 24.6 7.8 94 09/07/20003 3 24.2 7.88 94.4 09/07/20003 5 24.1 7.83 93.6 09/07/20003 7 24.0 7.91 94.5 09/07/20003 9 24.0 7.75 92.6 09/07/20003 11 23.9 7.72 92 09/07/20003 13 23.9 7.92 94.4 09/07/20003 15 23.9 7.97 94.9 09/07/20003 17 23.8 7.81 93 09/07/20003 19 23.8 7.44 88.4 09/07/20003 21 22.9 2.91 33.7 09/07/20003 23 22.0 1.02 11.8 09/07/20003 25 21.2 0.39 4.5 09/07/20003 27 19.7 2.14 23.5 09/07/20003 29 18.0 0.61 6.5 09/07/20003 31 16.3 0.03 0.5 09/07/20003 33 15.1 0 0 09/07/20003 35 14.6 0 0.1 09/07/20003 37 14.2 0 0 09/07/20003 39 13.8 0 0 09/07/20003 41 13.6 0 0 09/07/20003 43 13.2 0 0 09/20/20001 1 22.8 7.91 94.1
Page 56
FINAL
Piney Run Reservoir WQA of Eutrophication Document version: September 27, 2004
A41
09/20/20001 3 22.0 8.75 102.6 09/20/20001 5 19.4 10.17 113.4 09/20/20001 7 18.6 10.65 116.7 09/20/20001 9 17.2 6.73 71.5 09/20/20002 1 22.7 7.62 90.4 09/20/20002 3 22.2 7.69 90.4 09/20/20002 5 21.9 7.67 89.8 09/20/20002 7 21.9 7.67 89.7 09/20/20002 9 21.9 7.72 90.3 09/20/20002 11 21.8 7.69 89.9 09/20/20002 13 21.8 7.63 89.1 09/20/20002 15 21.8 7.47 87.4 09/20/20002 17 21.8 7.47 87.2 09/20/20002 19 21.8 7.29 85.1 09/20/20002 21 21.7 7.17 83.6 09/20/20002 23 21.5 6.66 77.3 09/20/20002 25 21.1 6.72 77.3 09/20/20002 27 20.0 1.23 13.9 09/20/20002 29 18.6 0.15 1.6 09/20/20003 1 22.5 7.8 92.3 09/20/20003 3 22.2 7.9 93 09/20/20003 5 22.1 7.81 91.6 09/20/20003 7 21.9 7.91 92.7 09/20/20003 9 21.9 7.98 93.3 09/20/20003 11 21.8 8 93.5 09/20/20003 13 21.8 7.99 93.2 09/20/20003 15 21.8 7.87 91.8 09/20/20003 17 21.7 7.72 90 09/20/20003 20 21.7 7.62 88.9 09/20/20003 21 21.7 7.52 87.7 09/20/20003 23 21.6 7.35 85.5 09/20/20003 25 21.1 5.83 67.1 09/20/20003 27 19.8 1.3 14.5 09/20/20003 29 18.4 1.26 13.8 09/20/20003 31 16.4 0.04 0.5 09/20/20003 33 15.8 0.02 0.2 09/20/20003 35 15.2 0 0 09/20/20003 37 14.4 0 0 09/20/20003 39 13.8 0 0 09/20/20003 41 13.4 0 0 09/20/20003 43 13.4 0 0 09/20/20003 45 13.3 0 0 10/04/20001 1 19.6 10.51 117.2 10/04/20001 3 19.5 10.92 121.8 10/04/20001 5 19.4 10.57 117.7 10/04/20001 7 17.7 10.16 109.3 10/04/20001 9 15.5 3.7 38
Page 57
FINAL
Piney Run Reservoir WQA of Eutrophication Document version: September 27, 2004
A42
10/04/20002 1 20.4 68.7 9.37 10/04/20002 3 20.2 68.3 9.48 10/04/20002 5 20.2 68.3 9.52 10/04/20002 7 20.1 68.1 9.49 10/04/20002 9 19.8 67.6 9.42 10/04/20002 11 19.5 67.1 9.2 10/04/20002 13 19.3 66.8 8.59 10/04/20002 15 19.2 66.6 7.88 10/04/20002 17 19.1 66.3 7.4 10/04/20002 19 19.1 66.3 7.16 10/04/20002 21 18.9 66 6.6 10/04/20002 23 18.5 65.3 5.11 10/04/20002 25 18.2 64.7 5.2 10/04/20002 27 17.8 64 3.56 10/04/20003 1 20.7 9.26 105.6 10/04/20003 3 20.4 9.25 105.1 10/04/20003 5 20.4 9.06 102.7 10/04/20003 7 19.9 9.51 106.8 10/04/20003 9 19.6 9.21 102.8 10/04/20003 11 19.4 8.67 96.3 10/04/20003 13 19.3 8.19 90.8 10/04/20003 15 19.2 7.97 88.3 10/04/20003 17 19.1 7.6 84 10/04/20003 19 19.0 7.12 78.6 10/04/20003 21 18.9 6.51 71.6 10/04/20003 23 18.8 6.02 66.1 10/04/20003 25 18.6 5.06 55.4 10/04/20003 27 18.4 4.04 44.1 10/04/20003 29 18.0 2.53 27.4 10/04/20003 31 17.3 0.38 4.1 10/04/20003 33 16.2 0.09 0.9 10/04/20003 35 15.3 0.04 0.4 10/04/20003 37 15.2 0.03 0.3 10/04/20003 39 14.6 0.03 0.3 10/04/20003 41 13.9 0 0.2 10/04/20003 43 13.8 0 0 10/04/20003 45 13.6 0 0 10/04/20003 47 12.4 0.01 0 10/18/20001 1 16.4 9.11 94.3 10/18/20001 3 16.2 9.54 98.3 10/18/20001 5 16.1 9.78 100.5 10/18/20001 7 14.9 10.78 108.1 10/18/20001 9 13.7 7.29 71.1 10/18/20002 1 16.8 8.77 91.5 10/18/20002 3 16.8 8.77 91.5 10/18/20002 5 16.8 8.73 91.1 10/18/20002 7 16.8 8.73 91.1
Page 58
FINAL
Piney Run Reservoir WQA of Eutrophication Document version: September 27, 2004
A43
10/18/20002 9 16.8 8.58 89.3 10/18/20002 11 16.8 8.48 88.4 10/18/20002 13 16.7 8.44 87.9 10/18/20002 15 16.7 8.39 87.2 10/18/20002 17 16.7 8.19 85.2 10/18/20002 19 16.7 8.06 83.8 10/18/20002 21 16.6 7.46 77.4 10/18/20002 23 16.4 7.07 73.2 10/18/20002 25 16.3 6.7 69.1 10/18/20002 27 16.2 6.21 63.9 10/18/20002 29 15.9 4.89 50.1 10/18/20003 1 16.6 7.3 76 10/18/20003 3 16.6 7.21 74.8 10/18/20003 5 16.6 7.2 74.7 10/18/20003 7 16.6 7.12 74 10/18/20003 9 16.6 7.11 73.8 10/18/20003 11 16.5 7.11 73.7 10/18/20003 13 16.5 7.06 73.3 10/18/20003 15 16.5 6.95 72 10/18/20003 17 16.4 6.35 65.7 10/18/20003 19 16.4 6.48 67 10/18/20003 21 16.3 6.37 65.8 10/18/20003 23 16.2 6.24 64.3 10/18/20003 25 16.1 6.12 63 10/18/20003 27 16.1 6 61.6 10/18/20003 29 16.0 5.88 60.4 10/18/20003 31 15.9 5.65 57.9 10/18/20003 33 15.8 5 51.2 10/18/20003 35 15.7 3.51 35.7 10/18/20003 37 15.6 1.72 17.4 10/18/20003 39 15.4 0.42 4.2 10/18/20003 41 14.7 0.13 1.3 10/18/20003 43 14.3 0.07 0.7 10/18/20003 45 13.9 0.04 0.3 11/03/20001 1 12.8 10.51 101.2 11/03/20001 3 12.4 10.97 104.7 11/03/20001 5 11.7 11.48 107.6 11/03/20001 7 11.5 11.68 109.1 11/03/20002 1 14.6 8.83 88.3 11/03/20002 3 14.1 8.91 88.3 11/03/20002 5 14.0 8.87 87.5 11/03/20002 7 14.0 8.83 87.2 11/03/20002 9 13.9 8.81 86.9 11/03/20002 11 13.9 8.63 85.1 11/03/20002 13 13.9 8.58 84.5 11/03/20002 15 13.9 8.57 84.4 11/03/20002 17 13.8 8.56 84.1
Page 59
FINAL
Piney Run Reservoir WQA of Eutrophication Document version: September 27, 2004
A44
11/03/20002 19 13.7 8.41 82.4 11/03/20002 21 13.7 8.44 82.7 11/03/20002 23 13.6 8.83 86.6 11/03/20002 25 13.4 8.72 85 11/03/20002 27 13.3 8.61 83.8 11/03/20003 1 15.0 8.83 89 11/03/20003 3 14.6 8.82 88.1 11/03/20003 5 14.3 9.03 89.8 11/03/20003 7 14.2 9.11 90.4 11/03/20003 9 14.1 9.09 90 11/03/20003 11 14.1 9.04 89.3 11/03/20003 13 14.1 8.96 88.4 11/03/20003 15 14.1 8.94 88.4 11/03/20003 17 14.1 8.77 86.7 11/03/20003 19 14.1 8.71 86.1 11/03/20003 21 14.1 8.64 85.2 11/03/20003 23 14.0 8.48 83.7 11/03/20003 25 13.9 8.23 81.1 11/03/20003 28 13.8 7.97 78.4 11/03/20003 29 13.8 7.76 76.3 11/03/20003 31 13.7 8.06 79 11/03/20003 33 13.7 8.18 80.1 11/03/20003 35 13.6 8.13 79.6 11/03/20003 39 13.6 8.14 79.7 11/03/20003 41 13.6 8.26 80.8 11/03/20003 43 13.6 8.31 81.2 11/03/20003 45 13.6 8.27 80.9 11/17/20003 1 11.5 9.3 86.8 11/17/20003 2.92 11.4 9.1 84.8 11/17/20003 4.93 11.4 9.04 84.2 11/17/20003 7.14 11.4 9 83.8 11/17/20003 8.69 11.4 8.97 83.6 11/17/20003 11.23 11.4 9 83.9 11/17/20003 12.99 11.4 8.96 83.5 11/17/20003 15.12 11.4 8.88 82.8 12/15/20003 1.04 4.3 10.87 83.9 12/15/20003 3.02 4.3 10.76 82.8 12/15/20003 5.01 4.3 10.72 82.5 12/15/20003 6.98 4.3 10.64 81.9 12/15/20003 9.04 4.2 10.61 81.5 12/15/20003 10.98 4.2 10.59 81.4 12/15/20003 12.98 4.2 10.53 80.9 12/15/20003 14.98 4.2 10.52 80.9 02/20/20013 1 4.2 11.83 92 02/20/20013 3 4.1 11.81 91.6 02/20/20013 5 4.1 11.87 92 02/20/20013 7 4.0 11.75 91
Page 60
FINAL
Piney Run Reservoir WQA of Eutrophication Document version: September 27, 2004
A45
02/20/20013 9 3.9 11.71 90.4 02/20/20013 11 3.9 11.7 90.5 02/20/20013 13 3.9 11.62 89.8 02/20/20013 15 3.9 11.65 90 02/20/20013 17 3.9 11.64 89.8 02/20/20013 19 3.9 11.61 89.6 03/14/20013 1 5.8 11.35 93.4 03/14/20013 3 5.7 11.42 93.8 03/14/20013 5 5.7 11.57 95 03/14/20013 7 5.7 11.49 94.2 03/14/20013 9 5.7 11.5 94.4 03/14/20013 11 5.7 11.55 94.7 03/14/20013 13 5.7 11.48 94.2 03/14/20013 15 5.7 11.44 93.8 03/14/20013 17 5.7 11.48 94.1 03/14/20013 19 5.7 11.45 93.9 04/30/20011 1 16.4 9.38 96.5 04/30/20011 3 15.9 9.52 97 04/30/20011 5 15.5 9.58 96.7 04/30/20011 7 15.3 9.7 97.5 04/30/20011 9 15.2 9.63 96.2 04/30/20011 11 14.6 10.11 100 04/30/20012 1 16.4 8.94 91.9 04/30/20012 3 16.0 9.15 93.2 04/30/20012 5 15.8 9.23 93.7 04/30/20012 7 15.5 9.37 94.5 04/30/20012 9 15.3 9.44 94.9 04/30/20012 11 15.0 9.47 94.5 04/30/20012 13 14.9 9.49 94.5 04/30/20012 15 14.7 9.61 95.2 04/30/20012 17 14.0 9.29 90.6 04/30/20012 19 12.4 8.92 84.1 04/30/20012 21 11.8 8.75 81.4 04/30/20012 23 11.4 8.53 78.5 04/30/20012 25 11.1 8.22 75.1 04/30/20012 27 10.8 7.68 69.6 04/30/20013 1 16.4 8.95 92.1 04/30/20013 3 16.0 9.21 93.8 04/30/20013 5 15.7 9.43 95.5 04/30/20013 7 15.7 9.54 96.6 04/30/20013 9 15.6 9.65 97.5 04/30/20013 11 15.2 9.73 97.5 04/30/20013 13 15.0 9.71 96.8 04/30/20013 15 14.6 9.61 95.1 04/30/20013 17 14.1 9.6 93.8 04/30/20013 19 12.1 8.95 83.8 04/30/20013 21 11.4 8.78 80.9
Page 61
FINAL
Piney Run Reservoir WQA of Eutrophication Document version: September 27, 2004
A46
04/30/20013 23 11.1 8.6 78.7 04/30/20013 25 10.9 8.72 79.4 04/30/20013 28 10.7 8.69 78.5 04/30/20013 29 10.4 8.59 77.4 04/30/20013 31 10.2 8.36 74.9 04/30/20013 33 10.0 8.16 72.6 04/30/20013 35 9.8 7.96 70.7 04/30/20013 36 9.7 7.9 70 04/30/20013 37 8.9 6.85 59.6 04/30/20013 39 8.2 5.75 49.2 04/30/20013 39 8.2 5.55 47.5 04/30/20013 41 7.8 4.97 42.1 04/30/20013 43 7.8 4.8 40.6 05/15/20011 0.96 19.1 9.38 103.4 05/15/20011 2.97 18.9 9.47 103.9 05/15/20011 4.97 18.8 9.5 104.1 05/15/20011 6.98 18.5 9.51 103.5 05/15/20011 9.01 18.0 9.12 98.4 05/15/20011 9 18.1 9.17 98.8 05/15/20011 9 18.1 9.24 99.7 05/15/20011 1.01 19.7 9.39 104.6 05/15/20012 1 19.7 9.45 105.3 05/15/20012 3.07 19.7 9.58 106.7 05/15/20012 5.01 19.6 9.64 107.2 05/15/20012 7.03 19.5 9.74 108.2 05/15/20012 9.02 19.4 9.83 109 05/15/20012 11.04 19.3 9.87 109.2 05/15/20012 12.95 18.9 9.7 106.4 05/15/20012 15.05 18.1 9.41 101.6 05/15/20012 17.04 15.5 9.38 95.8 05/15/20012 19.07 14.2 8.73 86.7 05/15/20012 21.03 12.4 7.47 71.4 05/15/20012 23.04 11.8 6.84 64.5 05/15/20012 25.03 11.4 6.25 58.4 05/15/20012 26.98 11.1 5.65 52.4 05/15/20012 28.96 10.6 5.26 48.2 05/15/20013 0.97 20.2 9.36 105.4 05/15/20013 3.02 20.2 9.56 107.7 05/15/20013 4.98 20.2 9.75 109.8 05/15/20013 6.98 20.2 9.89 111.4 05/15/20013 8.95 20.1 9.9 111.3 05/15/20013 11.08 20.1 10.01 112.5 05/15/20013 14.96 18.4 9.99 108.5 05/15/20013 17.05 16.7 9.78 102.4 05/15/20013 18.99 15.1 9.51 96.2 05/15/20013 20.97 13.3 8.96 87.4 05/15/20013 22.85 12.3 8.53 81.3
Page 62
FINAL
Piney Run Reservoir WQA of Eutrophication Document version: September 27, 2004
A47
05/15/20013 25.27 11.7 8.06 75.7 05/15/20013 26.92 11.2 7.62 70.8 05/15/20013 29.01 10.7 6.95 63.8 05/15/20013 31.03 10.3 6.24 56.7 05/15/20013 33.05 10.1 6.06 54.9 05/15/20013 35.02 9.8 5.32 47.8 05/15/20013 37.05 9.6 4.83 43.2 05/15/20013 39.06 9.2 4.19 37.1 05/31/20011 1.02 19.2 8.03 88.6 05/31/20011 3.04 19.2 7.82 86.2 05/31/20011 5.05 19.2 7.79 86 05/31/20011 7.09 18.7 7.6 83.1 05/31/20011 9.05 18.1 7.47 80.7 05/31/20011 10.97 17.6 7.13 76.1 05/31/20012 1.01 19.6 7.89 87.7 05/31/20012 3 19.6 7.92 88.1 05/31/20012 5.02 19.6 7.91 87.9 05/31/20012 7.03 19.7 7.9 88 05/31/20012 10.83 19.6 7.89 87.9 05/31/20012 10.94 19.7 7.87 87.6 05/31/20012 13.06 19.6 7.85 87.3 05/31/20012 14.93 19.3 7.63 84.3 05/31/20012 16.88 19.1 7.39 81.3 05/31/20012 18.97 15.9 6.14 63.4 05/31/20012 21.04 14.4 6 59.8 05/31/20012 23.07 12.7 4.62 44.3 05/31/20012 25.05 12.0 3.78 35.8 05/31/20012 27 11.9 3.44 32.5 05/31/20012 28.87 11.2 2.83 26.3 05/31/20013 1 19.8 7.96 89 05/31/20013 2.97 19.9 8.14 91.1 05/31/20013 5 19.9 8.18 91.5 05/31/20013 6.96 19.9 8.19 91.6 05/31/20013 9 19.9 8.2 91.7 05/31/20013 11 19.9 8.19 91.5 05/31/20013 12.98 19.9 8.18 91.5 05/31/20013 15.07 19.9 8.04 90 05/31/20013 16.96 19.9 8.03 89.8 05/31/20013 19.02 19.6 7.72 85.9 05/31/20013 20.89 15.4 6.6 67.4 05/31/20013 23.1 13.6 6.3 61.8 05/31/20013 25.04 11.9 5.64 53.3 05/31/20013 27.03 11.4 5.09 47.4 05/31/20013 28.92 11.0 4.58 42.3 05/31/20013 30.96 10.7 3.96 36.3 05/31/20013 32.96 10.5 3.47 31.7 05/31/20013 34.99 10.1 3 27.2
Page 63
FINAL
Piney Run Reservoir WQA of Eutrophication Document version: September 27, 2004
A48
05/31/20013 36.93 9.9 2.62 23.6 05/31/20013 38.99 9.6 1.72 15.4 05/31/20013 40.98 9.2 0.73 6.5 06/12/20011 1.07 24.5 8.13 100 06/12/20011 3.1 24.3 8.08 99.1 06/12/20011 4.97 24.1 8.09 98.7 06/12/20011 7.04 23.9 7.86 95.6 06/12/20011 9.04 23.1 6.98 83.6 06/12/20012 1.17 24.6 8.1 99.9 06/12/20012 2.99 24.3 8.2 100.4 06/12/20012 5.04 24.2 8.23 100.6 06/12/20012 7.04 23.9 8.25 100.3 06/12/20012 9.05 23.1 8.23 98.7 06/12/20012 11.02 21.8 8.03 93.9 06/12/20012 13.05 21.2 7.63 88.1 06/12/20012 15.02 20.5 7.11 81 06/12/20012 17.02 19.7 6.63 74.4 06/12/20012 18.94 18.1 5.62 61.1 06/12/20012 21 15.3 4.4 45.1 06/12/20012 22.99 14.1 3.54 35.3 06/12/20012 24.97 13.1 2.86 27.9 06/12/20012 26.98 12.1 2.19 20.9 06/12/20012 28.97 11.1 1.42 13.3 06/12/20013 1.01 24.6 8.19 100.8 06/12/20013 3.08 24.3 8.27 101.5 06/12/20013 5 24.3 8.34 102.2 06/12/20013 7.01 24.2 8.35 102.2 06/12/20013 8.94 23.9 8.35 101.5 06/12/20013 11 22.6 8.36 99.2 06/12/20013 13.02 20.6 7.78 88.8 06/12/20013 14.98 20.0 7.45 84.1 06/12/20013 17 19.3 6.97 77.5 06/12/20013 18.97 18.4 6.2 67.8 06/12/20013 21.02 17.3 5.7 60.9 06/12/20013 23.01 14.3 4.85 48.6 06/12/20013 25.1 12.4 4.35 41.8 06/12/20013 27.06 11.6 3.65 34.5 06/12/20013 28.95 11.3 3.08 28.8 06/12/20013 30.98 10.9 2.34 21.7 06/12/20013 33.09 10.5 1.87 17.2 06/12/20013 34.99 9.9 0.82 7.5 06/12/20013 36.98 9.5 0.32 2.9 06/12/20013 39.01 9.2 0.24 2.2 06/12/20013 41 9.1 0.18 1.6 06/12/20013 43.03 9.0 0.15 1.4 06/12/20013 45.01 8.8 0.13 1.2 06/26/20011 1.1 25.9 9.04 112.7
Page 64
FINAL
Piney Run Reservoir WQA of Eutrophication Document version: September 27, 2004
A49
06/26/20011 3.06 25.8 9.12 113.3 06/26/20011 5.05 25.6 9.14 113.2 06/26/20011 7.25 25.4 9.47 116.8 06/26/20011 9.01 24.9 9.94 121.6 06/26/20011 10.95 21.3 8.27 94.5 06/26/20012 0.99 26.7 8.66 109.5 06/26/20012 2.96 26.3 8.86 111.1 06/26/20012 4.98 26.1 8.96 111.9 06/26/20012 6.98 25.8 8.98 111.7 06/26/20012 9.02 25.6 9.02 111.7 06/26/20012 10.98 25.0 8.83 108.2 06/26/20012 13.07 24.1 8.59 103.4 06/26/20012 15.08 22.3 6 70 06/26/20012 17.01 20.7 4.56 51.5 06/26/20012 19.03 19.1 3.83 41.8 06/26/20012 21.03 17.3 2.46 25.9 06/26/20012 22.99 15.4 1.6 15.9 06/26/20012 25.05 13.4 0.79 7.7 06/26/20012 27.03 12.4 0.53 5 06/26/20012 28.98 11.7 0.44 4.1 06/26/20013 1.13 27.3 8.58 109.6 06/26/20013 3.02 27.0 8.74 111 06/26/20013 5.02 26.6 8.83 111.3 06/26/20013 7.04 25.9 8.97 111.8 06/26/20013 9.03 25.6 8.93 110.6 06/26/20013 11.06 25.1 8.94 109.8 06/26/20013 13.02 24.3 8.49 102.8 06/26/20013 15.03 22.3 7.16 83.4 06/26/20013 17.02 20.8 6.17 69.7 06/26/20013 18.99 19.1 5.13 56.1 06/26/20013 21.12 17.4 4.14 43.8 06/26/20013 23.02 14.9 3.23 32.3 06/26/20013 24.96 13.6 2.7 26.3 06/26/20013 27.04 13.0 2.48 23.8 06/26/20013 28.99 12.3 2.21 20.9 06/26/20013 30.84 11.7 1.79 16.7 06/26/20013 32.98 10.8 0.64 5.8 06/26/20013 34.97 9.9 0.31 2.8 06/26/20013 36.99 9.7 0.21 1.9 06/26/20013 39.06 9.6 0.16 1.5 06/26/20013 41.02 9.4 0.14 1.2 06/26/20013 43 9.3 0.12 1.1 06/26/20013 44.56 9.2 0.09 0.8 06/26/20013 46.92 9.1 0.09 0.8 07/11/20011 1.04 27.3 9.67 125.5 07/11/20011 3.24 27.1 10.09 130.5 07/11/20011 5 26.9 10.31 133
Page 65
FINAL
Piney Run Reservoir WQA of Eutrophication Document version: September 27, 2004
A50
07/11/20011 7 26.9 10.49 135.1 07/11/20011 9 26.5 10.77 137.7 07/11/20012 1.02 27.3 9.34 121.3 07/11/20012 2.97 27.3 9.4 122 07/11/20012 5.01 27.3 9.46 122.8 07/11/20012 7.27 27.3 9.56 124.1 07/11/20012 9.85 27.2 9.8 126.9 07/11/20012 10.9 26.6 10.07 129 07/11/20012 12.98 26.0 9.71 123.2 07/11/20012 14.97 24.7 9.03 111.7 07/11/20012 17.03 23.0 6.99 83.8 07/11/20012 18.95 20.9 2.4 27.6 07/11/20012 20.98 17.6 1.02 11 07/11/20012 22.92 16.0 0.73 7.6 07/11/20012 24.88 14.1 0.48 4.8 07/11/20012 27.15 12.4 0.31 3 07/11/20012 29.1 11.8 0.25 2.3 07/11/20013 1 27.7 9.2 120.2 07/11/20013 3 27.7 9.35 122 07/11/20013 5 27.6 9.45 123.3 07/11/20013 7 27.6 9.6 125.2 07/11/20013 9 27.6 9.74 127 07/11/20013 11 27.6 9.81 127.8 07/11/20013 13 27.6 9.86 128.4 07/11/20013 15 26.3 9.69 123.4 07/11/20013 17 22.9 7.13 85.3 07/11/20013 19 20.2 2.96 33.5 07/11/20013 21 18.3 0.69 7.5 07/11/20013 23 15.4 0.45 4.6 07/11/20013 25 14.0 0.4 4 07/11/20013 26 13.3 0.38 3.6 07/11/20013 27 13.0 0.35 3.4 07/11/20013 29 11.9 0.2 1.9 07/11/20013 31 11.2 0.14 1.3 07/11/20013 33 10.6 0.11 1 07/11/20013 35 10.3 0.1 0.9 07/11/20013 37 10.2 0.1 0.9 07/11/20013 39 9.9 0.1 0.9 07/11/20013 41 9.8 0.09 0.8 07/24/20011 1.2 29.4 9.52 127.4 07/24/20011 3.02 28.6 9.22 121.8 07/24/20011 4.99 28.4 9.71 127.8 07/24/20011 6.98 28.2 10.73 140.5 07/24/20011 8.91 26.8 11.36 145.1 07/24/20012 0.94 28.4 8.6 113 07/24/20012 3.06 28.3 8.85 116.1 07/24/20012 4.97 27.8 9.08 118.1
Page 66
FINAL
Piney Run Reservoir WQA of Eutrophication Document version: September 27, 2004
A51
07/24/20012 7.06 27.4 9.35 120.7 07/24/20012 9.02 27.1 9.36 120.3 07/24/20012 11.08 26.8 9.09 116.2 07/24/20012 13.04 26.4 8.89 112.8 07/24/20012 15.04 25.9 8.47 106.6 07/24/20012 17.25 24.7 7.98 98 07/24/20012 19.11 21.1 2.25 25.8 07/24/20012 21.02 18.3 1.27 13.8 07/24/20012 23.11 15.7 0.94 9.7 07/24/20012 25.01 14.3 0.56 5.6 07/24/20012 27.1 13.6 0.45 4.4 07/24/20012 28.96 12.8 0.37 3.6 07/24/20013 0.96 27.3 8.93 115.1 07/24/20013 3.03 27.2 9.2 118.4 07/24/20013 5.04 27.2 9.3 119.6 07/24/20013 7.01 27.0 9.42 120.8 07/24/20013 9.06 26.9 9.54 122.1 07/24/20013 11.01 26.8 9.55 122.1 07/24/20013 12.99 26.6 8.77 111.5 07/24/20013 14.97 25.1 6.74 83.5 07/24/20013 17.01 23.2 3.4 40.6 07/24/20013 18.97 21.1 1.47 16.9 07/24/20013 21.02 19.6 1.04 11.7 07/24/20013 23.1 17.8 0.74 7.9 07/24/20013 25.11 14.5 0.6 6 07/24/20013 27 13.1 0.48 4.7 07/24/20013 29.02 12.1 0.42 4 07/24/20013 31 11.4 0.27 2.5 07/24/20013 33.02 10.8 0.23 2.1 07/24/20013 35.07 10.4 0.19 1.7 07/24/20013 37.09 10.1 0.18 1.6 07/24/20013 39.01 9.7 0.16 1.4 07/24/20013 41.11 9.4 0.14 1.3 07/24/20013 42.97 9.3 0.11 1 07/24/20013 44.95 9.2 0.1 0.9 07/24/20013 47.09 9.1 0.09 0.8 08/06/20011 1.05 28.3 9.26 120.7 08/06/20011 3.05 28.1 8.95 116.1 08/06/20011 6.69 27.6 10.52 135.4 08/06/20011 7.04 27.3 10.23 131 08/06/20011 8.98 23.1 6.39 75.7 08/06/20011 10.97 21.3 1.7 19.5 08/06/20012 1.03 28.6 8.01 104.8 08/06/20012 2.99 28.0 8.11 105.1 08/06/20012 5.06 27.5 8.65 111.1 08/06/20012 6.99 27.1 8.7 111.1 08/06/20012 9.05 26.8 9.09 115.4
Page 67
FINAL
Piney Run Reservoir WQA of Eutrophication Document version: September 27, 2004
A52
08/06/20012 11.06 26.4 8.49 107 08/06/20012 12.97 25.9 7.9 98.6 08/06/20012 15.54 25.3 6.58 81.2 08/06/20012 17 24.2 5.89 71.2 08/06/20012 20.03 22.7 2.49 29.2 08/06/20012 22.9 19.4 1.19 13.1 08/06/20012 22.98 16.6 1.02 10.6 08/06/20012 24.96 14.8 0.44 4.4 08/06/20012 28.26 13.8 0.31 3 08/06/20013 0.92 27.9 8.22 106.3 08/06/20013 3.02 27.8 8.26 106.7 08/06/20013 5.03 27.7 8.25 106.3 08/06/20013 7.05 27.0 8.59 109.3 08/06/20013 9.05 26.6 7.73 97.7 08/06/20013 10.98 26.2 8.1 101.7 08/06/20013 13.05 25.7 7.3 90.8 08/06/20013 14.96 25.1 5.97 73.5 08/06/20013 16.97 24.1 4.54 54.8 08/06/20013 18.98 21.8 1.07 12.4 08/06/20013 21.01 19.0 0.64 7 08/06/20013 23.04 16.5 0.47 4.9 08/06/20013 24.98 14.5 0.56 5.5 08/06/20013 27.71 13.1 1.24 12 08/06/20013 29.63 12.1 0.24 2.3 08/06/20013 31.04 11.3 0.17 1.6 08/06/20013 33.01 10.8 0.13 1.2 08/06/20013 34.97 10.4 0.09 0.8 08/06/20013 37.32 10.1 0.08 0.8 08/06/20013 38.96 9.6 0.07 0.6 08/06/20013 40.96 9.4 0.06 0.5 09/07/20011 1.01 26.6 9.27 118 09/07/20011 3.12 26.4 10.21 129.4 09/07/20011 5.02 25.8 11.6 145.6 09/07/20011 7.04 23.7 7.32 88.3 09/07/20011 8.96 22.8 4.27 50.8 09/07/20012 0.95 25.7 7.74 97.1 09/07/20012 3.06 25.7 7.73 96.9 09/07/20012 5.02 25.7 7.75 97.1 09/07/20012 7.02 25.6 7.8 97.5 09/07/20012 10.57 25.4 7.77 96.7 09/07/20012 11.24 25.3 7.7 95.8 09/07/20012 12.99 25.3 7.6 94.5 09/07/20012 14.99 25.1 7.02 86.8 09/07/20012 18.42 24.8 6.12 74.8 09/07/20012 19.12 23.8 2.84 34.4 09/07/20012 21.02 22.4 0.82 9.6 09/07/20012 23.03 17.8 1.42 15.3
Page 68
FINAL
Piney Run Reservoir WQA of Eutrophication Document version: September 27, 2004
A53
09/07/20012 25.1 15.6 0.49 5 09/07/20012 27.02 14.3 0.31 3.1 09/07/20013 1.18 25.2 7.69 95.5 09/07/20013 3.06 25.2 7.72 95.8 09/07/20013 4.99 25.2 7.76 96.3 09/07/20013 7 25.1 7.76 96.2 09/07/20013 9.06 25.1 7.77 96.3 09/07/20013 10.98 25.1 7.79 96.5 09/07/20013 13.04 25.1 7.73 95.8 09/07/20013 15.04 25.1 7.77 96.3 09/07/20013 17 25.1 7.73 95.7 09/07/20013 18.94 24.1 4.42 53.7 09/07/20013 20.94 20.9 1.41 16.1 09/07/20013 23.02 18.4 0.77 8.4 09/07/20013 24.99 15.8 0.52 5.3 09/07/20013 26.99 14.1 0.46 4.6 09/07/20013 29.03 12.9 0.32 3.1 09/07/20013 31.07 11.7 0.17 1.6 09/07/20013 32.99 10.9 0.13 1.2 09/07/20013 34.98 10.3 0.11 1 09/07/20013 36.98 10.1 0.09 0.8 09/07/20013 38.97 9.9 0.08 0.7 09/07/20013 40.98 9.7 0.06 0.5 09/07/20013 43.02 9.4 0.05 0.4 09/07/20013 44.96 9.3 0.04 0.4 09/19/20011 1.04 23.3 9.81 117.3 09/19/20011 3.06 23.3 9.89 118.4 09/19/20011 5.02 23.2 10.59 126.4 09/19/20011 6.99 22.9 10.45 124.2 09/19/20011 8.95 20.4 7.39 83.6 09/19/20012 0.97 22.9 8.23 97.7 09/19/20012 3.02 22.9 8.19 97.2 09/19/20012 4.97 22.9 8.19 97.3 09/19/20012 6.95 22.8 8.17 96.8 09/19/20012 8.85 22.8 8.15 96.7 09/19/20012 8.87 22.8 8.16 96.8 09/19/20012 10.96 22.7 8 94.7 09/19/20012 13.13 22.7 7.78 91.9 09/19/20012 15.07 22.6 7.69 90.9 09/19/20012 17.03 22.4 7.13 83.9 09/19/20012 18.99 22.3 6.81 80 09/19/20012 21.01 22.0 5.87 68.6 09/19/20012 23.28 20.3 1.08 12.2 09/19/20012 25.07 17.4 0.73 7.7 09/19/20012 26.89 15.4 0.49 5 09/19/20013 1.07 22.6 7.67 90.5 09/19/20013 2.97 22.6 7.62 90
Page 69
FINAL
Piney Run Reservoir WQA of Eutrophication Document version: September 27, 2004
A54
09/19/20013 5.05 22.6 7.59 89.6 09/19/20013 7 22.6 7.58 89.4 09/19/20013 9.01 22.6 7.57 89.3 09/19/20013 11.09 22.6 7.55 89.1 09/19/20013 13.11 22.6 7.55 89 09/19/20013 15.06 22.6 7.57 89.3 09/19/20013 17.05 22.5 7.57 89.3 09/19/20013 19.1 22.5 7.59 89.4 09/19/20013 21.01 21.7 5.37 62.3 09/19/20013 23 19.0 1.4 15.4 09/19/20013 25.01 16.1 0.77 7.9 09/19/20013 27.01 14.5 0.46 4.6 09/19/20013 29.04 13.1 0.38 3.7 09/19/20013 31.49 11.9 0.32 3 09/19/20013 33.01 11.1 0.28 2.6 09/19/20013 35.06 10.4 0.21 1.9 09/19/20013 37.03 10.1 0.17 1.5 09/19/20013 38.96 9.9 0.15 1.4 09/19/20013 41 9.7 0.14 1.3 09/19/20013 43 9.5 0.13 1.2 10/02/20011 1.02 18.8 8.08 89 10/02/20011 1 18.6 9.32 102.2 10/02/20011 3.05 18.3 9.72 105.8 10/02/20011 5.06 17.9 9.86 106.6 10/02/20011 7.03 17.0 10.75 114 10/02/20011 9.06 16.8 9.84 103.9 10/02/20011 11.17 16.4 9.38 98.3 10/02/20011 11.02 16.1 5.13 53.4 10/02/20011 13.03 15.8 7.06 73.1 10/02/20012 1.03 18.8 8.06 88.7 10/02/20012 2.99 18.8 8.04 88.5 10/02/20012 5.01 18.8 8.05 88.6 10/02/20012 7.06 18.8 8.02 88.2 10/02/20012 8.99 18.8 8.02 88.2 10/02/20012 11.15 18.7 8.04 88.3 10/02/20012 13.05 18.7 8.02 88.2 10/02/20012 16.42 18.7 8.02 88.2 10/02/20012 16.95 18.7 8.03 88.2 10/02/20012 18.99 18.7 8.01 88 10/02/20012 21.06 18.7 8.04 88.3 10/02/20012 23.1 18.7 8.03 88.1 10/02/20012 25.02 18.6 7.94 87 10/02/20012 27.05 16.6 2.81 29.6 10/02/20012 28.93 14.8 1.52 15.2 10/02/20013 1.09 18.9 7.86 86.7 10/02/20013 3.03 18.9 7.94 87.5 10/02/20013 4.97 18.8 7.93 87.4
Page 70
FINAL
Piney Run Reservoir WQA of Eutrophication Document version: September 27, 2004
A55
10/02/20013 7.07 18.8 7.89 86.9 10/02/20013 9.06 18.8 7.86 86.6 10/02/20013 11.02 18.8 7.81 86 10/02/20013 12.98 18.8 7.8 85.9 10/02/20013 14.99 18.8 7.77 85.6 10/02/20013 17.03 18.8 7.75 85.3 10/02/20013 19.1 18.8 7.72 85 10/02/20013 21.02 18.8 7.68 84.5 10/02/20013 23.03 18.6 7.33 80.4 10/02/20013 25.01 18.2 6.23 67.8 10/02/20013 27 16.9 1.71 18.1 10/02/20013 29.05 14.0 0.94 9.4 10/02/20013 31.03 12.4 0.64 6.2 10/02/20013 33 11.5 0.5 4.7 10/02/20013 35.03 11.1 0.36 3.4 10/02/20013 36.98 10.8 0.31 2.9 10/02/20013 39.01 10.4 0.27 2.5 10/02/20013 40.88 9.8 0.24 2.2 10/02/20013 43.02 9.6 0.23 2 10/02/20013 44.99 9.5 0.2 1.8 10/29/20011 1.02 13.3 9.12 89.5 10/29/20011 3.05 12.8 10.3 100 10/29/20011 4.96 12.1 10.7 102.2 10/29/20011 6.99 11.6 8.9 84 10/29/20012 1.08 14.2 8.42 84.3 10/29/20012 2.97 14.2 8.03 80.3 10/29/20012 5.03 14.0 7.96 79.3 10/29/20012 7.03 13.9 8.01 79.7 10/29/20012 9.05 13.9 7.89 78.6 10/29/20012 10.98 13.9 7.81 77.7 10/29/20012 12.99 13.9 7.88 78.3 10/29/20012 14.89 13.8 7.94 78.8 10/29/20012 15 13.8 7.7 76.3 10/29/20012 17.03 13.7 7.76 76.8 10/29/20012 19.01 13.7 7.91 78.2 10/29/20012 21.03 13.6 7.92 78.1 10/29/20012 23.05 13.6 7.92 78.2 10/29/20012 25.05 13.5 7.94 78.3 10/29/20012 27 13.4 7.94 78.1 10/29/20012 27.01 13.4 7.95 78.2 10/29/20012 28.96 13.4 7.87 77.4 10/29/20013 1.08 14.1 8.36 83.4 10/29/20013 2.99 14.1 8.29 82.7 10/29/20013 5 14.1 8.26 82.3 10/29/20013 7 14.0 8.2 81.7 10/29/20013 9.02 14.0 8.22 81.9 10/29/20013 11.02 14.0 8.2 81.7
Page 71
FINAL
Piney Run Reservoir WQA of Eutrophication Document version: September 27, 2004
A56
10/29/20013 13.02 14.0 8.18 81.4 10/29/20013 15.02 14.0 8.15 81.2 10/29/20013 17.09 13.9 8.1 80.7 10/29/20013 19.05 13.9 8.08 80.4 10/29/20013 21.04 13.9 8.05 80.1 10/29/20013 23.04 13.9 8.11 80.7 10/29/20013 25 13.9 8.15 81.1 10/29/20013 27.02 13.9 8.11 80.7 10/29/20013 29.03 13.9 8.1 80.6 10/29/20013 31.57 13.9 8.09 80.4 10/29/20013 33.08 13.8 7.8 77.4 10/29/20013 35.04 13.7 7.43 73.5 10/29/20013 37.1 12.8 3.2 31 10/29/20013 39.02 10.6 1.42 13.1 10/29/20013 41.03 10.2 1 9.1 10/29/20013 43 9.9 0.67 6.1 10/29/20013 44.99 9.7 0.55 5 10/29/20013 46.94 9.7 0.44 4 11/14/20011 1.05 11.1 9.56 89.2 11/14/20011 3.05 10.3 10.02 91.7 11/14/20011 5.05 9.4 9.47 85 11/14/20011 7 8.7 8.99 79.2 11/14/20011 8.99 8.3 8.15 71.1 11/14/20012 1.01 11.7 8.66 82.1 11/14/20012 3.02 11.7 8.52 80.5 11/14/20012 5 11.5 8.47 79.7 11/14/20012 7 11.4 8.43 79.4 11/14/20012 8.94 11.4 8.39 78.9 11/14/20012 10.98 11.4 8.35 78.5 11/14/20012 13.05 11.4 8.32 78.2 11/14/20012 15.05 11.4 8.33 78.2 11/14/20012 17.03 11.4 8.32 78.1 11/14/20012 19.21 11.3 8.32 78 11/14/20012 21.54 11.3 8.3 77.8 11/14/20012 23.02 11.3 8.23 77.2 11/14/20012 25.03 11.3 8.19 76.8 11/14/20012 27.02 11.2 7.77 72.7 11/14/20013 1 11.4 7.85 73.8 11/14/20013 3 11.4 7.81 73.3 11/14/20013 5 11.4 7.79 73.1 11/14/20013 7 11.3 7.73 72.6 11/14/20013 9 11.3 7.71 72.4 11/14/20013 11 11.3 7.69 72.2 11/14/20013 13 11.3 7.67 72 11/14/20013 15 11.3 7.66 71.9 11/14/20013 17 11.3 7.66 71.9 11/14/20013 19 11.3 7.67 71.9
Page 72
FINAL
Piney Run Reservoir WQA of Eutrophication Document version: September 27, 2004
A57
11/14/20013 21 11.3 7.66 71.8 11/14/20013 23 11.3 7.66 71.8 11/14/20013 25 11.3 7.66 71.9 11/14/20013 27 11.3 7.66 71.8 11/14/20013 29 11.3 7.67 72 11/14/20013 31 11.3 7.67 72 11/14/20013 33 11.3 7.68 72 11/14/20013 35 11.3 7.7 72.2 11/14/20013 37 11.3 7.7 72.3 12/06/20013 1 11.26 8.96 83.3 12/06/20013 3 11.23 8.89 82.6 12/06/20013 5 10.91 8.91 82.1 12/06/20013 7 10.86 8.82 81.7 12/06/20013 9 10.84 8.8 81 12/06/20013 11 10.82 8.64 79.4 12/06/20013 13 10.78 8.36 76.8 12/06/20013 15 10.76 8.31 76.3 12/06/20013 17 10.7 8.03 73.6 12/06/20013 19 10.65 7.76 71 07/11/20021 0.99 27.3 10.23 132 07/11/20021 3.01 27.2 10.31 132.9 07/11/20021 4.98 27.1 10.81 138.9 07/11/20021 6.99 26.6 11.07 140.9 07/11/20021 8.78 26.2 11.98 151.5 07/11/20022 1 26.9 9.07 116.3 07/11/20022 3 26.9 9.16 117.5 07/11/20022 5 26.9 9.14 117.2 07/11/20022 7 26.9 9.18 117.7 07/11/20022 9 26.9 9.32 119.5 07/11/20022 11 26.9 9.31 119.4 07/11/20022 13 26.8 9.28 118.6 07/11/20022 15 26.2 8.85 111.9 07/11/20022 17 23.4 6.76 81.2 07/11/20022 19 21.6 2.86 33.1 07/11/20022 21 19.3 0.52 5.8 07/11/20022 23 17.7 0.37 4 07/11/20022 25 16.3 0.24 2.5 07/11/20022 27 15.2 0.17 1.7 07/11/20022 29 14.3 0.12 1.2 07/11/20022 31 13.6 0.16 1.5 07/11/20023 1 27.0 8.9 114.3 07/11/20023 3 27.0 8.88 114 07/11/20023 5 27.1 8.88 114 07/11/20023 7 27.1 8.89 114.2 07/11/20023 9 27.1 8.81 113.1 07/11/20023 11 27.0 8.88 113.9 07/11/20023 13 26.9 8.81 113
Page 73
FINAL
Piney Run Reservoir WQA of Eutrophication Document version: September 27, 2004
A58
07/11/20023 16 26.6 8.72 111.1 07/11/20023 17 23.3 6.15 73.7 07/11/20023 19 20.6 1.04 12 07/11/20023 21 19.2 0.5 5.6 07/11/20023 26 16.8 0.33 3.5 07/11/20023 27 15.7 0.32 3.3 07/11/20023 31 14.2 0.17 1.7 07/11/20023 33 13.2 0.18 1.3 07/11/20023 35 12.3 0.17 1.7 07/11/20023 37 10.9 0.16 1.5 07/11/20023 39 10.6 0.18 1.6 07/11/20023 41 10.5 0.16 1.4 07/11/20023 43 10.3 0.13 1.2 07/11/20023 29 14.7 0.25 2.5 07/11/20023 27 15.4 0.29 3 07/11/20023 25 16.2 0.31 3.3 07/11/20023 15 26.3 8.51 107.8 07/25/20021 1.03 27.6 9.72 125 07/25/20021 3 27.6 9.67 124.3 07/25/20021 5.02 27.4 9.7 124.5 07/25/20021 7.07 27.4 9.61 123.2 07/25/20021 8.99 27.3 9.03 115.6 07/25/20022 0.98 27.6 9.3 119.5 07/25/20022 3.04 27.6 9.27 119.2 07/25/20022 5.03 27.6 9.2 118.2 07/25/20022 7.06 27.6 9.25 119 07/25/20022 9.08 27.6 9.24 119 07/25/20022 11.01 27.6 9.21 118.5 07/25/20022 13.02 27.1 8.4 107 07/25/20022 15.02 26.0 7.25 90.6 07/25/20022 17.01 24.6 5.4 65.9 07/25/20022 19.03 22.8 1.88 22.2 07/25/20022 21.08 21.1 0.58 6.6 07/25/20022 22.77 18.1 0.25 2.7 07/25/20022 25.29 16.6 0.25 2.6 07/25/20023 1 27.3 9.1 116.9 07/25/20023 3 27.3 9.06 115.9 07/25/20023 5 27.3 9.05 115.9 07/25/20023 7 27.4 8.97 114.9 07/25/20023 9 27.4 8.92 114.6 07/25/20023 11 27.4 8.92 114.3 07/25/20023 13 27.4 8.88 113.8 07/25/20023 15 26.2 7.5 94 07/25/20023 17 23.8 3.97 47.6 07/25/20023 19 23.0 3.76 41.3 07/25/20023 19 21.9 0.62 7.3 07/25/20023 21 20.1 0.46 5.1
Page 74
FINAL
Piney Run Reservoir WQA of Eutrophication Document version: September 27, 2004
A59
07/25/20023 23 18.7 0.45 4.9 07/25/20023 23 18.2 0.39 4.2 07/25/20023 25 16.9 0.35 3.7 07/25/20023 27 15.8 0.28 2.9 07/25/20023 29 14.9 0.23 2.4 07/25/20023 31 14.1 0.38 3.7 07/25/20023 33 12.7 0.17 1.7 07/25/20023 36 11.4 0.16 1.5 07/25/20023 37 11.1 0.15 1.4 07/25/20023 39 10.8 0.17 1.5 07/25/20023 41 10.6 0.15 1.3 08/08/20021 1 26.7 9.17 116.4 08/08/20021 3 26.6 8.76 111.1 08/08/20021 5 26.3 9.11 114.8 08/08/20021 7 26.1 7.75 97.4 08/08/20021 9 25.7 2.88 35.9 08/08/20021 11 24.9 0.7 8.6 08/08/20022 1 26.7 7.48 95 08/08/20022 3 26.7 7.43 94.4 08/08/20022 5 26.7 7.38 93.7 08/08/20022 7 26.7 7.35 93.4 08/08/20022 9 26.7 7.32 93 08/08/20022 9 26.7 7.31 92.8 08/08/20022 11 26.7 7.36 93.4 08/08/20022 13 26.7 7.4 94 08/08/20022 15 26.7 7.44 94.4 08/08/20022 17 26.6 7.43 94.4 08/08/20022 19 23.6 0.86 10.4 08/08/20022 19 23.6 0.7 8.4 08/08/20022 21 20.7 0.38 4.4 08/08/20022 23 19.5 0.34 3.7 08/08/20022 25 16.9 0.26 2.8 08/08/20022 27 15.4 0.12 1.3 08/08/20023 1 26.8 7.72 98.4 08/08/20023 3 26.8 7.69 98 08/08/20023 5 26.8 7.68 97.8 08/08/20023 7 26.9 7.64 97.3 08/08/20023 9 26.9 7.62 97.1 08/08/20023 11 26.9 7.59 96.7 08/08/20023 13 26.8 7.6 96.7 08/08/20023 15 26.8 7.58 96.6 08/08/20023 17 26.8 7.55 96.2 08/08/20023 19 24.2 0.77 9.4 08/08/20023 21 22.1 0.55 6.4 08/08/20023 23 18.5 0.36 3.9 08/08/20023 25 17.7 0.33 3.3 08/08/20023 25 17.4 0.27 2.9
Page 75
FINAL
Piney Run Reservoir WQA of Eutrophication Document version: September 27, 2004
A60
08/08/20023 27 16.1 0.2 2.2 08/08/20023 29 14.8 0.77 7.8 08/08/20023 31 13.9 0.17 1.6 08/08/20023 33 12.6 0.15 1.5 08/08/20023 35 11.7 0.14 1.3 08/08/20023 37 11.3 0.12 1.1 08/08/20023 39 11.0 0.12 1.1 08/08/20023 40 10.6 0.14 1.3 08/22/20021 0.98 29.1 9.91 130.8 08/22/20021 3 28.7 9.89 129.7 08/22/20021 5.01 28.0 10.73 139 08/22/20021 7.01 27.7 9.76 125.7 08/22/20021 9.01 27.5 8.18 105 08/22/20021 10.96 26.9 3.08 39.1 08/22/20022 1 28.1 7.6 08/22/20022 3 28.0 7.51 08/22/20022 5 27.9 7.54 08/22/20022 7 27.9 7.69 08/22/20022 9 27.8 7.71 08/22/20022 11 27.8 7.6 08/22/20022 13 27.8 7.54 08/22/20022 15 27.7 7.07 08/22/20022 15 27.7 7.08 08/22/20022 17 26.6 1.39 08/22/20022 19 24.6 0.8 08/22/20022 21 21.9 0.6 08/22/20022 23 19.9 0.46 08/22/20022 25 17.3 0.25 08/22/20022 27 15.5 0.2 08/22/20023 1 27.6 7.53 96.7 08/22/20023 3 27.6 7.56 97.1 08/22/20023 5 27.6 7.51 96.5 08/22/20023 7 27.6 7.41 95.2 08/22/20023 9 27.6 7.44 95.6 08/22/20023 11 27.6 7.42 95.3 08/22/20023 13 27.3 6.92 88.5 08/22/20023 15 26.7 5.2 65.8 08/22/20023 17 25.8 4.01 49.9 08/22/20023 19 24.5 1.86 22.6 08/22/20023 22 22.1 0.24 2.6 08/22/20023 23 19.1 0.19 2 08/22/20023 25 17.0 0.18 1.9 08/22/20023 27 15.6 0.15 1.5 08/22/20023 29 14.2 0.16 1.6 08/22/20023 31 13.4 0.16 1.5 08/22/20023 33 12.7 0.15 1.4 08/22/20023 35 12.4 0.15 1.5
Page 76
FINAL
Piney Run Reservoir WQA of Eutrophication Document version: September 27, 2004
A61
08/22/20023 36 12.2 0.14 1.3 08/22/20023 37 11.9 0.13 1.2 08/22/20023 39 11.3 0.14 1.3 08/22/20023 42 10.6 0.12 1.1 08/22/20023 43 10.3 0.14 1.2 08/22/20023 45 10.2 0.13 1.2 09/03/20021 1 24.6 9.38 114.7 09/03/20021 3 23.6 14.09 169.2 09/03/20021 4.98 22.9 8.18 96.9 09/03/20021 7.04 22.8 7.96 94.2 09/03/20021 8.96 21.3 4.39 50.4 09/03/20022 0.98 24.1 7.27 88.1 09/03/20022 3.01 23.7 7.14 85.9 09/03/20022 5.02 23.2 7.06 84.2 09/03/20022 7.06 23.2 6.91 82.3 09/03/20022 9.03 23.1 6.81 81.1 09/03/20022 11.04 23.1 6.94 82.6 09/03/20022 13.09 23.1 6.95 82.7 09/03/20022 15.05 23.1 6.91 82.2 09/03/20022 14.98 23.1 6.93 82.4 09/03/20022 17.03 23.1 6.87 81.6 09/03/20022 17.04 23.1 6.84 81.3 09/03/20022 19.05 22.9 5.4 64.1 09/03/20022 21.04 22.8 5.09 60.2 09/03/20022 23.02 20.3 0.3 3.4 09/03/20022 25.01 18.1 0.23 2.4 09/03/20022 27 16.7 0.2 2 09/03/20023 0.86 23.5 7.99 95.9 09/03/20023 3.06 23.3 8 95.5 09/03/20023 5.01 23.3 8.05 96.2 09/03/20023 7.05 23.2 7.93 94.6 09/03/20023 8.98 23.2 7.94 94.6 09/03/20023 11.11 23.2 7.86 93.6 09/03/20023 12.98 23.2 7.83 93.3 09/03/20023 15.03 23.2 7.8 92.8 09/03/20023 17.01 23.1 7.58 90.3 09/03/20023 19.02 22.8 6.4 75.7 09/03/20023 21.33 22.3 4.43 52 09/03/20023 23 20.9 1.02 11.7 09/03/20023 25.01 17.3 0.6 6.4 09/03/20023 26.97 15.9 0.33 3.4 09/03/20023 29.12 15.1 0.28 2.9 09/03/20023 31.12 13.9 0.22 2.1 09/03/20023 33 12.9 0.2 2 09/03/20023 35.01 11.8 0.18 1.7 09/03/20023 37.02 11.2 0.19 1.7 09/03/20023 39.03 10.8 0.17 1.5
Page 77
FINAL
Piney Run Reservoir WQA of Eutrophication Document version: September 27, 2004
A62
09/03/20023 41.03 10.5 0.16 1.5 09/03/20023 43.03 10.3 0.15 1.4 09/03/20023 45.02 10.1 0.18 1.6 09/17/20021 1.01 24.5 9.78 119.7 09/17/20021 3.01 23.8 9.37 113.1 09/17/20021 5 23.5 9.31 111.7 09/17/20021 7.02 23.2 8.53 101.9 09/17/20021 9.02 23.2 8.08 96.4 09/17/20021 10.98 23.1 7 83.4 09/17/20022 1.01 24.3 8.43 102.7 09/17/20022 3.02 24.3 8.34 101.6 09/17/20022 5.02 23.7 8.24 99.4 09/17/20022 7 23.7 8.18 98.5 09/17/20022 9.02 23.6 8.04 96.7 09/17/20022 11 23.4 7.79 93.4 09/17/20022 12.98 23.3 7.66 91.6 09/17/20022 15.01 23.2 6.83 81.5 09/17/20022 16.96 22.9 5.38 63.8 09/17/20022 19.01 22.4 3.59 42.2 09/17/20022 21.02 22.0 2.72 31.7 09/17/20022 23.01 21.1 0.55 6.3 09/17/20022 25.04 19.9 0.23 2.6 09/17/20022 26.95 16.7 0.18 1.9 09/17/20023 1.02 23.8 8.39 101.3 09/17/20023 2.97 23.8 8.22 99.2 09/17/20023 5.03 23.7 8.13 98 09/17/20023 7.07 23.7 8.04 96.9 09/17/20023 8.98 23.7 7.98 96.2 09/17/20023 10.99 23.6 7.65 92 09/17/20023 13.04 23.2 7.13 85 09/17/20023 15.02 23.0 6 71.3 09/17/20023 17.34 22.8 5.25 62.2 09/17/20023 19.04 22.7 4.9 58 09/17/20023 20.97 22.4 3.96 46.6 09/17/20023 22.92 21.9 2.37 27.6 09/17/20023 25.03 18.7 0.36 3.9 09/17/20023 27.06 16.7 0.23 2.5 09/17/20023 29 15.3 0.19 1.9 09/17/20023 31 14.1 0.17 1.7 09/17/20023 33 12.8 0.15 1.5 09/17/20023 35 11.9 0.14 1.3 09/17/20023 37.02 11.4 0.15 1.4 09/17/20023 39.52 10.9 0.15 1.4 09/17/20023 40.96 10.7 0.13 1.2 09/17/20023 42.97 10.3 0.14 1.3 10/03/20021 1.02 23.4 10.51 126 10/03/20021 2.99 22.7 12.38 146.6
Page 78
FINAL
Piney Run Reservoir WQA of Eutrophication Document version: September 27, 2004
A63
10/03/20021 5 22.4 9.14 107.6 10/03/20021 7 21.8 8.42 98 10/03/20021 8.98 21.6 9.01 104.3 10/03/20021 10.95 20.6 7.08 80.4 10/03/20022 0.97 23.3 8.73 104.5 10/03/20022 3.01 23.1 8.86 105.7 10/03/20022 5.07 22.7 8.93 105.7 10/03/20022 7.03 22.2 8.73 102.3 10/03/20022 8.99 21.9 8.56 99.9 10/03/20022 11.06 21.8 8.4 97.7 10/03/20022 13.03 21.7 8.11 94.1 10/03/20022 15 21.5 6.81 78.8 10/03/20022 17.02 21.4 6.62 76.4 10/03/20022 18.98 21.2 5.5 63.3 10/03/20022 21 20.9 4.32 49.4 10/03/20022 23.01 20.5 2.97 33.6 10/03/20022 25 20.0 1.07 12 10/03/20022 27.03 17.9 0.3 3.3 10/03/20023 1.02 22.9 8.66 103 10/03/20023 3.06 22.8 8.61 102.2 10/03/20023 4.93 22.6 8.25 97.3 10/03/20023 7.01 22.1 8.33 97.4 10/03/20023 9.06 21.8 7.88 91.8 10/03/20023 11.05 21.7 7.69 89.3 10/03/20023 13.08 21.6 7.71 89.4 10/03/20023 15.09 21.5 7.41 85.6 10/03/20023 16.97 21.4 7.05 81.3 10/03/20023 19.04 21.3 6.65 76.7 10/03/20023 21.04 21.2 6.24 71.7 10/03/20023 23.04 21.1 4.89 56.1 10/03/20023 25.07 20.3 0.89 10 10/03/20023 27.02 17.1 0.22 2.4 10/03/20023 29.03 15.6 0.2 2 10/03/20023 31.01 14.6 0.19 1.9 10/03/20023 33.03 13.4 0.16 1.5 10/03/20023 35.06 12.4 0.16 1.5 10/03/20023 37.01 11.6 0.14 1.4 10/03/20023 38.99 10.8 0.13 1.2 10/03/20023 41 10.5 0.12 1.1 10/03/20023 42.97 10.3 0.13 1.2 10/15/20022 1.04 18.8 6.94 75.4 10/15/20022 3 18.8 6.83 74.3 10/15/20022 5 18.8 6.76 73.5 10/15/20022 7.03 18.8 6.76 73.7 10/15/20022 9.02 18.8 6.81 74.1 10/15/20022 10.99 18.8 6.8 73.9 10/15/20022 12.98 18.8 6.78 73.7
Page 79
FINAL
Piney Run Reservoir WQA of Eutrophication Document version: September 27, 2004
A64
10/15/20022 15.06 18.8 6.86 74.6 10/15/20022 17.03 18.8 6.94 75.5 10/15/20022 19.21 18.7 7.08 76.9 10/15/20022 21.04 18.7 6.93 75.2 10/15/20022 23.04 18.7 6.75 73.3 10/15/20022 25.05 18.7 6.65 72.1 10/15/20022 27.03 18.4 6.25 67.3 10/15/20023 1 18.9 7.43 81 10/15/20023 3.39 18.9 7.32 79.8 10/15/20023 5.03 18.9 7.38 80.4 10/15/20023 7 18.9 7.36 80.2 10/15/20023 9.03 18.9 7.29 79.5 10/15/20023 11.05 18.9 7.12 77.6 10/15/20023 12.97 18.9 7 76.3 10/15/20023 14.98 18.9 6.94 75.7 10/15/20023 17.11 18.9 6.95 75.7 10/15/20023 19.01 18.9 6.95 75.7 10/15/20023 20.97 18.9 6.93 75.4 10/15/20023 23.01 18.9 6.84 74.5 10/15/20023 25.06 18.8 6.66 72.4 10/15/20023 27.04 18.7 6.15 66.8 10/15/20023 29.1 17.1 0.56 5.9 10/15/20023 31.01 14.6 0.25 2.5 10/15/20023 33.05 13.5 0.2 2 10/15/20023 35.03 12.8 0.17 1.7 10/15/20023 36.99 12.0 0.15 1.4 10/15/20023 39 11.3 0.15 1.4
Table A10 Secchi Depth (feet) (Carroll County, 1991-2000)
STATION 1 STATION 2 STATION 3 N 112 127 127 Geometric Mean 5.93 8.50 9.07 Mean 6.46 9.54 10.36 Maximum 12.00 24.60 33.20 Minimum 0.50 2.30 3.00 Median 6.50 8.50 9.00
Page 80
FINAL
Piney Run Reservoir WQA of Eutrophication Document version: September 27, 2004
A65
Table A11
Point Source Data (MD0024589)
NPDES YEAR MONTH FLOW TSS TP MD0024589 1996 1 0.01 2 0.08 MD0024589 1996 2 0.014 0.4 0.04 MD0024589 1996 3 0.015 2 0.16 MD0024589 1996 4 0.015 2 0.45 MD0024589 1996 5 0.016 0.3 0.4 MD0024589 1996 6 0.005 0.5 0.39 MD0024589 1996 7 0.003 1 0.05 MD0024589 1996 8 0.004 0.4 0.08 MD0024589 1996 9 0.009 1.1 0.26 MD0024589 1996 10 0.008 1 0.28 MD0024589 1996 11 0.007 1 0.38 MD0024589 1996 12 0.006 1 0.57 MD0024589 1997 1 0.007 1 0.33 MD0024589 1997 2 0.008 0.8 0.39 MD0024589 1997 3 0.007 1 0.12 MD0024589 1997 4 0.01 1 0.14 MD0024589 1997 5 0.011 2 0.17 MD0024589 1997 6 0.007 5 0.12 MD0024589 1997 7 0.002 1 0.15 MD0024589 1997 8 0.004 0.8 0.11 MD0024589 1997 9 0.006 1 0.49 MD0024589 1997 10 0.006 1 0.69 MD0024589 1997 11 0.007 2 0.19 MD0024589 1997 12 0.006 16 0.69 MD0024589 1998 1 0.006 1 0.08 MD0024589 1998 2 0.008 1 0.14 MD0024589 1998 3 0.008 0.3 0.04 MD0024589 1998 4 0.006 1 0.05 MD0024589 1998 5 0.007 0.3 0.11 MD0024589 1998 6 0.004 1 0.1 MD0024589 1998 7 0.002 1 0.06 MD0024589 1998 8 0.003 1 0.06 MD0024589 1998 9 0.008 0.3 0.28 MD0024589 1998 10 0.008 1 0.2 MD0024589 1998 11 0.006 2 0.49 MD0024589 1998 12 0.006 1 0.08 MD0024589 1999 1 0.006 1 0.09 MD0024589 1999 2 0.007 1 0.67 MD0024589 1999 3 0.007 2 0.57
Page 81
FINAL
Piney Run Reservoir WQA of Eutrophication Document version: September 27, 2004
A66
MD0024589 1999 4 0.007 1 0.08 MD0024589 1999 5 0.007 1 0.09 MD0024589 1999 7 0.002 1 0.07 MD0024589 1999 8 0.002 1 0.04 MD0024589 1999 9 0.008 1 0.62 MD0024589 1999 10 0.007 0.3 0.13 MD0024589 1999 11 0.006 1 0.1 MD0024589 1999 12 0.005 0.4 0.07 MD0024589 2000 1 0.004 0.5 0.31 MD0024589 2000 2 0.007 0.2 0.31 MD0024589 2000 3 0.007 1 0.05 MD0024589 2000 4 0.007 1 0.09 MD0024589 2000 5 0.007 0.6 0.12 MD0024589 2000 7 0.004 1 0.05 MD0024589 2000 8 0.002 1 0.05 MD0024589 2000 9 0.003 1 0.07 MD0024589 2000 10 0.008 1 0.05 MD0024589 2000 11 0.006 1 0.22 MD0024589 2000 12 0.006 0.7 0.05 MD0024589 2000 12 0.005 1 0.24 MD0024589 2001 1 0.006 1 0.11 MD0024589 2001 2 0.006 1 0.07 MD0024589 2001 3 0.008 1 0.05 MD0024589 2001 4 0.007 0.8 0.04 MD0024589 2001 5 0.008 0.6 0.09 MD0024589 2001 6 0.006 1 0.04 MD0024589 2001 7 0.002 1 0.04 MD0024589 2001 8 0.003 1 0.02 MD0024589 2001 9 0.007 0.6 0.04 MD0024589 2001 10 0.007 0.6 0.08 MD0024589 2001 11 0.006 3 0.08 MD0024589 2001 12 0.006 1 0.05 MD0024589 2002 1 0.006 1 0.04 MD0024589 2002 2 0.006 2 0.08 MD0024589 2002 3 0.007 2 0.04 MD0024589 2002 4 0.006 1 0.06 MD0024589 2002 5 0.007 1 0.21 MD0024589 2002 6 0.003 1 0.13 MD0024589 2002 7 0.002 2 0.09 MD0024589 2002 8 0.003 1 0.06 MD0024589 2002 9 0.006 3 0.16 MD0024589 2002 10 0.007 1 0.15 MD0024589 2002 11 0.005 0.8 0.11 MD0024589 2002 12 0.004 1 0.04
Page 82
FINAL
Piney Run Reservoir WQA of Eutrophication Document version: September 27, 2004
A67
Figure 1A: Adopted from Carroll County, 1998-2000
Page 83
FINAL
Piney Run Reservoir WQA of Eutrophication Document version: September 27, 2004
B1
Appendix B
Page 84
FINAL
Piney Run Reservoir WQA of Eutrophication Document version: September 27, 2004
B2