Page 1
International Water Technology Journal, IWTJ Vol. 3, No. 4, December 2013
170
WATER QUALITY AND ITS IMPACT ON TILAPIA ZILLI (CASE STUDY )QARUN
LAKE-EGYPT
Lubna A. Ibrahim1 and Enas M. Ramzy
2
1 Researcher, Chemistry Dept., Central Laboratory for Environmental Quality Monitoring (CLEQM),
National Water Research Center (NWRC), Cairo, [email protected] 2 Researcher, Biological Indicators Dept., Central Laboratory for Environmental Quality Monitoring
(CLEQM), National Water Research Center (NWRC), Cairo, [email protected]
ABSTRACT
Aquatic environment is subjected to different types of pollutants via intrusion of industrial,
agricultural and domestic waste water. The study was conducted to throw light on water pollution and
evaluate the quality of Tilapia Zilli at the north eastern part of Lake Qarun during the summer season. In
addition to study the relationship between the activity of trace elements in water samples and their total
concentrations in fish tissues (muscles, liver and brain). The physiochemical parameters of water
samples were determined. Trace elements, species (metabolites) of organophosphorus pesticides (OPPs)
and organochlorine pesticides (OCPs) were determined in the muscles, liver and brain of Tilapia Zilli
and water samples collected. The results indicated that the studied water samples were saline and the
abundance of trace elements followed the order: Fe>Mn>Cu>Cd>Zn>Pb. The total dissolved
concentrations of Cd, Cu, Pb and Fe were higher than the permissible limit, but their active
concentration still less than the permissible limit. The highest accumulations of trace elements were
recorded in the liver and brain while the lowest were recorded in the muscles. All metal levels detected in
tissues were not safe for human consumption, except manganese was within the limits for fish proposed
by World Health Organization (WHO). Regression equation showed that the total element concentration
in fish tissues depend on the activity of that element in water samples.OCPs are higher than OPPs with
respect to each sample. The concentrations of α-BHC, γ-BHC, hepta-epoxide, cadusaphos, Di-Syston,
pirimiphos, fenitrothion, and profenofos in liver are depending on their concentration in water samples.
Bioaccumulation Factor (BAF) of trace element, OCPs and OPPs were in low to medium concentration.
Cadmium, copper, iron, manganese, lead, OCPs and OPPs were safe and didn’t constitute threaten to
human health compared to Organization for Economic Cooperation and Development (OECD)
guidance, while Zinc was hazard ranking.The study recommends treating wastewater before discharge
into Lake and there is a need for continuous monitoring for water quality of Qarun Lake since the Lake
serves as source of fish for local inhabitants in that area.
Keywords: Water Quality, Qarun Lake, Tilapia Zilli, Organophosphorus and Organochlorine
Pesticides
1. INTRODUCTION
Lake Qarun is a closed water lake, which originated from a fresh water lake called Mories. The lake
receives annually about 400 million cubic meters of agricultural wastewater drainage (Egyptian
Company for Salts and Minerals [1]). Many factors affecting Lake Qarun ecosystem include the climatic
conditions, amount of discharged wastewater, seepage from the surrounding cultivated land and
geological aspects (Abdel-Satar et al., [2]).
Lake Qarunhasmany drastic changesthat affect the potential economic role as a site for living natural
resources. The main reason came from gradually increasing salinity over the last century. The increase of
salinity depends on the input of drainage water (controlled by irrigation practices) and the subtropical
climate of the lake leading to high temperature and seasonal fluctuations in rate of water evaporation
(Anwar et al., [3]).
Page 2
International Water Technology Journal, IWTJ Vol. 3, No. 4, December 2013
171
Extensive water evaporation from such closed ecosystem increases concentration of salts, trace
elements, pesticides and other pollutants is expected to change their quality and affect their food web.
Consequently, this changes water quality and affects biology of the lake (Ali et al., [4]).
Fish are located at the end of the aquatic food chain and may accumulate metals and pass them to
human beings through consumption causing chronic or acute diseases (Al-Yousuf et al., [5]). El-Gheit et
al., [6] revealed that there are three factors causing massive mortalities of fishes in Qarun Lake, namely
blooming phenomenon, poor water quality (trace metals & physico-chemical parameters) and microbial
pathogens in the aquatic environment. Mansour et al.[7] concluded that the physicochemical
characteristics of the Lake Qarun water are mainly due to the discharges of different drains into the lake.
When subsurface irrigation drainage water is discharged into a wetland, a variety of serious impacts can
occur (Lemly, [8]; Lemly, Finger, & Nelson, [9]; Micklin, [10]; van Schilfgaarde, [11]; Zahm [12]. Such
water is usually characterized by alkaline pH, elevated concentrations of salts, trace elements, and
nitrogenous compounds, but low concentrations of pesticides (Fujii, [13]; Neil, [14].Saad and Hemeda
[15] stated that the high nutrient concentrations coincided mainly with spreading of the nutrient enriched
drainage water over the dense lake bottom water.
The distribution of trace elements showed irregular patterns in the lake as a result of interference
between several factors such as surrounding environment, closed basin and climatic effects (Abdel-Satar
et al., [2]). Sabae and Ali [16] showed that the distribution of denitrifying bacteria was controlled by the
effect of drainage water via El-Batts and El-Wadi Drains, which are loaded with nutrients.
Trace elements are of particular concern, due to their potential toxic effect and ability to bioaccumulate
in aquatic ecosystems (Censi et al., [17]). When fish are exposed to elevated levels of metals in a polluted
aquatic ecosystem, they tend to take these metals up from their direct environment (Framobi et al., [18]).
Transport of metals in fish occurs through blood and the metals are brought into contact with the organs
and the tissues of the fish and consequently accumulated to different extents (Kalay & Canli, [19]).
Prolonged exposures to trace elements even in very low concentrations have been reported to induce
morphological, histological and biochemical alterations in the tissues that may critically influence fish
quality (Kaoud and El-Dahshan, [20]). Birungi et al., [21], found that accumulation of trace elements in a
tissue is mainly dependent upon concentrations of metals; besides other environmental factors such as
salinity, pH, hardness, and temperature.
Pesticides use has increased substantially throughout the world for protection of crops from insect
infestation and to achieve higher crop yields with better quality (Zia et al., [22]). An estimated quantity
of 2.5 million tons of pesticides is used in the world annually with continuous increases (Pimentel,
[23]).The group of pesticide compounds includes chloroorganic insecticides used to eliminate human and
animal parasites and fight agricultural pests. The organochlorine pesticides(OCPs) are among the major
types of pesticides, notorious for their high toxicity, their persistence in the physical environment and
their ability to enter the food chain (Ntow, [24]).Researchers have detected pesticides residues in
heptachlor, endosulfan, aldrin, DDT and PCBs in water and many of these pesticides have also been
detected in sediment, aquatic plants, and fish (Osibanjo et al., [25]).Organophosphorus compounds are
quickly degradable in aquatic environment where the alkaline media accelerates their degradation (Saad
et al., [26]).The OCPs, unlike OPPs are more resistant to microbial degradation and have a propensity to
concentrate in lipid rich tissues of Aquatic organisms (Essumanget al.,[27]).There are many factors
which may affect the contamination levels of organophosphrous in drainage water such as the presence of
most minerals and salts (Schlauch, [28]), photosensitizers, temperature, pH, radiation and metal cations
(Brust, [29]; Mortland and Raman[30]; Smith, [31]; Schaefer and Dupras, [32]; Meikle and Youngson,
[33]), as well as micro-organisms (Haven and Rase[34]).
The deterioration of water resources in the lake during the summer season is considered as a serious
threat to the aquatic life (Mansour and Sidky, [35]; Fathi and Flower, [36]). Ali and Fishar [37]
mentioned that the eastern part of the lake was generally highly contaminated (concerning trace elements
in water, sediment, benthic invertebrate and fish) in compared with the western one.
Page 3
International Water Technology Journal, IWTJ Vol. 3, No. 4, December 2013
172
The increasing pollution of water resources in Qarun Lake and the consequent effects on aquatic
environment and human health is an issue of great concern. This work aims at highlighting the problem
of water pollution in the North eastern part of Qarun Lake with special emphasis on major pollutants
species, evaluation of Tilpia zillifish with respect to pesticide residue and bioaccumulation of some
important trace elements in muscles, liver and brain in summer season, study the relationship between the
activity of metals ion in water samples and their total concentrations in fish sampleswere also discussed,
and test the relationship between different types of OCPs and OPPs in water and fish parts.
2. MATERIAL AND METHODS
2.1. Study Area
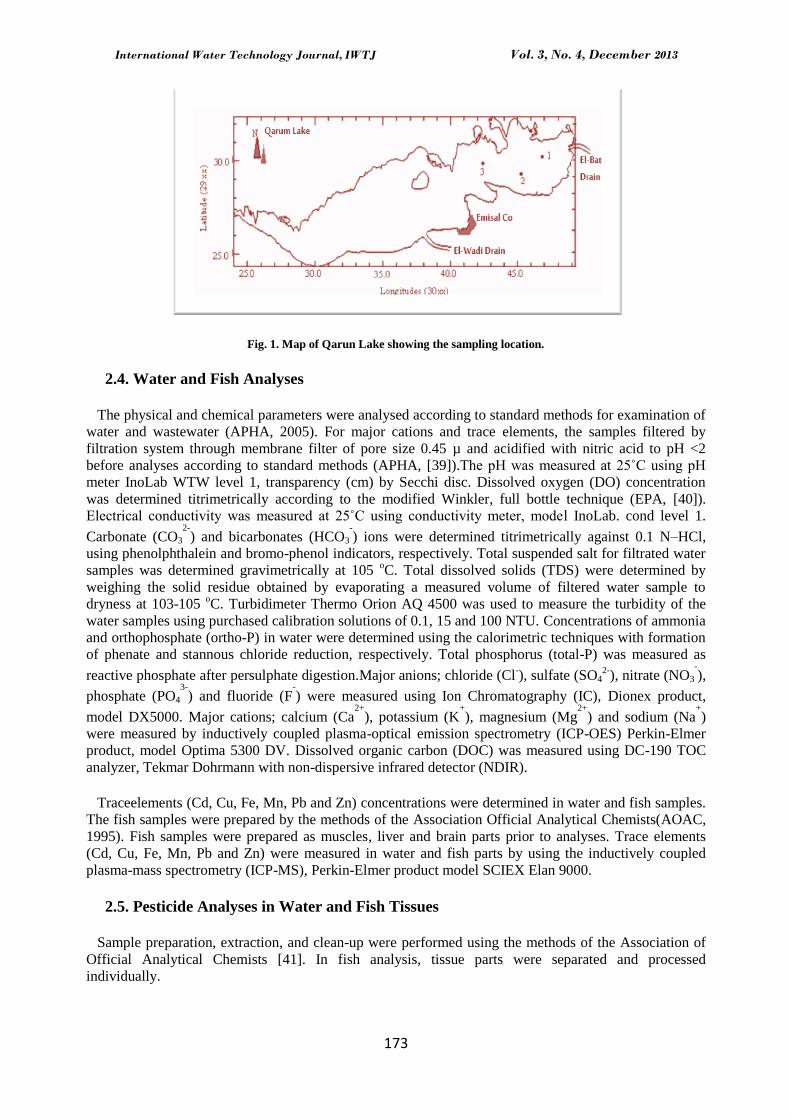
Lake Qarun is a closed saline lake lying in the western Egyptian desert and lies 83 km southwest of
Cairo. The lake is located between longitudes of 300 24` & 30
0 49` E and latitude of 29
0 24` & 29
0 33` N
in the lowest part of Fayoum depression. It is bordered from its northern side by the desert and by
cultivated land from its south and southeastern side (Abdel-Satar et al., [38]). The lake is shallow, with
mean depth of 4.2 m and most of the lake area has a depth ranging between 5 to 8 meters. The lake has an
area about 40 Km2 with an irregular shape of about 40 Km length and 6 Km mean width. The water level
of the lake fluctuated between 5 to 8 meters (Sabae and Ali, [16]). The lake receives the agricultural and
sewage drainage water from the surrounding cultivated land through a system of twelve drains. The
drainage water reaches the lake by two huge drains, El-Batts drain (at the northeast corner) and El-Wadi
drain (near mid-point of the southern shore).
2.2. Sampling
Water and fish samples were collected in triplicates from the studied site in various containers
specialized to suit the nature of tested parameter according to Standard Methods for Examination of
Water and Wastewater (APHA, [39]). The present investigation was started with samples collection in
May, July and September 2012 in each month, three samples were collected for water and T. Zillii fish
from three sites in the north eastern part of the Lake as shown in Fig. 1. Sampling procedures as well as
analytical methods for both physical and chemical determinations were carried out according to Standard
Methods for Examination of Water and Wastewater. Water samples were taken from surface water into a
polyethylene bottle. Fish samples, Tilpia zilli, were collected from the lake at least (2Kg) and kept in
iceboxes during transportation. All collected samples were stored in an iced cooler box laboratory and
kept at -4Coand delivered immediately to the laboratory, where they were analyzed.
2.3. Reagents
All reagents used were of analytical grade. Deionized water was used for all the prepared reagent
solutions. Stock standard solutions of cadmium (Cd), copper (Cu), iron (Fe), lead (Pb), manganese (Mn)
and zinc (Zn), were obtained from Merck in concentrations of 1000 mg/L (Merck, Darmstadt, Germany).
A mixture of pesticide calibration standards containing hexachlorobenzene (HCB), lindane, aldrin,
heptachlor, heptachlor epoxide, dieldrin, endrin, dichloro diphenyl trichloroethane (pp-DDT), pp-DDT
analogues (e.g. op-DDT, op-DDE, pp-DDE, op-DDD, pp-DDD), malathion, parathion, methyl parathion,
dimethoate, pirimiphos-methyl, profenofos, and diazinon, were provided by the Environmental
Protection Agency (EPA). A mixture calibration standards of organochlorine pesticides (for EPA
Methods - Contract Laboratory Standard, CLP-226B) containing Aldrin, α -benzene hexachloride (α-
BHC), γ-BHC, β- -BHC, α-chlordan, γ-chlordan, heptachlorepoxide, decachlorobiphenyl, pp-
DDE, endrin ketone, endrin aldehyde, endosulfan II, endosulfan sulphate and 2,4,5,6-tetrachloro-m-
xylene were provided by Ultra Scientific (Lab Tech). Mixture calibration standards of organophosphorus
pesticides were supplied by the Central Agricultural Pesticides Laboratory, Giza, Egypt.
Page 4
International Water Technology Journal, IWTJ Vol. 3, No. 4, December 2013
173
Fig. 1. Map of Qarun Lake showing the sampling location.
2.4. Water and Fish Analyses
The physical and chemical parameters were analysed according to standard methods for examination of
water and wastewater (APHA, 2005). For major cations and trace elements, the samples filtered by
filtration system through membrane filter of pore size 0.45 µ and acidified with nitric acid to pH <2
before analyses according to standard methods (APHA, [39]).The pH was measured at 25˚C using pH
meter InoLab WTW level 1, transparency (cm) by Secchi disc. Dissolved oxygen (DO) concentration
was determined titrimetrically according to the modified Winkler, full bottle technique (EPA, [40]).
Electrical conductivity was measured at 25˚C using conductivity meter, model InoLab. cond level 1.
Carbonate (CO3
2-
) and bicarbonates (HCO3
-
) ions were determined titrimetrically against 0.1 N–HCl,
using phenolphthalein and bromo-phenol indicators, respectively. Total suspended salt for filtrated water
samples was determined gravimetrically at 105 oC. Total dissolved solids (TDS) were determined by
weighing the solid residue obtained by evaporating a measured volume of filtered water sample to
dryness at 103-105 oC. Turbidimeter Thermo Orion AQ 4500 was used to measure the turbidity of the
water samples using purchased calibration solutions of 0.1, 15 and 100 NTU. Concentrations of ammonia
and orthophosphate (ortho-P) in water were determined using the calorimetric techniques with formation
of phenate and stannous chloride reduction, respectively. Total phosphorus (total-P) was measured as
reactive phosphate after persulphate digestion.Major anions; chloride (Cl-), sulfate (SO4
2-), nitrate (NO3
-
),
phosphate (PO4
3-
) and fluoride (F-
) were measured using Ion Chromatography (IC), Dionex product,
model DX5000. Major cations; calcium (Ca2+
), potassium (K+
), magnesium (Mg2+
) and sodium (Na+
)
were measured by inductively coupled plasma-optical emission spectrometry (ICP-OES) Perkin-Elmer
product, model Optima 5300 DV. Dissolved organic carbon (DOC) was measured using DC-190 TOC
analyzer, Tekmar Dohrmann with non-dispersive infrared detector (NDIR).
Traceelements (Cd, Cu, Fe, Mn, Pb and Zn) concentrations were determined in water and fish samples.
The fish samples were prepared by the methods of the Association Official Analytical Chemists(AOAC,
1995). Fish samples were prepared as muscles, liver and brain parts prior to analyses. Trace elements
(Cd, Cu, Fe, Mn, Pb and Zn) were measured in water and fish parts by using the inductively coupled
plasma-mass spectrometry (ICP-MS), Perkin-Elmer product model SCIEX Elan 9000.
2.5. Pesticide Analyses in Water and Fish Tissues
Sample preparation, extraction, and clean-up were performed using the methods of the Association of
Official Analytical Chemists [41]. In fish analysis, tissue parts were separated and processed
individually.
Page 5
International Water Technology Journal, IWTJ Vol. 3, No. 4, December 2013
174
water samples (1 liter)were extracted with 15%methylene chloride in n-hexane (v/v) and separating
funnel was vigorously shaken for 2 min after it was left to separate layers. The aqueous layer(lower
layer) wastransferredinto another separating funnel and extracted two times with the same solvent
mixture .The combined methylene chloride/n-hexane layers passed through anhydrous sodium sulfate
and the elution was evaporated in a rotary evaporator to dryness.The dried film was rinsed with 2 ml of
n-hexane. This extract was cleaned up usingFlorisilcolumn(400x22mm) topped with 2cm sodium sulfate
anhydrous .Before placing the extract on the top of column; it was washed with 15ml n-hexane followed
by200ml 6,15,50% diethylether in petroleum ether(v/v).Residues analysis carried out using
GLCaccording to method of AOAC[41].
About 50 g of fishtissues were mixed into a high speed blender with sodium sulfate anhydrous in the
presence of 150ml of petroleumether(40-60oC) for two min. The extract was decanted through Buchner
funnel.The residue in the blender cup was extracted two times with petroleum ether and combined with
first extract .The combined extract was passed on sodium sulfate anhydrous and the elution was
evaporated in a rotary evaporator to dryness then defatting of the extract was performed using
hexane/acetonitrile saturated with hexane1:2(v/v) .The later extract was transferred to florisil column and
eluted with solvent system 6,15,50% diethyether in petroleum ether (v/v).
Determination of pesticide residues was performed using Hewlett-Packard gas chromatograph model
5890 II, equipped with 63Ni electron capture detector (ECD) and HP 5970 mass selective detector, fitted
with HP-1 capillary column (cross-linked methyl silicon gum; 30 m×0.25 mm×0.25 mm film thickness)
according to method of AOAC, 1995.The column oven temperature was programmed from 80 to 160 oC
at a rate of 3oC/min, held 2 min, increased to 220
oC at a rate of 5
oC/min, and then held for 20 min.
Injection and detector temperatures were adjusted to 220 and 300 oC, respectively. Compounds were
identified by comparing their retention times (RT) with those of authentic standards, and the residues
were quantitated by means of a HP 3395 computing integrator coupled to the GC, based on the peak
areas given. Under the earlier mentioned conditions, the detection limit for quantitation of chlorinated
hydrocarbon pesticides (e.g. BHC, lindane, aldrin, heptachlor, DDT isomers) is approximately 0.01 ppb,
and 0.10 ppb for the organophosphorus pesticides (e.g. malathion, pirimiphos- methyl, profenofos).at the
following conditions, Table 1.
Table 1. Operating conditions
The column oven temperature was programmed for 160oC at rate of 5
oC/min, held for 10min increased
to held 240oC at rate of 5
oC/min then hold for 20 min.Injection and detector temperature were adjusted at
Co.Flow rates of hydrogen,air and nitrogen were at75.0,100.0,11.7ml/min, respectively.Compounds were
identified by comparing their retention time (RT) with those of authentic standards.
2.6. Program used during study
SPSS, ver. 15, 2006, statistical software was used to calculate minimum, maximum, mean values of
all parameters measured through the studied months and discuss the correlation between studied
parameter in order to perform better data interpretation.
Visual MINTEQ program was used for geochemical speciation of trace elements in trace elements
(Gustafsson, [42]). The data of water samples including temperature, pH, DOC, cations, anions and
trace elements were inserted in the database of the geochemical equilibrium modeling program
Visual MINTEQ version 3, in order to form input files.
3. ECD(Ni63)
to detect organochlorine pesticides. 2. F.P.D. to detect organophosphorus.
Column A Column B
Name PAS-5 PAS-1701
Film thickness 0.25 µM 0.25 µM
Film thickness 30 m 30 m
Column ID 032 mm- OP 032 mm- OC
Page 6
International Water Technology Journal, IWTJ Vol. 3, No. 4, December 2013
175
Hygrogen32 program was used to calculate the salt composed TDS. The pH, TDS, cations and
anions were inserted to the program to form the input files.
3. RESULT AND DISCUSSION
Samples collected from three locations (9 samples collected from three locations during three months)
at the north eastern part of Qarun Lake. The samples were analyzed in triplicates and the relative standard
deviation was less than 5%. The statistical analyses of physico-chemical parameter of Qarun Lake were
summarized in Table 2. The results of physicochemical parameters were compared to the permissible
limits of the Egyptian law 48/1982 regarding the protection of River Nile and water ways from pollution.
3.1. Water Quality
The water lakes proved to be slightly alkaline with a mean pH value 8.10±0.32, where in all cases it
falls within the permissible limits (6.5 – 8.5). In general, Tilapia can survive at pH ranging between 5 and
10, but it do best in a pH range from 6 to 9 (Popma and Masser, [43]), so that the water at the studied
sites is suitable for Tilapia.This change in pH from8.10 to 7.35 was probably due to the stirring effect of
the incomingflood from the El-Batts drain that converges dtowards the lake resulting in the mixing of the
poorly alkalineor acidic bottom water with alkaline surface waterto reduce pH.
Carbonate (CO3
2-
) ions were detected at concentration lower than bicarbonates (HCO3
-
) ions. (HCO3
-
)
ions ranged from 143.40 to 433.90 mg/L with a median value 176.50mg/L, while Carbonate (CO3
2-
)
range from <0.2 to 25.70 with a median value 19.50 mg/L. Total alkalinity of Lake water ranged from
168.70 to 433.90 mg/L with a median value 196.00 mg/L. higher than the permissible limit. The increase
of water alkalinity may be due to the bacterial decomposition of organic substrates.
Dissolved oxygen is an important parameter for identification of different water masses. Tilapia can
survive acute at low DO concentrations (less than 0.3 mg/L) for several hours, considerably below the
tolerance limits for most other cultured fish. When DO falls below 1 mg/L for prolonged periods, Tilapia
metabolism, growth and disease resistance are depressed (Popma and Masser, [43]). The oxygen content
of the investigated lake water ranged from 6.59 to 8.68 mg /L with a mean value 8.68±1.12 mg/L, these
values (>5 mg/L) favor for good growth of Tilapias, reproduction and health (El-Sayed, [44]). The
relatively high concentration of dissolved oxygen recorded could be attributed to light intensity rather
than photosynthetic activity of phytoplankton and reduced turbidity during dry month.
Ammonia begins to depress food consumption at concentrations as low as 0.08 mg/L, while the
prolonged exposures to 0.2 mg/L of ammonia concentration are found to be detrimental to fish (Popma
and Masser, [43]). In the present study ammonia concentration ranged from 0.22 to 0.73 mg/L with a
mean values 0.35±0.16 mg/L higher than the permissible limit (o.5 mg/L) and for fish (0.2 mg/L). This
refer to the Tilapia Zilli acclimated to lethal dosage in the presence of adequate amount of dissolved
oxygen. The increase of ammonia in water to 0.73 mg/L and decrease of dissolved oxygen to 6.59 mg/L
can be attributed to the increase of oxygen consumption of the decomposing organic matter and the
oxidation of chemical constituents (Boyd, [45]).
Nitrate is relatively non-toxic to Tilapias. However, a prolonged exposure to elevated levels of nitrate
may decrease the immune response and induce mortality (Plumb, [46]). Inversely, nitrite is highly toxic
to Tilapias because it disturbs the physiological function of the fish and leads to growth retardation (El-
Sayed, [44]). Nitrite is toxic to many fish because it makes the hemoglobin less capable of transporting
oxygen. Nitrite concentration for fresh water culture should be kept below 27 mg/L as nitrite (Popma and
Masser, [43]). Nitrite showed very low levels (10.0 – 20.0 μg/l) than the corresponding values of nitrate
(30.0 – 60.0 μg/l) due to the fast conversion of NO2
-
to NO3
-
ions by nitrifying bacteria (Abdel-Satar et
al., [38]). NO2
-
and NO3
-
are within permissible limits of for fish.
Page 7
International Water Technology Journal, IWTJ Vol. 3, No. 4, December 2013
176
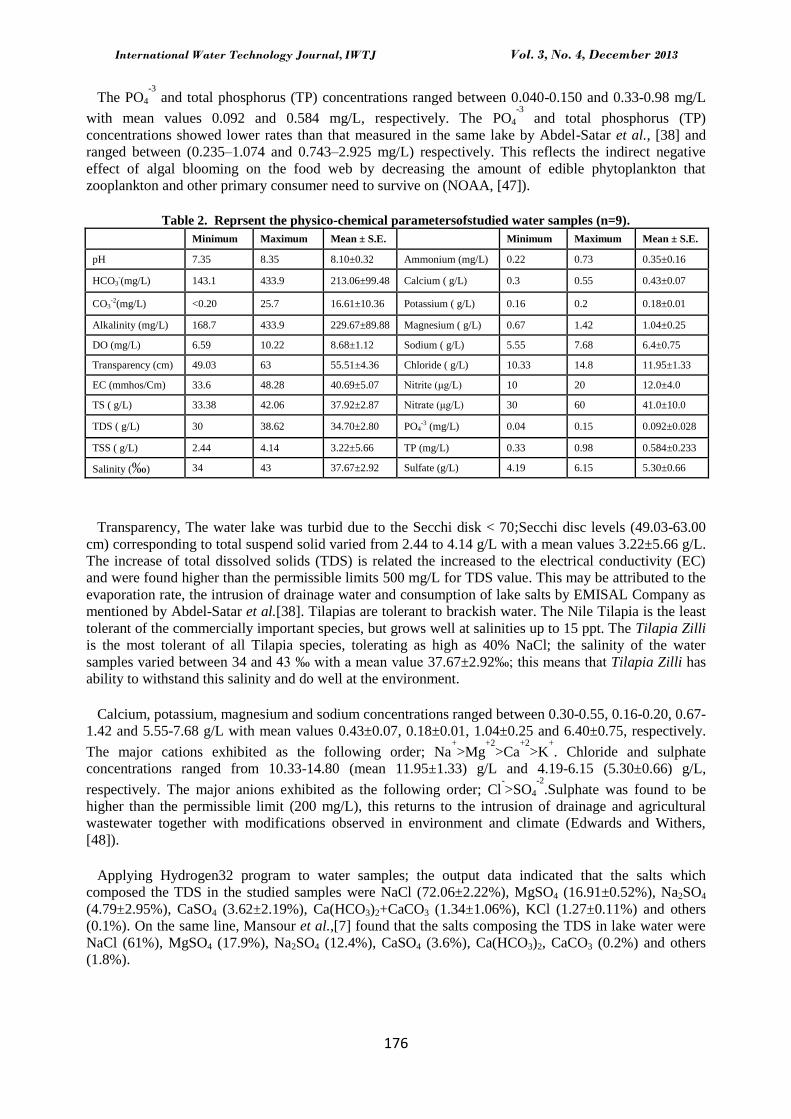
The PO4
-3
and total phosphorus (TP) concentrations ranged between 0.040-0.150 and 0.33-0.98 mg/L
with mean values 0.092 and 0.584 mg/L, respectively. The PO4
-3
and total phosphorus (TP)
concentrations showed lower rates than that measured in the same lake by Abdel-Satar et al., [38] and
ranged between (0.235–1.074 and 0.743–2.925 mg/L) respectively. This reflects the indirect negative
effect of algal blooming on the food web by decreasing the amount of edible phytoplankton that
zooplankton and other primary consumer need to survive on (NOAA, [47]).
Table 2. Reprsent the physico-chemical parametersofstudied water samples (n=9).
Minimum Maximum Mean ± S.E. Minimum Maximum Mean ± S.E.
pH 7.35 8.35 8.10±0.32 Ammonium (mg/L) 0.22 0.73 0.35±0.16
HCO3-(mg/L) 143.1 433.9 213.06±99.48 Calcium ( g/L) 0.3 0.55 0.43±0.07
CO3-2(mg/L) <0.20 25.7 16.61±10.36 Potassium ( g/L) 0.16 0.2 0.18±0.01
Alkalinity (mg/L) 168.7 433.9 229.67±89.88 Magnesium ( g/L) 0.67 1.42 1.04±0.25
DO (mg/L) 6.59 10.22 8.68±1.12 Sodium ( g/L) 5.55 7.68 6.4±0.75
Transparency (cm) 49.03 63 55.51±4.36 Chloride ( g/L) 10.33 14.8 11.95±1.33
EC (mmhos/Cm) 33.6 48.28 40.69±5.07 Nitrite (μg/L) 10 20 12.0±4.0
TS ( g/L) 33.38 42.06 37.92±2.87 Nitrate (μg/L) 30 60 41.0±10.0
TDS ( g/L) 30 38.62 34.70±2.80 PO4-3 (mg/L) 0.04 0.15 0.092±0.028
TSS ( g/L) 2.44 4.14 3.22±5.66 TP (mg/L) 0.33 0.98 0.584±0.233
Salinity (‰) 34 43 37.67±2.92 Sulfate (g/L) 4.19 6.15 5.30±0.66
Transparency, The water lake was turbid due to the Secchi disk < 70;Secchi disc levels (49.03-63.00
cm) corresponding to total suspend solid varied from 2.44 to 4.14 g/L with a mean values 3.22±5.66 g/L.
The increase of total dissolved solids (TDS) is related the increased to the electrical conductivity (EC)
and were found higher than the permissible limits 500 mg/L for TDS value. This may be attributed to the
evaporation rate, the intrusion of drainage water and consumption of lake salts by EMISAL Company as
mentioned by Abdel-Satar et al.[38]. Tilapias are tolerant to brackish water. The Nile Tilapia is the least
tolerant of the commercially important species, but grows well at salinities up to 15 ppt. The Tilapia Zilli
is the most tolerant of all Tilapia species, tolerating as high as 40% NaCl; the salinity of the water
samples varied between 34 and 43 ‰ with a mean value 37.67±2.92‰; this means that Tilapia Zilli has
ability to withstand this salinity and do well at the environment.
Calcium, potassium, magnesium and sodium concentrations ranged between 0.30-0.55, 0.16-0.20, 0.67-
1.42 and 5.55-7.68 g/L with mean values 0.43±0.07, 0.18±0.01, 1.04±0.25 and 6.40±0.75, respectively.
The major cations exhibited as the following order; Na+
>Mg+2
>Ca+2
>K+
. Chloride and sulphate
concentrations ranged from 10.33-14.80 (mean 11.95±1.33) g/L and 4.19-6.15 (5.30±0.66) g/L,
respectively. The major anions exhibited as the following order; Cl-
>SO4
-2
.Sulphate was found to be
higher than the permissible limit (200 mg/L), this returns to the intrusion of drainage and agricultural
wastewater together with modifications observed in environment and climate (Edwards and Withers,
[48]).
Applying Hydrogen32 program to water samples; the output data indicated that the salts which
composed the TDS in the studied samples were NaCl (72.06±2.22%), MgSO4 (16.91±0.52%), Na2SO4
(4.79±2.95%), CaSO4 (3.62±2.19%), Ca(HCO3)2+CaCO3 (1.34±1.06%), KCl (1.27±0.11%) and others
(0.1%). On the same line, Mansour et al.,[7] found that the salts composing the TDS in lake water were
NaCl (61%), MgSO4 (17.9%), Na2SO4 (12.4%), CaSO4 (3.6%), Ca(HCO3)2, CaCO3 (0.2%) and others
(1.8%).
Page 8
International Water Technology Journal, IWTJ Vol. 3, No. 4, December 2013
177
3.2. Trace Elements in Water and Fish Tissues
The results of trace elements in water samples were compared with US EPA, [49] (United States
Environmental Protection Agency); National recommended water Quality Criteria, while in fish samples
were compared with WHO, [50]; Evaluation of certain food additives and contaminates.
Trace elements in natural water occur in particulate or soluble form. Soluble species include labile and
non-labile fractions. The labile metal compounds are the most dangerous to fish. The presence of trace
elements inside the fish tissues is often affected by many external and internal factors. Metals
concentration is correlated with ambient metals level in the surrounding environment, the available metal
form in water, the structure of the target organ as well as the interaction between the metal and this organ
(EL-Naggar et al., [51]). Generally, the higher metal concentration in the environment, the more may be
taken up and accumulated by fish. The metal level is related to its waterborne concentration only if metal
is taken up by the fish.
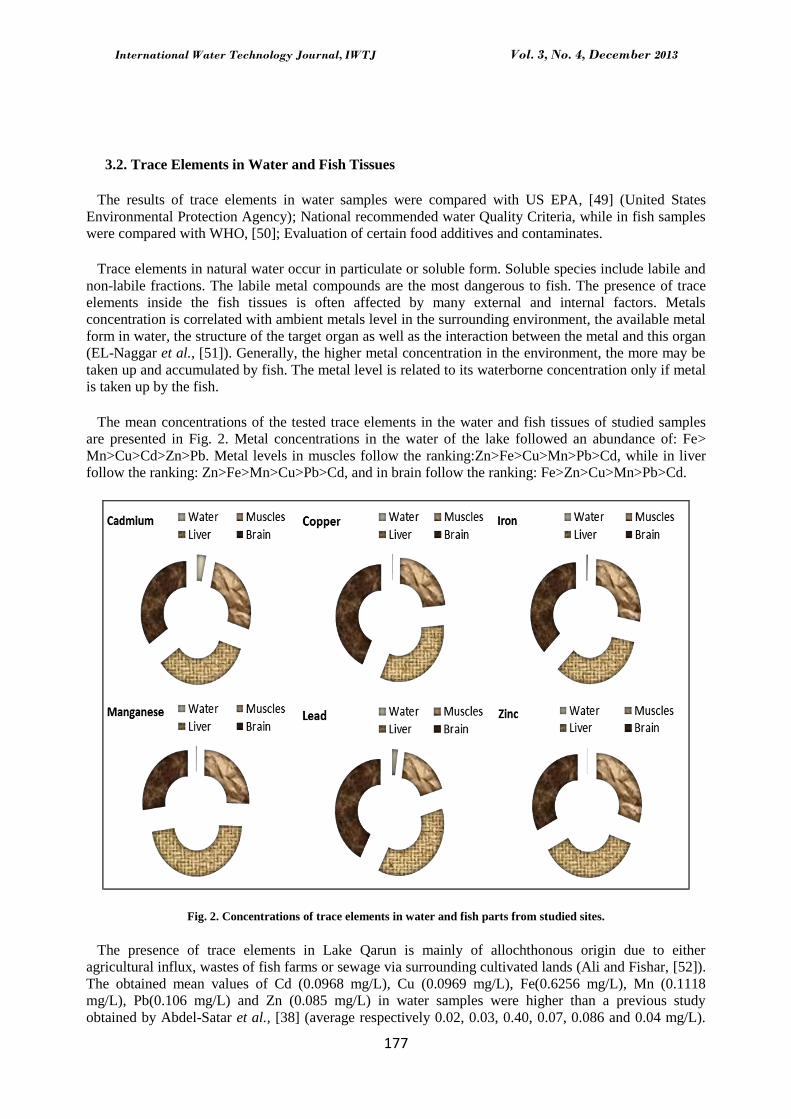
The mean concentrations of the tested trace elements in the water and fish tissues of studied samples
are presented in Fig. 2. Metal concentrations in the water of the lake followed an abundance of: Fe>
Mn>Cu>Cd>Zn>Pb. Metal levels in muscles follow the ranking:Zn>Fe>Cu>Mn>Pb>Cd, while in liver
follow the ranking: Zn>Fe>Mn>Cu>Pb>Cd, and in brain follow the ranking: Fe>Zn>Cu>Mn>Pb>Cd.
Fig. 2. Concentrations of trace elements in water and fish parts from studied sites.
The presence of trace elements in Lake Qarun is mainly of allochthonous origin due to either
agricultural influx, wastes of fish farms or sewage via surrounding cultivated lands (Ali and Fishar, [52]).
The obtained mean values of Cd (0.0968 mg/L), Cu (0.0969 mg/L), Fe(0.6256 mg/L), Mn (0.1118
mg/L), Pb(0.106 mg/L) and Zn (0.085 mg/L) in water samples were higher than a previous study
obtained by Abdel-Satar et al., [38] (average respectively 0.02, 0.03, 0.40, 0.07, 0.086 and 0.04 mg/L).
Page 9
International Water Technology Journal, IWTJ Vol. 3, No. 4, December 2013
178
These results reflect that the anthropogenic influences rather than natural environment of the water may
be the main reasons (WasimAktar et al., [53]). Cd, Cu, Mn and Pb mean values were higher than the
permissible limits (0.01, 0.09, 0.1 and 0.1 mg/L) of (USEPA, [49]), but Fe and Zn were within that
permissible limit (1.00 and 0.12 mg/L).
Speciation of trace metals using Visual MINTEQ program showed that 0.005 to 0.008 mg/L of Cd is
present as free ions, while from 0.00001 to 0.00007 mg/L as inorganic species and from 0.074 to 0.100
mg/L as organic species. Cu free ion ranged from 0.003 to 0.011 mg/L, inorganic species ranged from
0.0004 to 0.0038 mg/L and organic species ranged from 0.080 to 0.104 mg/L. Mn free ions ranged from
0.048 to 0.087 mg/L, inorganic species ranged from 0.035 to 0.064 mg/L and organic species at less than
0.00001. Pb free ions ranged from 0.002 to 0.014 mg/L, inorganic species ranged from 0.050 to 0.154
mg/L and organic species ranged from 0.001 to 0.01 mg/L. This showed that the highest concentration of
Cd, Cu, Mn and Pb were present in water in non-toxic form, so that these elements did not show any
toxic effect on fish tissues.
The higher concentrations of trace elements were found in fish tissues than the surrounding
environment (water), Fig. 2; according to McCarthy and Shugart, [54] was due to fish may absorb
dissolved elements and then accumulate them in various tissues in significant amounts above those found
in their environment, thus exhibiting elicited toxicological effects. Similarly Chale, [55] recorded that
concentrations of trace elements in fish tissues were always higher than that of water.
The lower concentrations of Cd, Cu, Fe, Mn, Pb and Zn were recorded in the fish muscles, while the
higher values were in the liver or brain, Fig. 2. These findings are in agreement with those obtained by
Duralet al.[56] and Alhas et al.[57]. The accumulation of metals in fish tissues (muscles,liver and brain)
may be due to the fact that ,the lake receives heavy load of organic and non-organic pollutants’ via
several agricultural drains, domestic and waste water in addition to the industrial effluents. On the other
hand, this bioaccumulation might be correlated with fat-content in tissues and its great affinity to
combine with trace elements. The lowest concentrations of metals were found in muscle tissues than liver
and brain; this may due to the little blood supply to the muscular tissues (Shenouda et al., [58]) and
related to lower metabolic activities of muscle. The muscles showed considerable amounts of metals.
Thismay be correlated with fat-content in muscle tissues and its great affinity to combine with heavy
metals (Shenouda et al.[58]). High concentrations of metals as Cd, Cu, Mn, and Znin the liver are related
to detoxification processes that take place in this organ (Celechovska et al., [59]) and related to its role as
storage organ (Satsmadjis et al., [60]). The highest value of Pb was found in the brain tissue; lead have a
special affinity for brain as lead accumulation is high in this tissue (Tulasi et al., [61]; Allen et al., [62]).
Lead was found to inhibit the acetyl cholinesterase in fish on the other hand, cadmium affected on
enzyme activities and membrane integrity (Cicik et al., [63]). In muscles and liver, the concentrations of
Cd, Cu, Fe and Zn are higher than the permissible level for Cd (0.5 mg/kg), Cu (5 mg/kg), Fe (5 mg/kg)
and Zn (40 mg/kg), while in brain Cd, Cu, Fe, Pb (>2 mg/kg) and Zn are higher than the permissible limit
recommended by WHO, [50]. Mn concentrations in muscles, liver and brain are within the recommended
limit 100 mg/kg (WHO, [50]).
The presence of trace elements inside the fish tissues is often affected by many external and internal
factors. Metals concentration is correlated with ambient metals level in the surrounding environment, the
available metal form in water, the structure of the target. In the present study, regression equation
between total metal contents in fish tissues (muscles, liver and brain) and activity of metal in water
samples are shown in Table 3. Levels of metals in fish parts (muscles, liver and brain) were highly
comparable with those of water; activities of metal concentrations in water are the major factor, being
correlated positively with metals in fish parts, Table 3. In addition, water pH, correlated negatively with
metals in fish muscles for Cd, Cu, Mn and Pb, liver for Cd, Cu, Fe, Mn and Pb, played an important role
in governing metal uptake by fish tissues.
The coefficient of activity of metal in water is highly significant (P<0.01) for Cd (liver), Cu (liver), Fe
(muscles and liver), Mn (muscles and liver), Pb (muscles and liver) and Zn (muscles and liver) with total
metals in fish parts. The coefficients of activity of metals are significant (P<0.05) for Cd in muscles and
Page 10
International Water Technology Journal, IWTJ Vol. 3, No. 4, December 2013
179
Pb in brain. These data indicated that there is a tendency for the Tilapia Zilli to equilibrate with the water
of Qarun Lake under given Physico-chemical conditions prevailing in the media.
Table 3. Regression equation between activity of trace elements in water samples and their total
concentration in fish tissues.
Muscles
log Cdtotal
0.6 0.06 Cd ctivity in water 0.04 pH R2= 0.73
log ntotal 3. 4 0. 4 n ctivity in water - 0. pH R2= 0.97
log total . 6 0. 6 ctivity in water 0.0 pH R2= 0.81
log ntotal 2.3 0. n ctivity in water R2= 0.37
Liver
log Cd total
. 4 0. 2 Cd ctivity in water - 0.025 pH R2= 0.72
log Cutotal
2.0 0.0 Cu ctivity in water - 0.05 pH R2= 0.97
log etotal . 0.00 e ctivity in water - 0.026 pH R2= 0.98
log ntotal 2.24 0.0 n ctivity in water - 0.0 pH R2= 0.95
log total .42 0.006 ctivity in water - 0. 3 pH R2= 0.87
log ntotal 2.2 0. n ctivity in water R2= 0.87
Brain
log total 2.0 - 0.2 ctivity in water R2= 0.56
3.3. Pesticides Residue in Water and Fish
The results of recovery experiment range from 85.1 to 99.3 % in water, the analytical procedures
outlined for OCPs assessment in this study are adjudged reliable, reproducible and efficient. The range of
response factors of 0.657 to 1.892 showed that separation efficiency of the GCECD equipment used for
the identification and quantification of OCPs. The limit of detection (LOD) values for the OCPs ranged
from 0.056 to 2. 0 μg/L. The percentage relative standard deviation (%RSD) values for the recoveries of
OCPs in water ranged from 2.63 to 5.59 %. These values showed that precision was better than 10 %
RSD.The average recovery percentages of OPPs for fortified samples were determined and calculated for
all OPPs. The overall mean of recovery percentages was found to be 85.6%, and 89.2% for water, and
fish samples, respectively. All data were corrected according to the recovery percentage values.
Pesticide residues in different components out of 26 pesticides subjected to identification and
determination in water and fish samples collected from the studied ecosystems. OC pesticides are higher
than OP pesticides with respect to each water sample; Fig. 3 (A, B, C and D), because OC pesticides are
resistant to microbial and photolytic degradation, and are therefore persistent in the environment (soil and
water) where they are applied, while the OP pesticides are readily deactivated and degraded by microbial
activities. This is consistent with Saad et al., [26] they found that organophosphorus compounds are
quickly degradable in aquatic environment where the alkaline media accelerates their degradation.
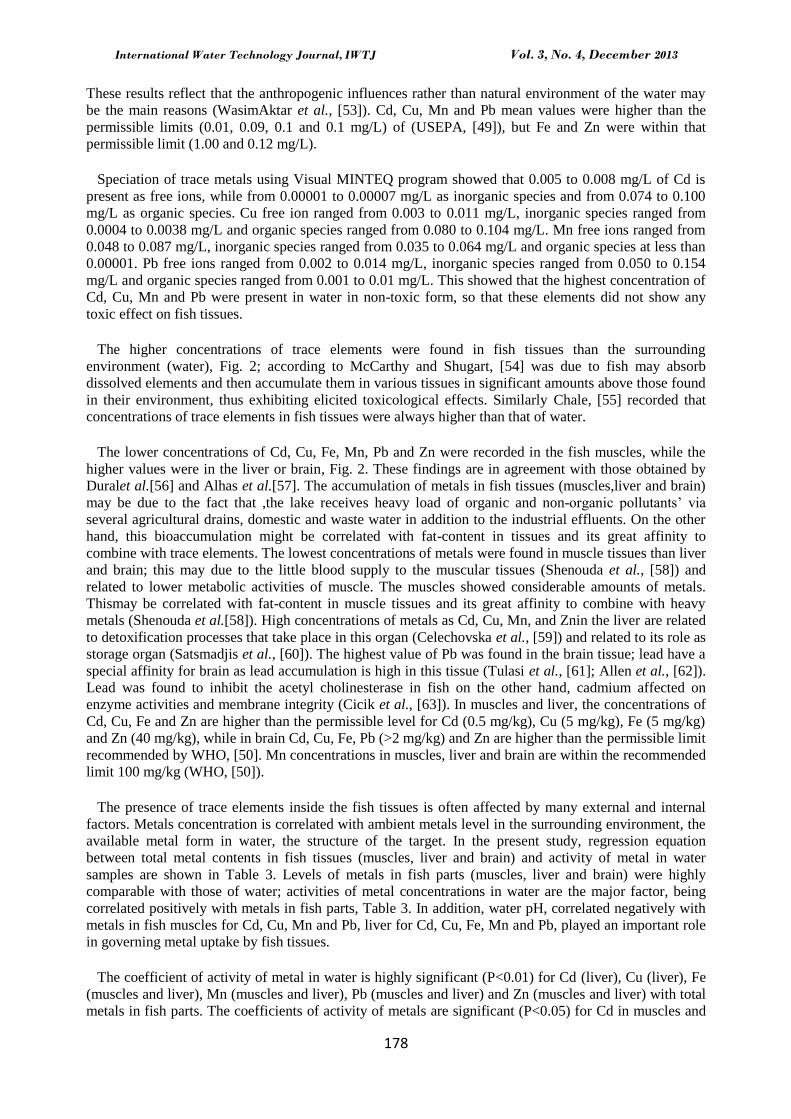
Thirteen different OCPs were found in water, muscles, liver and brain; the highest average level
elonged to β-BHC (14.89±0.57 µg/L), PP-DDD (62.71±8.95 µg/kg), endrin (52.82±2.59 µg/kg), and
endrin (102.88±3.42 µg/kg) The lowest were aldrin (0.29±0.04 µg/L), aldrin (< 0.1µg/kg), aldrin
(0.76±0.10 µg/kg), and aldrin (0.44±0.04 µg/kg), respectively.
OC pesticides found in Lake Qarun water, Fig. 3 (A), are α-BHC, γ-BHC, β- -BHC, heptachlor,
aldrin, hepta-epoxide, γ-Chlordane, pp-DDE, endrin, PP-DDD, OP-DDT and PP-DDT at a mean
concentration values are 1.39, 6.21, 14.89, 1.00, 3.27, 1.02, 0.29, 0.84, 1.52, 3.37, 0.92, 10.81, 1.23 and
2.40 µg/L, respectively. The order of OC pesticides concentration in water samples is β-BHC> PP-DDD>
Page 11
International Water Technology Journal, IWTJ Vol. 3, No. 4, December 2013
180
γ- -BHC> PP-DDT> γ-Chlordan> α-BHC> OP-DDT> Heptachlor> Endrin> Hepta-epoxide >
Aldrin.
Fig. 3. Minimum, maximum and mean values of different OCPs in water samples (n=9); where A: in water, B in muscle,
C in liver, and D in Brain.
0.1
1
10
100
α-B
HC
γ-B
HC
β-B
HC
-BH
C
Hep
tach
lor
Ald
rin
Hep
ta-e
po
xid
e
γ-C
hlo
rdan
PP
-DD
E
End
rin
PP
-DD
D
OP
-DD
T
PP
-DD
T
Co
nc
(µg/
L)
OCPs
A Minimum Maximum Mean
0.1
1
10
100
α-B
HC
γ-B
HC
β-B
HC
-BH
C
Hep
tach
lor
Ald
rin
Hep
ta-
epo
xid
e
γ-C
hlo
rdan
PP
-DD
E
End
rin
PP
-DD
D
OP
-DD
T
PP
-DD
T
Co
nc
(µg/
kg)
OCPs
B Minimum Maximum Mean
0.1
1
10
100
α-B
HC
γ-B
HC
β-B
HC
-BH
C
Hep
tach
lor
Ald
rin
Hep
ta-
epo
xid
e
γ-C
hlo
rdan
PP
-DD
E
End
rin
PP
-DD
D
OP
-DD
T
PP
-DD
T
Co
nc
(µg/
kg)
OCPs
C Minimum Maximum Mean
0.1
1
10
100
1000
α-B
HC
γ-B
HC
β-B
HC
-BH
C
Hep
tach
lor
Ald
rin
Hep
ta-
epo
xid
e
γ-C
hlo
rdan
PP
-DD
E
End
rin
PP
-DD
D
OP
-DD
T
PP
-DD
T
Co
nc
(µg/
kg)
OCPs
D Minimum Maximum Mean
Page 12
International Water Technology Journal, IWTJ Vol. 3, No. 4, December 2013
181
OC pesticides found in muscles, Fig. 3(B) are α-BHC, γ-BHC, β- -BHC, heptachlor, aldrin,
hepta-epoxide, γ-Chlordane, pp-DDE, Aldrin, PP-DDD, OP-DDT and PP-DDT with mean values are
0.90. 7.35, 38.49, 9.96, 7.01, <0.1, 9.31, 25.26, 40.17, 51.43, 62.71, 36.83 and <0.1 µg/kg, while in liver.
Fig. 3(C) are 13.25, 13.34, 42.59, 16.37, 7.74, 0.76, 12.08, 28.59, 52.82, 94.75, 84.55, 62.11 and 1.07
µg/kg and in brain, Fig. 3(D), are 10.19, 15.84, 49.37, 13.39, 9.11, 0.44, 12.72, 35.38, 57.80, 102.88,
81.34, 46.57 and 0.72 µg/kg. The total OCPs were higher in liver and brain of fish samples than that
which was in the water samples; that is as result of the higher pollution level in that lake and, therefore,
leading to a higher bio-accumulation of pesticides in the fish samples, Fig. 3. The difference in patterns
of these contaminants in brain, liver and muscles tissue may reflect difference in contaminant
metabolism, content and composition of lipids, or the degree of blood perfusion in the various tissues
(Metcalfe et al., [64]). Aldrin, dieldrin, chlordane, DDT, TDE, DDE, heptachlor, heptachlor epoxide in
fish were lower than the permissible limit 0.3, 0.3, 0.3, 5, 5, 5, 0.3, 0.3 mg/kg recommended by Food
Advisory Committee FDA, and EPA,[65].
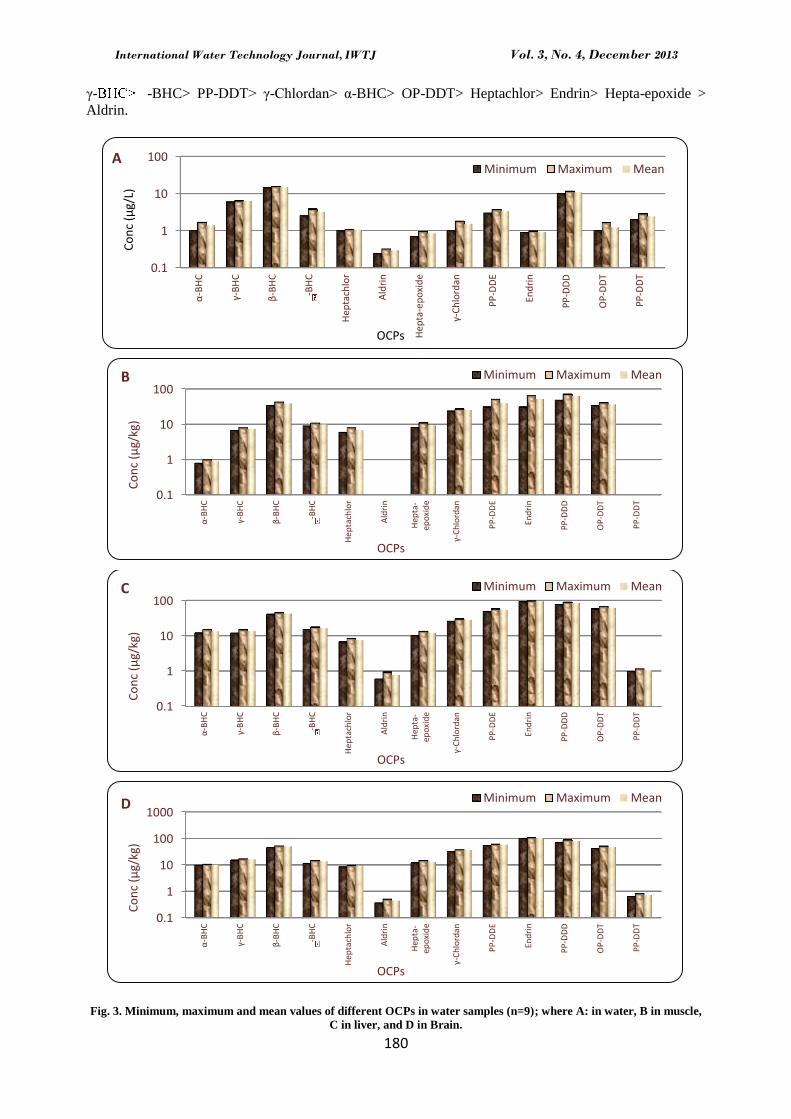
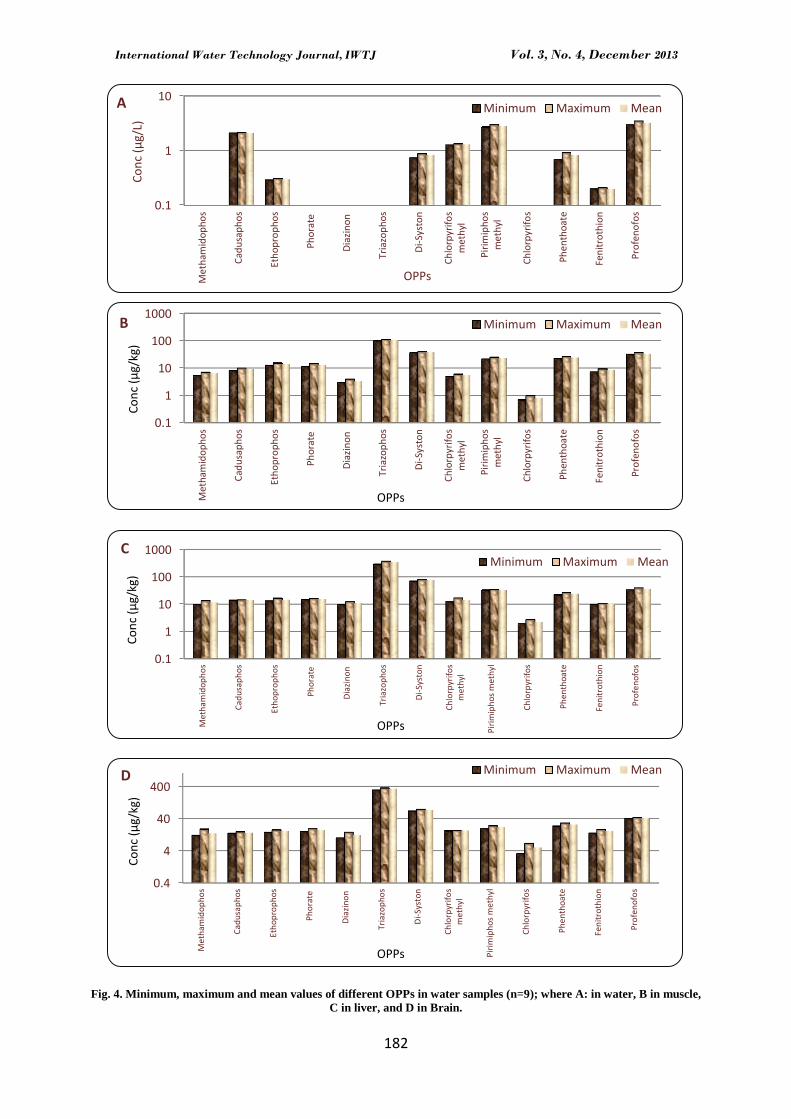
OP pesticides in water and fish tissue: OP pesticides such as cadusaphos, ethoprophos, Di-Syston,
chlorpyrifos methyl, pirimiphos methyl, chlorpyrifos, phenthoate, fenitrothion and profenofos are found
in water samples at concentration 2.12, 0.3, 0.83, 1.31, 2.85, 0.04, 0.83, 0.20 and 3.24 µg/L, respectively,
Fig. 4 (A). While methamidophos, phorate diazinon, and triazophos showed undetectable concentrations
of the analysed OP pesticides. The order of OPPs concentration in water samples was
profenofos>pirimiphos methyl>cadusaphos>chlorpyrifos methyl>phenthoate> Di-
Syston>ethoprophos>fenitrothion>chlorpyrifos.
In fish tissues, Fig. 4(B, C, and D), OPPs found are methamidophos, cadusaphos, ethoprophos, phorate,
diazinon, triazophos, Di-Syston, chlorpyrifos methyl, pirimiphos methyl, chlorpyrifos, phenthoate,
fenitrothion and profenofos at a mean value 6.38, 9.25, 14.02, 12.83, 3.28, 103.20, 38.01, 5.45, 23.27,
0.81, 24.36, 8.54 and 33.13 µg/kg, respectively, in muscles. The order of OP pesticides concentration in
muscles was triazophos > Di-Syston > profenofos > phenthoate > pirimiphos methyl > ethoprophos >
cadusaphos > fenitrothion > methamidophos > chlorpyrifos methyl > diazinon > chlorpyrifos. In liver the
concentrations of methamidophos, cadusaphos, ethoprophos, phorate, diazinon, triazophos, Di-Syston,
chlorpyrifos methyl, pirimiphos methyl, chlorpyrifos, phenthoate, fenitrothion and profenofos are 11.48,
14.16, 14.57, 15.252, 11.21, 342.46, 74.27, 14.34, 33.72, 2.25, 24.16, 10.38 and 36.13 µg/kg,
respectively. The order of OP pesticides concentration in liver was triazophos > Di-Syston > profenofos
> pirimiphos methyl> phenthoate > phorate > ethoprophos > chlorpyrifos methyl > cadusaphos >
methamidophos > diazinon> fenitrothion > chlorpyrifos. While in brain the concentrations of
methamidophos, cadusaphos, ethoprophos, phorate, diazinon, triazophos, Di-Syston, chlorpyrifos methyl,
pirimiphos methyl, chlorpyrifos, phenthoate, fenitrothion and profenofos are 13.94, 14.62, 16.43, 17.81,
12.19, 339.67, 74.25, 17.06, 22.04, 5.06, 25.96, 16.64 and 41.82 µg/kg, respectively. The order of OP
pesticides concentration in brain was triazophos > Di-Syston>profenofos > phenthoate > pirimiphos
methyl > phorate > chlorpyrifos methyl > fenitrothion >ethoprophos> cadusaphos > methamidophos >
diazinon > chlorpyrifos.
Linear regression data on multiple OCPs relationships in water and liver were recorded in Table 4. No
correlations were significant between different types of OCPs in water and muscles and brain. The
coefficient of activity of OCPs in water is highly significant ( <0.0 ) for α-BHC and Hepta-epoxide and
significant (p<0.05) for γ-BHC, with their concentrations in liver samples. For OPPs, correlation
matrixes were recorded for cadusaphos, Di-Syston, pirimiphos methyl, fenitrothion, and profenofos
between their concentration in water and liver tissue. The coefficient of activity of OPPs in water is
highly significant (P<0.01) for Pirimiphos methyl and significant (p<0.05) for Di-Syston, Fenitrothion,
and Profenofos, with their concentrations in liver samples. These mean that cadusaphos, Di-Syston,
Pirimiphos, Fenitrothion, and Profenofos are strongly correlated with the same OPPs in water and fish
liver and it shares a common origin with them in water and liver.
Page 13
International Water Technology Journal, IWTJ Vol. 3, No. 4, December 2013
182
Fig. 4. Minimum, maximum and mean values of different OPPs in water samples (n=9); where A: in water, B in muscle,
C in liver, and D in Brain.
0.1
1
10
Met
ham
ido
ph
os
Cad
usa
ph
os
Eth
op
rop
ho
s
Ph
ora
te
Dia
zin
on
Tria
zop
ho
s
Di-
Syst
on
Ch
lorp
yrif
os
met
hyl
Pir
imip
ho
sm
eth
yl
Ch
lorp
yrif
os
Ph
enth
oat
e
Fen
itro
thio
n
Pro
fen
ofo
s
Co
nc
(µg/
L)
OPPs
A Minimum Maximum Mean
0.1
1
10
100
1000
Met
ham
ido
ph
os
Cad
usa
ph
os
Eth
op
rop
ho
s
Ph
ora
te
Dia
zin
on
Tria
zop
ho
s
Di-
Syst
on
Ch
lorp
yrif
os
met
hyl
Pir
imip
ho
sm
eth
yl
Ch
lorp
yrif
os
Ph
enth
oat
e
Fen
itro
thio
n
Pro
fen
ofo
s
Co
nc
(µg/
kg)
OPPs
B Minimum Maximum Mean
0.1
1
10
100
1000
Met
ham
ido
ph
os
Cad
usa
ph
os
Eth
op
rop
ho
s
Ph
ora
te
Dia
zin
on
Tria
zop
ho
s
Di-
Syst
on
Ch
lorp
yrif
os
met
hyl
Pir
imip
ho
s m
eth
yl
Ch
lorp
yrif
os
Ph
enth
oat
e
Fen
itro
thio
n
Pro
fen
ofo
s
Co
nc
(µg/
kg)
OPPs
C Minimum Maximum Mean
0.4
4
40
400
Met
ham
ido
ph
os
Cad
usa
ph
os
Eth
op
rop
ho
s
Ph
ora
te
Dia
zin
on
Tria
zop
ho
s
Di-
Syst
on
Ch
lorp
yrif
os
met
hyl
Pir
imip
ho
s m
eth
yl
Ch
lorp
yrif
os
Ph
enth
oat
e
Fen
itro
thio
n
Pro
fen
ofo
s
Co
nc
(µg/
kg)
OPPs
D Minimum Maximum Mean
Page 14
International Water Technology Journal, IWTJ Vol. 3, No. 4, December 2013
183
Table 4. Regression equation between OCPs and OPPs in water and liver tissue.
OCPs
α-BHCliver
.54 3.3 α-BHC water
R2= 0.74
γ BHCliver
.66 3.55 γ BHC water
R2= 0.46
Hepta epoxideliver
5.6 .64 Hepta epoxide water
R2= 0.62
OPPs
Cadusaphosliver
- .4 0 Cadusaphos water
R2= 0.43
Di Systonliver
2 .6 54.0 Di Syston water
R2= 0.55
irimiphosliver
2.4 .50 irimiphos water
R2= 0.77
enitrothionliver .65 5 . enitrothion water R2= 0.44
rofenofosliver 2.44 .3 rofenofos water R2= 0.38
3.4. Bioaccumulation Factor (BAF):
Bioaccumulation factor (BAF) gives an indication about the accumulation efficiency for any particular
pollutant in any fish organ. BAF is the ratio between the accumulated concentration of a given pollutant
in any organ and its dissolved concentration in water and it was calculated according to Neuhauser et al.,
[66]; AbdAllah and Moustafa [67]; Authman and Abbas [68] using the following formula:
(
)
(
)
The Waste Minimization Prioritization Tool (WMPT) is a scoring system that was developed to rank
chemicals based on their persistence (P), bioaccumulation potential (B), and human (HT) and ecological
toxicity (ET). Chemicals are given a score of 1 (low concern), 2 (medium concern), or 3 (high concern)
for P, B, and HT or ET. A score of 1 is assigned to BCF or BAF values less that 250; a score of 2 is
assigned for BCF or BAF values from 250 to 1000; and a score of 3 is assigned for BCF or BAF values
exceeding 1000 (Drexler et al., [69]).BAF values for trace elements in fish muscles, brain and liver were
calculated using the above equation then compared to WMPT scoring system.
The bioaccumulation factor (BAF) of the studied metals, OCPs and OPPs showed that, the muscles of
the studied fish maintained the lowest values. However, the highest values of BAF were found in the
liver and brain, Fig. 5 (A, B, and C).
The mean values for BAF in muscle were 8, 229, 67, 185, 34, 605, 0.61, 1.17, 2.4, 2.85, 6.97, 10.22,
14.39, 11.6, 64.11, 64.11, 6.00, 34.74, 4.55, 46.4, 44.44, 4.21, 8.29, 20.75, 27.77, 44.7 and 10.02 for
cadmium, copper, iron, manganese, lead, zinc, α-BHC, γ-BHC, β- -BHC, heptachlor, hepta-
epoxide, γ-Chlordane, pp-DDE, endrin, PP-DDD, OP-DDT and PP-DDT, cadusaphos, ethoprophos, Di-
Syston, chlorpyrifos methyl, pirimiphos methyl, chlorpyrifos, phenthoate, fenitrothion and profenofos. In
Liver, the mean values for BAF were 11, 320, 85, 300, 59, 738, 8.74, 2.11, 2.81, 4.79, 7.8, 2.57, 14.31,
16.22, 15.03, 103.63, 7.91, 59.57, 0.47, 6.66, 49.03, 86.01, 10.80, 11.82, 52.50, 27.44, 52.85 and 10.92
and in brain were 11, 424, 98, 203, 54, 650, 6.76, 2.5, 3.57, 3.95, 9.13, 1.47, 14.34, 20, 16.78, 114.04,
7.62, 0.3, 6.76, 55.87, 88.3, 13.04, 7.98, 125.00, 29.22, 86.7 and 12.65 for α-BHC, γ-BHC, β- -
BHC, heptachlor, aldrin, hepta-epoxide, γ-Chlordane, pp-DDE, endrin, PP-DDD, OP-DDT and PP-DDT,
cadusaphos, ethoprophos, Di-Syston, chlorpyrifos methyl, pirimiphos methyl, chlorpyrifos, phenthoate,
fenitrothion, and profenofos, respectively.
Page 15
International Water Technology Journal, IWTJ Vol. 3, No. 4, December 2013
184
Fig. 5. Bioaccumulation factor for trace elements (A), organochlorine pesticides(B) andorganophosphorus pesticides (C).
Comparing the data outlined in Fig. 5 for BAF with WMPT tool shows that manganese (muscles and
brain), lead (muscles, liver and brain), cadmium (muscles, liver and brain), iron (muscles, liver and
brain), copper (muscles) were given score 1 since their BAF values were less than 250, while Mn (liver),
zinc (muscles, liver and rain) and copper (liver and rain) were given score 2; it’s B values fall
Muscles
1
10
100
1000
Cad
miu
m
Co
pp
er
Iro
n
Man
gan
ese
Lead
Zin
c
Bio
accu
mu
lati
on
Fac
tor
(BA
F)
Trace elements
A Liver Brain Score 1 <250 Score 2 (250-1000)
Muscles
0.3
3
30
300
α-B
HC
γ-B
HC
β-B
HC
-BH
C
Hep
tach
lor
Ald
rin
Hep
ta-e
po
xid
e
γ-C
hlo
rdan
PP
-DD
E
End
rin
PP
-DD
D
OP
-DD
T
PP
-DD
TBio
accu
mu
lati
on
Fac
tor
(BA
F)
OCPs
B Liver Brain Score 1 <250 Score 2 (250-1000)
Muscles
0.3
3
30
300
Me
tham
ido
ph
os
Cad
usa
ph
os
Eth
op
rop
ho
s
Ph
ora
te
Dia
zin
on
Tria
zop
ho
s
Di-
Syst
on
Chlorpyrifos…
Pirim
iphos…
Ch
lorp
yrif
os
Ph
enth
oat
e
Fen
itro
thio
n
Pro
fen
ofo
sBio
accu
mu
lati
on
Fac
tor
(BA
F)
OPPs
C Liver Brain Score 1 <250 Score 2 (250-1000)
Page 16
International Water Technology Journal, IWTJ Vol. 3, No. 4, December 2013
185
between 250 and 1000. These results indicated that the affinity of various metals to fish organs may
differ. All different types of OC and OP pesticides were given score 1 because their BAF values were
less than 250.
Organization for Economic Cooperation and Development (OECD) published guidance for classifying
chemicals, which are hazardous to aquatic environments (OECD, [70]). The hazard classification
schemes presented in the guidance incorporate, among other parameters, evidence of bioaccumulation
value greater than or equal to 500 in fish as a basis for hazard ranking. Comparing the data in Fig. 5 with
OECD ranking; the results refer to cadmium, copper, manganese, lead, iron, OCPs and OPPs are safe
ranking, while zinc is considered hazard ranking.
4. CONCLUSION
The study of physical and chemical characteristics of water gives a considerable insight on water
quality and on Tilapia Zilli quality for human use. The Lake was turbid, saline and salts composed the
TDS of water Lakewere NaCl (72.06±2.22%), MgSO4 (16.91±0.52%), Na2SO4 (4.79±2.95%), CaSO4
(3.62±2.19%), Ca(HCO3)2+CaCO3 (1.34±1.06%), KCl (1.27±0.11%) and others (0.1%).Visual MINTEQ showed that the studied trace elements were found in non-toxic form.
Trace elements concentration in Tilapia Zilli, generally higher levels were found in liver and brain and
lower levels were recorded in muscles. The BAF indicated that the studied trace elements, OPPs and
OCPs were in low to medium concentration in fish tissues. Cadmium, copper, iron, manganese, lead,
OCPs and OPPs are safe compared to Organization for Economic Cooperation and Development
(OECD), while zinc is hazard ranking.
This study also examined the use of a linear regression method as a technique for finding the dominant
factors affecting metal uptake by fish tissues, and for predicting metal concentrations in fish tissues. The
results showed activity of metal in water is the dominant factor influencing metal levels in muscles, liver
and brain (only for Pb). Other factor as pH is contributed to the prediction of concentration in some
cases. or OC s (α-BHC, γ-BHC and hepta-epoxide) and OPPs (cadusaphos, Di-Syston, pirimiphos,
fenitrothion, and profenofos) their concentration in liver depends on their concentration in water
sampleThese data indicated that there is a tendency for the Tilapia Zilli to equilibrate with the water of
Qarun Lake under given physico-chemical conditions prevailing in the media.
5. RECOMMENDATIONS:
The results of this study recommend implementation of all articles of the law regarding the protection
of lakes and aquatic environment from pollution and treatment of wastewater before discharging into
Qarun Lake.There is a need for constant monitoring for water quality of Qarun Lake in order to record
any change in the quality and mitigate the outbreak of health problems and the adverse impact on the
aquatic ecosystem since the Lake serves as source of fish for local inhabitants in that area
ACKNOWLEDGMENT: The authors are sincerely thankful to Prof. Dr. M. Mokhtar, director of
Central Laboratory for Environmental Water Quality, National Water Research Centerfor her helpful
comments about water quality during this work.Many thanks also to Prof. Dr. Mostafa Abdel-Aly Nasef,
Professor at Soils, Water and Environmental Res. Inst., Agric. Res. Center, Giza, Egypt for his help,
facilities, and encouragement during executing this work.
Page 17
International Water Technology Journal, IWTJ Vol. 3, No. 4, December 2013
186
REFERENCES
[1]Egyptian Company for Salts and Minerals (EMISAL); Proceeding of the First Symposium on
Qarun Lake, the Egyptian Company for Salts and Minerals, Fayoum, Egypt (April8,1995:176,in
Arabia) ,1995.
[2]Abdel-Satar, A.M., Elewa A.A., Mekki A.K.T. and Gohar M.E., Some Aspects on Trace
Elements and Major Cations of Lake Qarun Sediment Egypt. Bull Fac. Sci. Zagazig Univ. Egypt,
25:77-97, 2003.
[3]Anwar, S.M., El-Shafy, A.A., El-Serafy, S.S., Ibrahim, I.I. and Ali, E.A., Accumulation of Trace
Eelements in Fish at Lake Qarun as a Biomarker of Environmental Pollution, Journal of the
Egyptian German Society of Zoology, 36(A): 443-461, 2001.
[4] Ali, F.K., El-Shafai, S.A., Samhan, F.A. and Khalil, W.K.B., Effect of Water Pollution on
Expression of Immune Response Genes of Solea aegyptiaca in Lake Qarun. African J
Biotechnology, 7(10): 1418- 1425, 2008.
[5]Al-Yousuf, M.H., El-Shahawi, M.S. and Al-Ghais, S.M., Trace Metals in Liver, Skin and Muscle
of Lethrimus lentjan Fish Species in Relation to Body Length and Sex. The Science of the Total
Environment, 256: 87-94, 2000.
[6]Abou El-Gheit, E.N., Abdo, M.H. and Mahmoud, S.A., Impact of Blooming Phenomenon on
Water Quality and Fishes in Qarun Lake, Egypt, International J of Environmental Science and
Engineering (IJESE), 3: 11-23, 2012.
[7]Mansour, S.A., Messeha, S.S. and Sidky, M.M., Ecotoxicological Studies I. Qualitative and
Quantitative Determination of Salt Composition in Lake Qarun Water and Its Sources. Egypt. J
Aquat. Biol. Fish, 4: 271-303., 2000
[8]Lemly, A. D., Identifying and Reducing Environmental Risks from Agricultural Irrigation
Drainage in Developing Countries. In S.A. Mansour, (Ed.), Proc. 3rd Cong. Toxicol. Dev.
Count., Cairo, Egypt 19–23 November, 1995. (Vol. III, pp. 177–90), 1996.
[9]Lemly, A. D., Finger, S. E. and Nelson, M. K., Sources and Impacts of Irrigation Drain Water
Contaminants in Arid Wetlands. Environmental Toxicology and Chemistry, 12, 2265–2279,
1993.
[10]Micklin, P.P., Desiccation of the Aral Sea: A Water Management Disaster in the Soviet Union.
Science, 241, 1170–1174, 1988.
[11]van Schilfgaarde, J., Agriculture, Irrigation and Water Quality. In J. B. Summers, & S. S.
Anderson (Eds.), Toxic Substances in Agricultural Water Supply and Drainage: Defining the
Problems (pp. 173–180). Denver, USA: US Committee on Irrigation and Drainage, 1986.
[12]Zahm, G. R., Kesterson Reservoir and Kesterson National Wildlife Refuge: History, Current
Problems and Management Alternatives. Trans.North Amer. Wildl. Nat. Resour. Conf, 51,
324–329, 1986.
Page 18
International Water Technology Journal, IWTJ Vol. 3, No. 4, December 2013
187
[13]Fujii, R., Water-Quality and Sediment—Chemistry Data of Drain Water and Evaporation Ponds
from Tulare Lake Drainage District, Kings Country, California, March 1985 to March 1986.
Open-File Report 87-700, US Geolog. Surv., Sacramento, CA, 1988.
[14]Neil, J. M., Data for Selected Pesticides and Volatile Organic Compounds for Wells in the
Western San Joaquin Valley, California, February to July 1985. Open-File Report 87-48, US
Geology. Surv., Sacramento, CA, 1987.
[15]Saad, M.A.H. and Hemeda, E.I.H., Distribution of Nutrient Species in Lake Qarun, A Closed
Egyptian Basin. Proceedings of the International Conference on Limnology of Shallow Lakes,
May 25-30, Balatonfűred, Hungary, pp: -309, 2002
[16]Sabae, S.Z. and Ali, M.H., Distribution of Nitrogen Cycle Bacteria in Relation to
Physicochemical Conditions of a Closed Saline Lake (Lake Qarun, Egypt), J. Egypt. Acad. Soc.
Environ. Develop., 5: 145–167, 2004.
[17]Censi, P., Spoto, S.E., Saiano, F., Sprovieri, M. and Mazzola, S., Heavy Metals in Coastal
Water System. A Case Study from the North Western Gulf of Thailand. Chemosphere, 64:
1167-1176, 2006.
[18]Farombi, E.O., Adelowo and Arioso, Biomarkers of Oxidative Stress and Heavy Metal Levels
as Indicator of Environmental Pollution in African (Clarias gariepinus) from Nigeria Ogun
River. International Journal of Environmental Research and Public Health 4: 158-165, 2007.
[19]Kalay, M. and Canli, M.,Elimination of Essential (Cu, Zn) and Non-essential (Cd, Pb) Metals
from Tissues of a Fresh Water Fish, Tillapia zilli. Turk. J. Zool., 24: 429-436, 2000.
[20]Kaoud, H. A. and El-Dahshan, A.R., Bioaccumulation and Histopathological Alterations of the
Heavy Metals in Oreochromis Niloticus Fish. Nature and Science. 8 (4): 147 – 156, 2010.
[21]Birungi, Z.; Masola, B.; Zaranyika, M. F.; Naigaga, I. and Marshall, B., Active Biomonitoring
of Trace Heavy Metals Using Fish (Oreochromis niloticus) as Bioindicator Species. The Case
of Nakivubo Wetland Along Lake Victoria. Physics and Chemistry of the Earth, 32: 1350 –
1358, 2007.
[22]Zia, M.S., Jamil, M., Qasim, M., Rahman, A. and Usman, K., Natural Resources Pollution and
Degradation due to Pesticides Use in Pakistan 12th International conference on Integrated
Diffuse Pollution management (IWA DIPCON 2008), Khon Kaen University, Thailand: 25-29th
August, 2008; P. 226-7, 2008.
[23]Pimentel, D., Amounts of Pesticides Reaching Target Pests; Environmental Impacts and Ethics.
Journal of Agricultural and Environmental Ethics; 8: 17-29; 1995.
[24]Ntow, W.J., Organochlorine Pesticides in Water, Sediment, Crops, and Human Fluids in a
Farming Community in Ghana, Arch. Environ. Contam.Toxicol. 40(4):557-63, 2001.
[25]Osibanjo, O., Biney, C., Calamari, D., Kaba, N., Mbome, I.L., Naeve, H., Ochumba P.B.O. and
Saad, M.A.H., Chlorinated Hydrocarbon Substances. In: Calamari, D. and H. Naeve (Eds.),
Review of Pollution in the African Aquatic Environment, CIFA Technical Paper No. 25. FAO,
Rome, pp: 61-62, ISBN; 92-5-103577-6, 1994.
Page 19
International Water Technology Journal, IWTJ Vol. 3, No. 4, December 2013
188
[26]Saad A.,Abu El-Amayem, M., El-Sebae, A. and Sharaf, I., Occurance and Distribution of
Chemical Pollutants in Lake Maruit, Egypt, Water Air Soil Pollut., 17, 245-252, 1982.
[27]Essumang, D.K.; Togoh G.K. and Chokky L., Pesticides Residues in the Water and Fish
(Lagoon Tilapia) Samples from Lagoons in Ghana, Bull. Chem. Soc. Ethiop; 23(1): 19-27,
2009.
[28]Schlauch, M., Sensitized Photodecomposition of Triazine Herbicides. M. Sc. Thesis, Uni.
Illinois, Urbana, 1989.
[29] Brust, H. F., A Summary of Chemical and Physical Properties of Dursban. Down to Earth
22:21-22, 1966.
[30] Mortland, M.M. and Raman, K.U., Catalytic Hydrolysis of Some Organic Phosphate Pesticides
by Copper (II). Agric. Food Chem. 15:163-167, 1967.
[31]Smith, G. N., Ultraviolet Light Decomposition Studies with Dursban and 3,5,6-trichloro-2-
pyridinol. J. Econ. Entomol. 61:793-799, 1968.
[32] Schaefer, C.H. and Dupras, Jr.E.F., The Effects of Water Quality, Temperature and Light on
the Stability of Organophosphorus Larvicide Used for Mosquito Control. Proc. Pap. Annu.
Conf. Calif. Mosq. Control Assoc. 37:67-75, 1969.
[33] Meikle, B. W., and Youngson ,C. R., Hydrolysis Rate of Dowco 179 in Water. Dow Chemical
Company. Agric. Res. Rep. GS-1154. 6 pp. Walnut Grove Creek, California, 1970.
[34] Haven, P., and Rase, H., Detoxification of Organophosphorus Pesticides Solutions. ACS
Symposium Series 468, Imerging Technologies in Hazardous Waste Management II, June,
1990, Atlantic City, NJ, USA, 1990.
[35] Mansour, S.A. and Sidky, M.M., Ecotoxicological Studies. 3.Heavy Metals Contaminating
Water and Fish from Fayoum Governorate, Egypt. Food Chemistry, 78: 15-22, 2002.
[36] Fathi, A.A. and Flower, R.J., Water Quality and Phytoplankton Communities in Lake Qarun
(Egypt). Aquatic Sciences, 67: 350-362, 2005.
[37] Ali, M.H. and Fishar, M.R.A., Accumulation of Trace metals in Some Benthic Invertebrate and
Fish Species Relevant to their Concentration in Water and Sediment of Lake Qarun, Egypt.
Egypt J. Aquatic Research, 31: 289-301, 2005.
[38] Abdel-Satar, A.M.; Gohar, M.E. and Sayed, M.F., Recent Environmental Changes in Water
and Sediment Quality of Lake Qarun. Egypt. J of Fisheries and Aquatic Sciences, 5(2): 56-69,
2010.
[39] American Public Health Association (APHA), Standard Methods for the Examination of Water
and Wastewater 21st ed., Washington, D.C. Wastewater 21st ed., Washington, D.C, 2005.
[40] EPA, Oxygen, Dissolved (Modified Winkler, Full-Bottle Technique), NPDES, 360.2, 1971.
[41] AOAC: Official Methods for the Association Official Analytical Chemists. 16th Eds, Vol. 1,
(Cunnif, p. Ed), AOAC. Int. Arlington, Virginia, U.S.A, 1995.
Page 20
International Water Technology Journal, IWTJ Vol. 3, No. 4, December 2013
189
[42] Gutafsson, J.P., Visual MINTEQ V.3 beta, Dept. of Land and Water Resources Engineering,
Stockholm, 2010.
[43] Sweden.Popma, T. and Masser, M., Tilapia Life Story and Biology. Southern Regional
Aquaculture Center Publication No. 283, 1999.
[44] El-Sayed, A.F.M., Tilapia Culture. Oceanography Department, Faculty of Science, Alexandria
University, Egypt. CABI Publishing, 2006.
[45] Boyd, C.E., Water Quality in Ponds for Aquaculture. Birmingham Publishing Co.
Birmingham, Alabama, 1990.
[46] Plumb J.A., Infectious Disease of Tilapia. In B.A. Costa-Pierce& J.E. Rakocy (Eds.), Tilapia
Aquaculture in the Americas, 1, 212-228. Baton Rouge, Louisiana: World Aquaculture Society,
1997.
[47]NOAA, National Oceanographic and Atmospheric Administration, Announces an Experimental
Harmful Algal Blooms, Forecast Bulletin for Lake Erie, 2009.
[48]Edwards, A. C. and Withers, P. J. A., Transport and Delivery of Suspended Solids, Nitrogen
and Phosphorus from Various Souries to Fresh Water in the UK. J. Hydrol., 350: 144 – 153,
2008.
[49]US EPA-United States Environmental Protection Agency, National recommended water
Quality Criteria. Office of Water, Office of Science and Technology, 2006 (4304T), pp: 5,
2006.
[50] WHO, Evaluation of certain food additives and contaminates (Forty-first report of joint
FAO/WHO export committee on food Additives). WHO Technical Report Series NO. 837,
WHO, Geneva, 1993.
[51] El-Naggar, A.M.; Mahmoud, S.A. and Tayel, S.I., Bioaccumulation of Some Heavy Metals
and Histopathological Alterations in Liver of Oreochromis Niloticus in Relation to Water
Quality at Different Localities Along the River Nile, Egypt. World Journal of Fish and Marine
Sciences. 1 (2): 105 – 114, 2009.
[52] Ali, M.H. and Fishar, M.R., Accumulation of Trace Metals in Some Benthic Invertebrate and
Fish Species Relevant to their Concentration in Water and Sediment of Lake Qarun, Egypt.
Egypt J. Aquatic Research, 31: 289-301, 2005.
[53] WasimAktar, M., Paramasivam, d.; Ganguly, M.; Purkait, S. and Sengupta, D., Assessment
and Occurrence of Various Heavy Metals in Surface Water of Ganga River around Kolbata: A
Study for Toxicity and Ecological Impact. Environ. Monit. Assess. 10.10071/010661-008-
0688-5, 2008.
[54] McCarthy, J.F. and Shugart, L.R., Biomarkers of Environmental Contamination. Lewis, New
York, p 475, 1990.
[55] Chale, F.M.M., Trace Metal Concentration in Water, Sediments and Fish Tissue from the Lake
Tanganyika. Sci. Total Environ., 299: 115-121, 2002.
Page 21
International Water Technology Journal, IWTJ Vol. 3, No. 4, December 2013
190
[56] Dural, M., Goksu, M., Ozak, A. and Derici, B., Bioaccumulation of Heavy Metals in Different
Tissues of Dicentrachus labrax L., 1758, Sparus aurata L. 1758 and Mugil cephalus, 1758from
the Camlik lagoon of the Eastern Coast of Mediterranean (Turkey). Environ. Monit. And
Assess., 118: 65-74, 2006.
[57] Alhas, E., Oymak, S. and Karaded H., Heavy Metals Concentrations in Two barb, Brbus
xanthopterus and Babus rajanorum mystacous from Ataturk Dam Lake, Turk. Environ. Monit.
Assess., 148(1-4):11-8, 2008.
[58] Shenouda, T.S., Abou-Zaid, F.A., Al-Assuity, A.L. and Abada, A.E., Water Pollution and
Bioaccumulation of the Highly Pollutant Agents in Different Organs of Oreochromis niloticus,
Near Kafr El-Zayat. Proc, ZooI.Soc. A.R.E., 23 (2) :12-25, 1992.
[59] Satsmadjis, J., Geogakopoulos, G.E. and Voutsinou, T.F., Red Mullet Contamination by PCBs
and Chlorinated Pesticides in the Pagassitikos Gulf (Greece), Marine Pollution Bulletin, 19(3):
136-138, 1988.
[60] Tulasi, S.J., Reddy, P.U. and RamanaRao, J.V., Accumulation of Leadand Effects on Total
Lipid Derivatives in the Freshwater Fish Anabas Testudineus. Ecotox. Environ. Safe. 23:33-38,
1992.
[61] Celechovska, O., Svobodova, Z., Ziabek, V., and Macharackova, B., Distribution of Metals in
Tissues of Common Carp (Cyprinus carpio L.). Acta Vet. Brno 2007, 76: S93-S100.
[62] Allen, P., Accumulation Profiles of Lead and the Influence of Cadmium and Mercury in
Oreochromisauereus (Steindachner) during Chronic Exposure. Toxicol. Environ. Chem. 44:
101-112,1994.
[63]Cicik, B., Ay, Ö. and Karayakar, F., Effect of Lead and Cadmium Interactions on the Metal
Accumulation in Tissues and Organs of Nile Tilapia, (Oreochromis niloticus).
Bull.Environ.Contam.Toxicol.,72:141-148, 2004.
[64] Metcalfe, C., Metcalfe, T., Ray, S., Paterson, G. and Koenig, B., Polychlorinated Biphenyls
and Organochlorine Compounds in Brain, Liver, and Muscles of Beluga Whales
(Delphinapterus leucas) from the Arctic and St. Lawrence estuary. Mar. Environ. Res. 47, 1–15,
1999.
[65] FDA (Food Advisory Committee) and EPA, Safety Level in Regulations and Guidance, 3rd
,
2001.
[66] Neuhauser, E.F., Cukic, Z.V., Malecki, M.R., Loehr, R.C. and Durkin, P.R., Bioaccumulation
and Biokienetics of Heavy Metals in the Earth Worm. Environmental Pollution, 89(3):293-301,
1995.
[67] AbdAllah, A.T. and Moustafa, M.A., Accumulation of Lead and Cadmium in the Marine
Prosobranch Nerita saxtilis, Chemical Analysis, Light and Electron Microscopy. Environ
Pollut., 116(2): 185-191, 2002.
[68] Authman, M. and Abbas, H., Accumulation and Distribution of Copper and Zinc in both Water
and Some Vital Tissues of two Fish Species (Tilapia Zilli and Mugil cephalus) of Lake Qarun,
Fayoum Province, Egypt. Pak. J. Biol. Sci., 10: 2106-2122, 2007.
Page 22
International Water Technology Journal, IWTJ Vol. 3, No. 4, December 2013
191
[69] Drexler, J.W., Weis, C. and Brattin, W., Relative Bioavailability of Lead: A Validated in Vitro
Procedure. J. Appl. Toxicol. Submitted, 2003.
[70] Organization for Economic Cooperation and Development (OECD), Classification of Metals
and Metal Compounds. Chapter 7 in: Guidance Document on the Use of the Harmonized
System for the Classification of Chemicals which are Hazardous for the Aquatic Environment.
(OECD Series on Testing and Assessment, Number 27). pp. 97-115. Document
ENV/JM/MONO(2001)8; July 23, 2001. Paris, France, 2001.