66
Water Quality and Sediment Composition Study of the Lake Madison Watershed and Bourne Slough Prepared for Lake County Watershed Improvement Project Madison, South Dakota February 2003
Water Quality and Sediment Composition Study of the Lake Madison Watershed and Bourne Slough Prepared for Lake County Watershed Improvement Project Madison, South Dakota
February 2003
i
Executive Summary
Introduction This report describes the purpose, methods, and results of a study of phosphorus and suspended
solids from the city of Madison storm sewers and phosphorus concentrations in the sediments and
water of Bourne Slough. The study was a contribution to the overall goal of the Lake County
Watershed Improvement Project (LCWIP), which is to reduce phosphorus loading to Lake
Herman/Lake Madison/Brant Lake watershed by 50 percent. The objectives of this study are: (1) to
measure and evaluate phosphorus loading from the City of Madison storm sewers during spring
snowmelt and storm events, and (2) evaluate the Bourne Slough sediments for potential benefit of
dredging of the slough. The City of Madison is the county seat for Lake County. Bourne Slough
receives the inflow from Silver Creek and then drains directly into Lake Madison .
Stormwater Runoff in Madison For this study, the urban area of Madison was delineated into 30 catchments (i.e., drainage areas) and
25 monitoring stations (11 storm sewer outlets; 14 in-stream) were sampled during a spring snowmelt
and three storm events. Water samples were analyzed for total phosphorus, dissolved phosphorus,
soluble reactive phosphorus, and total suspended solids. The spring snowmelt runoff contained
primarily dissolved phosphorus, whereas the larger the storm event, the greater the proportion of
particulate phosphorus. Overall, total phosphorus was highly correlated with total suspended solids.
The average total phosphorus concentration was 0.585 mg/L for all sites. The mean concentrations
for each catchment ranged from 0.278 mg/L to 0.877 mg/L. Phosphorus concentrations from the
storm sewer outlets were not significantly different from the concentrations in the receiving water,
but the storm sewers did contribute a disproportionate amount of particulate phosphorus and
suspended solids. The estimated phosphorus load from all catchments for a normal year of
precipitation (24 inches) is 1445 pounds of phosphorus. On a per acre basis, the catchments with the
greatest phosphorus were in the central part of the city, but are relatively small catchments.
Best management practices (BMPs) should be selected based on the site-specific conditions where
phosphorus loads have been shown to be high. The city of Madison should also consider runoff
pollution prevention measures, such as pavement management to reduce the runoff of solids that
carry particulate phosphorus and other pollutants. Street sweeping and other reductions of particulate
ii
materials entering Silver and Memorial Creek can substantially reduce the phosphorus loading from
the city.
Bourne Slough Phosphorus Survey results from Bourne Slough show a surface area of 92 acres. A map of the Bourne Slough
sediments was created that shows 410,000 cubic yards of sediment in the slough. Results from
sediment core samples indicated the Bourne Slough sediments have high total phosphorus
concentrations. Only about five percent of the phosphorus could potentially be released as dissolved
phosphorus, although the remaining 95 percent could enter the water column as suspended sediments.
The high proportion of particulate phosphorus in the water column is most likely a result of input
from Silver Creek.
Excavating a portion of the sediments and rerouting the flow in the slough could potentially improve
sedimentation in the basin, thereby reducing phosphorus entering Lake Madison. The flow path
within the slough would need to be increased, most likely by building a barrier within the slough that
would route the flow around the perimeter of the slough. Additional hydraulic modeling and
engineering design would be needed to estimate the phosphorus removal efficiency with the adjusted
slough depth and water flow.
iii
Water Quality and Sediment Composition Study Table of Contents
Executive Summary ....................................................................................................................................... i Introduction............................................................................................................................................ i Stormwater Runoff in Madison.............................................................................................................. i Bourne Slough Phosphorus ...................................................................................................................ii
1.0 Introduction............................................................................................................................................ 1 1.1 Purpose........................................................................................................................................ 1 1.2 Site Description........................................................................................................................... 1
2.0 Methods for Storm Sewer Analysis ....................................................................................................... 4 2.1 Review of Historical Records and Reports ................................................................................. 4 2.2 Water Quality.............................................................................................................................. 5
2.2.1 Data Collection .............................................................................................................. 5 2.2.2 Precipitation................................................................................................................... 5
2.3 Evaluation of Phosphorus Loading ............................................................................................. 8 2.4 GIS Coverage.............................................................................................................................. 9
3.0 Results and Discussion of Water Quality ............................................................................................ 11 3.1 Land Use and Cover.................................................................................................................. 11 3.2 Snowmelt and Storm Event Monitoring ................................................................................... 11
3.2.1 Sample Events ............................................................................................................. 11 3.2.2 Precipitation................................................................................................................. 13
3.3 Snowmelt and Storm Event Water Quality............................................................................... 15 3.4 Comparison of 1995/1997 and 2001 Results ............................................................................ 21 3.5 Comparison to Urban Runoff in other Cities ............................................................................ 24 3.6 Outlet Evaluations..................................................................................................................... 25 3.7 Estimated Phosphorus Loadings ............................................................................................... 27 3.8 Urban Best Management Practices ........................................................................................... 31
4.0 Methods for Sediment Analysis........................................................................................................... 32 4.1 Bourne Slough and Round Lake Sediments ............................................................................. 32
5.0 Results and Discussion for Bourne Slough and Round Lake .............................................................. 33 5.1 Sediments in Bourne Slough and Round Lake ......................................................................... 33 5.2 Water Sample Collection in Bourne Slough ............................................................................. 33 5.3 Water in Bourne Slough............................................................................................................ 36 5.4 Management of Bourne Slough for Phosphorus Reduction...................................................... 38
6.0 Conclusions.......................................................................................................................................... 39 6.1 Urban Runoff Quality ............................................................................................................... 39 6.2 Bourne Slough .......................................................................................................................... 40
7.0 Recommendations................................................................................................................................ 41 7.1 Detention Ponding of Runoff.................................................................................................... 41 7.2 Streambank Erosion Concerns .................................................................................................. 47 7.3 Retention of Suspended Sediments in Bourne Slough.............................................................. 47 7.4 Background............................................................................................................................... 51

iv
7.5 Causes of Streambank Erosion ................................................................................................. 51 7.5.1 Floodplain Development ............................................................................................. 52 7.5.2 Channel Crossings ....................................................................................................... 52 7.5.3 Vegetation Management.............................................................................................. 52 7.5.4 Stormwater Management............................................................................................. 53 7.5.5 Maintenance of Erosion Areas..................................................................................... 53
7.6 Future Work Recommendations ............................................................................................... 53
References................................................................................................................................................... 54
v
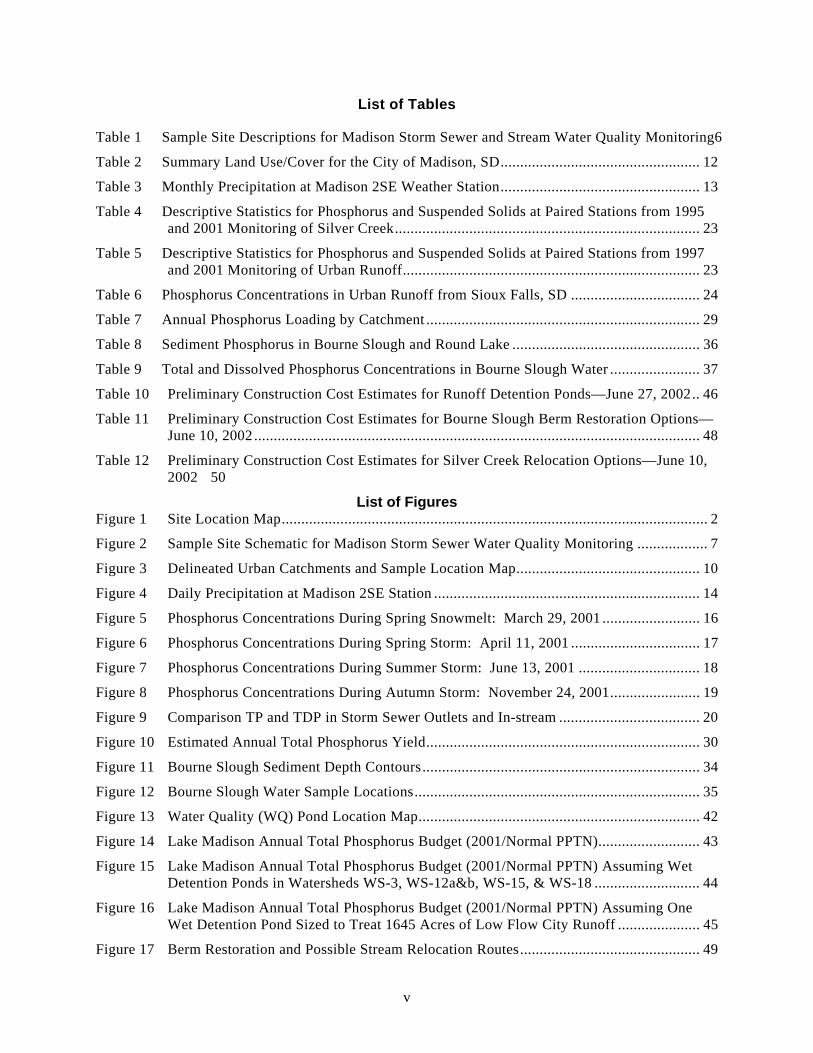
List of Tables
Table 1 Sample Site Descriptions for Madison Storm Sewer and Stream Water Quality Monitoring6 Table 2 Summary Land Use/Cover for the City of Madison, SD................................................... 12 Table 3 Monthly Precipitation at Madison 2SE Weather Station................................................... 13 Table 4 Descriptive Statistics for Phosphorus and Suspended Solids at Paired Stations from 1995
and 2001 Monitoring of Silver Creek.............................................................................. 23 Table 5 Descriptive Statistics for Phosphorus and Suspended Solids at Paired Stations from 1997
and 2001 Monitoring of Urban Runoff............................................................................ 23 Table 6 Phosphorus Concentrations in Urban Runoff from Sioux Falls, SD ................................. 24 Table 7 Annual Phosphorus Loading by Catchment ...................................................................... 29 Table 8 Sediment Phosphorus in Bourne Slough and Round Lake ................................................ 36 Table 9 Total and Dissolved Phosphorus Concentrations in Bourne Slough Water ....................... 37 Table 10 Preliminary Construction Cost Estimates for Runoff Detention Ponds—June 27, 2002.. 46 Table 11 Preliminary Construction Cost Estimates for Bourne Slough Berm Restoration Options—
June 10, 2002 .................................................................................................................. 48 Table 12 Preliminary Construction Cost Estimates for Silver Creek Relocation Options—June 10,
2002 50 List of Figures
Figure 1 Site Location Map............................................................................................................. 2 Figure 2 Sample Site Schematic for Madison Storm Sewer Water Quality Monitoring .................. 7 Figure 3 Delineated Urban Catchments and Sample Location Map............................................... 10 Figure 4 Daily Precipitation at Madison 2SE Station .................................................................... 14 Figure 5 Phosphorus Concentrations During Spring Snowmelt: March 29, 2001 ......................... 16 Figure 6 Phosphorus Concentrations During Spring Storm: April 11, 2001 ................................. 17 Figure 7 Phosphorus Concentrations During Summer Storm: June 13, 2001 ............................... 18 Figure 8 Phosphorus Concentrations During Autumn Storm: November 24, 2001....................... 19 Figure 9 Comparison TP and TDP in Storm Sewer Outlets and In-stream .................................... 20 Figure 10 Estimated Annual Total Phosphorus Yield...................................................................... 30 Figure 11 Bourne Slough Sediment Depth Contours ....................................................................... 34 Figure 12 Bourne Slough Water Sample Locations......................................................................... 35 Figure 13 Water Quality (WQ) Pond Location Map........................................................................ 42 Figure 14 Lake Madison Annual Total Phosphorus Budget (2001/Normal PPTN).......................... 43 Figure 15 Lake Madison Annual Total Phosphorus Budget (2001/Normal PPTN) Assuming Wet
Detention Ponds in Watersheds WS-3, WS-12a&b, WS-15, & WS-18 ........................... 44 Figure 16 Lake Madison Annual Total Phosphorus Budget (2001/Normal PPTN) Assuming One
Wet Detention Pond Sized to Treat 1645 Acres of Low Flow City Runoff ..................... 45 Figure 17 Berm Restoration and Possible Stream Relocation Routes.............................................. 49

vi
List of Appendices Appendix A South Dakota Water Quality Standards for Silver Creek Appendix B Climate Data at Madison 2SE Appendix C Madison Storm Sewer and Stream Water Quality Data Appendix D BMPs: Stormwater Treatment Suitability Matrix and Pavement Management Appendix E Bourne Slough and Round Lake Sediment and Water Quality Data

1
1.0 Introduction
1.1 Purpose This study is intended to contribute to the overall goal of the Lake County Watershed Improvement
Project (LCWIP), which is to reduce phosphorus loading to Lake Herman/Lake Madison/Brant Lake
watershed by 50 percent. Phosphorus is the nutrient of interest in this study because it is generally
the limiting factor that controls the growth of algae in lakes. If phosphorus is reduced by 50 percent,
there will be a proportional decrease in algal concentration in the lakes. The lower the phosphorus
concentration, the greater the reduction in algae per unit of phosphorus. A 50 percent reduction in
tributary phosphorus loading to the lakes is expected to reduce algal concentration by 88 to 90
percent.
The objectives of this study are: (1) to measure and evaluate phosphorus loading from the City of
Madison storm sewers during spring snowmelt and storm events, and (2) evaluate the Bourne Slough
sediments for potential benefit of dredging of the slough. An earlier study of nutrient loading to
Lake Madison and Brant Lake had measured runoff from the City of Madison, but the LCWIP
initiated this study to acquire more detailed information on phosphorus loading from storm sewers
within Madison to better determine where best management practices could be implemented. The
earlier study had noted that the Bourne slough receives phosphorus from Silver Creek, but because
the slough is shallow it has a limited capacity to retain phosphorus. Therefore, it was suggested that
a small sediment removal project could increase the depth around the mouth of Bourne Slough and
increase phosphorus retention. The methods and results for the two parts of this study—the storm
sewer analysis and the sediment analysis—are divided into two sections within this report. The
conclusions and recommendations address both parts of the study.
1.2 Site Description The City of Madison is the county seat for Lake County; with a population of 6,650, it is the largest
municipality in the county. The city has a surface area of about 3.5 square miles and is centrally
located within the Lake Madison watershed, which drains 45.6 square miles within Lake County.
Lake County is 528 square miles. Lake Madison is approximately three miles southeast of the city of
Madison. Bourne Slough receives the inflow from Silver Creek and then drains directly into Lake
Madison (Figure 1).

2

3
Memorial Creek is the main stream running through the center of Madison. Park Creek is a tributary
to Memorial Creek, flowing from west to east in the northwest section of the city. Silver Creek runs
west to east on the southern flank of the city and joins Memorial Creek at the city’s southeast corner.
The Memorial Creek and Silver Creek subwatersheds are part of the Big Sioux Basin. Brant Lake
drains to Skunk Creek, which in turn drains to the Big Sioux River.
To control frequent flooding, which has historically been a deterrent to economic growth, Memorial
Creek has been channelized and banks protected with a bulkhead throughout much of the city,
beginning at Memorial Park. Memorial Park is downstream of the confluence of Park Creek and
Memorial Creek and the park contains a pond with bulkhead extending along both shorelines.
The focus of water quality monitoring for this study was the city’s storm sewer system, which drains
the streets, residential, commercial, and light industrial areas of the city. Sanitary sewage is treated
at Madison’s wastewater treatment plant, which has a capacity of 1.75 MGD and treats an average of
0.8 MGD. The WWTP has secondary oxidation and uses infiltration lagoons, located north of
Bourne Slough. There is no surface discharge from the WWTP.
Normal (1961-1990) annual precipitation in the Madison area is about 24 inches; 75 percent of the
precipitation is during April through September (USDA 1972). Most of the precipitation (97%)
returns to the atmosphere by evaporation and only one percent becomes streamflow (Hansen 1986).
The mean annual temperature is 46 °F and the range is –30 to 110 °F.
Lake Madison and Brant Lake are included on the 1998 South Dakota 303(d) Waterbody List of
impaired waters. They are listed for total phosphorus and exceedence the Carlson Trophic State
Index threshold of 50. Because the two lakes are on the 303(d) list, a Total Maximum Daily Load
(TMDL) study is required for the lakes. The Phase I Watershed Assessment Final Report (Witmuss
and McIntire 1998) served as the TMDL for the lakes (http://www.state.sd.us/denr/DFTA/
WatershedProtection /TMDL/TMDLMADISONBRANT.htm). The TMDL goal for the watershed is
a 50% reduction in total phosphorus. A 50% reduction in phosphorus load is expected to lead to an
88% drop in chlorophyll a concentration (from 52 µg/L to 6 µg/L).
4
2.0 Methods for Storm Sewer Analysis
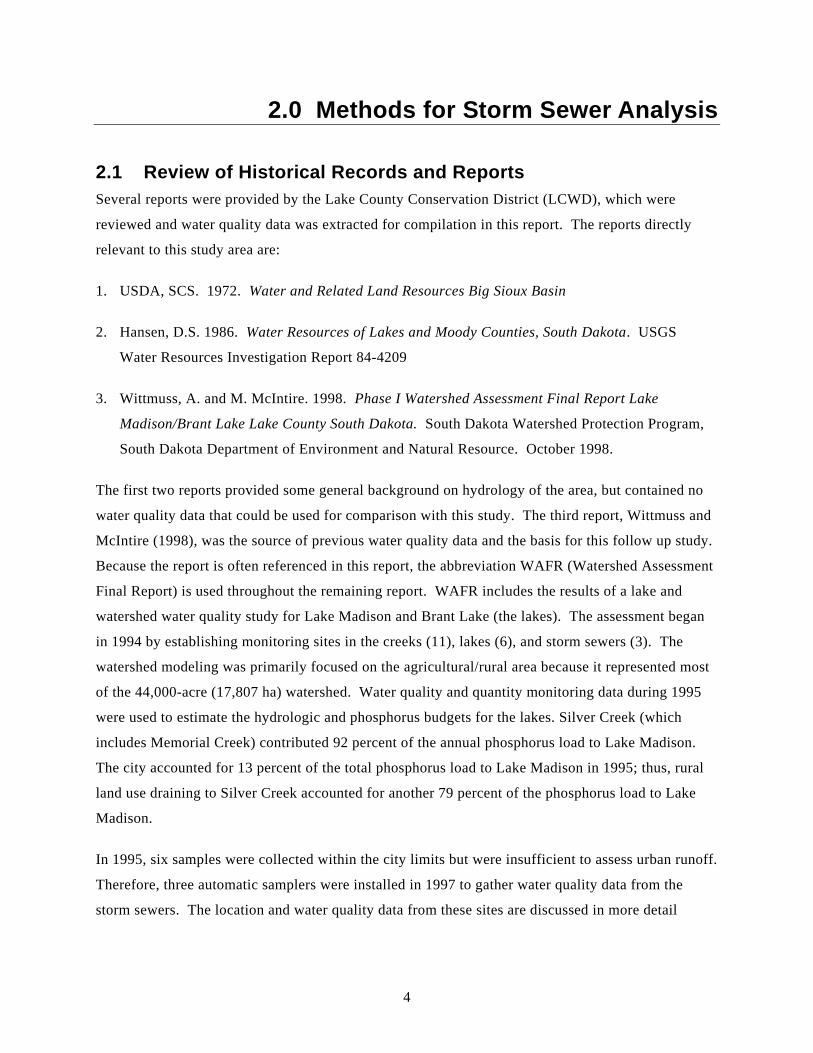
2.1 Review of Historical Records and Reports Several reports were provided by the Lake County Conservation District (LCWD), which were
reviewed and water quality data was extracted for compilation in this report. The reports directly
relevant to this study area are:
1. USDA, SCS. 1972. Water and Related Land Resources Big Sioux Basin
2. Hansen, D.S. 1986. Water Resources of Lakes and Moody Counties, South Dakota. USGS
Water Resources Investigation Report 84-4209
3. Wittmuss, A. and M. McIntire. 1998. Phase I Watershed Assessment Final Report Lake
Madison/Brant Lake Lake County South Dakota. South Dakota Watershed Protection Program,
South Dakota Department of Environment and Natural Resource. October 1998.
The first two reports provided some general background on hydrology of the area, but contained no
water quality data that could be used for comparison with this study. The third report, Wittmuss and
McIntire (1998), was the source of previous water quality data and the basis for this follow up study.
Because the report is often referenced in this report, the abbreviation WAFR (Watershed Assessment
Final Report) is used throughout the remaining report. WAFR includes the results of a lake and
watershed water quality study for Lake Madison and Brant Lake (the lakes). The assessment began
in 1994 by establishing monitoring sites in the creeks (11), lakes (6), and storm sewers (3). The
watershed modeling was primarily focused on the agricultural/rural area because it represented most
of the 44,000-acre (17,807 ha) watershed. Water quality and quantity monitoring data during 1995
were used to estimate the hydrologic and phosphorus budgets for the lakes. Silver Creek (which
includes Memorial Creek) contributed 92 percent of the annual phosphorus load to Lake Madison.
The city accounted for 13 percent of the total phosphorus load to Lake Madison in 1995; thus, rural
land use draining to Silver Creek accounted for another 79 percent of the phosphorus load to Lake
Madison.
In 1995, six samples were collected within the city limits but were insufficient to assess urban runoff.
Therefore, three automatic samplers were installed in 1997 to gather water quality data from the
storm sewers. The location and water quality data from these sites are discussed in more detail
5
below. Water quality data from the 1995 and 1997 monitoring are compared to results from this
study in 2001.
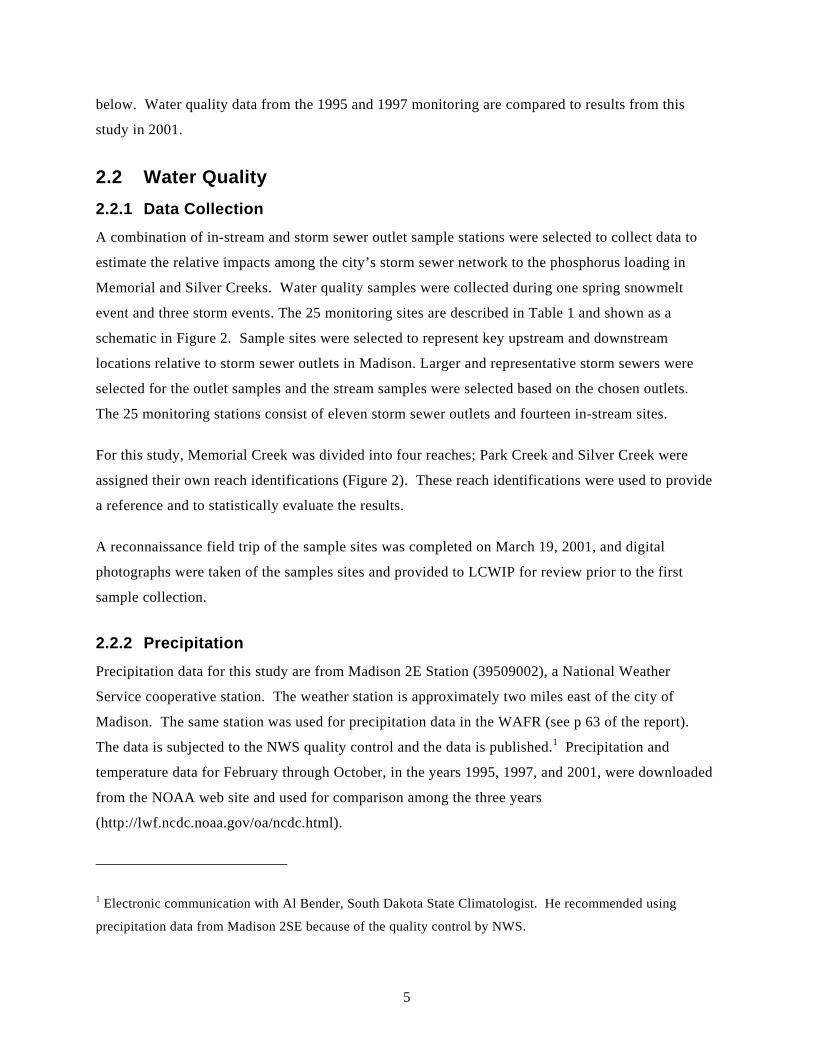
2.2 Water Quality 2.2.1 Data Collection A combination of in-stream and storm sewer outlet sample stations were selected to collect data to
estimate the relative impacts among the city’s storm sewer network to the phosphorus loading in
Memorial and Silver Creeks. Water quality samples were collected during one spring snowmelt
event and three storm events. The 25 monitoring sites are described in Table 1 and shown as a
schematic in Figure 2. Sample sites were selected to represent key upstream and downstream
locations relative to storm sewer outlets in Madison. Larger and representative storm sewers were
selected for the outlet samples and the stream samples were selected based on the chosen outlets.
The 25 monitoring stations consist of eleven storm sewer outlets and fourteen in-stream sites.
For this study, Memorial Creek was divided into four reaches; Park Creek and Silver Creek were
assigned their own reach identifications (Figure 2). These reach identifications were used to provide
a reference and to statistically evaluate the results.
A reconnaissance field trip of the sample sites was completed on March 19, 2001, and digital
photographs were taken of the samples sites and provided to LCWIP for review prior to the first
sample collection.
2.2.2 Precipitation
Precipitation data for this study are from Madison 2E Station (39509002), a National Weather
Service cooperative station. The weather station is approximately two miles east of the city of
Madison. The same station was used for precipitation data in the WAFR (see p 63 of the report).
The data is subjected to the NWS quality control and the data is published.1 Precipitation and
temperature data for February through October, in the years 1995, 1997, and 2001, were downloaded
from the NOAA web site and used for comparison among the three years
(http://lwf.ncdc.noaa.gov/oa/ncdc.html).
1 Electronic communication with Al Bender, South Dakota State Climatologist. He recommended using
precipitation data from Madison 2SE because of the quality control by NWS.
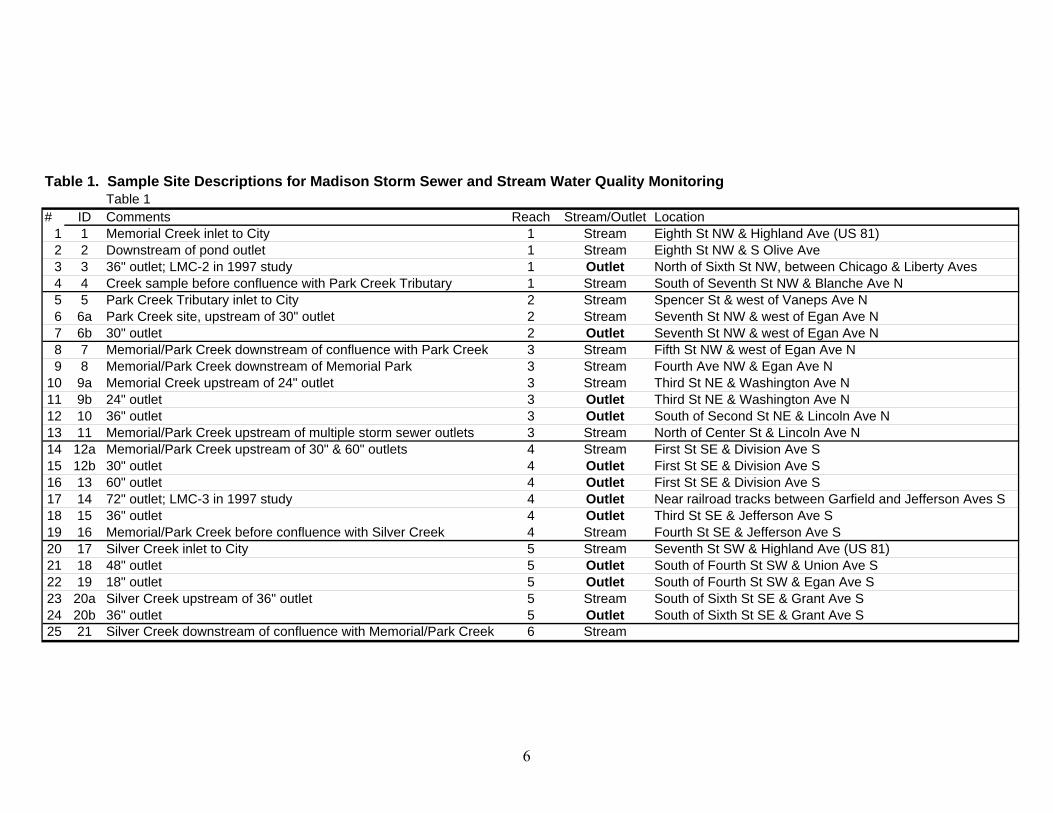
Table 1. Sample Site Descriptions for Madison Storm Sewer and Stream Water Quality MonitoringTable 1
# ID Comments Reach Stream/Outlet Location1 1 Memorial Creek inlet to City 1 Stream Eighth St NW & Highland Ave (US 81)2 2 Downstream of pond outlet 1 Stream Eighth St NW & S Olive Ave3 3 36" outlet; LMC-2 in 1997 study 1 Outlet North of Sixth St NW, between Chicago & Liberty Aves4 4 Creek sample before confluence with Park Creek Tributary 1 Stream South of Seventh St NW & Blanche Ave N5 5 Park Creek Tributary inlet to City 2 Stream Spencer St & west of Vaneps Ave N6 6a Park Creek site, upstream of 30" outlet 2 Stream Seventh St NW & west of Egan Ave N7 6b 30" outlet 2 Outlet Seventh St NW & west of Egan Ave N8 7 Memorial/Park Creek downstream of confluence with Park Creek 3 Stream Fifth St NW & west of Egan Ave N9 8 Memorial/Park Creek downstream of Memorial Park 3 Stream Fourth Ave NW & Egan Ave N
10 9a Memorial Creek upstream of 24" outlet 3 Stream Third St NE & Washington Ave N11 9b 24" outlet 3 Outlet Third St NE & Washington Ave N12 10 36" outlet 3 Outlet South of Second St NE & Lincoln Ave N13 11 Memorial/Park Creek upstream of multiple storm sewer outlets 3 Stream North of Center St & Lincoln Ave N14 12a Memorial/Park Creek upstream of 30" & 60" outlets 4 Stream First St SE & Division Ave S15 12b 30" outlet 4 Outlet First St SE & Division Ave S16 13 60" outlet 4 Outlet First St SE & Division Ave S17 14 72" outlet; LMC-3 in 1997 study 4 Outlet Near railroad tracks between Garfield and Jefferson Aves S18 15 36" outlet 4 Outlet Third St SE & Jefferson Ave S19 16 Memorial/Park Creek before confluence with Silver Creek 4 Stream Fourth St SE & Jefferson Ave S20 17 Silver Creek inlet to City 5 Stream Seventh St SW & Highland Ave (US 81)21 18 48" outlet 5 Outlet South of Fourth St SW & Union Ave S22 19 18" outlet 5 Outlet South of Fourth St SW & Egan Ave S23 20a Silver Creek upstream of 36" outlet 5 Stream South of Sixth St SE & Grant Ave S24 20b 36" outlet 5 Outlet South of Sixth St SE & Grant Ave S25 21 Silver Creek downstream of confluence with Memorial/Park Creek 6 Stream
6

Agricultural Watershed
Sample Station Key
Sample Site Schematic for Madison Storm Sewer Water Quality MonitoringFigure 2
Reach 3
Reach 2Reach 1
Reach 4
Reach 5
Reach 6
3
6b
9b10
12b
1314
15
18 19 20b
Bourne Slough
1
2
4
5
6a
7
9a
8
11
12a
1617 20a
21
Stream
Storm Sewer
CITY OFMADISON
7

8
2.3 Evaluation of Phosphorus Loading Nutrient and solids data was collected during snowmelt and rain storms at 25 stations throughout the
city of Madison to assess the relative contribution of the urban runoff via storm sewers to the
phosphorus concentration in Memorial Creek and Silver Creek. The scale of this study limited the
conclusions that can be made about the phosphorus loading from the urban area of Madison relative
to the rural areas of the watershed. A more quantitative measure of the contribution to the annual
mass loading of phosphorus would require continuous flow monitoring and automated sampling
during storm events, as well as sampling during dry periods. From the nutrient and solids
concentration data we can assess if the urban stormwater runoff from specific storm sewer outlets
appear to significantly contribute to the phosphorus concentration in the creeks. The main point of
assessing the concentration data is determining if the concentration of phosphorus in the urban runoff
is significantly higher than upstream concentrations and if it appears to influence the concentration of
phosphorus in the downstream receiving waters.
Annual phosphorus loading from drainage areas in Madison were estimated using the Simple Method (Schueler 1987). The method was used by WAFR to estimate urban runoff, based on samples that were collected in 1997 in three locations in Madison. The same method is used for this study to extrapolate from storm events to annual loading. The Simple Method is used specifically to estimate annual loading based on even mean concentrations for storm events, land cover, and annual rainfall. The two equations used in the Simple Method are:
Li = P·f·Ri·Ci·Ai ·0.2267 (1) Ri = 0.05 + 0.009·I (2)
Where: Li = Annual pollutant load (lb/yr) P = Annual precipitation (in/yr)
f = Correction factor for storms with no runoff = 0.9 Ri = Weighted-average runoff coefficient for land use area
Ci = Event-mean concentration (mg/L) Ai = Catchment area (acres) I = Percent imperviousness
In WAFR the annual precipitation for 1995 was used in the estimations of urban runoff, although the
samples were collected in 1997. The event mean concentration for total phosphorus in 1997 was
0.995 mg/L. The annual precipitation in 1995 was 33.34 inches and in 1997 annual precipitation was
20.19 inches.
9
For this study, the average phosphorus concentration for the four sampling events was used as the
event mean concentration for each station. Land use/cover was derived from GIS coverages, as
described below, and percent imperviousness was applied to each land use. The total percent
imperviousness for each drainage area was used in Equation 2 to determine the runoff coefficient.
This approach differs somewhat from the way WAFR used the Simple Method. In the WAFR
analysis land use categories were determined for the entire city and a runoff coefficient was
calculated for each land use category. Furthermore, the WAFR used an average phosphorus
concentration from all samples and applied it to the whole city, whereas in this study an average total
phosphorus was applied to each catchment, based on sampling from the storm sewer outfall in the
catchment or applying an average phosphorus concentration from a nearby catchment with similar
land use. The objective in WAFR was to estimate urban runoff, as compared to rural runoff. The
objective in this study was also to get an estimate of the urban runoff contribution to Silver Creek,
but in addition, to evaluate the relative contributions of the subwatersheds within the city of
Madison.
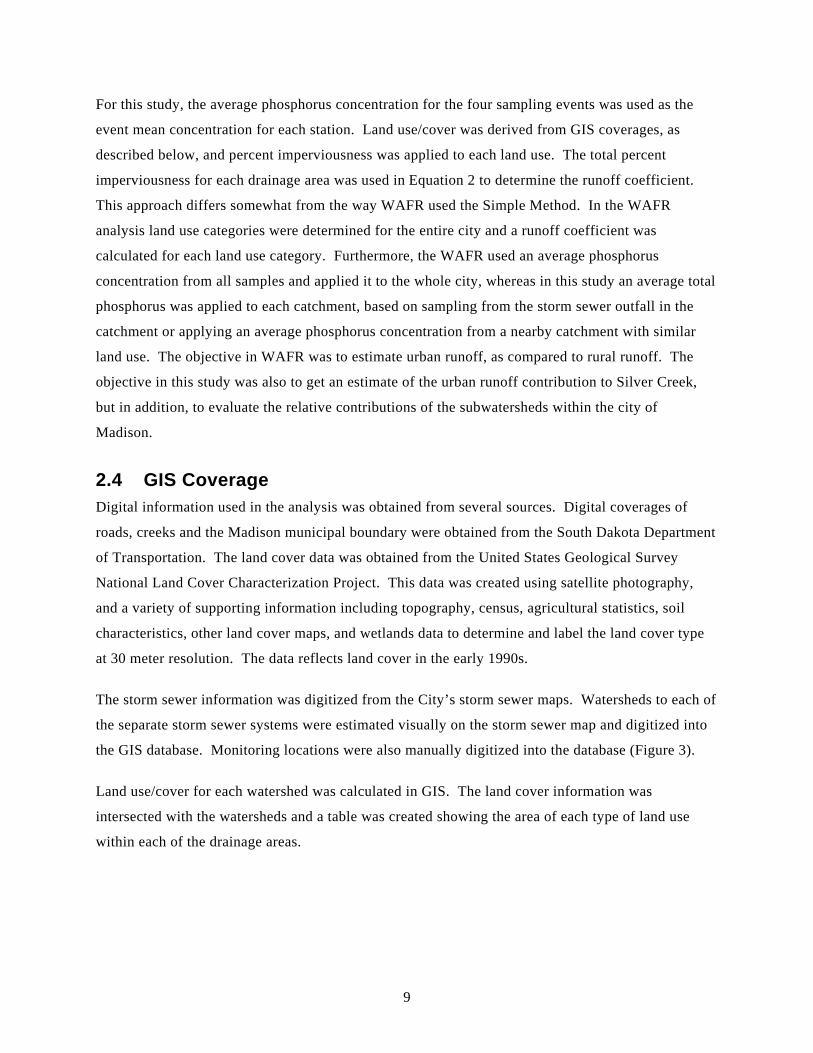
2.4 GIS Coverage Digital information used in the analysis was obtained from several sources. Digital coverages of
roads, creeks and the Madison municipal boundary were obtained from the South Dakota Department
of Transportation. The land cover data was obtained from the United States Geological Survey
National Land Cover Characterization Project. This data was created using satellite photography,
and a variety of supporting information including topography, census, agricultural statistics, soil
characteristics, other land cover maps, and wetlands data to determine and label the land cover type
at 30 meter resolution. The data reflects land cover in the early 1990s.
The storm sewer information was digitized from the City’s storm sewer maps. Watersheds to each of
the separate storm sewer systems were estimated visually on the storm sewer map and digitized into
the GIS database. Monitoring locations were also manually digitized into the database (Figure 3).
Land use/cover for each watershed was calculated in GIS. The land cover information was
intersected with the watersheds and a table was created showing the area of each type of land use
within each of the drainage areas.
10
11
3.0 Results and Discussion of Water Quality
3.1 Land Use and Cover The City of Madison was delineated into 30 catchments based on storm sewer maps and USGS. 7.5
minute quadrangle maps of the area (Figure 2). The “ST” prefix identifies drainage areas to one of
the in-stream monitoring stations and the “WS” identifies watersheds drained by storm sewers.
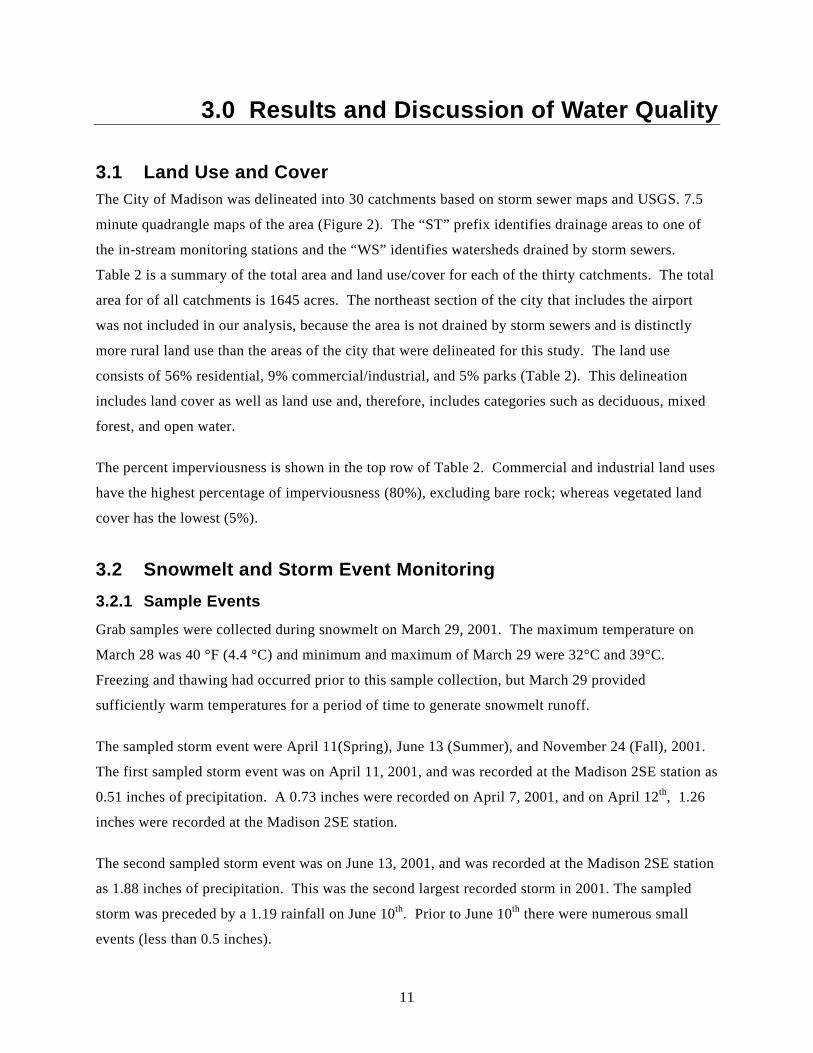
Table 2 is a summary of the total area and land use/cover for each of the thirty catchments. The total
area for of all catchments is 1645 acres. The northeast section of the city that includes the airport
was not included in our analysis, because the area is not drained by storm sewers and is distinctly
more rural land use than the areas of the city that were delineated for this study. The land use
consists of 56% residential, 9% commercial/industrial, and 5% parks (Table 2). This delineation
includes land cover as well as land use and, therefore, includes categories such as deciduous, mixed
forest, and open water.
The percent imperviousness is shown in the top row of Table 2. Commercial and industrial land uses
have the highest percentage of imperviousness (80%), excluding bare rock; whereas vegetated land
cover has the lowest (5%).
3.2 Snowmelt and Storm Event Monitoring 3.2.1 Sample Events
Grab samples were collected during snowmelt on March 29, 2001. The maximum temperature on
March 28 was 40 °F (4.4 °C) and minimum and maximum of March 29 were 32°C and 39°C.
Freezing and thawing had occurred prior to this sample collection, but March 29 provided
sufficiently warm temperatures for a period of time to generate snowmelt runoff.
The sampled storm event were April 11(Spring), June 13 (Summer), and November 24 (Fall), 2001.
The first sampled storm event was on April 11, 2001, and was recorded at the Madison 2SE station as
0.51 inches of precipitation. A 0.73 inches were recorded on April 7, 2001, and on April 12th, 1.26
inches were recorded at the Madison 2SE station.
The second sampled storm event was on June 13, 2001, and was recorded at the Madison 2SE station
as 1.88 inches of precipitation. This was the second largest recorded storm in 2001. The sampled
storm was preceded by a 1.19 rainfall on June 10th. Prior to June 10th there were numerous small
events (less than 0.5 inches).
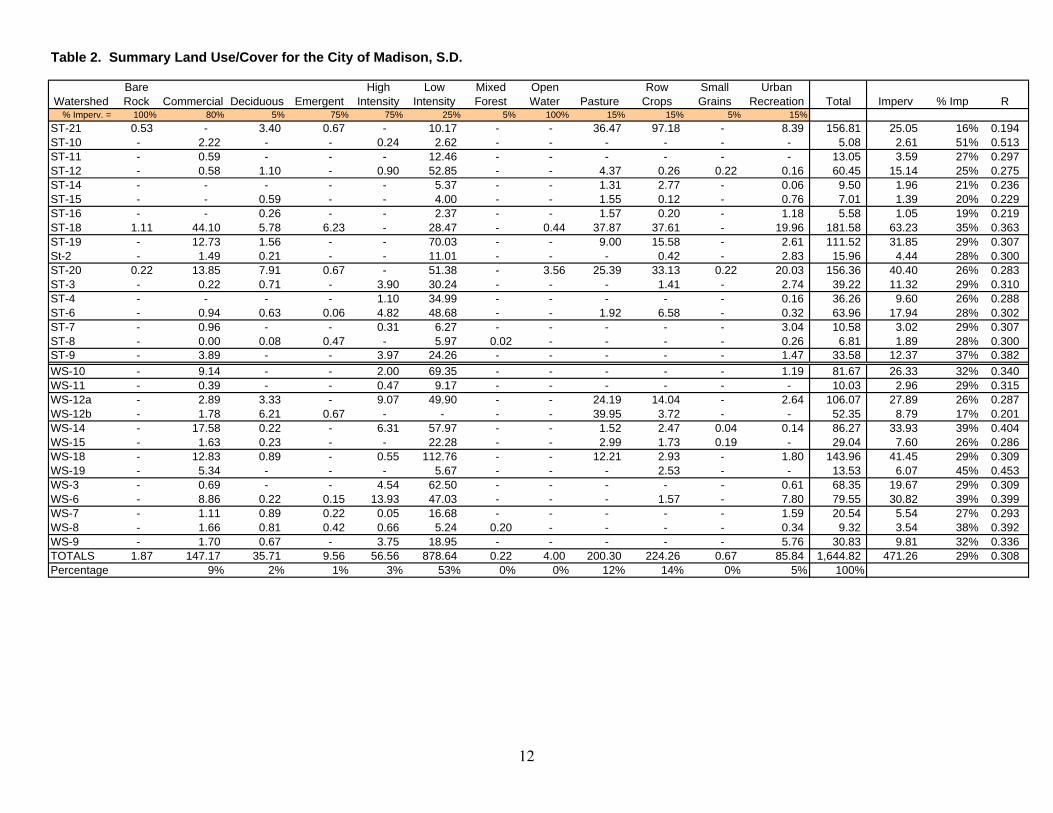
Table 2. Summary Land Use/Cover for the City of Madison, S.D.
WatershedBare Rock Commercial Deciduous Emergent
High Intensity
Low Intensity
Mixed Forest
Open Water Pasture
Row Crops
Small Grains
Urban Recreation Total Imperv % Imp R
% Imperv. = 100% 80% 5% 75% 75% 25% 5% 100% 15% 15% 5% 15%ST-21 0.53 - 3.40 0.67 - 10.17 - - 36.47 97.18 - 8.39 156.81 25.05 16% 0.194ST-10 - 2.22 - - 0.24 2.62 - - - - - - 5.08 2.61 51% 0.513ST-11 - 0.59 - - - 12.46 - - - - - - 13.05 3.59 27% 0.297ST-12 - 0.58 1.10 - 0.90 52.85 - - 4.37 0.26 0.22 0.16 60.45 15.14 25% 0.275ST-14 - - - - - 5.37 - - 1.31 2.77 - 0.06 9.50 1.96 21% 0.236ST-15 - - 0.59 - - 4.00 - - 1.55 0.12 - 0.76 7.01 1.39 20% 0.229ST-16 - - 0.26 - - 2.37 - - 1.57 0.20 - 1.18 5.58 1.05 19% 0.219ST-18 1.11 44.10 5.78 6.23 - 28.47 - 0.44 37.87 37.61 - 19.96 181.58 63.23 35% 0.363ST-19 - 12.73 1.56 - - 70.03 - - 9.00 15.58 - 2.61 111.52 31.85 29% 0.307St-2 - 1.49 0.21 - - 11.01 - - - 0.42 - 2.83 15.96 4.44 28% 0.300ST-20 0.22 13.85 7.91 0.67 - 51.38 - 3.56 25.39 33.13 0.22 20.03 156.36 40.40 26% 0.283ST-3 - 0.22 0.71 - 3.90 30.24 - - - 1.41 - 2.74 39.22 11.32 29% 0.310ST-4 - - - - 1.10 34.99 - - - - - 0.16 36.26 9.60 26% 0.288ST-6 - 0.94 0.63 0.06 4.82 48.68 - - 1.92 6.58 - 0.32 63.96 17.94 28% 0.302ST-7 - 0.96 - - 0.31 6.27 - - - - - 3.04 10.58 3.02 29% 0.307ST-8 - 0.00 0.08 0.47 - 5.97 0.02 - - - - 0.26 6.81 1.89 28% 0.300ST-9 - 3.89 - - 3.97 24.26 - - - - - 1.47 33.58 12.37 37% 0.382WS-10 - 9.14 - - 2.00 69.35 - - - - - 1.19 81.67 26.33 32% 0.340WS-11 - 0.39 - - 0.47 9.17 - - - - - - 10.03 2.96 29% 0.315WS-12a - 2.89 3.33 - 9.07 49.90 - - 24.19 14.04 - 2.64 106.07 27.89 26% 0.287WS-12b - 1.78 6.21 0.67 - - - - 39.95 3.72 - - 52.35 8.79 17% 0.201WS-14 - 17.58 0.22 - 6.31 57.97 - - 1.52 2.47 0.04 0.14 86.27 33.93 39% 0.404WS-15 - 1.63 0.23 - - 22.28 - - 2.99 1.73 0.19 - 29.04 7.60 26% 0.286WS-18 - 12.83 0.89 - 0.55 112.76 - - 12.21 2.93 - 1.80 143.96 41.45 29% 0.309WS-19 - 5.34 - - - 5.67 - - - 2.53 - - 13.53 6.07 45% 0.453WS-3 - 0.69 - - 4.54 62.50 - - - - - 0.61 68.35 19.67 29% 0.309WS-6 - 8.86 0.22 0.15 13.93 47.03 - - - 1.57 - 7.80 79.55 30.82 39% 0.399WS-7 - 1.11 0.89 0.22 0.05 16.68 - - - - - 1.59 20.54 5.54 27% 0.293WS-8 - 1.66 0.81 0.42 0.66 5.24 0.20 - - - - 0.34 9.32 3.54 38% 0.392WS-9 - 1.70 0.67 - 3.75 18.95 - - - - - 5.76 30.83 9.81 32% 0.336TOTALS 1.87 147.17 35.71 9.56 56.56 878.64 0.22 4.00 200.30 224.26 0.67 85.84 1,644.82 471.26 29% 0.308Percentage 9% 2% 1% 3% 53% 0% 0% 12% 14% 0% 5% 100%
12
13
The third sampled storm event was on November 24, 2001, and was recorded at the Madison 2SE
station as 0.65 inches of precipitation. This storm followed an exceptionally dry antecedent period.
The previous record precipitation of more than 0.01 inches, was 1.15 inches on October 10th and 0.22
inches on October 13th.
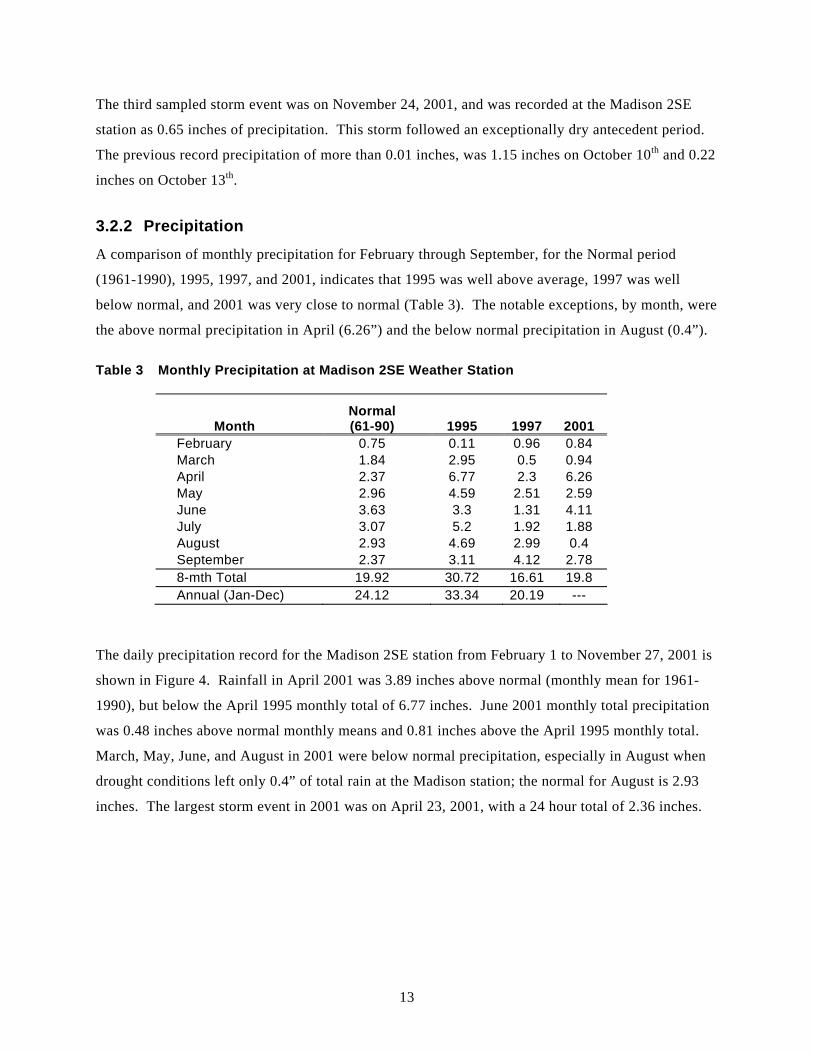
3.2.2 Precipitation A comparison of monthly precipitation for February through September, for the Normal period
(1961-1990), 1995, 1997, and 2001, indicates that 1995 was well above average, 1997 was well
below normal, and 2001 was very close to normal (Table 3). The notable exceptions, by month, were
the above normal precipitation in April (6.26”) and the below normal precipitation in August (0.4”).
Table 3 Monthly Precipitation at Madison 2SE Weather Station
Month Normal (61-90) 1995 1997 2001
February 0.75 0.11 0.96 0.84 March 1.84 2.95 0.5 0.94 April 2.37 6.77 2.3 6.26 May 2.96 4.59 2.51 2.59 June 3.63 3.3 1.31 4.11 July 3.07 5.2 1.92 1.88 August 2.93 4.69 2.99 0.4 September 2.37 3.11 4.12 2.78 8-mth Total 19.92 30.72 16.61 19.8 Annual (Jan-Dec) 24.12 33.34 20.19 ---
The daily precipitation record for the Madison 2SE station from February 1 to November 27, 2001 is
shown in Figure 4. Rainfall in April 2001 was 3.89 inches above normal (monthly mean for 1961-
1990), but below the April 1995 monthly total of 6.77 inches. June 2001 monthly total precipitation
was 0.48 inches above normal monthly means and 0.81 inches above the April 1995 monthly total.
March, May, June, and August in 2001 were below normal precipitation, especially in August when
drought conditions left only 0.4” of total rain at the Madison station; the normal for August is 2.93
inches. The largest storm event in 2001 was on April 23, 2001, with a 24 hour total of 2.36 inches.

Figure 4Daily Precipitation at Madison 2SE Station
0
0.5
1
1.5
2
2.5
1/30/01 3/1/01 3/31/01 4/30/01 5/30/01 6/29/01 7/29/01 8/28/01 9/27/01 10/27/01 11/26/01
Date
inch
es
SAMPLED STORMS
SNOWMELT
14
15
3.3 Snowmelt and Storm Event Water Quality The concentrations of phosphorus, for each of the sampling events, are shown in Figures 5, 6, 7, and
8. The data are tabulated in Appendix C. Some general observations are as follows:
• Snowmelt runoff was mostly dissolved phosphorus in the upper reaches of Memorial Creek
before receiving substantial contributions from storm sewers. The particulate phosphorus
concentrations in the upper branch of Silver Creek before the confluence with Memorial
Creek. The concentration at the station 21, the downstream station, was relatively low (total
phosphorus less than 0.2 mg/L) compared to the concentrations upstream (total phosphorus
concentrations from 0.3 to 1.7 mg/L).
• During the April storm event, total phosphorus concentrations were in a range similar to the
spring snowmelt, but there was proportionately more particulate phosphorus in the April
storm compared to the snowmelt runoff.
• During the June storm event, which was the biggest precipitation event of all the sampling
periods, the total phosphorus concentrations were approximately twice the concentrations of
the snowmelt and April storm, but the dissolved phosphorus concentrations were similar to
the previous sample events. In other words, the particulate phosphorus concentrations were
relatively high during the June storm.
• During the November storm event, the total phosphorus concentrations were generally the
lowest of all the sampling periods. A noticeable exception was total phosphorus from Station
13, a storm sewer outlet on the east side of Madison, which had the highest total phosphorus
concentration of all stations in November (1.2 mg/L) and the highest concentration recorded
for that station. Nearly all the phosphorus was in the particulate form.
All the phosphorus data were combined to evaluate the statistical relationships among the measured
parameters. Total, dissolved, and soluble reactive phosphorus concentrations in the stream and in the
storm sewer outlets were compared using two-sample t-tests. The means and distribution of the three
phosphorus species were not significantly different between the stream sites and the storm sewer
sites. Figure 9 is a box-whisker plot of total phosphorus and total dissolved phosphorus grouped by
in-stream and storm sewer outfall. This simple comparison illustrates the similarity in the two
groups.

Figure 5Phosphorus Concentrations During Spring Snowmelt: March 29, 2001
0
0.2
0.4
0.6
0.8
1
1.2
1.4
1.6
1.8
1 2 3 4 5 6A 6B 7 8 9A 9B 10 11 12A 12B 13 14 15 16 17 18 19 20A 20B 21
Sample Station ID
mg/
L P
TPTDPSRP
REACH 1 REACH 2 REACH 3 REACH 4 REACH 5
16
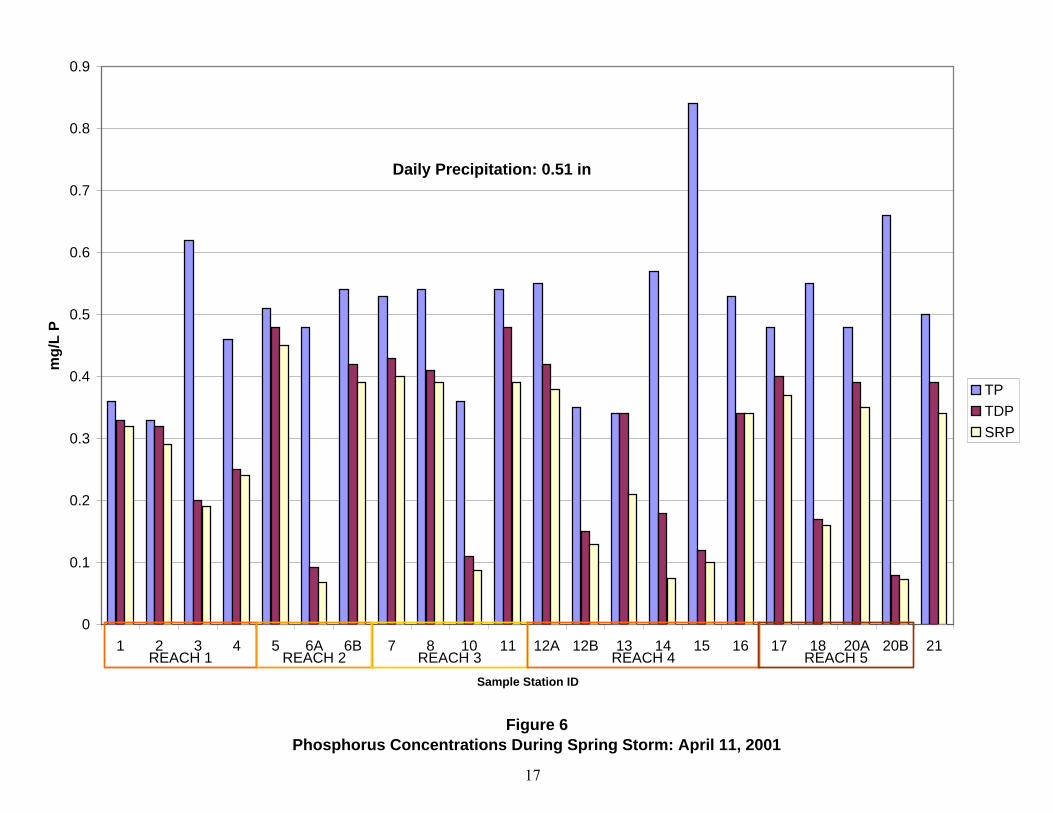
Figure 6Phosphorus Concentrations During Spring Storm: April 11, 2001
0
0.1
0.2
0.3
0.4
0.5
0.6
0.7
0.8
0.9
1 2 3 4 5 6A 6B 7 8 10 11 12A 12B 13 14 15 16 17 18 20A 20B 21
Sample Station ID
mg/
L P
TPTDPSRP
REACH 1 REACH 2 REACH 3 REACH 4 REACH 5
Daily Precipitation: 0.51 in
17
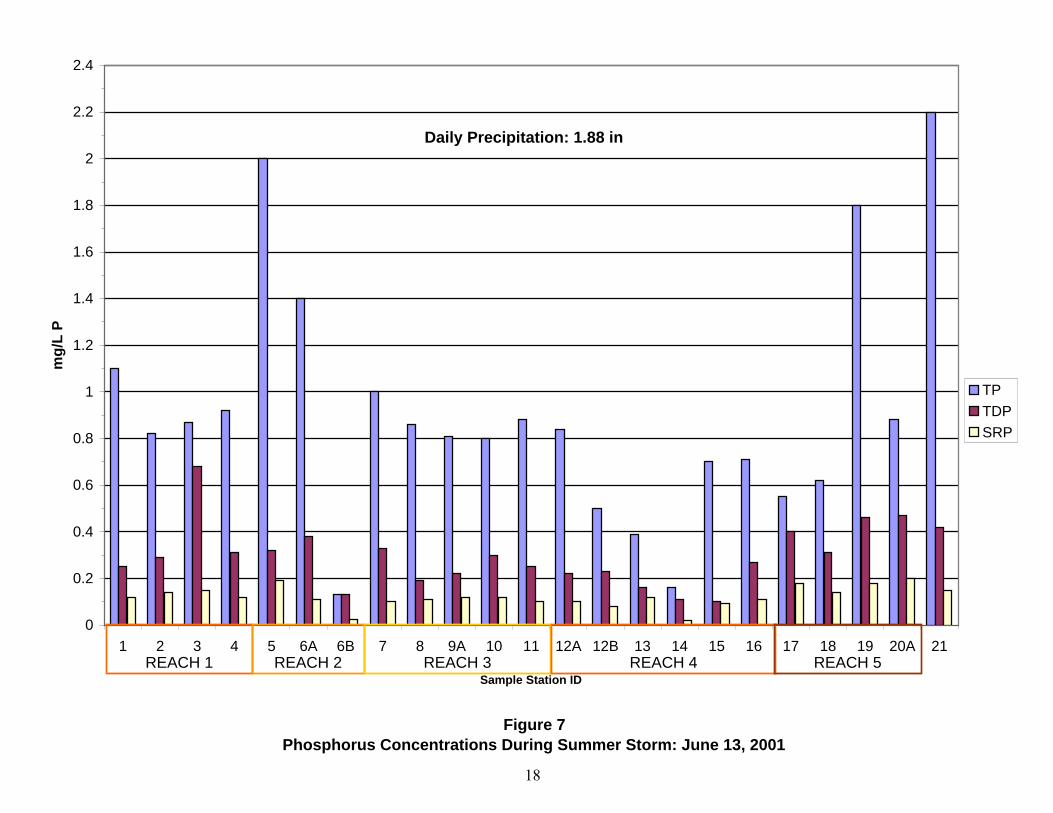
Figure 7Phosphorus Concentrations During Summer Storm: June 13, 2001
0
0.2
0.4
0.6
0.8
1
1.2
1.4
1.6
1.8
2
2.2
2.4
1 2 3 4 5 6A 6B 7 8 9A 10 11 12A 12B 13 14 15 16 17 18 19 20A 21
Sample Station ID
mg/
L P
TPTDPSRP
REACH 1 REACH 2 REACH 3 REACH 4 REACH 5
Daily Precipitation: 1.88 in
18

Figure 8Phosphorus Concentrations During Autumn Storm: November 24, 2001
0.0
0.2
0.4
0.6
0.8
1.0
1.2
1 2 3 4 5 6A 6B 7 8 9B 10 11 12? 13 14 16 17 18 19 20A 21
Sample Station ID
mg/
L P
TPTDPSRP
REACH 1 REACH 2 REACH 3 REACH 4 REACH 5
Daily Precipitation: 0.65 in
19

Figure 9 Comparison of TP and TDP in Storm Sewer Outlets and In-stream
IN-STREAM OUTLETS0.0
0.5
1.0
1.5
2.0
2.5
mg/L
TDP TP
Median 95% C.L. of median
outliers
20

21
There was a significant difference in the fraction of dissolved phosphorus between in-stream and
storm sewer outfall. The stream total phosphorus concentrations averaged 73 percent dissolved,
whereas the storm sewer outlets had an average dissolved fraction of 43 percent. This is informative
for evaluating best management practices to reduce phosphorus in runoff because it indicates that
most of the phosphorus in the urban runoff is in the particulate form, which can be removed in
properly designed wet detention basins, or other methods of removing solids. This is further
supported by the strong correlation between total phosphorus and total suspended solids. The
Pearson correlation coefficient for total suspended solids and total phosphorus is 0.789. A linear
regression gave the following result:
TP = 0.002 TSS + 0.426 R2 = 0.618 (3)
Where TP and TSS are in mg/L. This regression and the other statistics do not include the data from
November 24, 2001.
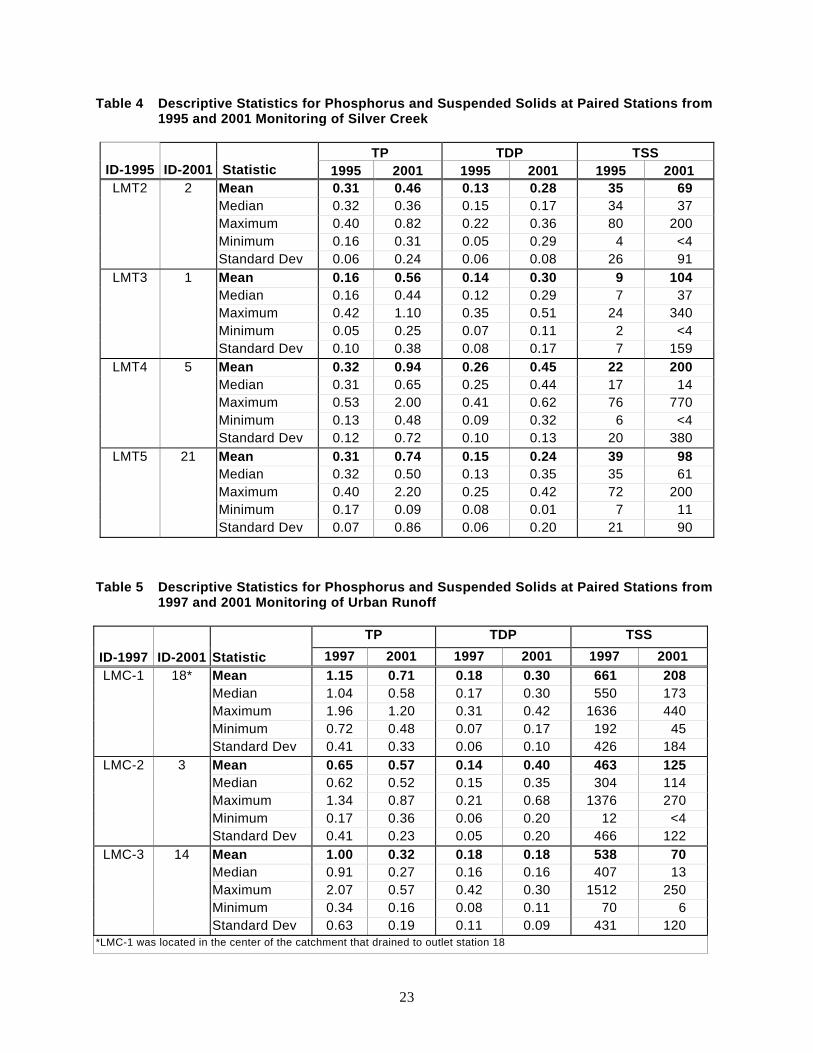
3.4 Comparison of 1995/1997 and 2001 Results The results of event sampling in 2001 demonstrate the impact of runoff on the water quality of Silver
Creek. A number of comparisons can be made between the results from 1995 and 2001 (Table 4). In
1995, the LMT5 station was located at approximately the same place as Station 21 in the 2001
monitoring. Continuous monitoring data from 1995 showed a phosphorus concentration ranging
from 0.167 to 0.402 mg/L, with a mean of 0.310 mg/L. This monitoring included mostly dry weather
periods; therefore, it may be representative of baseflow conditions. In contrast, the 2001 monitoring
was snowmelt and storm events. The total phosphorus concentration at Station 21 ranged from 0.50
to 2.20 mg/L during the spring and summer storms, but was only 0.150 mg/L during the spring
snowmelt. Clearly, wet weather periods contributed higher flows and concentrations, resulting in
greater nutrient and sediment loading to Lake Madison.
Two of the urban runoff monitoring stations in 1997, LMC-2 and LMC-3, correspond to the 2001
outlet stations 3 and 14. The third urban runoff station, LMC-1 was located in the center of the
catchment that drains to station 18. The descriptive statistics of these stations for 1997 and 2001 are
compared in Table 5. Certainly differences are to be expected given the different precipitation
conditions of the two years (1995 was considerably drier than normal, while 2001 appears be close to
normal). Furthermore, the 1997 samples were collected with automated samplers and composited
samples throughout a storm event, whereas the 2001 samples were single grab samples during
snowmelt and two storm events. Noteworthy similarities between the two years are:

22
• LMC-2 and 3 showing similar total phosphorus concentrations (means of 0.65 mg/L and
0.57 mg/L)
• LMC-3 and 14 had identical total dissolved phosphorus concentrations (means of 0.18 mg/L)
Noteworthy differences between the two years are:
• TSS concentrations were considerably higher in 1997 than in 2001. This could be caused by
longer antecedent periods in 1995, given that it was drier year. The higher TSS in 1995 could
also be the result of more complete sampling throughout the storm event.
• TDP was generally higher in the 2001 samples and represented a much higher fraction of TP.
The higher TDP fraction is undoubtedly related to the lower TSS in 2001.
• LMC-3 and Station 14 were quite different in the mean and range of TP concentrations.
Unfortunately, we do not have similar comparisons for the downstream outlet, Station 15, which
appears to drain the same catchment as station 14; and station 15 was shown to be have some of
the highest TP concentrations in 2001 among the outlets.
23
Table 4 Descriptive Statistics for Phosphorus and Suspended Solids at Paired Stations from 1995 and 2001 Monitoring of Silver Creek
TP TDP TSS ID-1995 ID-2001 Statistic 1995 2001 1995 2001 1995 2001
Mean 0.31 0.46 0.13 0.28 35 69 Median 0.32 0.36 0.15 0.17 34 37 Maximum 0.40 0.82 0.22 0.36 80 200 Minimum 0.16 0.31 0.05 0.29 4 <4
LMT2 2
Standard Dev 0.06 0.24 0.06 0.08 26 91 Mean 0.16 0.56 0.14 0.30 9 104 Median 0.16 0.44 0.12 0.29 7 37 Maximum 0.42 1.10 0.35 0.51 24 340 Minimum 0.05 0.25 0.07 0.11 2 <4
LMT3 1
Standard Dev 0.10 0.38 0.08 0.17 7 159 Mean 0.32 0.94 0.26 0.45 22 200 Median 0.31 0.65 0.25 0.44 17 14 Maximum 0.53 2.00 0.41 0.62 76 770 Minimum 0.13 0.48 0.09 0.32 6 <4
LMT4 5
Standard Dev 0.12 0.72 0.10 0.13 20 380 Mean 0.31 0.74 0.15 0.24 39 98 Median 0.32 0.50 0.13 0.35 35 61 Maximum 0.40 2.20 0.25 0.42 72 200 Minimum 0.17 0.09 0.08 0.01 7 11
LMT5 21
Standard Dev 0.07 0.86 0.06 0.20 21 90
Table 5 Descriptive Statistics for Phosphorus and Suspended Solids at Paired Stations from 1997 and 2001 Monitoring of Urban Runoff
TP TDP TSS ID-1997 ID-2001 Statistic 1997 2001 1997 2001 1997 2001
Mean 1.15 0.71 0.18 0.30 661 208 Median 1.04 0.58 0.17 0.30 550 173 Maximum 1.96 1.20 0.31 0.42 1636 440 Minimum 0.72 0.48 0.07 0.17 192 45
LMC-1 18*
Standard Dev 0.41 0.33 0.06 0.10 426 184 Mean 0.65 0.57 0.14 0.40 463 125 Median 0.62 0.52 0.15 0.35 304 114 Maximum 1.34 0.87 0.21 0.68 1376 270 Minimum 0.17 0.36 0.06 0.20 12 <4
LMC-2 3
Standard Dev 0.41 0.23 0.05 0.20 466 122 Mean 1.00 0.32 0.18 0.18 538 70 Median 0.91 0.27 0.16 0.16 407 13 Maximum 2.07 0.57 0.42 0.30 1512 250 Minimum 0.34 0.16 0.08 0.11 70 6
LMC-3 14
Standard Dev 0.63 0.19 0.11 0.09 431 120 *LMC-1 was located in the center of the catchment that drained to outlet station 18
24
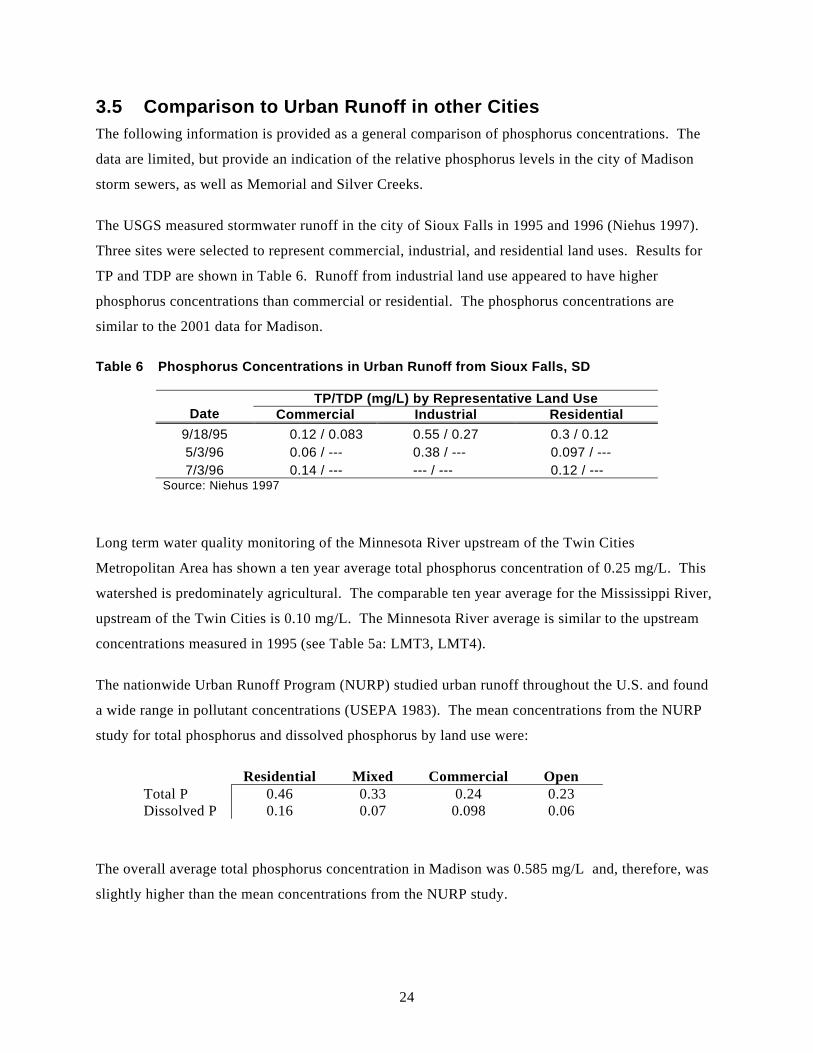
3.5 Comparison to Urban Runoff in other Cities The following information is provided as a general comparison of phosphorus concentrations. The
data are limited, but provide an indication of the relative phosphorus levels in the city of Madison
storm sewers, as well as Memorial and Silver Creeks.
The USGS measured stormwater runoff in the city of Sioux Falls in 1995 and 1996 (Niehus 1997).
Three sites were selected to represent commercial, industrial, and residential land uses. Results for
TP and TDP are shown in Table 6. Runoff from industrial land use appeared to have higher
phosphorus concentrations than commercial or residential. The phosphorus concentrations are
similar to the 2001 data for Madison.
Table 6 Phosphorus Concentrations in Urban Runoff from Sioux Falls, SD
TP/TDP (mg/L) by Representative Land Use Date Commercial Industrial Residential
9/18/95 0.12 / 0.083 0.55 / 0.27 0.3 / 0.12 5/3/96 0.06 / --- 0.38 / --- 0.097 / --- 7/3/96 0.14 / --- --- / --- 0.12 / ---
Source: Niehus 1997
Long term water quality monitoring of the Minnesota River upstream of the Twin Cities
Metropolitan Area has shown a ten year average total phosphorus concentration of 0.25 mg/L. This
watershed is predominately agricultural. The comparable ten year average for the Mississippi River,
upstream of the Twin Cities is 0.10 mg/L. The Minnesota River average is similar to the upstream
concentrations measured in 1995 (see Table 5a: LMT3, LMT4).
The nationwide Urban Runoff Program (NURP) studied urban runoff throughout the U.S. and found
a wide range in pollutant concentrations (USEPA 1983). The mean concentrations from the NURP
study for total phosphorus and dissolved phosphorus by land use were:
Residential Mixed Commercial Open Total P 0.46 0.33 0.24 0.23 Dissolved P 0.16 0.07 0.098 0.06
The overall average total phosphorus concentration in Madison was 0.585 mg/L and, therefore, was
slightly higher than the mean concentrations from the NURP study.
25
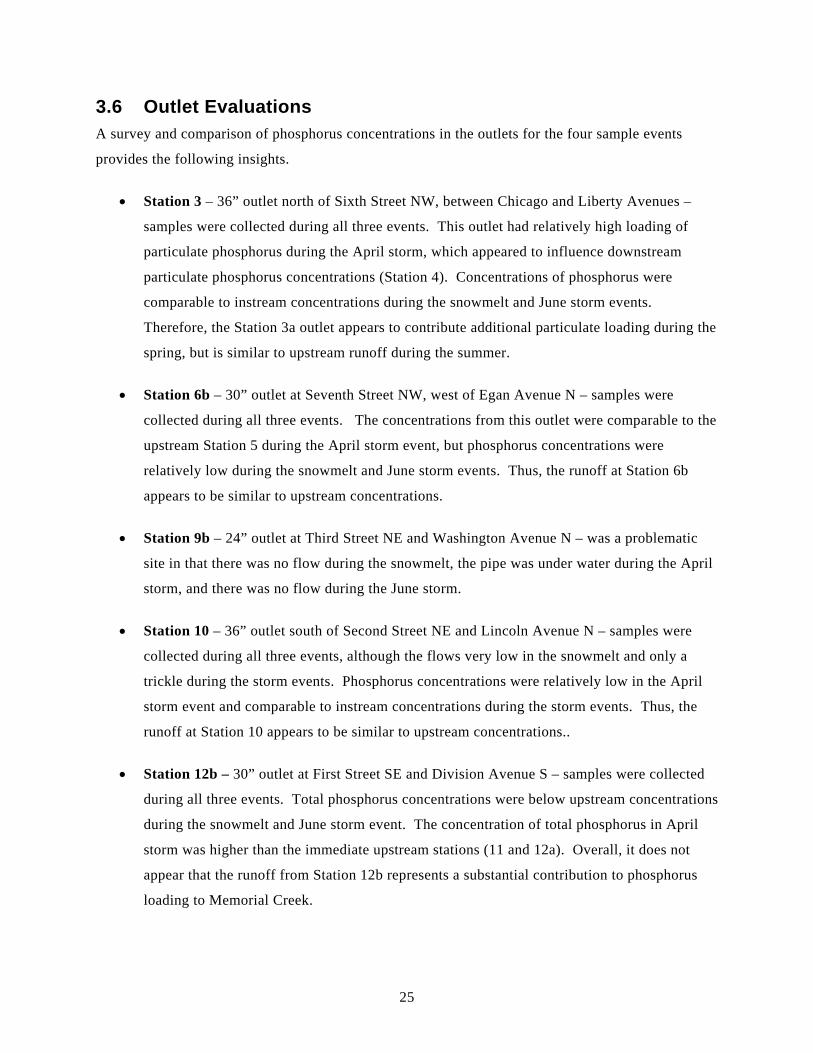
3.6 Outlet Evaluations A survey and comparison of phosphorus concentrations in the outlets for the four sample events
provides the following insights.
• Station 3 – 36” outlet north of Sixth Street NW, between Chicago and Liberty Avenues –
samples were collected during all three events. This outlet had relatively high loading of
particulate phosphorus during the April storm, which appeared to influence downstream
particulate phosphorus concentrations (Station 4). Concentrations of phosphorus were
comparable to instream concentrations during the snowmelt and June storm events.
Therefore, the Station 3a outlet appears to contribute additional particulate loading during the
spring, but is similar to upstream runoff during the summer.
• Station 6b – 30” outlet at Seventh Street NW, west of Egan Avenue N – samples were
collected during all three events. The concentrations from this outlet were comparable to the
upstream Station 5 during the April storm event, but phosphorus concentrations were
relatively low during the snowmelt and June storm events. Thus, the runoff at Station 6b
appears to be similar to upstream concentrations.
• Station 9b – 24” outlet at Third Street NE and Washington Avenue N – was a problematic
site in that there was no flow during the snowmelt, the pipe was under water during the April
storm, and there was no flow during the June storm.
• Station 10 – 36” outlet south of Second Street NE and Lincoln Avenue N – samples were
collected during all three events, although the flows very low in the snowmelt and only a
trickle during the storm events. Phosphorus concentrations were relatively low in the April
storm event and comparable to instream concentrations during the storm events. Thus, the
runoff at Station 10 appears to be similar to upstream concentrations..
• Station 12b – 30” outlet at First Street SE and Division Avenue S – samples were collected
during all three events. Total phosphorus concentrations were below upstream concentrations
during the snowmelt and June storm event. The concentration of total phosphorus in April
storm was higher than the immediate upstream stations (11 and 12a). Overall, it does not
appear that the runoff from Station 12b represents a substantial contribution to phosphorus
loading to Memorial Creek.
26
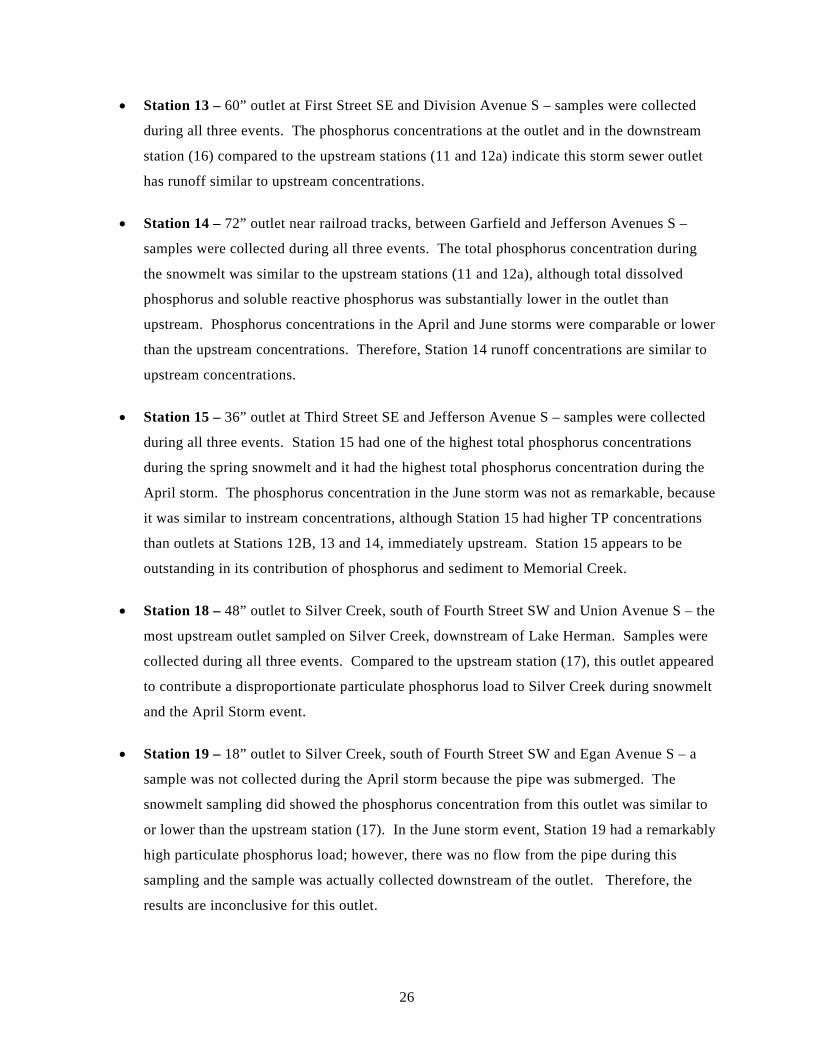
• Station 13 – 60” outlet at First Street SE and Division Avenue S – samples were collected
during all three events. The phosphorus concentrations at the outlet and in the downstream
station (16) compared to the upstream stations (11 and 12a) indicate this storm sewer outlet
has runoff similar to upstream concentrations.
• Station 14 – 72” outlet near railroad tracks, between Garfield and Jefferson Avenues S –
samples were collected during all three events. The total phosphorus concentration during
the snowmelt was similar to the upstream stations (11 and 12a), although total dissolved
phosphorus and soluble reactive phosphorus was substantially lower in the outlet than
upstream. Phosphorus concentrations in the April and June storms were comparable or lower
than the upstream concentrations. Therefore, Station 14 runoff concentrations are similar to
upstream concentrations.
• Station 15 – 36” outlet at Third Street SE and Jefferson Avenue S – samples were collected
during all three events. Station 15 had one of the highest total phosphorus concentrations
during the spring snowmelt and it had the highest total phosphorus concentration during the
April storm. The phosphorus concentration in the June storm was not as remarkable, because
it was similar to instream concentrations, although Station 15 had higher TP concentrations
than outlets at Stations 12B, 13 and 14, immediately upstream. Station 15 appears to be
outstanding in its contribution of phosphorus and sediment to Memorial Creek.
• Station 18 – 48” outlet to Silver Creek, south of Fourth Street SW and Union Avenue S – the
most upstream outlet sampled on Silver Creek, downstream of Lake Herman. Samples were
collected during all three events. Compared to the upstream station (17), this outlet appeared
to contribute a disproportionate particulate phosphorus load to Silver Creek during snowmelt
and the April Storm event.
• Station 19 – 18” outlet to Silver Creek, south of Fourth Street SW and Egan Avenue S – a
sample was not collected during the April storm because the pipe was submerged. The
snowmelt sampling did showed the phosphorus concentration from this outlet was similar to
or lower than the upstream station (17). In the June storm event, Station 19 had a remarkably
high particulate phosphorus load; however, there was no flow from the pipe during this
sampling and the sample was actually collected downstream of the outlet. Therefore, the
results are inconclusive for this outlet.

27
• Station 20b – 36” outlet to Silver Creek, upstream of the confluence with Memorial Creek.
This outlet was not sampled during the June storm event because there was no flow in the
pipe. This outlet had the highest total phosphorus concentration in the spring snowmelt and
two-thirds of the total phosphorus was in the particulate form. This outlet had the second
highest phosphorus concentration in the April storm event, and 88 percent of the total
phosphorus was in the particulate form. Therefore, runoff from this drainage are appears to
disproportionately contribute particulate phosphorus to the receiving water.
The conclusion from this survey of phosphorus concentrations in the storm sewers is that runoff from
most of the outlets appear to be similar to upstream concentrations and therefore do not contribute a
disproportionate amount of phosphorus to the creek. The exceptions – those outlets that do
contribute a disproportionate concentration of phosphorus – are Stations 20b, 15, and 18. Based on
this water quality sampling, these three drainage areas should receive the highest priority for
consideration of best management practices.
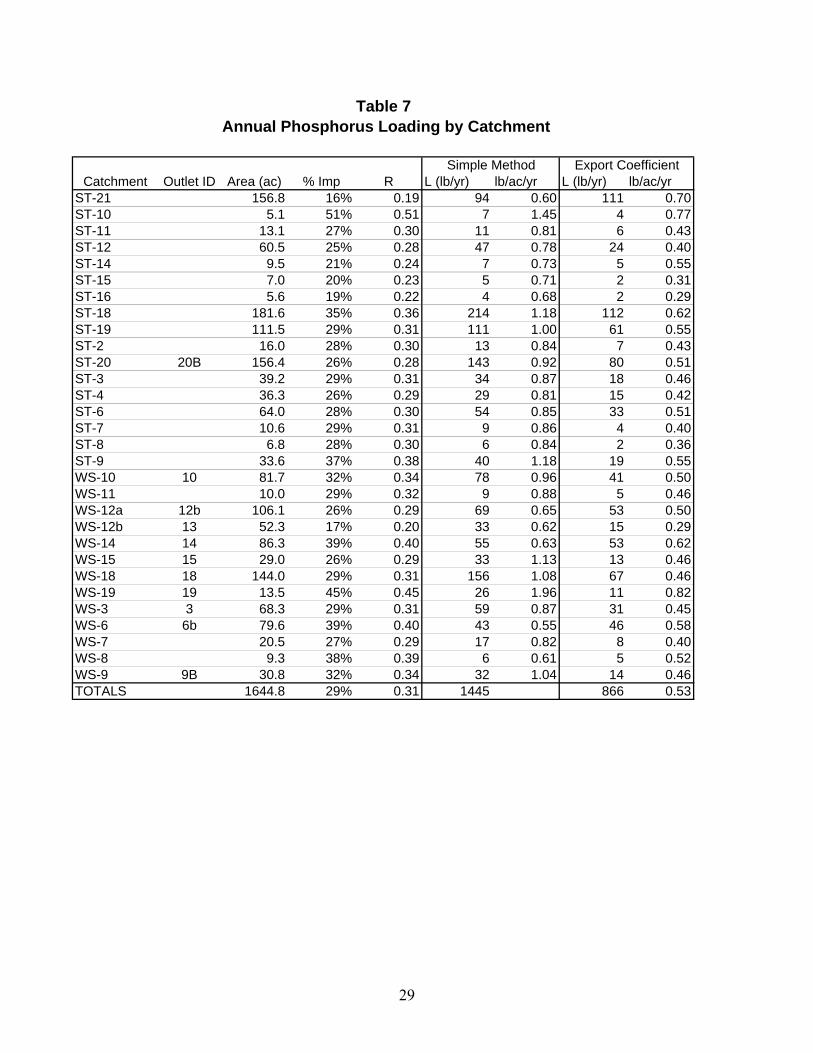
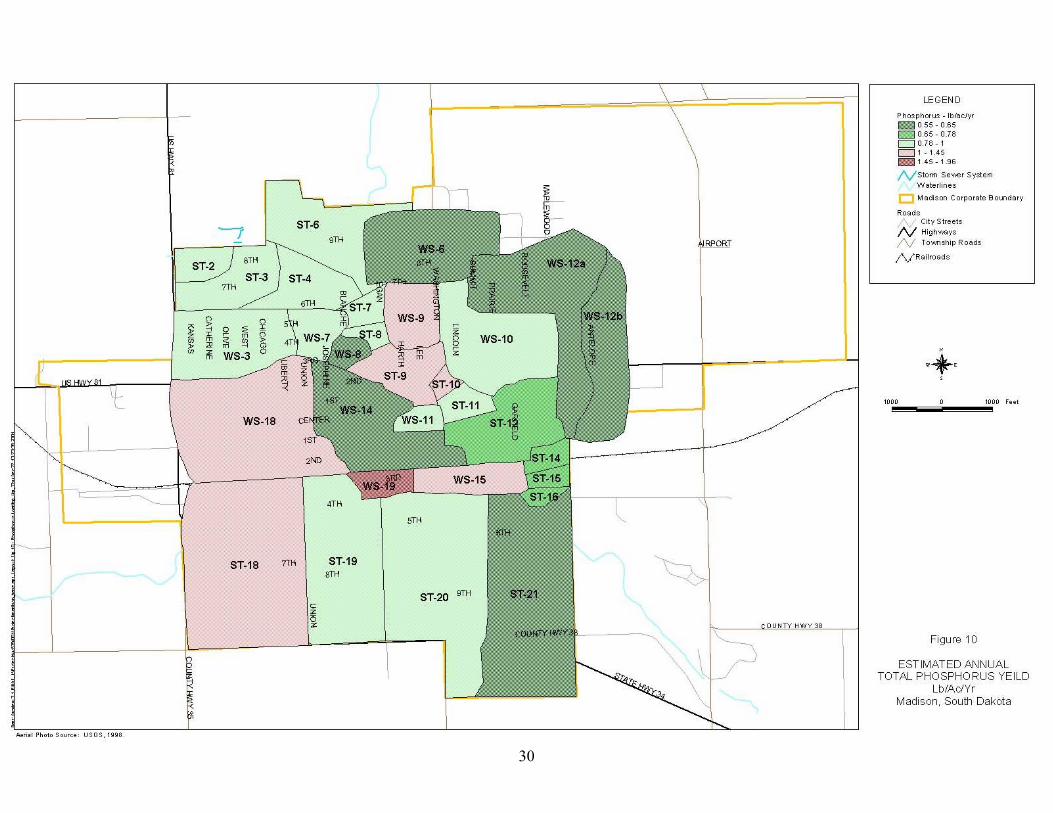
3.7 Estimated Phosphorus Loadings Total phosphorus loads were estimated for each catchment to determine the areas of the city that
appear to have the largest contributions to phosphorus loading on an annual basis. The mean total
phosphorus concentration by catchment, based on the 2001 sampling results, ranged from 0.278 mg/L
to 0.877 mg/L, with a grand mean of 0.585 mg/L (Table 7). The results of the estimated annual total
phosphorus yield calculations are shown in Figure 10 as pounds per acre per year (lb/ac/yr). The
absolute load will vary with the selected year because of difference in precipitation. As indicated
above, the rainfall for 2001 was very close to normal. Therefore the normal annual precipitation of
24 inches was used for this comparison. The average unit area loading was 0.88 lb P/ac/year. The
highest unit area phosphorus loadings were from ST-10 and WS-19 (1.45 and 1.96 lb/ac/yr).
The estimated annual phosphorus load from the city for a normal precipitation year was 1445 pounds.
This estimate is considerably less than WAFR estimates of 4,889 lbs using 1995 rainfall data (33
inches) or 2,961 lbs using the 1997 rainfall data (20 inches). The lower estimate in this study can be
attributed to the smaller delineated surface area (1645 acres in this study compared to 2215 acres in
WAFR) and to the lower phosphorus concentrations (WARF used a single mean concentration of
0.995 mg/L). The higher measured phosphorus concentrations in 1997 could be due to numerous
factors, including differences in sampling and/or longer antecedent periods (i.e., dry periods between
storms).

28
The results of this analysis based on the Simple Method were compared to an estimate of phosphorus
loading based on phosphorus land use export coefficients. The export coefficients are estimates of
annual phosphorus loads for a give land use. The source of most of the export coefficients is
Schueler (1987), the same reference cited for the Simple Method. As seen in Figure 10 and
compared to the previous figure, the export coefficients appear to underestimate phosphorus loading
for the city of Madison. The export coefficient approach again shows ST-10 and WS-19 with the
highest unit area phosphorus loads. An interesting difference between the two approaches is the
estimated phosphorus load for WS-14, which covers the central commercial area of Madison. The
Simple Method estimate shows WS-14 ranked as one of the lower per unit loads at 0.63 lb/ac/yr,
while the export coefficient estimate show WS-14 ranked as one the higher per unit loads at
0.62 lb/ac/yr.
Catchment Outlet ID Area (ac) % Imp R L (lb/yr) lb/ac/yr L (lb/yr) lb/ac/yrST-21 156.8 16% 0.19 94 0.60 111 0.70ST-10 5.1 51% 0.51 7 1.45 4 0.77ST-11 13.1 27% 0.30 11 0.81 6 0.43ST-12 60.5 25% 0.28 47 0.78 24 0.40ST-14 9.5 21% 0.24 7 0.73 5 0.55ST-15 7.0 20% 0.23 5 0.71 2 0.31ST-16 5.6 19% 0.22 4 0.68 2 0.29ST-18 181.6 35% 0.36 214 1.18 112 0.62ST-19 111.5 29% 0.31 111 1.00 61 0.55ST-2 16.0 28% 0.30 13 0.84 7 0.43ST-20 20B 156.4 26% 0.28 143 0.92 80 0.51ST-3 39.2 29% 0.31 34 0.87 18 0.46ST-4 36.3 26% 0.29 29 0.81 15 0.42ST-6 64.0 28% 0.30 54 0.85 33 0.51ST-7 10.6 29% 0.31 9 0.86 4 0.40ST-8 6.8 28% 0.30 6 0.84 2 0.36ST-9 33.6 37% 0.38 40 1.18 19 0.55WS-10 10 81.7 32% 0.34 78 0.96 41 0.50WS-11 10.0 29% 0.32 9 0.88 5 0.46WS-12a 12b 106.1 26% 0.29 69 0.65 53 0.50WS-12b 13 52.3 17% 0.20 33 0.62 15 0.29WS-14 14 86.3 39% 0.40 55 0.63 53 0.62WS-15 15 29.0 26% 0.29 33 1.13 13 0.46WS-18 18 144.0 29% 0.31 156 1.08 67 0.46WS-19 19 13.5 45% 0.45 26 1.96 11 0.82WS-3 3 68.3 29% 0.31 59 0.87 31 0.45WS-6 6b 79.6 39% 0.40 43 0.55 46 0.58WS-7 20.5 27% 0.29 17 0.82 8 0.40WS-8 9.3 38% 0.39 6 0.61 5 0.52WS-9 9B 30.8 32% 0.34 32 1.04 14 0.46TOTALS 1644.8 29% 0.31 1445 866 0.53
Table 7 Annual Phosphorus Loading by Catchment
Simple Method Export Coefficient
29
30

31
3.8 Urban Best Management Practices Constructed urban best management practices (BMPs) are selected for site-specific conditions. Site-
specific design is beyond the scope of this study, but the Stormwater Treatment BMP Selection
Matrix (Appendix D) provides a stepwise process for selecting BMPs for specific sites. For example,
the Step 1 Matrix shows infiltration and bioretention filtration as the most effective processes for
removing nutrients. Step 2 Matrix shows the physical feasibility factors, such as needed soil
conditions and surface area, needed for each of the 16 BMPs. Step 3 Matrix shows the community
and environmental factors to consider for the BMPS, such as community acceptance, cost, and
wildlife habitat. The developing areas around the perimeter of the city are best suited for this
selection process because of the availability of land for siting BMPs.
For the city, in general and especially for areas of the city where land for constructed BMPs are
unavailable, the runoff pollution prevention BMPs should be considered. These include pavement
management (i.e., street sweeping, alternative product and application rates) and erosion control
practices. Appendix D includes a discussion of pavement management.
Housekeeping BMPs include:
• Fertilizer management – soil test for phosphorus: no phosphate fertilizer needed if over 50 lb
P/acre
• Litter control (leaves and lawn clippings) – a study of storm runoff into Minneapolis lakes
found P-levels reduced 30-40% when street gutters kept free of leaves and lawn clippings
(Shapiro and Pfannkuck 1973).
• Catch basin cleaning – clean catch basins can remove pollutant loads during the first flush of
a storm event
• Street sweeping – best done in spring and fall
• De-icing chemical use – cover salt piles and prevent runoff
• Proper construction site erosion and sediment control
32
4.0 Methods for Sediment Analysis
4.1 Bourne Slough and Round Lake Sediments The three parts of the Bourne Slough sediment study were (1) survey of sediment depth, to estimate
sediment volume, (2) collect sediment samples, to determine the concentration of phosphorus in the
sediments, and (3) assess the amount of particulate phosphorus in the water column. Conventional
survey methods were used to survey the perimeter of the slough and each point of sediment depth
measurement. Sediment depth was determined by first measuring water depth to top of sediment,
using a delineated rope and weight, and then pressing a one inch diameter steel pipe (with a cap on
the end) into the sediment and measuring the distance the pipe penetrated into the sediment. The
survey data was compiled in AutoCAD and, along with the sediment depth measurements, a map of
sediment depth was prepared and the volume of sediment was estimated.
A piston core, consisting of a Plexiglas sleeve and a rubber plug attached to steel rod, was used to
extract three sediment cores from the Bourne Slough and one sediment core from Round Lake. The
only surveying on Round Lake was to identify the location of the sediment core, which was generally
in the center of the lake. The three cores in Bourne Slough were aligned in a transect down the
length of the longest axis of the slough (approximately northwest-southeast direction), which
included the areas of greatest sediment accumulation.
A sediment sub-sample was collected from the top five centimeters of the sediment core, because it
represents the sediment directly exposed to the water column and most likely subject to resuspension
from wind-driven turbulence. The sediment samples were analyzed for extractable phosphorus and
total phosphorus at Braun Intertec Laboratory, Minneapolis. The total phosphorus method is EPA
Method 365.3, which is the standard method for total phosphorus analysis. The extractable
phosphorus is a measure of the phosphorus that is bound to iron or sorbed phosphorus that is
available for release to the water column under reducing (i.e., anaerobic) conditions. The method
was first reported by Psenner (1984) and more recently by Rydin and Welch (1998).

33
5.0 Results and Discussion for Bourne Slough and Round Lake
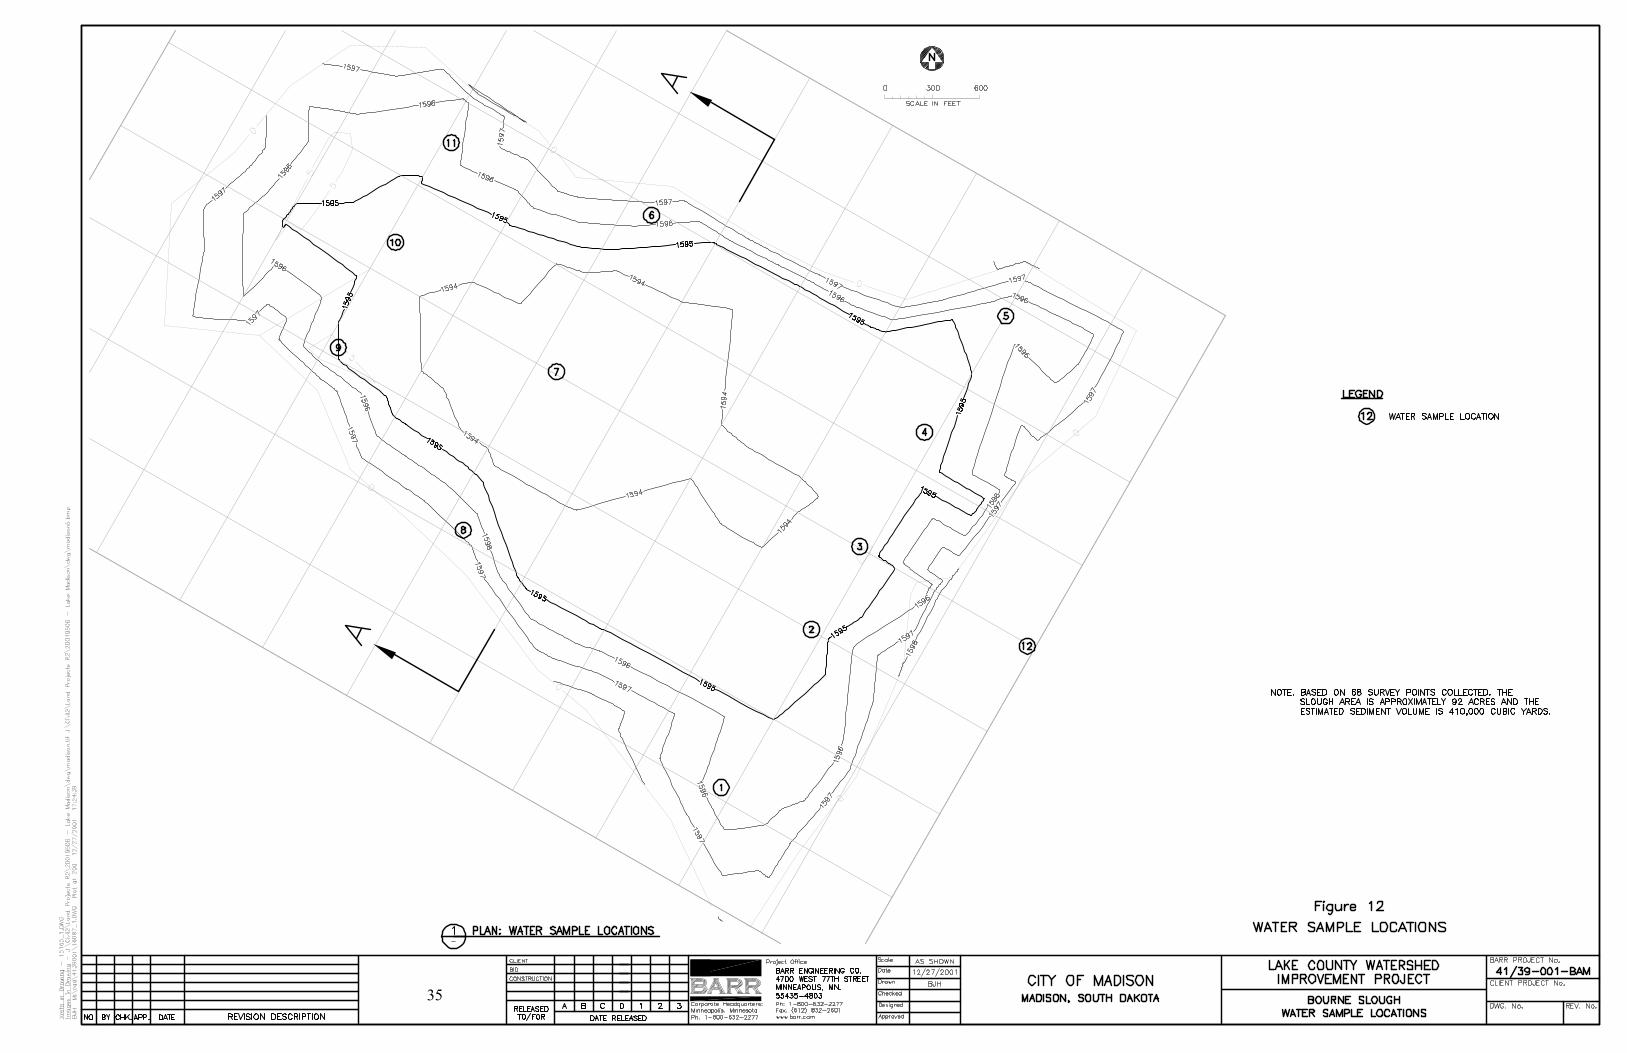
5.1 Sediments in Bourne Slough and Round Lake The surface area, bottom depth, and sediment depth of Bourne Slough were surveyed on February 26
through 28, 2001. A total of 68 sediment depth measurements were recorded to provide an estimate
of the amount of sediment in the slough. A sediment depth contour map was created from these
measurements (Figure 11). The surface area of the slough is 92 acres and it has an estimated
sediment volume of 410,000 cubic yards. Maximum depth in the slough is about 8.5 feet.
During the sediment survey, three sediment cores were collected (locations shown in Figure 11). A
sediment core was also collected from Round Lake and the same procedure was followed for sample
collection and analysis. The remaining four sediment cores have been kept in a freezer for potentially
later analysis of other parameters. Sediment samples from the cores were extruded in the field.
Phosphorus analysis indicates the fraction of total phosphorus that is extractable phosphorus is fairly
consistent among the three cores: approximately 5-6% (Table 8). Comparing the northwest end
(Station 48) of the slough with the southeast end (Station 54) shows about a 25% higher total
phosphorus concentration in the southeast end sediments. The higher concentration corresponds to
the inflow from Silver Creek, which enters the slough on the south side.
5.2 Water Sample Collection in Bourne Slough A grid of eleven water samples were collected from Bourne slough on October 28, 2001, and an
additional sample was collected in Lake Madison. The sampling grid of water is shown in Figure 12.
Samples were analyzed for total phosphorus and dissolved phosphorus.

34
35

36
Table 8 Sediment Phosphorus in Bourne Slough and Round Lake
Bourne Slough
Analyte* Round Lake Station 48** Station 51** Station 54**
Extractable Phosphorus 15.38 17.13 15.09 19.12
Total Phosphorus 300 280 290 350
Extractable P as Percentage of TP
5.1% 6.1% 5.2% 5.5%
Units: mg/Kg * 0-5 cm sediment samples Braun Intertec laboratory reported results on April 12, 2001 **See Figure 12 (Bourne Slough Sediment Map) for station locations
Among the seven lakes that Barr has extractable phosphorus and total phosphorus concentrations, the
average ratio of releasable to total P is 0.12; The extractable phosphorus concentrations in Bourne
Slough and Round Lake are similar for the concentrations in five Minnesota lakes, where the
releasable P concentration ranged from 5.1 to 19.28 mg/kg (wet wt.), but the total P concentrations in
Bourne Slough and Round Lake were much higher than these same lakes. Total P ranged from 77 to
140 mg/kg. This comparison indicates that most of the phosphorus in the sediments of Bourne
Slough and Round Lake is non-extractable phosphorus which is probably bound to calcium and not
likely to be released as a bioavailable form of phosphorus.
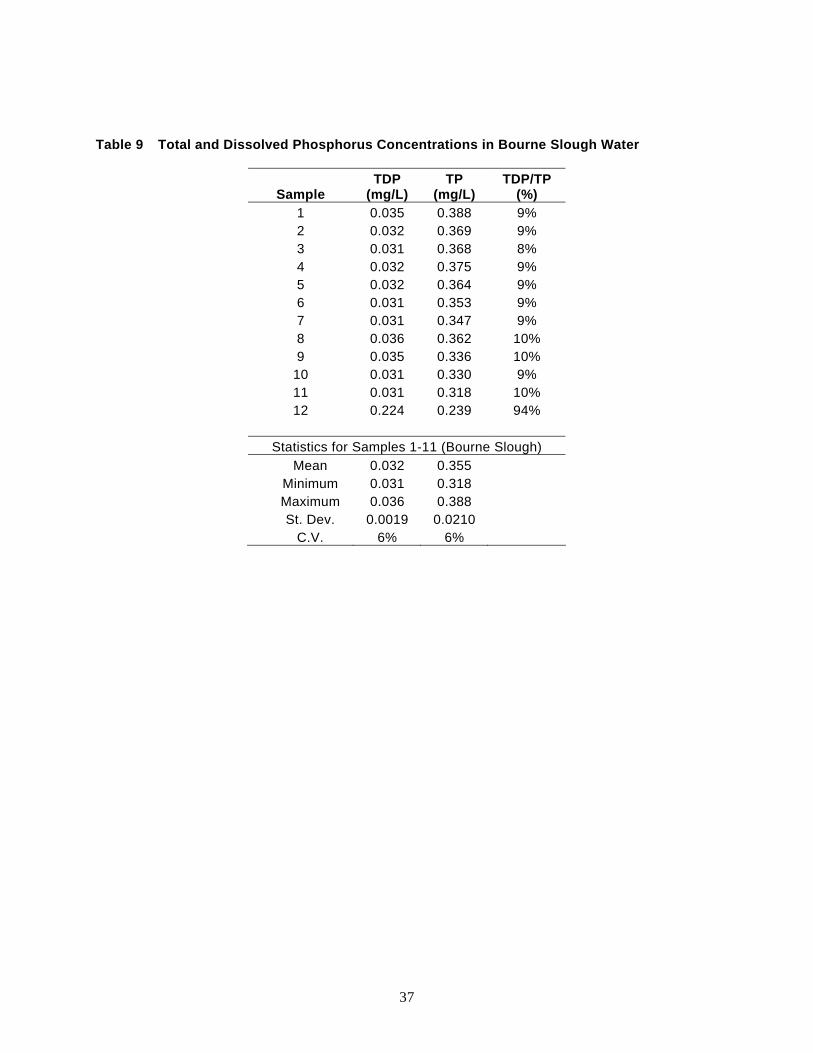
5.3 Water in Bourne Slough Wind speeds in the days prior to sampling had been in excess of 20-30 mph. When the samples were
collected the wind was out of the south-southwest at 8-15 mph. Dissolved oxygen, temperature, and
specific conductivity were vertically and horizontally uniform, indicating the slough was well mixed
(see Appendix E). Total phosphorus concentrations in the slough were high (average 0.355 mg/L),
and only varied from 0.32 to 0.39 mg/L (Table 9). Despite the small range in phosphorus
concentrations, there appeared to be a trend of higher concentrations near the mouth of Silver Creek
and decreasing with distance from the mouth. Approximately 90 percent of the total phosphorus was
in the particulate form. One sample was collected from Lake Madison on the same day and it had a
total phosphorus concentration of 0.239 mg/L, and only six percent was particulate phosphorus.
37
Table 9 Total and Dissolved Phosphorus Concentrations in Bourne Slough Water
Sample TDP
(mg/L) TP
(mg/L) TDP/TP
(%) 1 0.035 0.388 9% 2 0.032 0.369 9% 3 0.031 0.368 8% 4 0.032 0.375 9% 5 0.032 0.364 9% 6 0.031 0.353 9% 7 0.031 0.347 9% 8 0.036 0.362 10% 9 0.035 0.336 10%
10 0.031 0.330 9% 11 0.031 0.318 10% 12 0.224 0.239 94%
Statistics for Samples 1-11 (Bourne Slough)
Mean 0.032 0.355 Minimum 0.031 0.318 Maximum 0.036 0.388 St. Dev. 0.0019 0.0210
C.V. 6% 6%
38
5.4 Management of Bourne Slough for Phosphorus Reduction These results demonstrate that phosphorus in the Bourne Slough is primarily in the particulate
fraction, which suggests that detention with sufficient settling time could remove a large portion of
the phosphorus from the water column. The results of this sampling did not indicate that the
particulate phosphorus is generated from suspension of sediments from wind action; instead, the
results show the highest TP concentrations near the inflow from Silver Creek and the lowest TP
concentrations are on the north end of the slough—farthest from the inflow.
To effectively use the slough as a detention basin for removal of suspended solids, and most of the
phosphorus, sediments could be excavated to create a horseshoe-shaped channel to maximize the
length of flow path within the slough. This would route the flow coming in from Silver Creek in a
northwest direction toward the upper end of the slough and then back down in a southeasterly
direction toward the outlet to Lake Madison. Dredged sediments could be piled to create a barrier
wall between the inlet and outlet of the slough. The barrier wall would need to be armored with rock
to reduce erosion. To create the channel, at least 100,000 cubic yards of sediment would be dredged,
some of dredge spoils would most likely need to be placed outside of the slough. The actual
treatment efficiency expected from this conceptual design could be determined from modeling, but
would require more specific dimensions and water flow through the slough.
39
6.0 Conclusions
6.1 Urban Runoff Quality For this study, the urban area of Madison was delineated into 30 catchments (i.e., drainage areas) and
25 monitoring stations (11 storm sewer outlets; 14 in-stream) were sampled during a spring snowmelt
and three storm events. Water samples were analyzed for total phosphorus, dissolved phosphorus,
soluble reactive phosphorus, and total suspended solids. The spring snowmelt runoff contained
primarily dissolved phosphorus, whereas the larger the storm event, the greater the proportion of
particulate phosphorus. Overall, total phosphorus was highly correlated with total suspended solids.
The estimate from this study of total phosphorus load from the city of Madison is lower than his
estimate from the WAFR. The difference can be partially attributed to the WAFR study occurring
during a relative wet year (33 inches of precipitation compared to 24 inches for a normal year) and to
the larger area considered in the WAFR (2215 acres compared to 1645 acres in this study). The
reason for this difference is not known. The average total phosphorus concentration in the WAFR
was 0.995 mg/L and was applied to the entire city. In this study, the average total phosphorus
concentration was 0.585 mg/L, but mean concentrations were applied to each catchment and ranged
from 0.278 mg/L to 0.877 mg/L. Despite these differences between the phosphorus loading
estimated in WAFR and this study, they are relatively similar when compared to the estimated 23,351
lbs of phosphorus transported to Lake Madison from Silver and Memorial Creek Watersheds
(WAFR, p 14).
The WAFR concluded that Silver Creek contributed 92% of the phosphorus load to Lake Madison
and the City of Madison contributed 13% of the total load to Lake Madison in 1995. If BMPs could
be installed in the City of Madison that removed 60% of the phosphorus, that would reduce the
phosphorus loading to Lake Madison by approximately 8%, leaving 42% to be removed from other
sources to meet the 50% reduction goal. Although the phosphorus loading estimates were lower in
this study than were estimated in the WAFR, the relative contributions of urban runoff compared to
rural nonpoint source contributions appear to hold.
A comparison of the relative phosphorus loading from catchments within the city of Madison
indicate that several small drainage areas contribute a disproportionately high phosphorus load.
These drainage areas should be evaluated for BMPs to reduce the phosphorus loading.

40
Overall, the BMPs most likely to suit the conditions of the city of Madison are runoff pollution
prevention measures, such as pavement management. Street sweeping and other reductions of
particulate materials entering Silver and Memorial Creek can substantially reduce the phosphorus
loading from the city.
6.2 Bourne Slough The Bourne Slough sediments have high total phosphorus concentrations. Only about five percent of
the phosphorus could potentially be released as dissolved phosphorus, although the remaining 95
percent could be enter the water column as suspended sediments. The high proportion of particulate
phosphorus in the water column is most likely a result of input from Silver Creek.
The slough contains approximately 400,000 cubic yards of sediment. Excavating a portion of the
sediments and rerouting the flow in the slough could potentially improve sedimentation in the basin,
thereby reducing phosphorus entering Lake Madison. The flow path within the slough would need to
be increased, most likely by building a barrier within the slough that would route the flow around the
perimeter of the slough. Additional hydraulic modeling and engineering design would be needed to
estimate the phosphorus removal efficiency with the adjusted slough depth and water flow.
41
7.0 Recommendations
The following sections of this report describe recommendations pertaining to the following three
topics:
1. Detention Ponding of Runoff from the Urbanized Area of Madison, SD 2. Streambank Erosion Concerns Within the City of Madison, SD 3. Retention of Suspended Sediments on Bourne Slough
7.1 Detention Ponding of Runoff Because detention ponding will both reduce the rate of runoff and improve its quality, Barr
Engineering Co. makes the following recommendations about the technical feasibility and costs of
installing runoff detention basins at strategic locations within the urbanized area of the City of
Madison.
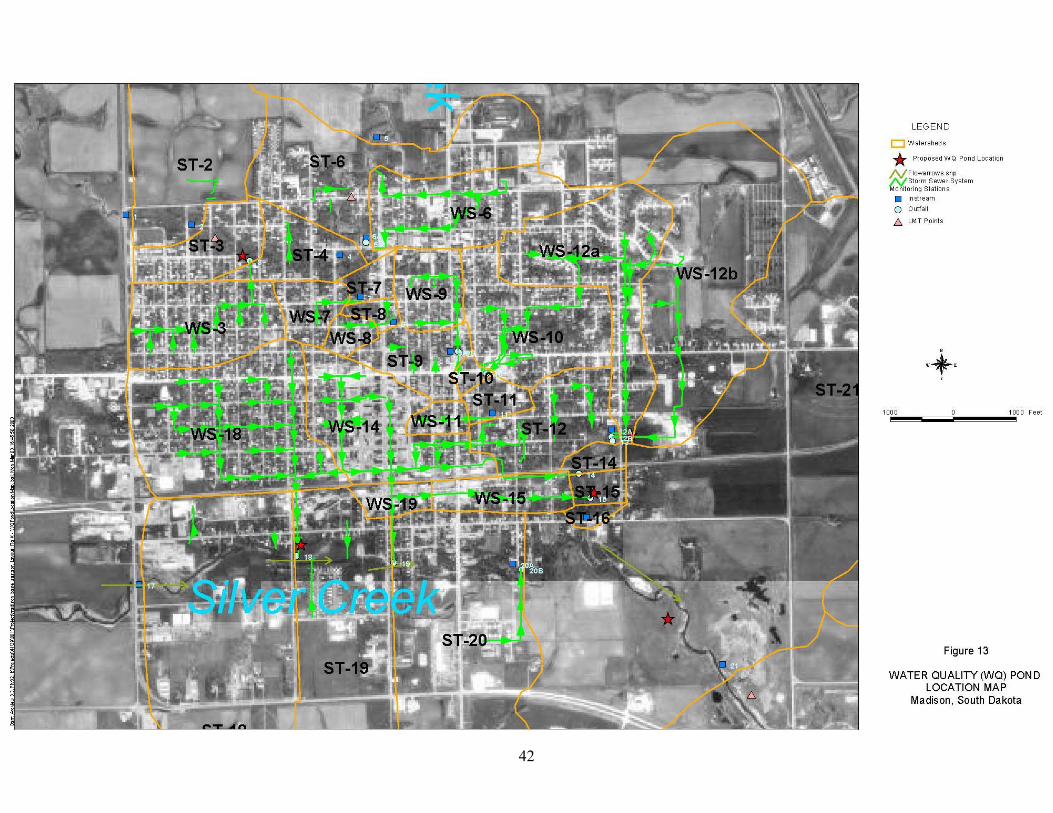
The Madison storm sewer drainage system is shown in Figure 13. Also shown on this figure are six
locations where we fell it is possible to construct runoff detention ponds. Five of these pond
locations are within the city proper, while the sixth location is downstream from the city, on the
creek leading to Bourne Slough. The five in-city ponding locations were chosen because they
provide sufficient room to construct ponds sized to meet Nationwide urban Runoff Program (NURP)
design criteria, and because ponds constructed there would intercept and detain runoff from a
significant fraction of the urban watershed.
The sixth runoff detention pond is intended to be a regional pond that operates as an off-channel,
low-flow capture device, located adjacent to Silver Creek. As such, creek flows up to a specified
maximum discharge rate (determined by pond size and stream channel discharge capacity) would be
diverted through the detention pond, while higher flows would bypass the diversion and pass into the
slough through the normal stream channel. This pond would treat the “first flush” of urban runoff,
before upstream runoff reached the off-channel ponding location.
The following Figures (14 through 16) illustrate the estimated phosphorus budgets for Lake Madison:
1. Currently (based on 2001 runoff monitoring results) 2. Assuming construction of the five recommended in-city runoff detention ponds. 3. Assuming construction of the regional off-channel, low-flow capture pond, respectively.
City of Madison runoff phosphorus contributions comprise 7.2, 6.3, and 2.8 percent of the annual
phosphorus load estimates, respectively, we estimate, for these three scenarios.
42
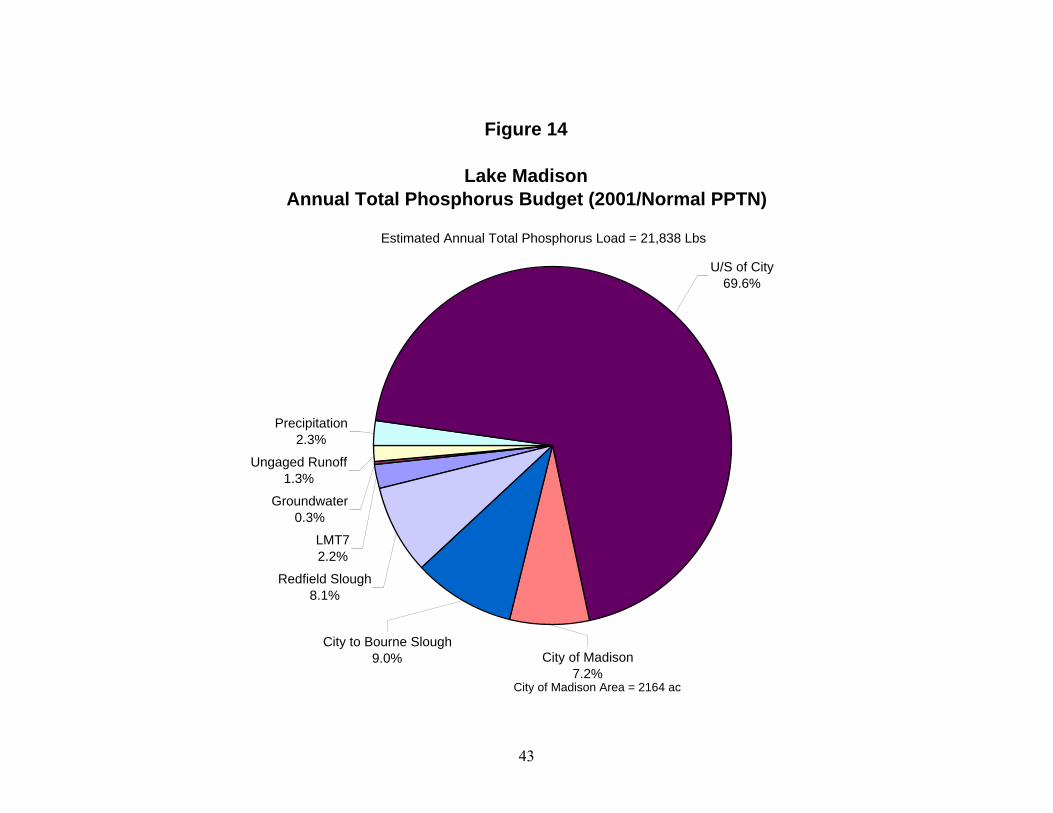
Figure 14
Lake Madison Annual Total Phosphorus Budget (2001/Normal PPTN)
LMT72.2%
Groundwater0.3%
Ungaged Runoff1.3%
Precipitation2.3%
Redfield Slough8.1%
City to Bourne Slough9.0% City of Madison
7.2%
U/S of City69.6%
City of Madison Area = 2164 ac
Estimated Annual Total Phosphorus Load = 21,838 Lbs
43
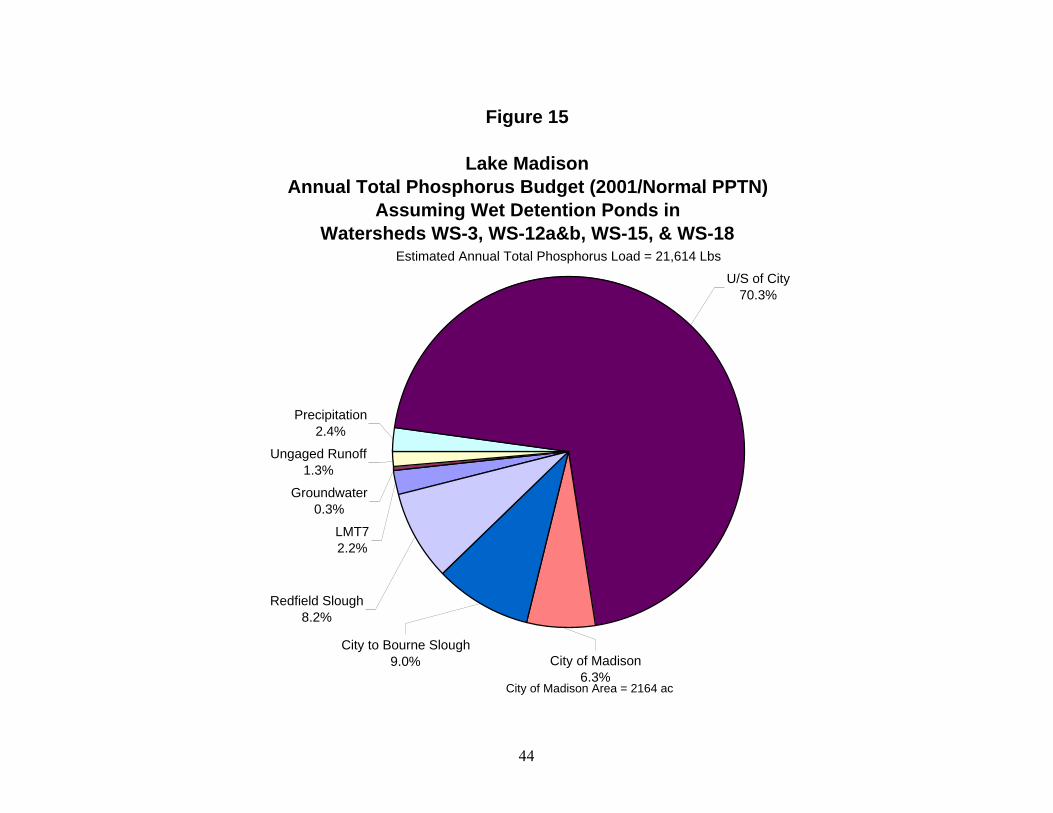
Figure 15
Lake Madison Annual Total Phosphorus Budget (2001/Normal PPTN)
Assuming Wet Detention Ponds in Watersheds WS-3, WS-12a&b, WS-15, & WS-18
LMT72.2%
Groundwater0.3%
Ungaged Runoff1.3%
Precipitation2.4%
Redfield Slough8.2%
U/S of City70.3%
City of Madison6.3%
City to Bourne Slough9.0%
City of Madison Area = 2164 ac
Estimated Annual Total Phosphorus Load = 21,614 Lbs
44

Figure 16
Lake Madison Annual Total Phosphorus Budget (2001/Normal PPTN)
Assuming One Wet Detention Pond Sized to Treat 1645 acres of Low Flow City Runoff
LMT72.3%
Groundwater0.3%
Ungaged Runoff1.3%
Precipitation2.4%
City to Bourne Slough9.4%
City of Madison2.8%
U/S of City72.9%
Redfield Slough8.5%
City of Madison Area = 2164 ac
Estimated Annual Total Phosphorus Load = 20,841 Lbs
45

46
Table 10 presents construction cost estimates for the six recommended runoff detention ponds.
These costs range from $34,000 for constructing a pond in subwatershed WS-15, to $984,000 for
building the off-channel, low-flow capture pond between the city and Bourne Slough.
Table 10 Preliminary Construction Cost Estimates for Runoff Detention Ponds—June 27, 2002
A. Cost Estimate for Wet Detention Pond to Treat Runoff from WS-18—June 27, 2002
Item Description Units Qty. Unit Cost Extension 1 Mobilization/Demobilization (15%) LS 1 $10,000.00 $10,000.002 Site Preparation/Clearing/Grubbing AC 1.2 $5,000.00 $6,000.003 Common Excavation CY 10,003 $4.00 $40,000.004 Outlet Control Structure LS 1 $10,000.00 $10,000.005 Restoration AC 1.2 $10,000.00 $12,000.00
Project Total $78,000.00 Contingency 25% $20,000.00 Engineering/Permitting/Administration 25% $20,000.00 Total $118,000.00
B. Cost Estimate for Wet Detention Pond to Treat Runoff from WS-12a&12b—June 27, 2002 Item Description Units Qty. Unit Cost Extension
1 Mobilization/Demobilization (15%) LS 1 $10,000.00 $10,000.002 Site Preparation/Clearing/Grubbing AC 1.1 $5,000.00 $6,000.003 Common Excavation CY 9,357 $4.00 $37,000.004 Outlet Control Structure LS 1 $10,000.00 $10,000.005 Restoration AC 1.1 $10,000.00 $11,000.00
Project Total $74,000.00 Contingency 25% $19,000.00 Engineering/Permitting/Administration 25% $19,000.00 Total $112,000.00
C. Cost Estimate for Wet Detention Pond to Treat Runoff from WS-3—June 27, 2002 Item Description Units Qty. Unit Cost Extension
1 Mobilization/Demobilization (15%) LS 1 $6,000.00 $6,000.002 Site Preparation/Clearing/Grubbing AC 0.7 $5,000.00 $4,000.003 Common Excavation CY 4,840 $4.00 $19,000.004 Outlet Control Structure LS 1 $10,000.00 $10,000.005 Restoration AC 0.7 $10,000.00 $7,000.00
Project Total $46,000.00 Contingency 25% $12,000.00 Engineering/Permitting/Administration 25% $12,000.00 Total $70,000.00
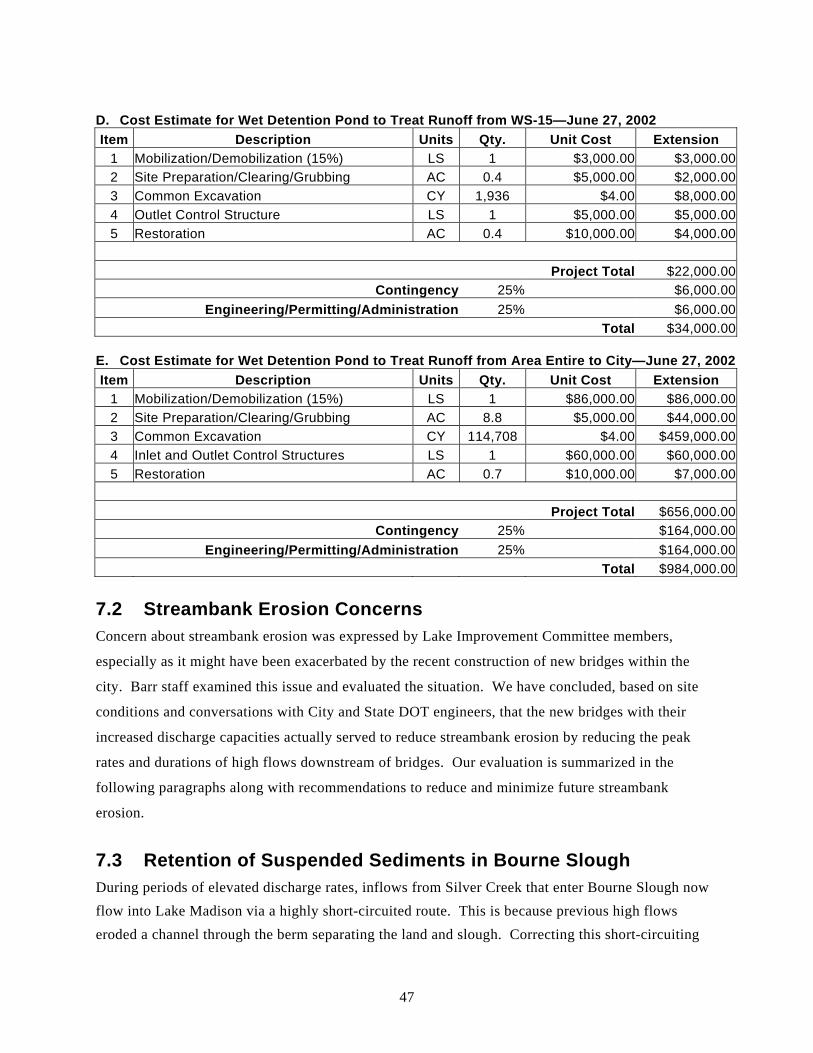
47
D. Cost Estimate for Wet Detention Pond to Treat Runoff from WS-15—June 27, 2002 Item Description Units Qty. Unit Cost Extension
1 Mobilization/Demobilization (15%) LS 1 $3,000.00 $3,000.002 Site Preparation/Clearing/Grubbing AC 0.4 $5,000.00 $2,000.003 Common Excavation CY 1,936 $4.00 $8,000.004 Outlet Control Structure LS 1 $5,000.00 $5,000.005 Restoration AC 0.4 $10,000.00 $4,000.00
Project Total $22,000.00 Contingency 25% $6,000.00 Engineering/Permitting/Administration 25% $6,000.00 Total $34,000.00
E. Cost Estimate for Wet Detention Pond to Treat Runoff from Area Entire to City—June 27, 2002Item Description Units Qty. Unit Cost Extension
1 Mobilization/Demobilization (15%) LS 1 $86,000.00 $86,000.002 Site Preparation/Clearing/Grubbing AC 8.8 $5,000.00 $44,000.003 Common Excavation CY 114,708 $4.00 $459,000.004 Inlet and Outlet Control Structures LS 1 $60,000.00 $60,000.005 Restoration AC 0.7 $10,000.00 $7,000.00
Project Total $656,000.00 Contingency 25% $164,000.00 Engineering/Permitting/Administration 25% $164,000.00 Total $984,000.00
7.2 Streambank Erosion Concerns Concern about streambank erosion was expressed by Lake Improvement Committee members,
especially as it might have been exacerbated by the recent construction of new bridges within the
city. Barr staff examined this issue and evaluated the situation. We have concluded, based on site
conditions and conversations with City and State DOT engineers, that the new bridges with their
increased discharge capacities actually served to reduce streambank erosion by reducing the peak
rates and durations of high flows downstream of bridges. Our evaluation is summarized in the
following paragraphs along with recommendations to reduce and minimize future streambank
erosion.
7.3 Retention of Suspended Sediments in Bourne Slough During periods of elevated discharge rates, inflows from Silver Creek that enter Bourne Slough now flow into Lake Madison via a highly short-circuited route. This is because previous high flows eroded a channel through the berm separating the land and slough. Correcting this short-circuiting

48
problem to increase hydraulic residence time in, and solids retention by the slough is feasible, we believe, and was evaluated to determine likely costs. Depending on underlying soil conditions and expected flows through the slough, restoration of the existing berm would require its restoration to a height of either 5- to 10-feet above the normal water level (Alternatives 1A and 1B), as shown in Figure 17. Such a project would cost between $689,000 and $1,591,000 to complete, we estimate (Table 11).
Table 11 Preliminary Construction Cost Estimates for Bourne Slough Berm Restoration Options—June 10, 2002
ALTERNATIVE 1A: RESTORE 5-ft. BERM AT BOURNE SLOUGH Item Description Units Qty. Unit Cost Extension
1 Mobilization/Demobilization (15%) LS 1 $60,000.00 $60,000.002 Site Preparation/Clearing/Grubbing LS 1 $10,000.00 $10,000.003 Geotextile Filter Fabric SY 10,000 $3.00 $30,000.004 Embankment Fill CY 3,000 $15.00 $45,000.005 Filter Material CY 800 $30.00 $24,000.006 Riprap CY 3500 $80.00 $280,000.007 Restoration LS 1 $10,000.00 $10,000.00
Project Total $459,000.00 Contingency 25% $115,000.00 Engineering/Permitting 25% $115,000.00 Total $689,000.00
(1) Mobilization includes erosion control features (2) Site Preparation includes clearing, preliminary grading, as necessary (3) Geotextile fabric placed beneath berm (4) Place 10' wide embankment with 3:1 side slopes (5) Place 6" granular filter material beneath riprap (6) Place 2' riprap along each side of berm (7) Restoration includes topsoil, erosion control blanket along top of berm, seeding and mulching.
(Notes) Assume new 1,500 ft. berm between Bourne Slough and Lake
ALTERNATIVE 1B: RESTORE 10-ft. BERM AT BOURNE SLOUGH Item Description Units Qty. Unit Cost Extension
1 Mobilization/Demobilization (15%) LS 1 $138,000.00 $138,000.002 Site Preparation/Clearing/Grubbing LS 1 $20,000.00 $20,000.003 Geotextile Filter Fabric SY 15,000 $3.00 $45,000.004 Embankment Fill CY 20,000 $12.00 $240,000.005 Filter Material CY 1,600 $30.00 $48,000.006 Riprap CY 7,000 $80.00 $560,000.007 Restoration LS 1 $10,000.00 $10,000.00
Project Total $1,061,000.00 Contingency 25% $265,000.00 Engineering/Permitting 25% $265,000.00 Total $1,591,000.00
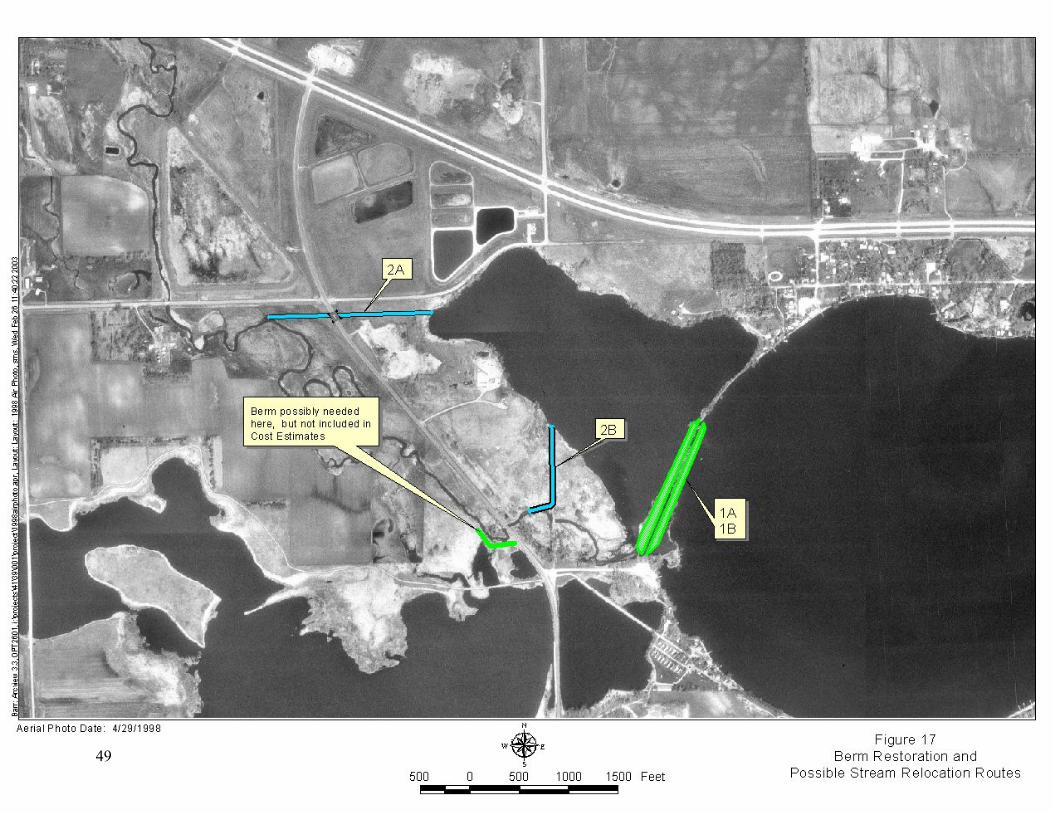
49
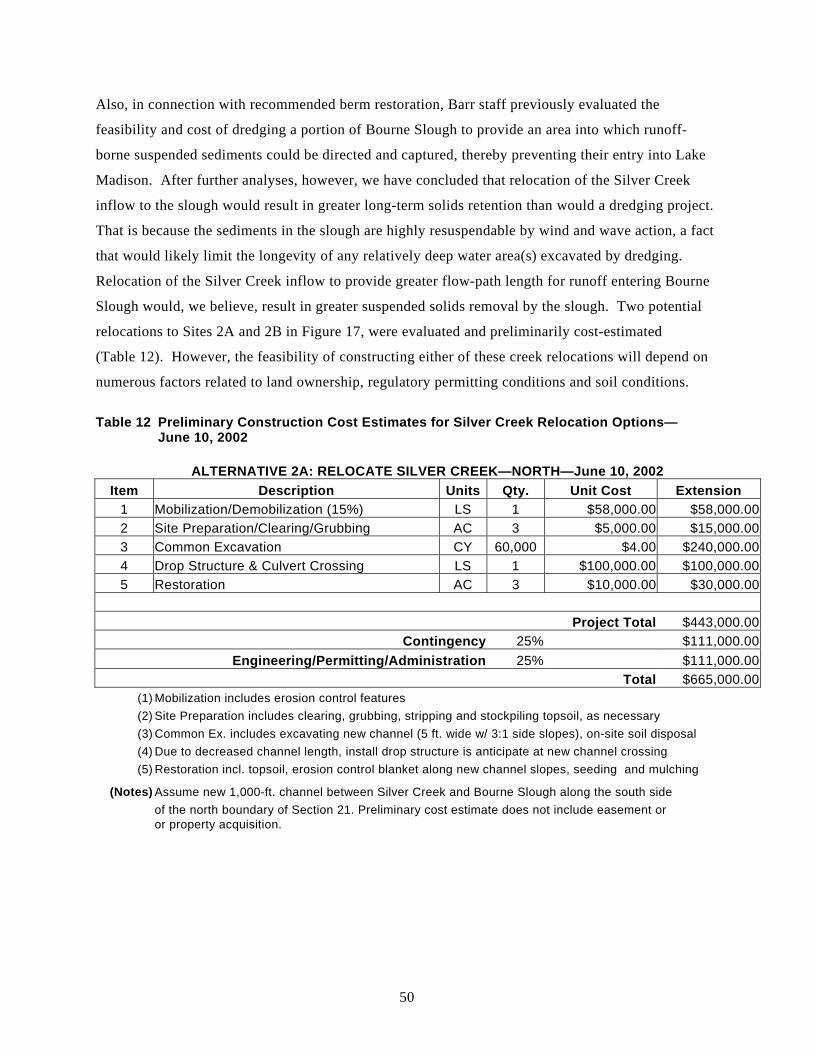
50
Also, in connection with recommended berm restoration, Barr staff previously evaluated the
feasibility and cost of dredging a portion of Bourne Slough to provide an area into which runoff-
borne suspended sediments could be directed and captured, thereby preventing their entry into Lake
Madison. After further analyses, however, we have concluded that relocation of the Silver Creek
inflow to the slough would result in greater long-term solids retention than would a dredging project.
That is because the sediments in the slough are highly resuspendable by wind and wave action, a fact
that would likely limit the longevity of any relatively deep water area(s) excavated by dredging.
Relocation of the Silver Creek inflow to provide greater flow-path length for runoff entering Bourne
Slough would, we believe, result in greater suspended solids removal by the slough. Two potential
relocations to Sites 2A and 2B in Figure 17, were evaluated and preliminarily cost-estimated
(Table 12). However, the feasibility of constructing either of these creek relocations will depend on
numerous factors related to land ownership, regulatory permitting conditions and soil conditions.
Table 12 Preliminary Construction Cost Estimates for Silver Creek Relocation Options—June 10, 2002
ALTERNATIVE 2A: RELOCATE SILVER CREEK—NORTH—June 10, 2002 Item Description Units Qty. Unit Cost Extension
1 Mobilization/Demobilization (15%) LS 1 $58,000.00 $58,000.002 Site Preparation/Clearing/Grubbing AC 3 $5,000.00 $15,000.003 Common Excavation CY 60,000 $4.00 $240,000.004 Drop Structure & Culvert Crossing LS 1 $100,000.00 $100,000.005 Restoration AC 3 $10,000.00 $30,000.00
Project Total $443,000.00 Contingency 25% $111,000.00 Engineering/Permitting/Administration 25% $111,000.00 Total $665,000.00
(1) Mobilization includes erosion control features (2) Site Preparation includes clearing, grubbing, stripping and stockpiling topsoil, as necessary (3) Common Ex. includes excavating new channel (5 ft. wide w/ 3:1 side slopes), on-site soil disposal (4) Due to decreased channel length, install drop structure is anticipate at new channel crossing (5) Restoration incl. topsoil, erosion control blanket along new channel slopes, seeding and mulching
(Notes) Assume new 1,000-ft. channel between Silver Creek and Bourne Slough along the south side of the north boundary of Section 21. Preliminary cost estimate does not include easement or
or property acquisition.

51
Table 12 Preliminary Construction Cost Estimates for Silver Creek Relocation Options—June 10, 2002 (Continued)
ALTERNATIVE 2B: RELOCATE SILVER CREEK – SOUTH—June 10, 2002
Item Description Units Qty. Unit Cost Extension 1 Mobilization/Demobilization (15%) LS 1 $7,000.00 $7,000.002 Site Preparation/Clearing/Grubbing AC 2 $5,000.00 $10,000.003 Common Excavation CY 3,500 $5.00 $17,500.004 Drop Structure & Culvert Crossing LS 0 $100,000.00 $0.005 Restoration AC 2 $10,000.00 $20,000.00
Project Total $54,500.00 Contingency 25% $14,000.00 Engineering/Permitting/Administration 25% $14,000.00 Total $82,500.00
(1) Mobilization includes erosion control features (2) Site Preparation includes clearing, grubbing, stripping and stockpiling topsoil, as necessary (3) Common Ex. includes excavating new channel (5 ft. wide w/ 3:1 side slopes), on-site soil disposal (4) Due to decreased channel length, install drop structure is anticipate at new channel crossing (5) Restoration incl. topsoil, erosion control blanket along new channel slopes, seeding and mulching
(Notes) Assume new 1,000-ft. channel between Silver Creek and Bourne Slough along the east boundary of Section 21. Preliminary cost estimate does not include easement or property acquisition. This Alternative may not be feasible, creek would discharge into Bourne Slough approx midway between existing berm and the location assumed for Alternative 2A. May need to add berm at south side of creek to prevent short circuiting.
7.4 Background Silver Creek is the primary mode of transport for suspended solids and phosphorus that are carried to
Bourne Slough. Areas of streambank erosion along the creek contribute excessive amounts of
suspended solids and phosphorus to the streamflow. To date, this contribution has not been
quantified, but it is thought to be significant. Although streambank erosion probably exists at
random places along the entire length of Silver Creek, this discussion is directed toward the City of
Madison. The following is a discussion of various causes of streambank erosion and
recommendations for management of Silver Creek within the City of Madison. It should be noted
that a detailed study of the causes of streambank erosion in the City of Madison has not been
performed.
7.5 Causes of Streambank Erosion Many factors can contribute to increased streambank erosion in the City of Madison. These
contributing factors can originate both within the city and upstream of the city. Upstream
52
contributors in an agricultural setting typically include drain tiles and drainage ditches, which carry
runoff much more efficiently to the stream and result in higher discharges and increased stream
velocities.
Within the City, contributors can include floodplain development, channel crossings (bridges and
culverts), vegetation management, stormwater management, and maintenance of erosion areas. A
brief discussion of each of these contributors follows.
7.5.1 Floodplain Development
Natural streams are typically able to carry up to a two-year flood event within their channel banks.
Larger floods tend to spill into overbank area on either side of the channel. This area is known as the
floodplain. Floodplains are important because they allow large floods to be carried at a lower
velocity than if the entire flow were contained within the channel. Generally, any loss of floodplain
results in a higher water level and higher velocity for a given flood event. This increases the
potential for streambank erosion.
7.5.2 Channel Crossings Roadway or railroad crossings of the stream channel tend to concentrate flow from the floodplain
into the channel, resulting in higher water levels and higher flow velocities during flood events.
Typically, increased channel and bank erosion is evident at and directly downstream of these
structures. Larger bridge or culvert openings and/or the addition of culverts in the floodplain area
can reduce the impact of channel crossings. Floodplain culverts would be placed at the floodplain
elevation, which is higher than the channel crossing elevation.
7.5.3 Vegetation Management Vegetation management along the stream corridor plays a key role in maintaining stability of the
streambanks. A buffer strip consisting of shrubs and native plants can greatly improve the stability
of the streambanks. Shrubs and native plants may have rooting depths on the order of six to eight
feet deep, while typical Kentucky Bluegrass turf has a rooting depth of only several inches. Plants
with deeper roots are much more resistant to erosion when exposed to high flow velocities, and can
better serve to maintain the stability of the streambanks. The buffer strip should be a minimum of
50-feet on either side of the channel.
53
7.5.4 Stormwater Management Cities typically produce much more runoff per acre than rural areas due to the large amount of
impervious surface. Draining this runoff directly to the creek tends to increase the total creek
discharge for a given flood event. Detention of runoff in stormwater detention ponds and releasing
the runoff slowly can reduce the flowrate increase, thereby reducing the flow velocity and
streambank erosion. Detention of stormwater has other water quality benefits, discussed elsewhere
in this report.
7.5.5 Maintenance of Erosion Areas Repair and maintenance of eroded areas along the creek is necessary to reduce their contribution of
sediment to the creek. Many techniques are available for stabilizing eroded streambanks. These can
include bank riprap, bioengineering, directing flow away from the bank using natural materials, and
establishment of bank vegetation. Modification of bridges or culverts may be necessary if they are
contributing to the eroded area. Each site presents a unique set of circumstances and needs to be
addressed on an individual basis.
7.6 Future Work Recommendations Although the City of Madison appears to be a relatively small contributor of TSS and Phosphorus to
Bourne Slough, steps can be taken to reduce existing bank erosion and prevent future bank erosion.
This would serve to reduce the City’s contribution of TSS and Phosphorus to Silver Creek and
Bourne Slough.
The magnitude and extent of the stream erosion has not been determined. A detailed study should be
considered, including site surveys of eroded areas, and hydraulic modeling of the stream to determine
the impact of channel crossings and other modifications to the channel and floodplain or the course,
current, and erosive potential of the stream. An inventory of channel erosion upstream of the city
would also be useful.

54
References
Hansen, D.S. 1986. Water Resources of Lakes and Moody counties, South Dakota. USGS Water Resources Investigation Report 84-4209
Niehus, C.A. 1997. Characterization of Stormwater Runoff in Sioux Falls, South Dakota, 1995-1996. Water-Resources Investigations Report 97-4070.
Psenner, R. 1984. Phosphorus release patterns from sediments of a meromictic mesotrophic lake (Pitburger See, Austria). Verh. Int. Ver. Limnol. 22: 219-228.
Rydin, E. and E.B. Welch. 1998. Aluminum dose required to inactivate phosphate in lake sediments. Water Res. 32: 2969-2976.
Schueler, T.R. 1987. Controlling Urban Runoff: A Practical Manual for Planning and Designing Urban BMPs. Metropolitan Washington Council of Governments. Washington, D.C.
Shapiro, J. and H. Pfannkuch. 1973. Interim Report No. 9. Limnological Research Center. University of Minnesota, St. Paul, Minnesota.
USDA, SCS. 1972. Water and Related Land Resources Big Sioux Basin.
USEPA. 1983. Results of the Nationwide Urban Runoff Program, Volume I-Final Report. U.S. EPA, Water Planning Division, Washington, D.C.
Wittmuss, A. and M. McIntire. 1998. Phase I Watershed Assessment Final Report Lake Madison/Brant Lake Lake County South Dakota. South Dakota Watershed Protection Program, South Dakota Department of Environment and Natural Resource. October 1998.

C:\Temp\Temporary Internet Files\OLK3\Report..DOC A-1
Appendix A South Dakota Water Quality Standards
Silver Creek has been assigned the beneficial uses of
• Warmwater Marginal Fish Life Propagation (6)
• Limited Contact Recreation (8)
• Wildlife Propagation and Stock Watering (9)
• Irrigation Waters (10)
Criteria for warmwater marginal fish life propagation waters (SDECR 74:51:01:49) includes total
suspended solids 30-day average of ≤150 mg/L and daily maximum of ≤263 mg/L. There is no water
quality criteria for phosphorus; the TSI of 50 is used as a guideline for establishing the impairment of
SD lakes.

Appendix B Climate Data from Madison 2SE

Appendix C Madison Storm Sewer and Stream Water Quality Data

Appendix D BMPS: Stormwater Treatment Suitability Matrix and
Pavement Management

Appendix E Bourne Slough and Round Lake Sediment and Water
Quality Data


