Page 1
8/10/2019 Water-Quality Characteristics, Including Sodium-Adsorption Ratio
http://slidepdf.com/reader/full/water-quality-characteristics-including-sodium-adsorption-ratio 1/32
U.S. Department of the InteriorU.S. Geological Survey
Prepared in cooperation with the Wyoming Department of Environmental Quality
Water-Quality Characteristics, Including Sodium-AdsorptionRatios, for Four Sites in the Powder River Drainage Basin,
Wyoming and Montana, Water Years 2001-2004
Scientific Investigations Report 2006-5113
Page 2
8/10/2019 Water-Quality Characteristics, Including Sodium-Adsorption Ratio
http://slidepdf.com/reader/full/water-quality-characteristics-including-sodium-adsorption-ratio 2/32
Front cover photographs: Upper left: Coalbed natural gas discharge point.
Upper right: Crazy Woman Creek near Arvada, Wyoming.
Lower right: Powder River at Sussex, Wyoming.
Lower left: Clear Creek near Arvada, Wyoming.
Center (photo shown within the boundary of the Powder River drainage basin):
Collecting field measurements on the Powder River.
Back cover photograph: Water-quality sampling on Crazy Woman Creek, Wyoming.
All photographs by Melanie L. Clark, USGS.
Page 3
8/10/2019 Water-Quality Characteristics, Including Sodium-Adsorption Ratio
http://slidepdf.com/reader/full/water-quality-characteristics-including-sodium-adsorption-ratio 3/32
Water-Quality Characteristics, Including
Sodium-Adsorption Ratios, for Four Sitesin the Powder River Drainage Basin, Wyoming and Montana, Water Years 2001-2004
By Melanie L. Clark and Jon P. Mason
Prepared in cooperation with the Wyoming Department of Environmental Quality
Scientific Investigations Report 2006–5113
U.S. Department of the InteriorU.S. Geological Survey
Page 4
8/10/2019 Water-Quality Characteristics, Including Sodium-Adsorption Ratio
http://slidepdf.com/reader/full/water-quality-characteristics-including-sodium-adsorption-ratio 4/32
U.S. Department of the InteriorDirk Kempthorne, Secretary
U.S. Geological SurveyP. Patrick Leahy, Acting Director
U.S. Geological Survey, Reston, Virginia: 2006
For product and ordering information:
World Wide Web: http://www.usgs.gov/pubprod
Telephone: 1-888-ASK-USGS
For more information on the USGS--the Federal source for science about the Earth, its natural and living resources,
natural hazards, and the environment:
World Wide Web: http://www.usgs.gov
Telephone: 1-888-ASK-USGS
Any use of trade, product, or firm names is for descriptive purposes only and does not imply endorsement by the
U.S. Government.
Although this report is in the public domain, permission must be secured from the individual copyright owners to
reproduce any copyrighted materials contained within this report.
Suggested citation:
Clark, M.L., and Mason, J.P., 2006, Water-quality characteristics, including sodium-adsorption ratios, for four sites in
the Powder River drainage basin, Wyoming and Montana, water years 2001-2004: U.S. Geological Survey Scientific
Investigations Report 2006-5113, 22 p.
Page 5
8/10/2019 Water-Quality Characteristics, Including Sodium-Adsorption Ratio
http://slidepdf.com/reader/full/water-quality-characteristics-including-sodium-adsorption-ratio 5/32
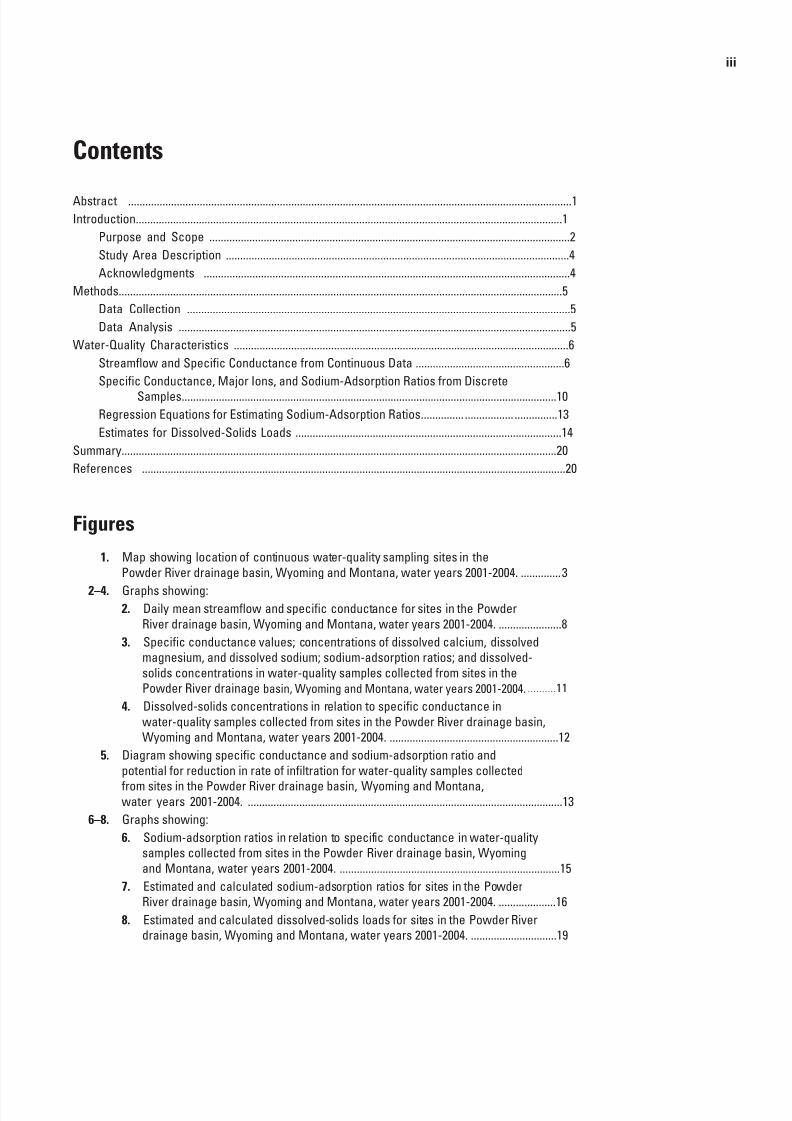
iii
Contents
Abstract ...........................................................................................................................................................1
Introduction.....................................................................................................................................................1
Purpose and Scope ..............................................................................................................................2
Study Area Description ........................................................................................................................4
Acknowledgments ................................................................................................................................4
Methods...........................................................................................................................................................5
Data Collection ......................................................................................................................................5
Data Analysis .........................................................................................................................................5
Water-Quality Characteristics .....................................................................................................................6
Streamflow and Specific Conductance from Continuous Data ....................................................6
Specific Conductance, Major Ions, and Sodium-Adsorption Ratios from Discrete
Samples...................................................................................................................................10
Regression Equations for Estimating Sodium-Adsorption Ratios ............... ................. ...............13
Estimates for Dissolved-Solids Loads .............................................................................................14
Summary........................................................................................................................................................20
References ....................................................................................................................................................20
Figures
1. Map showing location of continuous water-quality sampling sites in the
Powder River drainage basin, Wyoming and Montana, water years 2001-2004. ..............3
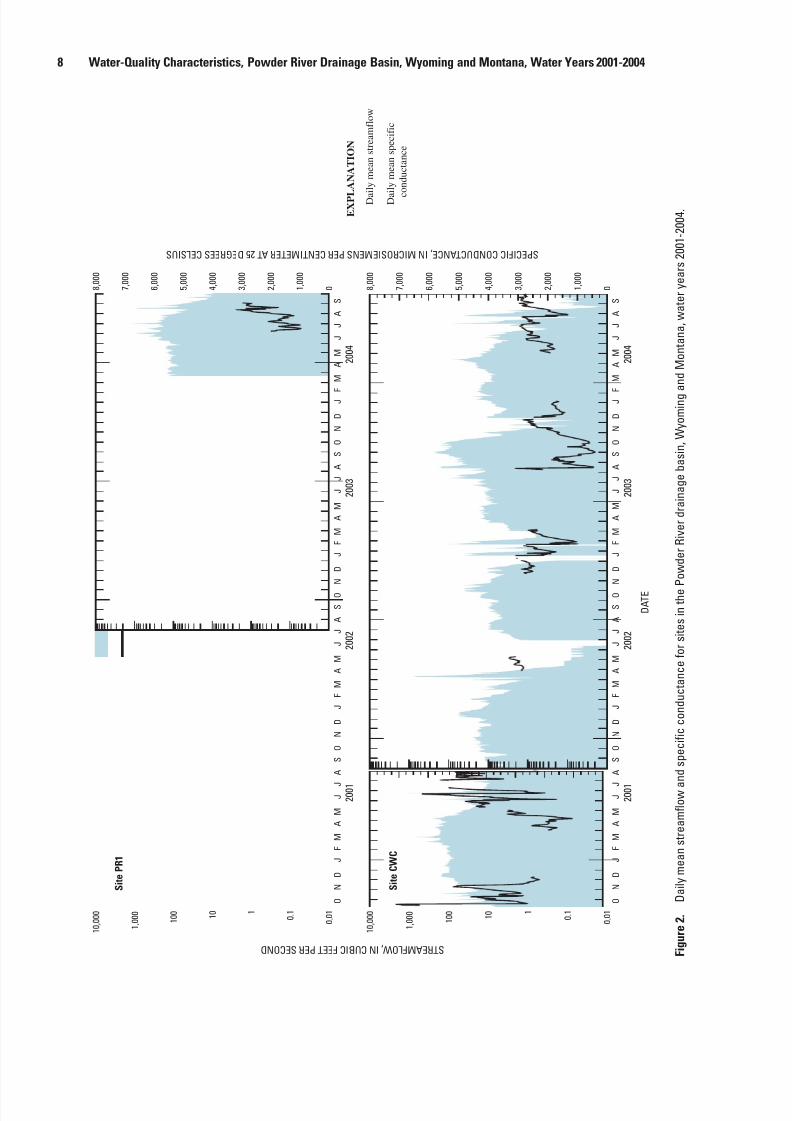
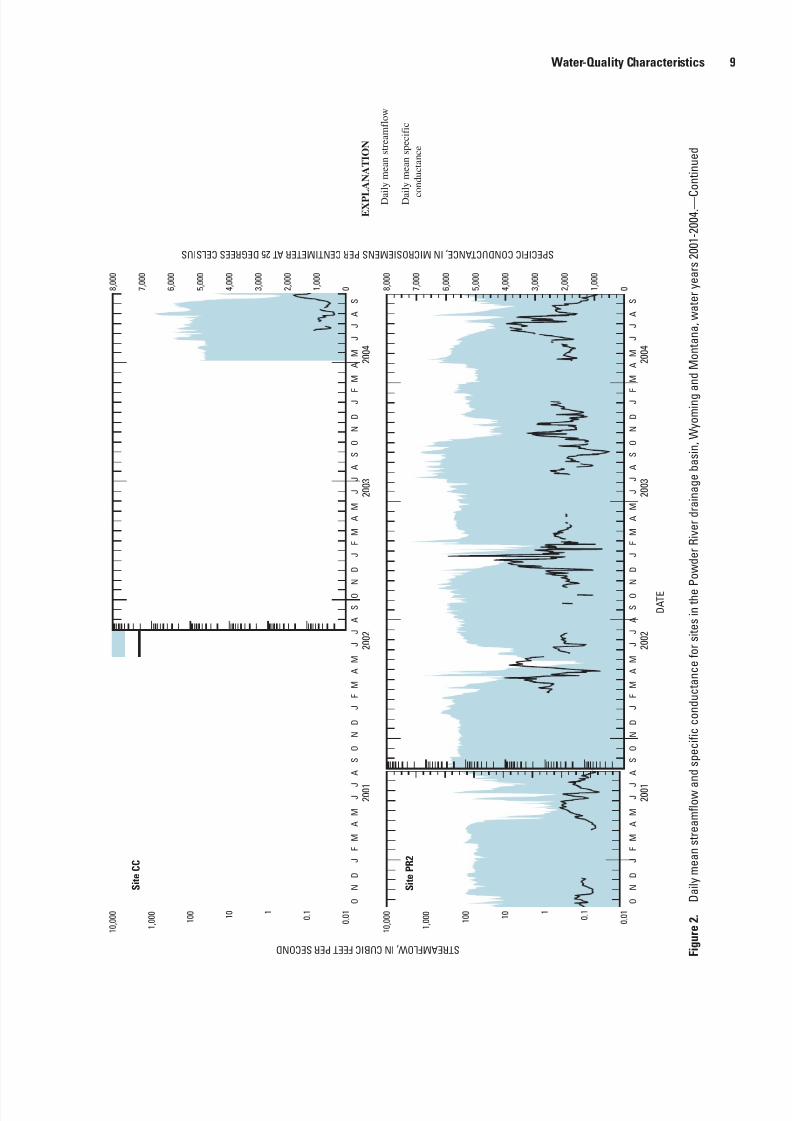
2–4. Graphs showing: 2. Daily mean streamflow and specific conductance for sites in the Powder
River drainage basin, Wyoming and Montana, water years 2001-2004. ......................8
3. Specific conductance values; concentrations of dissolved calcium, dissolved
magnesium, and dissolved sodium; sodium-adsorption ratios; and dissolved-
solids concentrations in water-quality samples collected from sites in the
Powder River drainage basin, Wyoming and Montana, water years 2001-2004. ..........11
4. Dissolved-solids concentrations in relation to specific conductance in
water-quality samples collected from sites in the Powder River drainage basin,
Wyoming and Montana, water years 2001-2004. ...........................................................12
5. Diagram showing specific conductance and sodium-adsorption ratio and
potential for reduction in rate of infiltration for water-quality samples collected
from sites in the Powder River drainage basin, Wyoming and Montana,water years 2001-2004. ..............................................................................................................13
6–8. Graphs showing:
6. Sodium-adsorption ratios in relation to specific conductance in water-quality
samples collected from sites in the Powder River drainage basin, Wyoming
and Montana, water years 2001-2004. .............................................................................15
7. Estimated and calculated sodium-adsorption ratios for sites in the Powder
River drainage basin, Wyoming and Montana, water years 2001-2004. ....................16
8. Estimated and calculated dissolved-solids loads for sites in the Powder River
drainage basin, Wyoming and Montana, water years 2001-2004. ..............................19
Page 6
8/10/2019 Water-Quality Characteristics, Including Sodium-Adsorption Ratio
http://slidepdf.com/reader/full/water-quality-characteristics-including-sodium-adsorption-ratio 6/32
iv
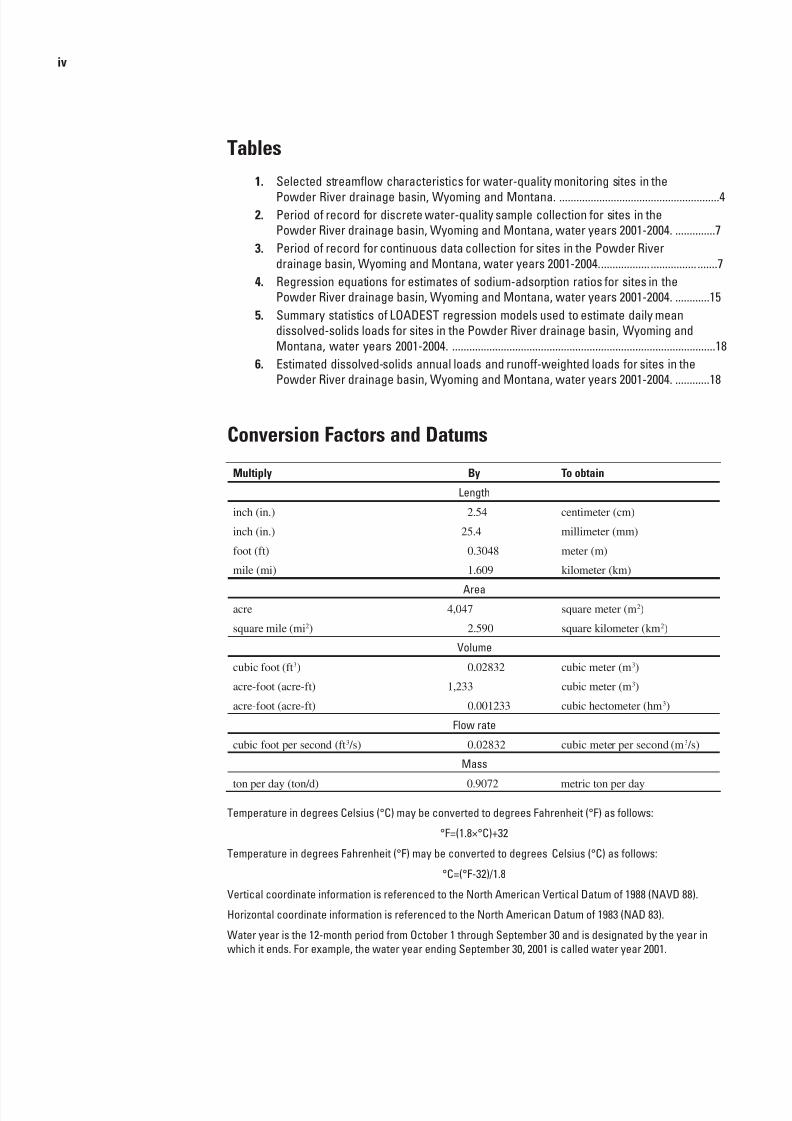
Tables
1. Selected streamflow characteristics for water-quality monitoring sites in the
Powder River drainage basin, Wyoming and Montana. ........................................................4 2. Period of record for discrete water-quality sample collection for sites in the
Powder River drainage basin, Wyoming and Montana, water years 2001-2004. ..............7
3. Period of record for continuous data collection for sites in the Powder River
drainage basin, Wyoming and Montana, water years 2001-2004. ................. ................ .......7
4. Regression equations for estimates of sodium-adsorption ratios for sites in the
Powder River drainage basin, Wyoming and Montana, water years 2001-2004. ............15
5. Summary statistics of LOADEST regression models used to estimate daily mean
dissolved-solids loads for sites in the Powder River drainage basin, Wyoming and
Montana, water years 2001-2004. ............................................................................................18
6. Estimated dissolved-solids annual loads and runoff-weighted loads for sites in the
Powder River drainage basin, Wyoming and Montana, water years 2001-2004. ............18
Conversion Factors and Datums
Multiply By To obtain
Length
inch (in.) 2.54 centimeter (cm)
inch (in.) 25.4 millimeter (mm)
foot (ft) 0.3048 meter (m)
mile (mi) 1.609 kilometer (km)
Area
acre 4,047 square meter (m2)
square mile (mi2) 2.590 square kilometer (km2)
Volume
cubic foot (ft3) 0.02832 cubic meter (m3)
acre-foot (acre-ft) 1,233 cubic meter (m3)
acre-foot (acre-ft) 0.001233 cubic hectometer (hm3)
Flow rate
cubic foot per second (ft3 /s) 0.02832 cubic meter per second (m3 /s)
Mass
ton per day (ton/d) 0.9072 metric ton per day
Temperature in degrees Celsius (°C) may be converted to degrees Fahrenheit (°F) as follows:
°F=(1.8×°C)+32
Temperature in degrees Fahrenheit (°F) may be converted to degrees Celsius (°C) as follows:
°C=(°F-32)/1.8
Vertical coordinate information is referenced to the North American Vertical Datum of 1988 (NAVD 88).
Horizontal coordinate information is referenced to the North American Datum of 1983 (NAD 83).
Water year is the 12-month period from October 1 through September 30 and is designated by the year in
which it ends. For example, the water year ending September 30, 2001 is called water year 2001.
Page 7
8/10/2019 Water-Quality Characteristics, Including Sodium-Adsorption Ratio
http://slidepdf.com/reader/full/water-quality-characteristics-including-sodium-adsorption-ratio 7/32
v
Abbreviated Water-Quality Units
mg/L milligrams per liter
µS/cm microsiemens per centimeter at 25 degrees Celsius
Abbreviations
CBNG Coalbed natural gas
CC Clear Creek near Arvada, Wyoming
CWC Crazy Woman (at upper station) near Arvada, Wyoming
NWIS National Water Information System
MSE Mean square error
PR1 Powder River at Sussex, Wyoming
PR2 Powder River at Moorhead, Montana
R2 Coefficient of determination
SAR Sodium-adsorption ratio
USGS U.S. Geological Survey
WDEQ Wyoming Department of Environmental Quality
Page 8
8/10/2019 Water-Quality Characteristics, Including Sodium-Adsorption Ratio
http://slidepdf.com/reader/full/water-quality-characteristics-including-sodium-adsorption-ratio 8/32
Page 9
8/10/2019 Water-Quality Characteristics, Including Sodium-Adsorption Ratio
http://slidepdf.com/reader/full/water-quality-characteristics-including-sodium-adsorption-ratio 9/32
Water-Quality Characteristics, Including Sodium-
Adsorption Ratios, for Four Sites in the Powder RiverDrainage Basin, Wyoming and Montana, Water Years2001-2004
By Melanie L. Clark and Jon P. Mason
Abstract
The U.S. Geological Survey, in cooperation with theWyoming Department of Environmental Quality, monitors
streams throughout the Powder River structural basin in
Wyoming and parts of Montana for potential effects of
coalbed natural gas development. Specific conductance and
sodium-adsorption ratios may be larger in coalbed waters
than in stream waters that may receive the discharge waters.
Therefore, continuous water-quality instruments for specific
conductance were installed and discrete water-quality samples
were collected to characterize water quality during water years
2001-2004 at four sites in the Powder River drainage basin:
Powder River at Sussex, Wyoming; Crazy Woman Creek near
Arvada, Wyoming; Clear Creek near Arvada, Wyoming; and
Powder River at Moorhead, Montana.
During water years 2001-2004, the median specific con-
ductance of 2,270 microsiemens per centimeter at 25 degrees
Celsius (µS/cm) in discrete samples from the Powder River at
Sussex, Wyoming, was larger than the median specific con-
ductance of 1,930 µS/cm in discrete samples collected down-
stream from the Powder River at Moorhead, Montana. The
median specific conductance was smallest in discrete samples
from Clear Creek (1,180 µS/cm), which has a dilution effect
on the specific conductance for the Powder River at Moor-
head, Montana. The daily mean specific conductance from
continuous water-quality instruments during the irrigation sea-
son showed the same spatial pattern as specific conductancevalues for the discrete samples.
Dissolved sodium, sodium-adsorption ratios, and dis-
solved solids generally showed the same spatial pattern as
specific conductance. The largest median sodium concen-
tration (274 milligrams per liter) and the largest range of
sodium-adsorption ratios (3.7 to 21) were measured in discrete
samples from the Powder River at Sussex, Wyoming. Median
concentrations of sodium and sodium-adsorption ratios were
substantially smaller in Crazy Woman Creek and Clear Creek,
which tend to decrease sodium concentrations and sodium-
adsorption ratios at the Powder River at Moorhead, Montana.
Dissolved-solids concentrations in discrete samples were
closely correlated with specific conductance values; Pearson’s
correlation coefficients were 0.98 or greater for all four sites.Regression equations for discrete values of specific
conductance and sodium-adsorption ratios were statistically
significant ( p-values <0.001) at all four sites. The strongest
relation (R2=0.92) was at the Powder River at Sussex, Wyo-
ming. Relations on Crazy Woman Creek (R2=0.91) and Clear
Creek (R2=0.83) also were strong. The relation between
specific conductance and sodium-adsorption ratios was weak-
est (R2=0.65) at the Powder River at Moorhead, Montana;
however, the relation was still significant. These data indicate
that values of specific conductance are useful for estimating
sodium-adsorption ratios.
A regression model called LOADEST was used to
estimate dissolved-solids loads for the four sites. The aver-age daily mean dissolved-solids loads varied among the
sites during water year 2004. The largest average daily mean
dissolved-solids load was calculated for the Powder River at
Moorhead, Montana. Although the smallest concentrations of
dissolved solids were in samples from Clear Creek, the small-
est average daily mean dissolved-solids load was calculated
for Crazy Woman Creek. The largest loads occurred during
spring runoff, and the smallest loads occurred in late sum-
mer, when streamflows typically were smallest. Dissolved-
solids loads may be smaller than average during water years
2001-2004 because of smaller than average streamflow as a
result of drought conditions.
Introduction
The Powder River structural basin in northeastern Wyo-
ming and southeastern Montana contains important energy
resources for the United States. Coal, conventional natural gas,
oil, uranium, and most recently, coalbed natural gas (CBNG)
are developed in the basin. The Powder River structural basin
was estimated to contain nearly 14.3 trillion cubic feet (mean
estimate) of undiscovered CBNG when it was last assessed by
Page 10
8/10/2019 Water-Quality Characteristics, Including Sodium-Adsorption Ratio
http://slidepdf.com/reader/full/water-quality-characteristics-including-sodium-adsorption-ratio 10/32
the U.S. Geological Survey (USGS) in 2001 (U.S. Geological
Survey, 2002). From October 2000 to September 2004 (water
years 2001-2004), the number of production wells for CBNG
in Wyoming increased from 4,113 to 13,452 wells (Wyoming
Oil and Gas Conservation Commission, 2005).
During the production of CBNG, water is pumped from
wells, lowering hydrostatic pressure in the coalbeds and allow-ing the natural gas that was confined and stored within the
internal surfaces and voids of the coal to flow (DeBruin and
others, 2000). Water production associated with CBNG devel-
opment ranged from about 1.1 to 1.8 million barrels per day
during water years 2001-2004 (Wyoming Oil and Gas Con-
servation Commission, 2005). Currently (2006), most water
produced during CBNG production in Wyoming is discharged
into constructed reservoirs or into surface drainages, where it
may infiltrate into the ground, become part of the streamflow,
or evaporate. The quantity and quality of the produced waters
varies depending on the coalbed source.
All natural waters contain dissolved solids. Dissolved sol-
ids are introduced into the water from the atmosphere, soil androcks that the water contacts, and by human activities. Specific
conductance, which is a measure of a substance’s ability to
conduct an electrical current at a specific temperature, can be
used as an indicator of the concentration of dissolved solids
in water (Hem, 1985). For some waters in the Powder River
structural basin, the water that is associated with the coalbeds
and discharged during the production of CBNG may have a
larger specific conductance and, therefore, larger dissolved-
solids concentration than the receiving stream. During a study
on the quality of coalbed waters, Rice and others (2000) found
that specific conductance for coalbed waters ranged from
630 to 3,020 microsiemens per centimeter at 25 degrees
Celsius (µS/cm). The specific conductance of waters used forirrigation has an effect on soil infiltration rates. Waters with
large specific conductance values can have a positive effect
on soil properties by causing flocculation and aeration of the
soil; however, irrigation waters with excessive dissolved solids
can have a negative effect on plant health (Hanson and others,
1993).
The concentrations of some constituents that contribute
to the specific conductance of stream water also determine the
suitability of water for irrigation. In particular, large concen-
trations of sodium can have a negative effect on soils by caus-
ing dispersion and swelling. Soil dispersion can harden the
soil and decrease infiltration rates at the surface and reduce the
hydraulic conductivity of the soil (Hanson and others, 1993).
The ratio of sodium ions to calcium and magnesium ions can
be used to predict the degree to which irrigation water tends to
enter into the cation-exchange reactions in soil (U.S. Salinity
Laboratory Staff, 1954). This ratio, called the sodium-adsorp-
tion ratio (SAR), is used to determine the sodium hazard for
irrigation waters. As the SAR increases, the sodium hazard
increases; therefore, the suitability of water for irrigation
decreases. The effect of irrigation water on soil infiltration
rates is dependent upon the interaction between the flocculat-
ing effects of specific conductance and the dispersion effects
of sodium. Soils are able to tolerate irrigation waters with
large SAR values if the specific conductance values also are
large (Hanson and others, 1993). Sodium has been one of the
primary constituents of concern during CBNG development
because concentrations of sodium and SAR values may be
larger in coalbed waters than in the receiving streams. Dur-
ing a study on the quality of coalbed waters, Rice and others(2000) reported that values for SAR ranged from 5.7 to 29.
Concerns exist regarding the quality of some CBNG
discharge waters and the effect they may have on existing
stream-water quality in the Powder River structural basin.
Increasing specific conductance values and SAR values in the
Powder River drainage basin have been of particular concern
because stream waters are an important water resource to both
Wyoming and Montana. The USGS, in cooperation with the
Wyoming Department of Environmental Quality (WDEQ),
has monitored streams for effects from CBNG development
throughout the Powder River structural basin since water
year 2001, including four sites with continuous water-qual-
ity instruments for specific conductance in the Powder Riverdrainage basin. The USGS collected continuous specific
conductance data and discrete water-quality samples at two
sites on the mainstem of the Powder River, one site on Crazy
Woman Creek, and one site on Clear Creek (fig. 1) to charac-
terize water quality during water years 2001-2004.
Some studies have demonstrated the usefulness of spe-
cific conductance for estimating concentrations of other ionic
constituents (Christensen and others, 2000; Rasmussen and
Ziegler, 2003). More specifically, a study in the Tongue River
drainage basin in northeastern Wyoming and southeastern
Montana has demonstrated that specific conductance can be a
useful estimator of SAR (Nimick, 2004). A similar analysis of
specific conductance and SAR relations in the Powder Riverdrainage basin would be beneficial to local water managers.
Concerns also have been raised about the assimilative capacity
of the Powder River drainage basin to accommodate increased
dissolved-solids loads as a result of CBNG. Need exists to
summarize data collected from the monitoring network and
develop relations that can be used to help effectively manage
the CBNG development in the Powder River drainage basin.
Purpose and Scope
The purpose of this report is to characterize water-quality
data collected during water years 2001-2004 at four sites in thePowder River drainage basin. Specifically, this report presents:
(1) a summary of continuous streamflow and specific con-
ductance data that were collected; (2) a summary of specific
conductance, major ions, and SAR values from discrete water-
quality samples; (3) regression equations for estimating SAR
from specific conductance; and (4) dissolved-solids loads that
were estimated using load-estimation software. The four study
sites are the Powder River at Sussex, Wyoming (site PR1);
Crazy Woman Creek (at upper station) near Arvada, Wyoming
(site CWC); Clear Creek near Arvada, Wyoming (site CC);
and the Powder River at Moorhead, Montana (site PR2).
2 Water-Quality Characteristics, Powder River Drainage Basin, Wyoming and Montana, Water Years 2001-2004
Page 11
8/10/2019 Water-Quality Characteristics, Including Sodium-Adsorption Ratio
http://slidepdf.com/reader/full/water-quality-characteristics-including-sodium-adsorption-ratio 11/32
HelenaPowder
River
structural basin
Cheyenne
Buffalo
MilesCity
MONTANA
WYOMING
Powder River
drainage basin
94
87
2026
0
0 10 20 30 40 KILOMET ERS
40 MILES20 3010
44°00
44°30
43°30
43°00
106°30
107°00
45°30
46°00
46°30
105°00
106°00
105°30
Miles City Locate
Mizpah
Moorhead
ArvadaWeston
Buffalo
Midwest
Broadus
Powderville
Gillette
MONTANA
WYOMING
Powder RiverCounty
Custer County
CampbellCounty
SheridanCounty
JohnsonCounty
NatronaCounty
CarterCounty
Base modified from Digital Chart of the Worlddigital data, 1:1,000,000, 1993Albers Equal-area Conic projectionStandard parallels 43°00 and 47°00,
central meridian -106°00
B
I G
H
O
R
N
M O
U N T A
I N S
25
16 90
59
56
16
14
212
Stream-water-quality sampling
site and number
EXPLANATION
90
46°30
46°00
45°30
45°00 45°00
105°00
105°30
44°00
106°00106°30
43°30
Sussex
P o w d e
r
R i v e r
S a l t
C r e
e k
C r e e k
C r
C l e a r
C r a z y
R i v
e r
W o m
a n
L i t t
l e
R i v
e
r
P o w
d e
r
C r
L o c a t e
P o w d e r
PR2PR2
CCCC
PR1PR1
PR2PR2
CWCCWC
Figure 1. Location of continuous water-quality sampling sites in the Powder River
drainage basin, Wyoming and Montana, water years 2001-2004.
Introduction 3
Page 12
8/10/2019 Water-Quality Characteristics, Including Sodium-Adsorption Ratio
http://slidepdf.com/reader/full/water-quality-characteristics-including-sodium-adsorption-ratio 12/32
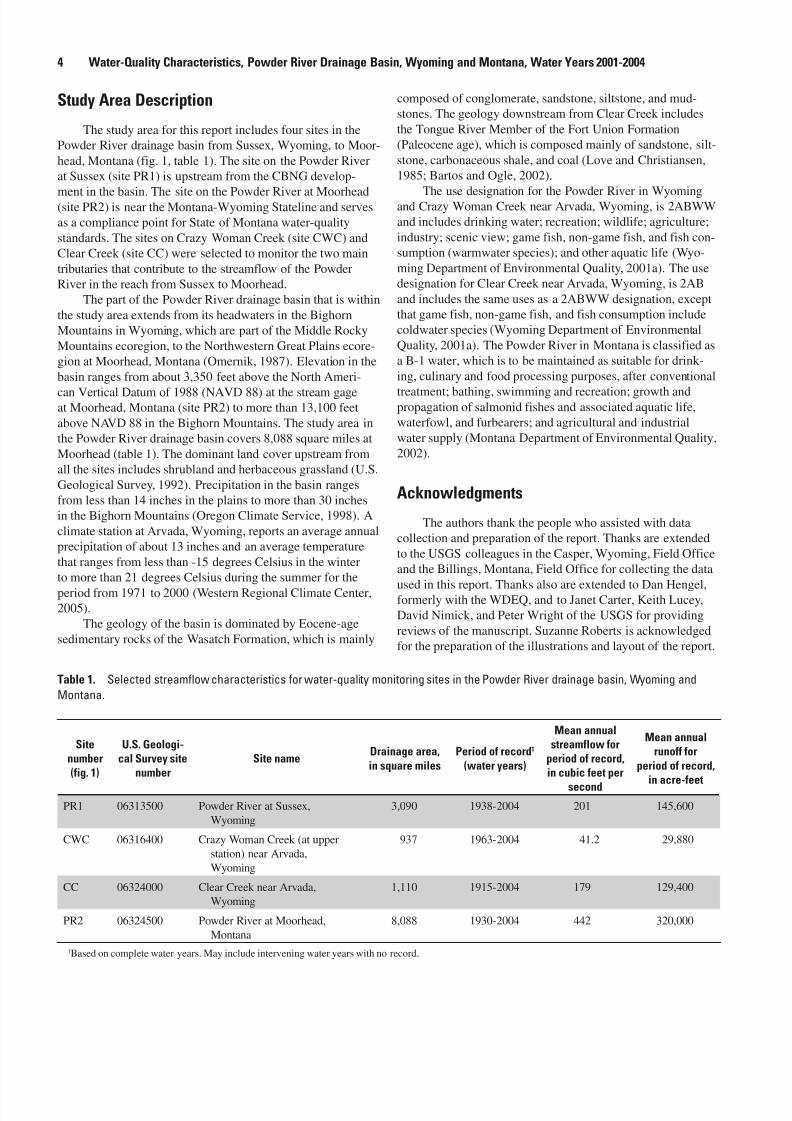
Study Area Description
The study area for this report includes four sites in the
Powder River drainage basin from Sussex, Wyoming, to Moor-
head, Montana (fig. 1, table 1). The site on the Powder River
at Sussex (site PR1) is upstream from the CBNG develop-
ment in the basin. The site on the Powder River at Moorhead(site PR2) is near the Montana-Wyoming Stateline and serves
as a compliance point for State of Montana water-quality
standards. The sites on Crazy Woman Creek (site CWC) and
Clear Creek (site CC) were selected to monitor the two main
tributaries that contribute to the streamflow of the Powder
River in the reach from Sussex to Moorhead.
The part of the Powder River drainage basin that is within
the study area extends from its headwaters in the Bighorn
Mountains in Wyoming, which are part of the Middle Rocky
Mountains ecoregion, to the Northwestern Great Plains ecore-
gion at Moorhead, Montana (Omernik, 1987). Elevation in the
basin ranges from about 3,350 feet above the North Ameri-
can Vertical Datum of 1988 (NAVD 88) at the stream gageat Moorhead, Montana (site PR2) to more than 13,100 feet
above NAVD 88 in the Bighorn Mountains. The study area in
the Powder River drainage basin covers 8,088 square miles at
Moorhead (table 1). The dominant land cover upstream from
all the sites includes shrubland and herbaceous grassland (U.S.
Geological Survey, 1992). Precipitation in the basin ranges
from less than 14 inches in the plains to more than 30 inches
in the Bighorn Mountains (Oregon Climate Service, 1998). A
climate station at Arvada, Wyoming, reports an average annual
precipitation of about 13 inches and an average temperature
that ranges from less than -15 degrees Celsius in the winter
to more than 21 degrees Celsius during the summer for the
period from 1971 to 2000 (Western Regional Climate Center,2005).
The geology of the basin is dominated by Eocene-age
sedimentary rocks of the Wasatch Formation, which is mainly
composed of conglomerate, sandstone, siltstone, and mud-
stones. The geology downstream from Clear Creek includes
the Tongue River Member of the Fort Union Formation
(Paleocene age), which is composed mainly of sandstone, silt-
stone, carbonaceous shale, and coal (Love and Christiansen,
1985; Bartos and Ogle, 2002).
The use designation for the Powder River in Wyomingand Crazy Woman Creek near Arvada, Wyoming, is 2ABWW
and includes drinking water; recreation; wildlife; agriculture;
industry; scenic view; game fish, non-game fish, and fish con-
sumption (warmwater species); and other aquatic life (Wyo-
ming Department of Environmental Quality, 2001a). The use
designation for Clear Creek near Arvada, Wyoming, is 2AB
and includes the same uses as a 2ABWW designation, except
that game fish, non-game fish, and fish consumption include
coldwater species (Wyoming Department of Environmental
Quality, 2001a). The Powder River in Montana is classified as
a B-1 water, which is to be maintained as suitable for drink-
ing, culinary and food processing purposes, after conventional
treatment; bathing, swimming and recreation; growth andpropagation of salmonid fishes and associated aquatic life,
waterfowl, and furbearers; and agricultural and industrial
water supply (Montana Department of Environmental Quality,
2002).
Acknowledgments
The authors thank the people who assisted with data
collection and preparation of the report. Thanks are extended
to the USGS colleagues in the Casper, Wyoming, Field Office
and the Billings, Montana, Field Office for collecting the data
used in this report. Thanks also are extended to Dan Hengel,formerly with the WDEQ, and to Janet Carter, Keith Lucey,
David Nimick, and Peter Wright of the USGS for providing
reviews of the manuscript. Suzanne Roberts is acknowledged
for the preparation of the illustrations and layout of the report.
Table 1. Selected streamflow characteristics for water-quality monitoring sites in the Powder River drainage basin, Wyoming and
Montana.
Sitenumber(fig. 1)
U.S. Geologi-cal Survey site
numberSite name
Drainage area,
in square miles
Period of record1
(water years)
Mean annualstreamflow for
period of record,in cubic feet per
second
Mean annualrunoff for
period of record,
in acre-feet
PR1 06313500 Powder River at Sussex,
Wyoming
3,090 1938-2004 201 145,600
CWC 06316400 Crazy Woman Creek (at upper
station) near Arvada,
Wyoming
937 1963-2004 41.2 29,880
CC 06324000 Clear Creek near Arvada,
Wyoming
1,110 1915-2004 179 129,400
PR2 06324500 Powder River at Moorhead,
Montana
8,088 1930-2004 442 320,000
1Based on complete water years. May include intervening water years with no record.
4 Water-Quality Characteristics, Powder River Drainage Basin, Wyoming and Montana, Water Years 2001-2004
Page 13
8/10/2019 Water-Quality Characteristics, Including Sodium-Adsorption Ratio
http://slidepdf.com/reader/full/water-quality-characteristics-including-sodium-adsorption-ratio 13/32
Methods
The data-collection methods for continuous data and dis-
crete water-quality samples are described in this section of the
report. The data-analysis methods for estimating SAR from
specific conductance and for estimating dissolved-solids loads
also are described.
Data Collection
Continuous data for streamflow and specific conductance
were collected by the USGS at the four study sites in the
Powder River drainage basin. Streamflow gages were operated
during water years 2001-2004 on Crazy Woman Creek near
Arvada, Wyoming (site CWC), and the Powder River at Moor-
head, Montana (site PR2). Streamflow gages were reestab-
lished during water year 2003 on the Powder River at Sussex,
Wyoming (site PR1), and Clear Creek near Arvada, Wyoming
(site CC). Continuous data for streamflow are summarizedin this report as daily mean values in cubic feet per second
(ft3 /sec). Methods for the collection and analysis of continu-
ous streamflow are described in Rantz and others (1982).
Continuous water-quality instruments for specific conductance
were installed during water year 2001 on Crazy Woman Creek
(site CWC) and on the Powder River at Moorhead, Montana
(site PR2), and during water year 2003 on the Powder River
at Sussex, Wyoming (site PR1), and on Clear Creek (site CC)
after reestablishment of the streamflow gages. Continuous
specific conductance was measured only during the irrigation
season. Methods for the operation of continuous water-quality
instruments for specific conductance are described in Wagner
and others (2000). Continuous data for specific conductanceare summarized in this report as daily mean values in micro-
siemens per centimeter at 25 degrees Celsius.
Water-quality samples were collected at all four sites
during water years 2001-2004 (table 2) using methods
described in the National Field Manual for the Collection of
Water-Quality Data (U.S. Geological Survey, 1997 to 2006).
In addition to the continuous data, discrete field measurements
for streamflow and specific conductance were made during
the water-quality sampling visits. For some sampling visits,
streamflow was not measured but was computed from stage-
streamflow ratings. For wadeable conditions, a DH-81 sampler
and equal-width-integrating sampling techniques were used to
collect depth- and width-integrated samples. For nonwadeable
conditions, a D-95 or DH-95 sampler and equal-width-inte-
grating sampling techniques were used to collect depth- and
width-integrated samples. When the streams were too shallow
for a sampler, a hand-dip method at the centroid of flow was
used for collecting samples.
Samples were composited in a churn splitter and pro-
cessed, preserved, and analyzed according to USGS standard
methods (U.S. Geological Survey, 1997 to 2006). Samples for
major ions were filtered onsite using a 0.45-micron disposable
capsule filter and acidified to a pH less than 2 using nitric acid.
Constituents that were determined in samples filtered through
the 0.45-micron filter are referred to as “dissolved” in this
report. Samples were analyzed for dissolved-major ions at the
USGS National Water Quality Laboratory in Lakewood, Colo-
rado, using an inductively coupled plasma method described in
Fishman (1993). The major-ion constituents described in this
report are calcium, magnesium, and sodium with concentra-tions reported in milligrams per liter (mg/L).
In this report, SAR values and dissolved-solids concen-
trations were calculated values based on laboratory results for
discrete constituents. The SAR value was calculated with the
analytical results of calcium, magnesium, and sodium from a
discrete sample using the following equation:
SAR=(Na+)
½[(Ca2+) + (Mg2+)]
where Na+, Ca2+, and Mg2+ represent concentrations expressed
in milliequivalents per liter for eachconstituent.
The dissolved-solids concentration is the sum of the
major-ion constituents for a discrete sample, which includes
major cations (dissolved calcium, magnesium, potassium, and
sodium), major anions (dissolved carbonate species, chloride,
fluoride, and sulfate), and nonionic silica (Hem, 1985, p. 157).
Continuous data and discrete sample results were pub-
lished in Swanson and others (2002, 2003, and 2004) and Wat-
son and others (2005). Continuous data and discrete sample
results are electronically stored in the USGS’s National Water
Information System (NWIS) and are available to the public
from NWISWeb at URL: http://waterdata.usgs.gov/nwis/ .
Data Analysis
Data used for this report were analyzed using graphical
and statistical techniques. Descriptive summary statistics for
results from discrete water-quality samples were computed
using standard methods and are presented using boxplots.
For boxplots, the lower and upper edges of the box indicate
the 25th and 75th percentiles, respectively. The median is a
line within the box. Whiskers extend to -1.5 to 1.5 times the
interquartile range. Points outside of this range are plotted as
individual points. Parametric statistical techniques, including
regression equations, were used for describing data rela-
tions. Pearson’s correlation coefficient (r) is a measure of
the strength and direction of relation between two variables
(Helsel and Hirsch, 1992) and is shown for data where regres-
sion equations were not determined. In some cases, data were
transformed to achieve a normal distribution.
One of the purposes of this report is to present regression
equations for estimating SAR from specific conductance for
sites on the Powder River, Crazy Woman Creek, and Clear
Creek. Initial graphical inspection of the data indicated linear
relations between specific conductance and SAR for the sites.
(1)
Methods 5
Page 14
8/10/2019 Water-Quality Characteristics, Including Sodium-Adsorption Ratio
http://slidepdf.com/reader/full/water-quality-characteristics-including-sodium-adsorption-ratio 14/32
Linear regression is a statistical technique that can be used
to determine the relation between two constituents. The use
of this relation can be helpful in estimating data where one
constituent was measured (continuous specific conductance, in
this case), but the other (continuous SAR) was not (Helsel and
Hirsch, 1992). The simple linear regression equation can be
expressed as:
yi = mx
i + b + e
ii = 1,2,....n,
where:
yi is the i th observation of the dependent variable;
m is the slope;
x i is the i th observation of the independent, or
explanatory, variable;
b is the y-axis intercept;
ei is the random error for the i th observation; and
n is the sample size.
The terms m and b are the parameters that need to be esti-
mated from the data. The most common estimation technique
is called ordinary least squares. S-PLUS statistical software
(Lam, 1999) was used to generate the regression equations in
this report. Plots of the residuals from the regression equation
were inspected for normality. The parameters displayed in this
report for the regression equations include the mean square
error (MSE), which is a measure of the variance between
predicted and observed values; the coefficient of determina-
tion (R2), which is the fraction of the variance explained by the
regression; and the p-value, which is the probability that the
slope is zero, indicating that there is no correlation between
the two variables. The smaller the p-value, the smaller the
probability that the two variables are not related. For thisreport, a relation was determined to be statistically significant
at the 95-percent confidence level. Therefore, if the calcu-
lated p-value was less than 0.05, the relation is significant.
Prediction intervals were determined to evaluate uncertainty
of the estimated values using the regression equation (Helsel
and Hirsch, 1992). For this report, the 95-percent prediction
intervals were determined for the regression equation for each
site. For a given specific conductance value, the 95-percent
prediction interval represents the range of SAR values that are
expected to occur 95 percent of the time.
Dissolved-solids loads at the four sites in the Powder
River drainage basin were estimated using LOADEST, which
is load-estimation software developed by the USGS (Runkeland others, 2004). LOADEST allows the user to choose from
11 different predefined regression models to solve load-esti-
mation problems or build custom, user-defined regression
models. The input parameters used in the four LOADEST
models were date and time; streamflow and dissolved-solids
concentration from discrete water-quality samples; and daily
mean streamflow. The dissolved-solids concentrations and cor-
responding streamflow measurements from the same discrete
water-quality samples were used to develop and calibrate a
regression model for dissolved-solids load as a function of
time and streamflow. The calibrated model was then used to
estimate dissolved-solids loads using a time-series of stream-
flow values. Daily mean streamflow from USGS gages at each
of the sites were used for the time-series of streamflow values
in the model. The format of the regression equation predicted
by LOADEST for the four sites is:
(3)(2)
Ln( y) = a0 + a
1lnQ + a
2lnQ2 + a
3sin(2πdtime) +
a4cos(2πdtime)
where:
Ln( y) = natural log of daily mean dissolved-solids
load, in kilograms per day;
a0 , a
1 , a
2 , a
3 , and a
4 = model coefficients;
lnQ = (natural log of daily mean streamflow –
center of natural log of daily mean
streamflow), in cubic feet per second; and
dtime = (decimal time – center of decimal time).
The centering variables for streamflow and decimal timesimplify the numerical work and have no effect on the load
estimates, so that the regression coefficients are statistically
independent. The dissolved-solids loads estimated from the
model were converted to tons per day and are summarized
using a daily mean and the 95-percent confidence interval for
the daily mean. Annual dissolved-solids loads are summarized
by water year in tons per year. Runoff-weighted dissolved-
solids loads, which are loads that are normalized for variations
in annual runoff, also were calculated for each site in tons per
acre-foot. Dissolved-solids loads for discrete sampling events
were calculated using instantaneous streamflow and dissolved-
solids concentration from the discrete sample and are shown
for comparison.
Water-Quality Characteristics
This section of the report summarizes water-quality char-
acteristics from the continuous data and discrete samples. The
periods of record for discrete samples used in this report are
shown in table 2 and the periods of record for continuous data
are shown in table 3. Data-analysis results for regression rela-
tions between specific conductance and SAR, and dissolved-
solids load estimates from LOADEST also are summarized.
Streamflow and Specific Conductance fromContinuous Data
The data collection period for streamflow varied dur-
ing water years 2001-2004 for the four sites in the Powder
River drainage basin (table 3). The streamflow characteristics
of the Powder River at Sussex, Wyoming (site PR1), and at
Moorhead, Montana (site PR2), and of Crazy Woman Creek
(site CWC) and Clear Creek (site CC) near Arvada, Wyo-
ming, were a combination of those characteristics typical of
6 Water-Quality Characteristics, Powder River Drainage Basin, Wyoming and Montana, Water Years 2001-2004
Page 15
8/10/2019 Water-Quality Characteristics, Including Sodium-Adsorption Ratio
http://slidepdf.com/reader/full/water-quality-characteristics-including-sodium-adsorption-ratio 15/32
streams that originate in the plains and streams that originate
in the mountains. Hydrographs of plains streams consist of a
lowland snowmelt peak during late winter through early spring
and short to moderate duration rainstorm peaks that gener-
ally occur during summer months. Hydrographs of mountainstreams generally are dominated by a single peak that occurs
during late spring resulting from high-elevation snowmelt. The
smallest streamflows at the sites typically occur during late
summer. Daily mean streamflows varied substantially among
sites during the study period (fig. 2).
Annual runoff during water year 2004 at all four sites
(table 3) was less than mean annual runoff for their period
of record (table 1) as a result of drought conditions in the
basin. For example, annual runoff during water year 2004
for the Powder River at Moorhead, Montana (site PR2), was
85,200 acre-feet (table 3) compared to a mean annual runoff
of 320,000 acre-feet for the period of record from 1930 to
2004 (table 1). Crazy Woman Creek near Arvada, Wyoming(site CWC), and the Powder River at Moorhead, Montana
(site PR2), have annual runoff data during water years
2001-2004, and annual runoff for these two sites was substan-
tially less than average for all 4 years.
During water year 2004, the combined annual runoff
from Powder River at Sussex, Wyoming (site PR1), and
Crazy Woman Creek (site CWC) and Clear Creek (site CC)
near Arvada, Wyoming, was more than the annual runoff of
the Powder River at Moorhead, Montana (site PR2). A study
conducted on the hydrology of the Powder River alluvium
between Sussex and Moorhead found that the river loses
streamflow in this reach as a result of evaporation, transpira-
tion, or seepage to ground water in the alluvium (Ringen and
Daddow, 1990).
The data collection period for continuous specific con-ductance varied among sites during water years 2001-2004
(table 3). The use of continuous water-quality instruments
greatly increases the amount of data available for specific
conductance during the irrigation season compared to discrete
sampling and more adequately characterizes the fluctua-
tions of specific conductance in the streams. Despite missing
records and only seasonal operation, there were 328 values of
daily mean specific conductance for the Powder River at Sus-
sex (site PR1), which had the shortest record for continuous
specific conductance, and 850 values of daily mean specific
conductance for the Powder River at Moorhead (site PR2),
which had the longest record. These sample sizes are substan-
tially larger than what is available for the discrete samplingevents (table 2).
Daily mean specific conductance was variable and had
a large range of values during the irrigation season at all
four sites (fig. 2). The daily mean specific conductance for
the Powder River ranged from 953 to 7,100 µS/cm at Sus-
sex (site PR1), and from 492 to 5,920 µS/cm at Moorhead
(site PR2). Although CBNG development does not occur
upstream from the Powder River at Sussex (site PR1), conven-
tional gas and oil development does occur in the Salt Creek
drainage basin. Daily mean specific conductance generally
Table 2. Period of record for discrete water-quality sample collection for sites in the Powder River drainage basin, Wyoming and
Montana, water years 2001-2004.
Site number(fig. 1)
Period of record for discrete samples usedin this report
Number of discrete water-quality samples by water year
2001 2002 2003 2004
PR1 October 2000 -September 2004 4 12 24 24
CWC March 2001 -September, 2004 7 12 24 24
CC October 2000 -September, 2004 12 12 24 24
PR2 May 2001 -September 2004 5 12 24 24
Table 3. Period of record for continuous data collection for sites in the Powder River drainage basin, Wyoming and Montana, water
years 2001-2004.
[--, no data]
Site number(fig. 1)
Period of record for continuous data used in this report Annual runoff by water year, in acre-feet
Streamflow Specific conductance1 2001 2002 2003 2004
PR1 November 2002 – September 2004 April 2003-September 2004 -- -- -- 62,460
CWC October 2000 – September 2004 July 2001-September 2004 12,350 5,810 23,030 6,910
CC January 2003 – September 2004 April 2003-September 2004 -- -- -- 33,070
PR2 October 2000 – September 2004 May 2001-September 2004 108,900 119,110 210,300 85,200
1 Continuous water-quality instruments used to measure specific conductance were operated only during the irrigation season, generally from April to October.
Water-Quality Characteristics 7
Page 16
8/10/2019 Water-Quality Characteristics, Including Sodium-Adsorption Ratio
http://slidepdf.com/reader/full/water-quality-characteristics-including-sodium-adsorption-ratio 16/32
0 . 0
1 0
. 1 1 1 0
1 0 0
1 , 0
0 0
1 0
, 0 0 0
0 1 , 0
0 0
2 , 0
0 0
3 , 0
0 0
4 , 0
0 0
5 , 0
0 0
6 , 0
0 0
7 , 0
0 0
8 , 0
0 0
O O
N N
D D
2 0 0 1
2 0 0 1
J J
F F
M M
A A
M M
J J J J
A A
S S
O O
N N
D D
2 0 0 2
2 0 0 2
D A T E
J J
F F
M M
A A
M M
J J
J J
A A
S S
O O
N N
D D
2 0 0 3
2 0 0 3
J J
F F
M M
A A
M M
J J
J J
A A
S S
O O
N N
D D
2 0 0 4
2 0 0 4
J J
F F
M M
A A
M M
J J
J J
A A
S S
0 . 0
1 0
. 1 1 1 0
1 0 0
1 , 0
0 0
1 0
, 0 0 0
0 1 , 0
0 0
2 , 0
0 0
3 , 0
0 0
4 , 0
0 0
5 , 0
0 0
6 , 0
0 0
7 , 0
0 0
8 , 0
0 0
S i t e C W C
S i t e P R 1
S T R E A M F L O W , I N C U B I C F E E T P E R S E C O N D
S P E C I F I C C O N D U C T A N C E , I N M I C R O S I E M E N S P E R C E N T I M E T E R A T 2 5 D E G R E E S C E L S I U S
D a
i l y m e a n s p e c i f i c
c
o n d u c t a n c e
D a
i l y m e a n s t r e a m f l o w
E X P L A N A T I O N
F i g u r e 2 .
D a i l y m e a n s t r e a m f l o w a
n d s p e c i f i c c o n d u c t a n c e f o r s i t e s i n t h e
P o w d e r R i v e r d r a i n a g e b a s i n , W y o m i n g a n d M o n t a n a , w a t e r y e a r s 2 0 0 1 - 2 0 0 4 .
8 Water-Quality Characteristics, Powder River Drainage Basin, Wyoming and Montana, Water Years 2001-2004
Page 17
8/10/2019 Water-Quality Characteristics, Including Sodium-Adsorption Ratio
http://slidepdf.com/reader/full/water-quality-characteristics-including-sodium-adsorption-ratio 17/32
1
0 1 , 0
0 0
2 , 0
0 0
3 , 0
0 0
4 , 0
0 0
5 , 0
0 0
6 , 0
0 0
7 , 0
0 0
8 , 0
0 0
O O
N N
D D
2 0 0 1
2 0 0 1
J J
F F
M M
A A
M M
J J J J
A A
S S
O O
N N
D D
2 0 0 2
2 0 0 2
J J
F F
M M
A A
M M
J J
J J
A A
S S
O O
N N
D D
2 0 0 3
2 0 0 3
J J
F F
M M
A A
M M
J J
J J
A A
S S
O O
N N
D D
2 0 0 4
2 0 0 4
J J
F F
M M
A A
M M
J J
J J
A A
S S
1
0 1 , 0
0 0
2 , 0
0 0
3 , 0
0 0
4 , 0
0 0
5 , 0
0 0
6 , 0
0 0
7 , 0
0 0
8 , 0
0 0
S i t e
P R 2
S i t e
C C
D A T E
S T R E A M F L O W , I N C U B I C F E E T P E R S E C O N D
S P E C I F I C C O N D U C T A N C E , I N M I C R O S I E M E N S P E R C E N T I M E T E R A T 2 5 D E G R E E S C E L S I U S
D a
i l y m e a n s p e c i f i c
c
o n d u c t a n c e
D a
i l y m e a n s t r e a m f l o w
E X P L A N A T I O N
0 . 0
1 0
. 1 1 0
1 0 0
1 , 0
0 0
1 0
, 0 0 0
0 . 0
1 0
. 1 1 0
1 0 0
1 , 0
0 0
1 0
, 0 0 0
F i g u r e 2 .
D a i l y m e a n s t r e a m f l o w a
n d s p e c i f i c c o n d u c t a n c e f o r s i t e s i n t h e
P o w d e r R i v e r d r a i n a g e b a s i n , W y o m i n g a n d M o n t a n a , w a t e r y e a r s 2 0 0 1 - 2 0 0 4 . — C
o n t i n u e d
Water-Quality Characteristics 9
Page 18
8/10/2019 Water-Quality Characteristics, Including Sodium-Adsorption Ratio
http://slidepdf.com/reader/full/water-quality-characteristics-including-sodium-adsorption-ratio 18/32
Specific Conductance, Major Ions, and Sodium-Adsorption Ratios from Discrete Samples
Specific conductance values; concentrations of dis-
solved calcium, magnesium, sodium, and dissolved solids;
and SAR values for discrete samples collected during water
years 2001-2004 varied at the four sites (fig. 3). As with thecontinuous measurements, the largest median for specific
conductance of 2,270 µS/cm was for samples collected from
the Powder River at Sussex (site PR1) and the smallest median
of 1,180 µS/cm was for samples collected from Clear Creek
(site CC). The largest range in discrete values was reported
for the Powder River at Sussex (site PR1), which included
values from 1,340 to 6,060 µS/cm. The range of discrete
values for the Powder River at Sussex (site PR1) was less than
the range for the daily mean specific conductance reported
from the continuous values, even though the discrete samples
was smaller for the tributaries than for the mainstem. Daily
mean values ranged from 394 to 3,280 µS/cm for Crazy
Woman Creek (site CWC) and from 387 to 2,070 µS/cm for
Clear Creek (site CC). Variations in specific conductance
generally are associated with variations in streamflow. As
streamflow increases as a result of rainfall or snowmelt, the
specific conductance typically decreases as a result of dilu-tion. For example, the smallest daily mean specific conduc-
tance of 387 µS/cm at Clear Creek (site CC) was associated
with a daily mean streamflow of 876 ft3 /sec during May 2003
compared to the largest daily mean specific conductance of
2,070 µS/cm, which was associated with a daily mean stream-
flow of 0.48 ft3 /sec during June 2004 for that site. Specific
conductance values may be larger than average during water
years 2001-2004 because streamflow was less than average as
a result of drought conditions during this period.
The State of Montana has established water-quality
standards for the Powder River for specific conductance to
address concerns about irrigation water quality. From Novem-
ber 1 through March 1, the monthly average numeric water-quality standard is 2,500 µS/cm and no sample may exceed a
value of 2,500 µS/cm; from March 2 through October 31, the
monthly average numeric water-quality standard for specific
conductance is 2,000 µS/cm and no sample may exceed a
value of 2,500 µS/cm (Montana Department of Environmen-
tal Quality, 2002). The daily mean specific conductance for
the Powder River at Moorhead (site PR2), which is near the
Wyoming-Montana Stateline, was larger than 2,500 µS/cm on
many days, exceeding the standard established by the State of
Montana for the irrigation season. However, specific conduc-
tance values in some historical samples from the Powder River
at Moorhead (site PR2) that were collected prior to CBNG
development also exceeded the standard (U.S. Geological Sur-vey, 2005). The State of Wyoming has not established numeric
water-quality criteria for specific conductance for the Powder
River, Crazy Woman Creek, or Clear Creek (Wyoming Depart-
ment of Environmental Quality, 2001b).
for specific conductance were collected throughout the year
compared to the continuous values that were only collected
during the irrigation season. The diluting effect from Clear
Creek on the Powder River is reflected in the smaller median
value (1,930 µS/cm) and smaller range of values (483 to
3,370 µS/cm) reported for the Powder River at Moorhead
(site PR2) compared to the Powder River at Sussex (site PR1).The salinity hazard for most samples collected from the four
sites is classified as high (greater than 750 µS/cm) to very high
(greater than 2,250 µS/cm) using the salinity hazard classifica-
tion system developed by the U.S. Salinity Laboratory Staff
(1954) for irrigation water based on general crop tolerances.
Dissolved calcium and magnesium showed a different
spatial pattern than specific conductance, where the larg-
est median concentrations occurred in samples from Crazy
Woman Creek (site CWC). Median calcium concentrations
ranged from 119 mg/L for samples collected from Clear
Creek (site CC) to 164 mg/L for samples collected from Crazy
Woman Creek (site CWC). Median magnesium concentrations
ranged from 53 mg/L for samples collected from the PowderRiver at Sussex (site PR1) to 89 mg/L for samples collected
from Crazy Woman Creek (site CWC).
Dissolved sodium and SAR values generally showed
the same spatial pattern as specific conductance. The largest
median concentration of sodium (274 mg/L) was observed in
samples collected from the Powder River at Sussex (site PR1).
The large sodium concentrations in samples from the Pow-
der River at site PR1 primarily are the result of large sodium
contributions from Salt Creek (Lindner-Lunsford and others,
1992). Concentrations of sodium for samples collected from
Salt Creek frequently are larger than 1,000 mg/L (Swanson
and others, 2002, 2003, 2004; Watson and others, 2005).
Values for SAR in samples collected from the Powder Riverat Sussex (site PR1) ranged from 3.7 to 21. Median concentra-
tions of sodium and SAR values were substantially smaller
in samples collected from Crazy Woman Creek (site CWC)
and Clear Creek (site CC), which tend to decrease sodium
concentrations and SAR values in samples collected from the
Powder River at Moorhead (site PR2). The smallest median
concentration of sodium (68 mg/L) and smallest median SAR
value (1.3) were observed in samples collected from Clear
Creek (site CC). The sodium (alkali) hazard for most samples
collected from Crazy Woman Creek (site CWC) and Clear
Creek (site CC) is classified as low using the salinity hazard
classification system developed by the U.S. Salinity Labora-
tory Staff (1954) for irrigation water based on general crop tol-
erances. The sodium (alkali) hazard ranged from low to very
high for samples collected from the Powder River at Sussex
(site PR1) and from low to high for samples collected from the
Powder River at Moorhead (site PR2) using the salinity hazard
classification system.
Sodium is more dominant in the Powder River than
in Crazy Woman Creek and Clear Creek because many of
the tributaries contributing to the Powder River originate in
the plains to the east. The plains streams tend to have larger
sodium concentrations because these drainage basins are
10 Water-Quality Characteristics, Powder River Drainage Basin, Wyoming and Montana, Water Years 2001-2004
Page 19
8/10/2019 Water-Quality Characteristics, Including Sodium-Adsorption Ratio
http://slidepdf.com/reader/full/water-quality-characteristics-including-sodium-adsorption-ratio 19/32
75th percentile
25th percentile
Median (50th percentile)
1.5*Interquartile range (IQR) or largest value
-1.5*IQR or smallest value
(62) Sample size
Value greater than 1.5*IQR or less than -1.5*IQR
EXPLANATION
SITE
PR1 CWC CC PR20
25
50
75
100
125
150
175
200
225
250
275
300
325
D I S S O L V E D C A L C I U M ,
I N M I L L I G R A M S
P E R L I T E
R
(66)
(68)
(74)
(62)
D I S S O L V E D M A G N E
S I U M ,
I N
M I L L I G R A M S P E R
L I T E R
PR1 CWC CC PR2
(66)
(68)
(74)
(62)
0
20
40
60
80
100
120
140
160
180
SITE
PR1 CWC CC PR2
SITE S P E C I F I C C O N D U C T A N C E ,
I N M I C R O S I E M E N S
P E R C E N T I M E T E R A T 2 5 D
E G R E E S C E L S I U S
0
1,000
2,000
3,000
4,000
5000
6000
7,000
(65)
(68)
(73)
(62)
S O D I U M - A D S O R P T I O N
R A T I O
PR1 CWC CC PR20
2.5
5
7.5
10
12.5
15
17.5
20
22.5(66)
SITE
D I S S O L V E D S O D I U M ,
I N
M I L L I G R A M S
P E R L I T E R
PR1 CWC CC PR20
200
400
600
800
1,000
1,200
SITE
PR1 CWC CC PR2
SITE
(66)
(68)
(74)
(62)
D I S S O L V E D S O L I D S ,
I N M I
L L I G R A M S
P E R L I T E R
0
1,000
2,000
3,000
4,000
5,000
6,000
7,000
(58)
(59)
(67)
(60)
(68)
(74)
(62)
Figure 3. Specific conductance values; concentrations of dissolved calcium, dissolved magnesium, and dissolved sodium;
sodium-adsorption ratios; and dissolved-solids concentrations in water-quality samples collected from sites in the Powder River
drainage basin, Wyoming and Montana, water years 2001-2004.
Water-Quality Characteristics 11
Page 20
8/10/2019 Water-Quality Characteristics, Including Sodium-Adsorption Ratio
http://slidepdf.com/reader/full/water-quality-characteristics-including-sodium-adsorption-ratio 20/32
SPECIFIC CONDUCTANCE, IN MICROSIEMENS PER CENTIMETER AT 25 DEGREES CELSIUS
D I S S O L V E D - S O L I D S C O N C E N T R A T I O N ,
I N M I L
L I G R A M S P E R L I T E R
0
1,000
2,000
3,000
4,000
0
500
1,000
1,500
0 250 500 750 1,000 1,250 1,500 1,750 2,000 0 500 1,000 1,500 2,000 2,500 3,000 3,500
1,000 2,000 3,000 4,000 5,000 6,000 0 500 1,000 1,500 2,000 2,500 3,0000
500
1,000
1,500
2,000
2,500
0
500
1,000
1,500
2,000
2,500
Site PR1
r greater than 0.99
Site CWC
r greater than 0.99
Site CC
r greater than 0.99
Site PR2
r = 0.98
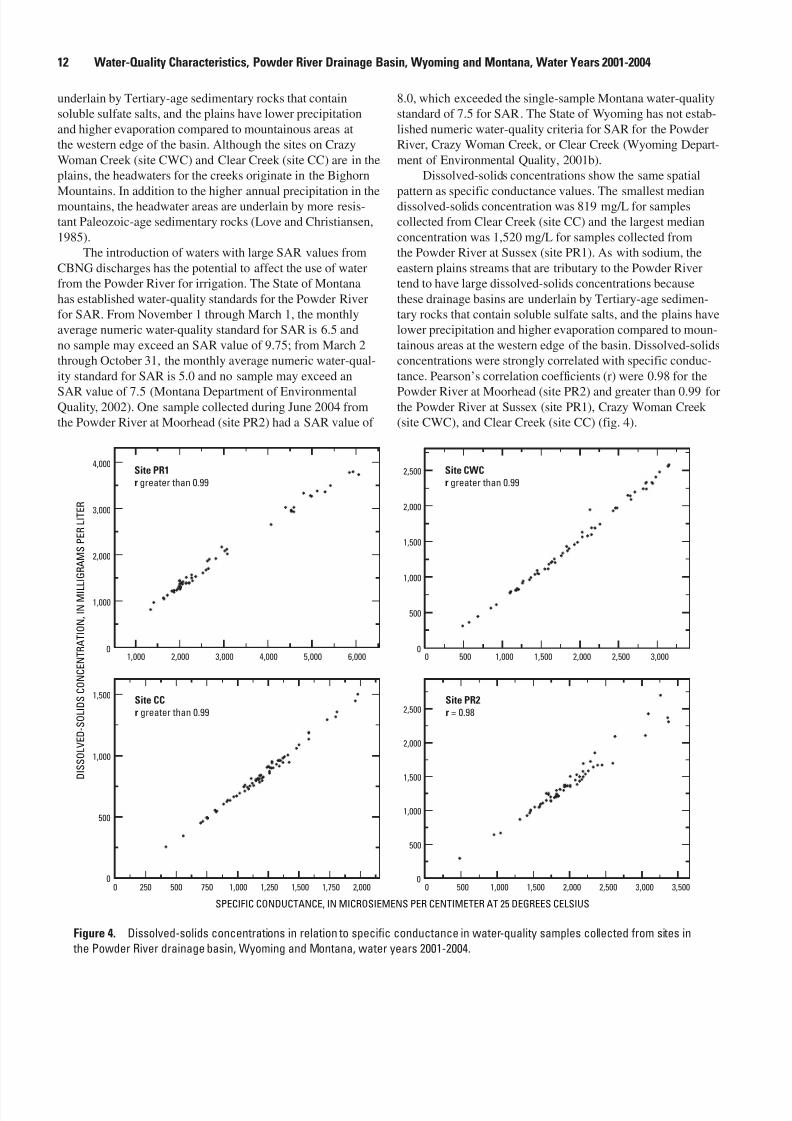
Figure 4. Dissolved-solids concentrations in relation to specific conductance in water-quality samples collected from sites in
the Powder River drainage basin, Wyoming and Montana, water years 2001-2004.
underlain by Tertiary-age sedimentary rocks that contain
soluble sulfate salts, and the plains have lower precipitation
and higher evaporation compared to mountainous areas at
the western edge of the basin. Although the sites on Crazy
Woman Creek (site CWC) and Clear Creek (site CC) are in the
plains, the headwaters for the creeks originate in the Bighorn
Mountains. In addition to the higher annual precipitation in themountains, the headwater areas are underlain by more resis-
tant Paleozoic-age sedimentary rocks (Love and Christiansen,
1985).
The introduction of waters with large SAR values from
CBNG discharges has the potential to affect the use of water
from the Powder River for irrigation. The State of Montana
has established water-quality standards for the Powder River
for SAR. From November 1 through March 1, the monthly
average numeric water-quality standard for SAR is 6.5 and
no sample may exceed an SAR value of 9.75; from March 2
through October 31, the monthly average numeric water-qual-
ity standard for SAR is 5.0 and no sample may exceed an
SAR value of 7.5 (Montana Department of EnvironmentalQuality, 2002). One sample collected during June 2004 from
the Powder River at Moorhead (site PR2) had a SAR value of
8.0, which exceeded the single-sample Montana water-quality
standard of 7.5 for SAR. The State of Wyoming has not estab-
lished numeric water-quality criteria for SAR for the Powder
River, Crazy Woman Creek, or Clear Creek (Wyoming Depart-
ment of Environmental Quality, 2001b).
Dissolved-solids concentrations show the same spatial
pattern as specific conductance values. The smallest mediandissolved-solids concentration was 819 mg/L for samples
collected from Clear Creek (site CC) and the largest median
concentration was 1,520 mg/L for samples collected from
the Powder River at Sussex (site PR1). As with sodium, the
eastern plains streams that are tributary to the Powder River
tend to have large dissolved-solids concentrations because
these drainage basins are underlain by Tertiary-age sedimen-
tary rocks that contain soluble sulfate salts, and the plains have
lower precipitation and higher evaporation compared to moun-
tainous areas at the western edge of the basin. Dissolved-solids
concentrations were strongly correlated with specific conduc-
tance. Pearson’s correlation coefficients (r) were 0.98 for the
Powder River at Moorhead (site PR2) and greater than 0.99 forthe Powder River at Sussex (site PR1), Crazy Woman Creek
(site CWC), and Clear Creek (site CC) (fig. 4).
12 Water-Quality Characteristics, Powder River Drainage Basin, Wyoming and Montana, Water Years 2001-2004
Page 21
8/10/2019 Water-Quality Characteristics, Including Sodium-Adsorption Ratio
http://slidepdf.com/reader/full/water-quality-characteristics-including-sodium-adsorption-ratio 21/32
0 1,000 2,000 3,000 4,000 5,000
SPECIFIC CONDUCTANCE, IN MICROSIEMENS PER CENTIMETER AT 25 DEGREES CELSIUS
0
10
20
30
S 0
D I U M - A D S O R P T I O N R A T I O
EXPLANATION
Water-quality sample collected from:
Site CWC
Site CC
Site PR2
Site PR1
Severe reduction in rate of infiltration
Slight to moderate
reduction in rate of
infiltration
No reduction in rate
of infiltration
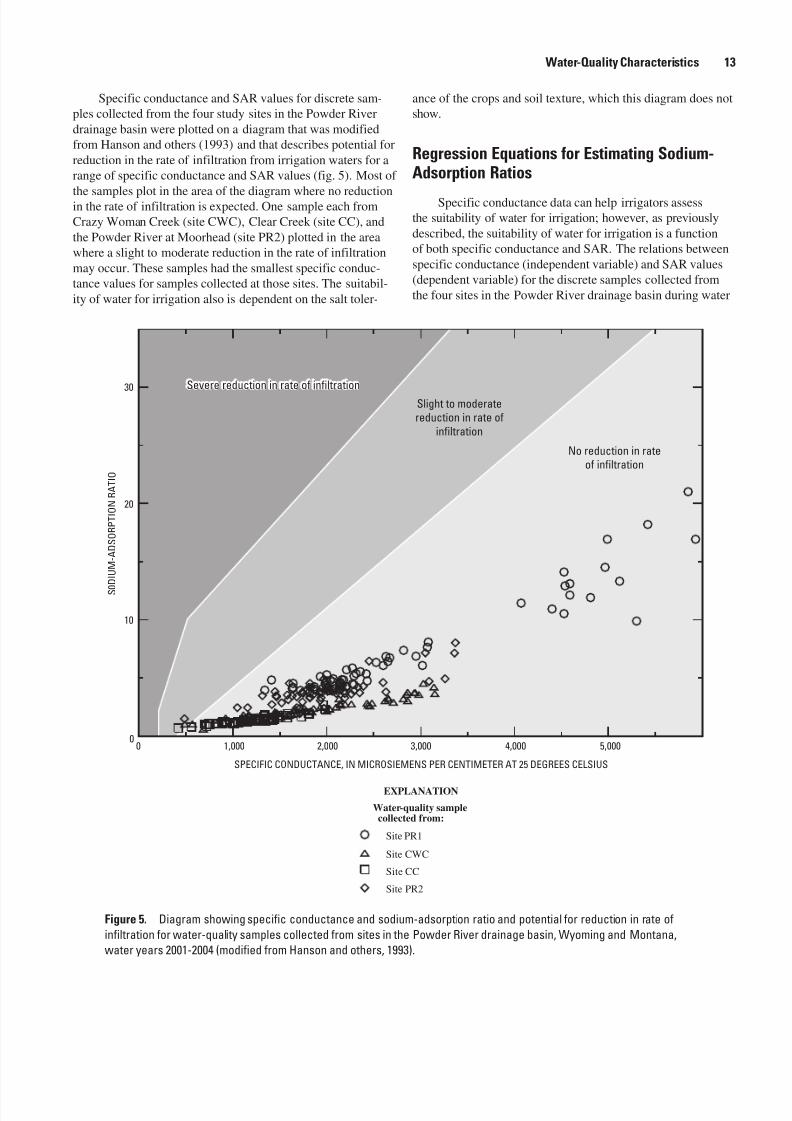
Figure 5. Diagram showing specific conductance and sodium-adsorption ratio and potential for reduction in rate of
infiltration for water-quality samples collected from sites in the Powder River drainage basin, Wyoming and Montana,
water years 2001-2004 (modified from Hanson and others, 1993).
Specific conductance and SAR values for discrete sam-
ples collected from the four study sites in the Powder River
drainage basin were plotted on a diagram that was modified
from Hanson and others (1993) and that describes potential for
reduction in the rate of infiltration from irrigation waters for a
range of specific conductance and SAR values (fig. 5). Most of
the samples plot in the area of the diagram where no reductionin the rate of infiltration is expected. One sample each from
Crazy Woman Creek (site CWC), Clear Creek (site CC), and
the Powder River at Moorhead (site PR2) plotted in the area
where a slight to moderate reduction in the rate of infiltration
may occur. These samples had the smallest specific conduc-
tance values for samples collected at those sites. The suitabil-
ity of water for irrigation also is dependent on the salt toler-
ance of the crops and soil texture, which this diagram does not
show.
Regression Equations for Estimating Sodium-Adsorption Ratios
Specific conductance data can help irrigators assess
the suitability of water for irrigation; however, as previously
described, the suitability of water for irrigation is a function
of both specific conductance and SAR. The relations between
specific conductance (independent variable) and SAR values
(dependent variable) for the discrete samples collected from
the four sites in the Powder River drainage basin during water
Water-Quality Characteristics 13
Page 22
8/10/2019 Water-Quality Characteristics, Including Sodium-Adsorption Ratio
http://slidepdf.com/reader/full/water-quality-characteristics-including-sodium-adsorption-ratio 22/32
years 2001-2004 were graphically inspected (fig. 6). Data
were inspected to determine if relations of specific conduc-
tance and SAR varied by season. Although diversions for
irrigation exist, relations did not vary by season for the Powder
River at Sussex (site PR1) and at Moorhead (site PR2). Rela-
tions for Crazy Woman Creek (site CWC) and Clear Creek
(site CC) did vary slightly by season; however, the slope of theregression did not change and the difference in the intercept
value was small. The complete discrete-sample data sets were
used for consistency among sites. The specific conductance
and SAR relations were determined to be statistically signifi-
cant ( p-values <0.001) at each site, and the linear regression
equations are presented for the four sites in table 4.
The relation between specific conductance and SAR was
stronger (R2=0.92) at the Powder River at Sussex (site PR1)
compared to the Powder River at Moorhead (site PR2,
R2=0.65). In other words, about 92 percent of the variance
in SAR values in samples collected from the Powder River
at Sussex (site PR1) can be explained by the regression with
specific conductance compared to about 65 percent of thevariance in SAR values that can be explained by the regres-
sion at the Powder River at Moorhead (site PR2). The sub-
stantially larger drainage area of the Powder River at Moor-
head has more diverse areas contributing to streamflow and
specific conductance compared to the Powder River at Sussex
(site PR1). Contributing areas include eastern tributaries
originating from the plains and western tributaries originat-
ing from the mountains. In addition, several drainages in the
reach between site PR1 and site PR2 may contribute CBNG
discharge waters to the Powder River. The variable contribut-
ing areas probably produce the additional scatter in data for
the Powder River at site PR2. Ground-water and surface-water
interactions also occur in this reach of the Powder River(Ringen and Daddow, 1990). The coefficients of determination
for Crazy Woman Creek (site CWC, R2=0.91) and Clear Creek
(site CC, R2=0.83) were in between the values for the Powder
River at Sussex (site PR1) and at Moorhead (site PR2). The
uncertainty associated with estimated values is larger for the
Powder River at Sussex (site PR1) and Moorhead (site PR2),
compared to Crazy Woman Creek (site CWC) and Clear Creek
(site CC), as indicated by larger MSE values and wider predic-
tion intervals for the regression equations for these sites.
The linear regression equation was used to estimate
continuous SAR values from the continuous specific conduc-
tance values. The estimated SAR values from the regression
equation were compared to the SAR values calculated from
the discrete samples (fig. 7). The discrete sample results for
SAR generally covered the range of estimated SAR values for
Crazy Woman Creek (site CWC) and Clear Creek (site CC).
For the Powder River at Sussex (site PR1), smaller SAR
values were estimated from specific conductance than were
calculated for discrete samples probably owing to precipita-
tion-event waters with small specific conductance values that
were not sampled. In contrast, some estimated SAR values
were larger than calculated values for discrete samples at
site PR2. The estimated SAR values may more adequately
characterize the fluctuations of SAR values that occur in the
streams because the continuous specific conductance values
show more fluctuations.
Although values of SAR calculated from calcium, mag-
nesium, and sodium concentrations from discrete samples pro-
vide a more accurate measure of SAR, laboratory results may
not be available until several months after sample collection.The regression relations indicate that SAR values estimated
from specific conductance values are a good surrogate for
laboratory analyses. Specific conductance can be measured by
continuous water-quality instruments, and values are avail-
able in real time using NWISWeb (http://waterdata.usgs.
gov/nwis/ ). Using real-time specific conductance to estimate
SAR values increases the amount of information available to
irrigators and water managers for decision making.
Estimates for Dissolved-Solids Loads
The USGS load estimation model, LOADEST, was used
to estimate daily mean and annual dissolved-solids loads at thefour sites in the Powder River drainage basin. Daily mean dis-
solved-solids load estimates and annual dissolved-solids load
estimates for Crazy Woman Creek (site CWC) and the Powder
River at Moorhead (site PR2) were calculated for water years
2001-2004. Daily mean dissolved-solids load estimates for the
Powder River at Sussex (site PR1) and Clear Creek (site CC)
could only be calculated when daily mean streamflow data
were collected during water years 2003 and 2004. Dissolved-
solids loads were calculated for discrete sampling events dur-
ing water years 2001-2004 at all four sites.
The LOADEST regression models for the four sites had
coefficients of determination (R2) ranging from 0.95 to 0.98
(table 5) indicating that 95 to 98 percent of the variance in
dissolved-solids loads at the sites can be explained by the
regressions with streamflow. The estimated daily mean dis-
solved-solids loads during water years 2001-2004 ranged from
<0.1 to 330 tons per day (tons/d) for Crazy Woman Creek
(site CWC), and from 0.3 to 3,290 tons/d for the Powder River
at Moorhead (site PR2) (fig. 8). The estimated daily mean dis-
solved-solids loads during water years 2003-2004 ranged from
62 to 4,000 tons/d for the Powder River at Sussex (site PR1)
and from 1.0 to 440 tons/d for Clear Creek (site CC). For all
sites, the largest dissolved-solids loads generally occurred in
the early spring in response to snowmelt runoff. The smallest
dissolved-solids loads generally occurred in the late summerwhen streamflows typically were smallest. Dissolved-solids
loads calculated for discrete sampling events plotted near the
estimated dissolved-solids loads and generally covered the
range of dissolved-solids loads estimated by LOADEST at all
four sites. Because of drought conditions and below average
streamflows during water years 2001-2004, the dissolved-sol-
ids loads also may be below average.
In order to compare the sites during a common time
period, the average daily mean dissolved-solids loads for
water year 2004 are shown in table 5. The average daily mean
dissolved-solids loads varied substantially among the four
14 Water-Quality Characteristics, Powder River Drainage Basin, Wyoming and Montana, Water Years 2001-2004
Page 23
8/10/2019 Water-Quality Characteristics, Including Sodium-Adsorption Ratio
http://slidepdf.com/reader/full/water-quality-characteristics-including-sodium-adsorption-ratio 23/32
0 500 1,000 1,500 2,000 2,500 3,0000
1
2
3
4
5002500 750 1,000 1,250 1,500 1,750 2,000
0.0
0.5
1.0
1.5
2.0
2.5
3.0
0 500 1,000 1,500 2,000 2,500 3,000 3,5000
2
4
6
8
1,000 2,000 3,000 4,000 5,000 6,0000
5
10
15
20
SPECIFIC CONDUCTANCE, IN MICROSIEMENS PER CENTIMETER AT 25 DEGREES CELSIUS
S O D I U M - A D S O R P T I O N R A T I O
Site CWC
R2 = 0.91
Site CC
R2 = 0.83
Site PR2
R2 = 0.65
Site PR1
R2 = 0.92
EXPLANATION
95-percent prediction interval
Linear regression line
Figure 6. Sodium-adsorption ratios in relation to specific conductance in water-quality samples collected from sites in the
Powder River drainage basin, Wyoming and Montana, water years 2001-2004.
Table 4. Regression equations for estimates of sodium-adsorption ratios for sites in the Powder River
drainage basin, Wyoming and Montana, water years 2001-2004.
[SAR, sodium-adsorption ratio; SC , specific conductance in microsiemens per centimeter at 25 degrees Celsius; MSE, mean
square error; R2, coefficient of determination; <, less than]
Site number (fig. 1) Equation MSE R2 p -value
PR1 SAR=0.0033(SC ) - 2.2 1.29 0.92 <0.001
CWC SAR=0.0011(SC ) + 0.088 0.242 .91 <.001
CC SAR=0.0010(SC ) + 0.17 .130 .83 <.001
PR2 SAR=0.0018(SC ) + 0.38 .711 .65 <.001
Water-Quality Characteristics 15
Page 24
8/10/2019 Water-Quality Characteristics, Including Sodium-Adsorption Ratio
http://slidepdf.com/reader/full/water-quality-characteristics-including-sodium-adsorption-ratio 24/32
5
20
25
S O D I U M - A D S O R P T I O N R A T I O
15
10
0
10
15
5
0
Site PR1
Site CWC
2001
J F M A M J J A S O N D
2002
DATE
J F M A M J J A S O N D
2003
J F M A M J J A S O N D
2004
J F M A M J J A SO N D
2001
J F M A M J J A S O N D
2002
J F M A M J J A S O N D
2003
J F M A M J J A S O N D
2004
J F M A M J J A SO N D
Sodium-adsorption ratio estimated from continuous specific conductance
Sodium-adsorption ratio calculated from discrete water-quality samples
EXPLANATION
Figure 7. Estimated and calculated sodium-adsorption ratios for sites in the Powder River drainage basin, Wyoming and
Montana, water years 2001-2004.
16 Water-Quality Characteristics, Powder River Drainage Basin, Wyoming and Montana, Water Years 2001-2004
Page 25
8/10/2019 Water-Quality Characteristics, Including Sodium-Adsorption Ratio
http://slidepdf.com/reader/full/water-quality-characteristics-including-sodium-adsorption-ratio 25/32
Site PR2
Site CC
DATE
2001
J F M A M J J A S O N D
2002
J F M A M J J A S O N D
2003
J F M A M J J A S O N D
2004
J F M A M J J A SO N D
2001
J F M A M J J A S O N D
2002
J F M A M J J A S O N D
2003
J F M A M J J A S O N D
2004
J F M A M J J A SO N D
EXPLANATION
S O D I U M - A D S O R P T I O N R A T I O
10
15
5
0
10
15
5
0
Sodium-adsorption ratio estimated from continuous specific conductance
Sodium-adsorption ratio calculated from discrete water-quality samples
Figure 7. Estimated and calculated sodium-adsorption ratios for sites in the Powder River drainage basin, Wyoming and
Montana, water years 2001-2004.—Continued
Water-Quality Characteristics 17
Page 26
8/10/2019 Water-Quality Characteristics, Including Sodium-Adsorption Ratio
http://slidepdf.com/reader/full/water-quality-characteristics-including-sodium-adsorption-ratio 26/32
sites during water year 2004. Although the smallest concentra-
tions of dissolved solids were in samples from Clear Creek
(site CC), the smallest average daily mean dissolved-solids
load (29.2 tons/d) was estimated for Crazy Woman Creek
(site CWC), which has the smallest mean annual runoff
(table 1). The largest average daily mean dissolved-solids load
(407 tons/d) was estimated for the Powder River at Moorhead(site PR2). This is expected given that site PR2 has the largest
mean annual runoff and receives dissolved-solids loads from
the other three upstream sites.
Annual dissolved-solids loads and runoff-weighted dis-
solved-solids loads for water years 2001-2004 were estimated
for Crazy Woman Creek (site CWC) and the Powder River at
Moorhead (site PR2, table 6). Annual load estimates for the
Powder River at Sussex (site PR1) and Clear Creek (site CC)
could only be estimated for water year 2004 because this
was the only year with a complete streamflow record. During
water year 2004, site PR2 had the largest dissolved-solids load
estimate of 149,000 tons per year. The annual load at site PR2
during water year 2004 was less than the combined annual
loads for the Powder River at Sussex (site PR1), Crazy Woman
Creek (site CWC), and Clear Creek (site CC) probably as a
result of streamflow losses between Sussex and Moorhead.
When loads were weighted for variations in annualrunoff, the Powder River at Sussex (site PR1) had the larg-
est dissolved-solids load estimate of 2.05 tons per acre-foot.
Site PR1 also had the largest dissolved-solids concentra-
tions. The smallest runoff-weighted dissolved-solids load was
estimated for Clear Creek (site CC), which had the smallest
dissolved-solids concentrations. The Powder River at Moor-
head (site PR2) had a larger runoff-weighted dissolved-solids
load than Clear Creek, and, to a lesser extent, Crazy Woman
Creek, indicating these tributaries have a diluting effect on the
Powder River at site PR2.
Table 5. Summary statistics of LOADEST regression models used to estimate daily mean dissolved-solids loads for sites in the Powder
River drainage basin, Wyoming and Montana, water years 2001-2004.
[R2, coefficient of determination]
Site number(fig. 1)
Number of days ofestimated record
Period of record usedin this report(water years)
R2
Average daily mean dis-solved-solids load for water
year 2004, in tons per day
95-percent confidenceinterval for the average dailymean dissolved-solids loadfor water year 2004, in tons
per day
PR1 679 22003-04 0.95 349 330 - 369
CWC 11,432 2001-04 .98 29.2 27.1 - 31.5
CC 633 22003-04 .98 94.2 89.5 – 99.0
PR2 1,461 2001-04 .96 407 375 - 440
1Site had 29 days with zero streamflow that could not be used in the model.
2Only partial streamflow record available during water year 2003
Table 6. Estimated dissolved-solids annual loads and runoff-weighted loads for sites in the Powder River drainage basin, Wyoming
and Montana, water years 2001-2004.
[--, not determined]
Sitenumber(fig. 1)
Water Year
2001 2002 2003 2004
Load, tons per year
Load, tons peracre-foot
Load, tons per year
Load, tons peracre-foot
Load, tons per year
Load, tons peracre-foot
Load, tons per year
Load, tons peracre-foot
PR1 -- -- -- -- -- -- 128,000 2.05
CWC 13,600 1.10 9,440 1.63 21,500 0.94 10,700 1.55
CC -- -- -- -- -- -- 34,500 1.04
PR2 178,000 1.64 187,000 1.57 282,000 1.34 149,000 1.75
18 Water-Quality Characteristics, Powder River Drainage Basin, Wyoming and Montana, Water Years 2001-2004
Page 27
8/10/2019 Water-Quality Characteristics, Including Sodium-Adsorption Ratio
http://slidepdf.com/reader/full/water-quality-characteristics-including-sodium-adsorption-ratio 27/32
S i t e P R 1
S i t e C C
S i t e C W C
S i t e P R 2
O N D
2 0 0 1
J
M
M
A S
2 0 0 2
2 0 0 3
2 0 0 4
0 . 1
0 . 2
0 . 5 1 2 5
1 0
2 0
5 0
1 0 0
2 0 0
5 0 0
1 , 0
0 0
2 , 0
0 0
5 , 0
0 0
1 0 , 0
0 0
0 . 1
0 . 2
0 . 5 1 2 5
1 0
2 0
5 0
1 0 0
2 0 0
5 0 0
1 , 0
0 0
2 , 0
0 0
5 , 0
0 0
1 0 , 0
0 0
0 . 1
0 . 2
0 . 5
1 0
2 0
5 0
1 0 0
2 0 0
5 0 0
1 , 0
0 0
2 , 0
0 0
5 , 0
0 0
1 0 , 0
0 0
0 . 1
0 . 2
0 . 5 1 2 5
1 0
2 0
5 0
1 0 0
2 0 0
5 0 0
1 , 0
0 0
2 , 0
0 0
5 , 0
0 0
1 0 , 0
0 0
F
A
J J
O N D
J
M
M
A S
F
A
J J
O N D J
M
M
A S
F
A
J J
O N D J
M
M
A S
F
A
J J
O N D
2 0 0 1
J
M
M
A S
2 0 0 2
2 0 0 3
2 0 0 4
F
A
J J
O N D
J
M
M
A S
F
A
J J
O N D J
M
M
A S
F
A
J J
O N D J
M
M
A S
F
A
J J
O N D
2 0 0 1
J
M
M
A S
2 0 0 2
2 0 0 3
2 0 0 4
F
A
J J
O N D J
M
M
A S
F
A
J J
O N D J
M
M
A S
F
A
J J
O N
D J
M
M
A S
F
A
J J
O N D
2 0 0 1
J
M
M
A S
2 0 0 2
2 0 0 3
2 0 0 4
F
A
J J
O N D J
M
M
A S
F
A
J J
O N D J
M
M
A S
F
A
J J
O N
D J
M
M
A S
F
A
J J
D I S S O L V E D - S O L I D S L O A D , I N T O N S P E R D A Y
D i s s o l v e d - s o l i d s l o a d e s t i m a t e d f r o m c
o n t i n u o u s s t r e a m f l o w u s i n g L
O A D E S T
D i s s o l v e d - s o l i d s l o a d c a l c u l a t e d f r o m d
i s c r e t e s a m p l i n g e v e n t s
E X P L A N A T I O N
F i g u r e 8 .
E s t i m a t e d a n d c a l c u l a
t e d d i s s o l v e d - s o l i d s l o a d s f o r s i t e s i n t h e P o w d e r R i v e r d r a i n a g e b a s i n , W y o m i n g
a n d M o n t a n a , w a t e r y e a r s 2 0 0 1 - 2 0 0 4 .
Water-Quality Characteristics 19
Page 28
8/10/2019 Water-Quality Characteristics, Including Sodium-Adsorption Ratio
http://slidepdf.com/reader/full/water-quality-characteristics-including-sodium-adsorption-ratio 28/32
Summary
The U.S. Geological Survey, in cooperation with the
Wyoming Department of Environmental Quality, moni-
tors streams throughout the Powder River structural basin in
Wyoming and parts of Montana in response to concerns over
coalbed natural gas development. Because coalbed waters mayhave specific conductance values and sodium-adsorption ratio
(SAR) values that are larger than the stream waters that may
receive discharge waters, continuous water-quality instruments
for specific conductance were installed and discrete water-
quality samples were collected to characterize water quality
during water years 2001-2004 at four sites in the Powder
River drainage basin: the Powder River at Sussex, Wyoming;
Crazy Woman Creek near Arvada, Wyoming; Clear Creek
near Arvada, Wyoming; and the Powder River at Moorhead,
Montana.
During water years 2001-2004, the median specific con-
ductance of 2,270 microsiemens per centimeter at 25 degrees
Celsius (µS/cm) in discrete samples from the Powder River
at Sussex, Wyoming, was larger than the median specific
conductance of 1,930 µS/cm in discrete samples downstream
on the Powder River at Moorhead, Montana. The median
specific conductance was smallest in discrete samples from
Clear Creek (1,180 µS/cm), which has a dilution effect on the
specific conductance for the Powder River at Moorhead, Mon-
tana. The daily mean values for specific conductance from
continuous water-quality instruments during the irrigation
season showed the same spatial pattern as discrete values from
samples. Specific conductance values may have been elevated
in some samples collected at all four sites owing to drought
conditions during water years 2001-2004.Dissolved sodium, SAR values, and dissolved solids
generally showed the same spatial pattern as specific conduc-
tance. The largest median sodium concentration (274 milli-
grams per liter) and the largest range of SAR values (3.7 to 21)
were measured in samples from the Powder River at Sussex,
Wyoming. Although the Powder River at Sussex, Wyoming
is upstream from coalbed natural gas development, the site
receives inputs from Salt Creek. Conventional gas and oil
development occur in the Salt Creek drainage basin. Median
concentrations of sodium and SAR values were substantially
smaller in Crazy Woman Creek and Clear Creek, which tend
to decrease sodium concentrations and SAR values at the Pow-
der River at Moorhead, Montana. Dissolved-solids concentra-tions in discrete samples were closely correlated with specific
conductance values; Pearson’s correlation coefficients were
0.98 or greater for all four sites.
Regression equations for specific conductance and SAR
were statistically significant ( p-values <0.001) at all four
sites. The strongest relation (R2=0.92) was at the Powder
River at Sussex, Wyoming. Relations on Crazy Woman Creek
(R2=0.91) and Clear Creek (R2=0.83) also were strong. The
relation between specific conductance and SAR was weak-
est (R2=0.65) at the Powder River at Moorhead, Montana.
These data indicate that values for specific conductance from
continuous water-quality instruments are useful for estimating
sodium-adsorption ratios in real time.
A regression model called LOADEST was used to
estimate dissolved-solids loads for the four sites. The aver-
age daily mean dissolved-solids loads varied among the
sites during water year 2004. The largest average daily meandissolved-solids load was calculated for the Powder River
at Moorhead, Montana. Although the smallest concentra-
tions of dissolved solids were in samples from Clear Creek,
the smallest average daily mean dissolved-solids load was
calculated for Crazy Woman Creek. The largest loads occurred
during spring runoff, and the smallest loads occurred in late
summer, when streamflows typically were smallest. Dis-
solved-solids loads may be smaller than average during water
years 2001-2004 as a result of drought conditions.
ReferencesBartos, T.T., and Ogle, K.M., 2002, Water quality and environ-
mental isotopic analyses of ground-water samples collected
from the Wasatch and Fort Union Formations in areas of
coalbed methane development—Implications to recharge
and ground-water flow, eastern Powder River Basin, Wyo-
ming: U.S. Geological Survey Water-Resources Investiga-
tions Report 02-4045, 88 p.
Christensen, V.G., Jian, Xiaodong, and Ziegler, A.C., 2000,
Regression analysis and real-time water-quality monitoring
to estimate constituent concentrations, loads, and yields in
the Little Arkansas River, south-central Kansas, 1995-99:U.S. Geological Survey Water-Resources Investigations
Report 00-4126, 36 p.
DeBruin, R.H., Lyman, R.M., Jones, R.W., and Cook, L.W.,
2000, Coalbed methane in Wyoming: Wyoming State Geo-
logical Survey Information Pamphlet 7, 15 p.
Fishman, M.J., ed., 1993, Methods of analysis by the U.S.
Geological Survey National Water Quality Laboratory—
Determination of inorganic and organic constituents in
water and fluvial sediments: U.S. Geological Survey Open-
File Report 93-125, 217 p.
Hanson, B.R., Grattan, S.R., and Fulton, A., 1993, Agricul-tural salinity and drainage: Davis, California, University of
California Irrigation Program, Water Management Hand-
book Series, Publication 93-01, 141 p.
Helsel, D.R., and Hirsch, R.M., 1992, Statistical methods in
water resources: New York, Elsevier Science Publishers,
522 p.
Hem, J.D., 1985, Study and interpretation of the chemical
characteristics of natural water (3d ed.): U.S. Geological
Survey Water-Supply Paper 2254, 263 p.
20 Water-Quality Characteristics, Powder River Drainage Basin, Wyoming and Montana, Water Years 2001-2004
Page 29
8/10/2019 Water-Quality Characteristics, Including Sodium-Adsorption Ratio
http://slidepdf.com/reader/full/water-quality-characteristics-including-sodium-adsorption-ratio 29/32
Lam, Longhow, 1999, An introduction to S-PLUS for Win-
dows: Amsterdam, The Netherlands, CANdiensten, 164 p.
Lindner-Lunsford, J.B., Parrett, Charles, Wilson, J.F. Jr., and
Eddy-Miller, C.A., 1992, Chemical quality of surface water
and mathematical simulation of the surface-water system,
Powder River drainage basin, northeastern Wyoming and
southeastern Montana: U.S. Geological Survey Water-
Resources Investigations Report 91-4199, 85 p.
Love, J.D., and Christiansen, A.C., 1985, Geologic map
of Wyoming: U.S. Geological Survey, scale 1:500,000,
3 sheets.
Montana Department of Environmental Quality, 2002, Admin-
istrative rules of Montana—Title 17, chapter 30, water
quality, sub-chapter 6, surface-water quality standards and
procedures, September 30, 2002, 52 p.: accessed Aug. 10,
2005, at http://www.deq.state.mt.us/dir/Legal/Chapters/
CH30-06.pdf.
Nimick, D.A., 2004, Monitoring surface-water quality in the
Tongue River watershed: U.S. Geological Survey Fact Sheet
2004-3011, 2 p.
Omernik, J.M., 1987, Ecoregions of the conterminous United
States: Annals of the Association of American Geographers,
v. 77, no. 1, p. 118-125, scale 1:7,500,000.
Oregon Climate Service, 1998, Western U.S. average monthly
precipitation, 1961-90: Corvallis, Oregon State University,
Oregon Climate Service, digital data, accessed Aug. 10,
2005, at http://www.ocs.orst.edu/pub/maps/Precipitation/
Total/States/WY/wy.gif.
Rantz, S.E., and others, 1982, Measurement and computation
of streamflow—volume 1, measurement of stage and dis-
charge: U.S. Geological Survey Water-Supply Paper 2175,
284 p.
Rasmussen, P.P., and Ziegler, A.C., 2003, Comparison and
continuous estimates of fecal coliform and Escherichia coli
bacteria in selected Kansas streams, May 1999 through
April 2002: U.S. Geological Survey Water-Resources Inves-
tigations Report 03-4056, 87 p.
Rice, C.A., Ellis, M.S., and Bullock, J.H., Jr., 2000, Water co-
produced with coalbed methane in the Powder River Basin,
Wyoming—preliminary compositional data: U.S. Geologi-
cal Survey Open-File Report 00-372, 20 p.
Ringen, B.H., and Daddow, P.B., 1990, Hydrology of the Pow-
der River alluvium between Sussex, Wyoming and Moor-
head, Montana: U.S. Geological Survey Water-Resources
Investigations Report 89-4002, 48 p.
Runkel, R.L., Crawford, C.G., and Cohn, T.A., 2004, Load
Estimator (LOADEST)—A FORTRAN program for esti-
mating constituent loads in streams and rivers: U.S. Geo-
logical Survey Techniques and Methods, book 4, chap. A5,
69 p.
Swanson, R.B., Miller, K.A., Woodruff, R.E., Laidlaw, G.A.,
Watson, K.R., and Clark, M.L., 2003, Water resources data,
Wyoming, water year 2002, volume 1, surface water: U.S.
Geological Survey Water-Data Report WY-02-1, 526 p.
Swanson, R.B., Miller, K.A., Woodruff, R.E., Laidlaw, G.A.,
Watson, K.R., and Clark, M.L., 2004, Water resources data,
Wyoming, water year 2003, volume 1, surface water: U.S.
Geological Survey Water-Data Report WY-03-1, 531 p.
Swanson, R.B., Woodruff, R.E., Laidlaw, G.A., Watson, K.R.,
and Clark, M.L., 2002, Water resources data, Wyoming,
water year 2001, volume 1, surface water: U.S. Geological
Survey Water-Data Report WY-01-1, 518 p.
U.S. Geological Survey, 1992, National Land Cover Dataset
(NLCD): Sioux Falls, South Dakota, U.S. Geological Sur-
vey digital data, accessed Aug. 10, 2005, at http://landcover.
usgs.gov/natllandcover.asp.
U.S. Geological Survey, 1997 to 2006, National field manual
for the collection of water-quality data: U.S. Geological
Survey Techniques of Water-Resources Investigations,
book 9, chaps. A1-A9, 2 v. [variously paged], (also avail-
able at http://pubs.water.usgs.gov/twri9A). Chapters origi-
nally were published from 1997-1999; updates and revi-
sions are ongoing and are summarized at http://water.usgs.
gov/owq/FieldManual/mastererrata.html.
U.S. Geological Survey, 2002, Assessment of undiscovered
oil and gas resources of the Powder River Basin Province of
Wyoming and Montana, 2002: U.S. Geological Survey Fact
Sheet FS-146-02, 2 p.
U.S. Geological Survey, 2005, National Water Information
System Web digital data: accessed Aug. 10, 2005 at http://
nwis.waterdata.usgs.gov/usa/nwis/qw.
U.S. Salinity Laboratory Staff, 1954, Diagnosis and improve-
ment of saline and alkali soils: U.S. Department of Agricul-
ture Handbook 60, 160 p.
Wagner, R.J., Mattraw, H.C., Ritz, G.F., and Smith, B.A.,
2000, Guidelines and standard procedures for continuous
water-quality monitors—site selection, field operation, cali-
bration, record computation, and reporting: U.S. Geological
Survey Water-Resources Investigations Report 00-4252,
53 p.
References 21
Page 30
8/10/2019 Water-Quality Characteristics, Including Sodium-Adsorption Ratio
http://slidepdf.com/reader/full/water-quality-characteristics-including-sodium-adsorption-ratio 30/32
Watson, K.R., Woodruff, R.E., Laidlaw, G.A., Clark, M.L.,
and Miller, K.A., 2005, Water resources data, Wyoming,
water year 2004, volume 1, surface water: U.S. Geological
Survey Water-Data Report WY-04-1, 578 p.
Western Regional Climate Center, 2005, Wyoming Climate
Summaries: Reno, Desert Research Institute, Western
Regional Climate Center, digital data, accessed Aug. 10,
2005, at http://www.wrcc.dri.edu/summary/climsmwy.html.
Wyoming Department of Environmental Quality, 2001a, Wyo-
ming surface water classification list: Wyoming Department
of Environmental Quality, Water Quality Division, Surface
Water Standards, June 21, 2001 [variously paged], accessed
Mar. 28, 2006, at http://deq.state.wy.us/wqd/watershed/
surfacestandards/Downloads/Standards/2-3648-doc.pdf.
Wyoming Department of Environmental Quality, 2001b, Water
quality rules and regulations, Chapter 1, Wyoming surface
water quality standards: Wyoming Department of Envi-
ronmental Quality, Water Quality Division, June 21, 2001[variously paged], accessed Mar. 28, 2006, at http://deq.
state.wy.us/wqd/WQDrules/Chapter_01.pdf.
Wyoming Oil and Gas Conservation Commission, 2005,
digital data, accessed Aug, 10, 2005, at http://wogcc.state.
wy.us/coalbedchart.cfm.
22 Water-Quality Characteristics, Powder River Drainage Basin, Wyoming and Montana, Water Years 2001-2004
For more information concerning the research in this report ,
contact:
Director
Wyoming Water Science Center
U.S. Geological Survey
2617 E. Lincolnway, Suite B
Cheyenne, Wyoming 82001-56 62
(307) 778-2931
http://wy.water.usgs.gov/
Page 31
8/10/2019 Water-Quality Characteristics, Including Sodium-Adsorption Ratio
http://slidepdf.com/reader/full/water-quality-characteristics-including-sodium-adsorption-ratio 31/32
Page 32
8/10/2019 Water-Quality Characteristics, Including Sodium-Adsorption Ratio
http://slidepdf.com/reader/full/water-quality-characteristics-including-sodium-adsorption-ratio 32/32