16
Water Quality in Deer Creek and its Tributaries: An analysis of samples collected by Stream Team 2760 Deer Creek at the LREC horse trail site Danelle Haake May 2011
Water Quality in Deer Creek and its Tributaries:
An analysis of samples collected by
Stream Team 2760
Deer Creek at the LREC horse trail site
Danelle Haake
May 2011
Table of Contents
Executive Summary .................................................................................................................................... 1
Introduction................................................................................................................................................. 1
Sampling Plan and Results......................................................................................................................... 1
Physical and Chemical Sampling: ................................................................................................... 2
Biological Sampling: ....................................................................................................................... 4
Habitat Measurements:.................................................................................................................... 4
Analysis and Discussion.............................................................................................................................. 6
pH: ................................................................................................................................................... 6
Flow Duration: ................................................................................................................................ 6
Nitrate:............................................................................................................................................. 6
Chloride: .......................................................................................................................................... 8
Dissolved Oxygen: ........................................................................................................................... 9
Hydrology: ..................................................................................................................................... 10
Biological: ..................................................................................................................................... 10
Habitat: .......................................................................................................................................... 11
Complications ............................................................................................................................................ 11
Summary.................................................................................................................................................... 12
Acknowledgements ................................................................................................................................... 12
References.................................................................................................................................................. 13
Appendix 1: USGS Gauge Data.............................................................................................................. 14
List of Tables
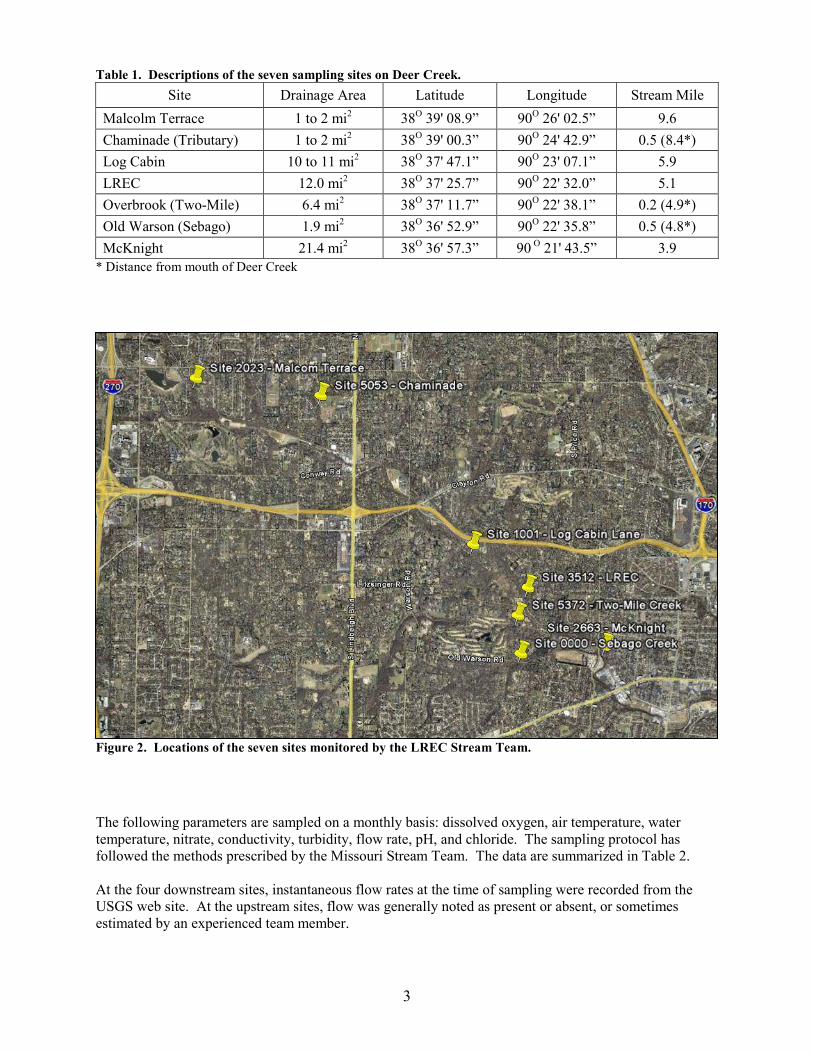
Table 1. Descriptions of the seven sampling sites on Deer Creek. .............................................................. 3
Table 2. Summary of water chemistry in Deer Creek as measured by Stream Team 2670......................... 4
Table 3. Summary of A) invertebrate scores and B) number of individual invertebrates. .......................... 4
Table 4. Summary of the visual stream survey. ........................................................................................... 5
List of Figures
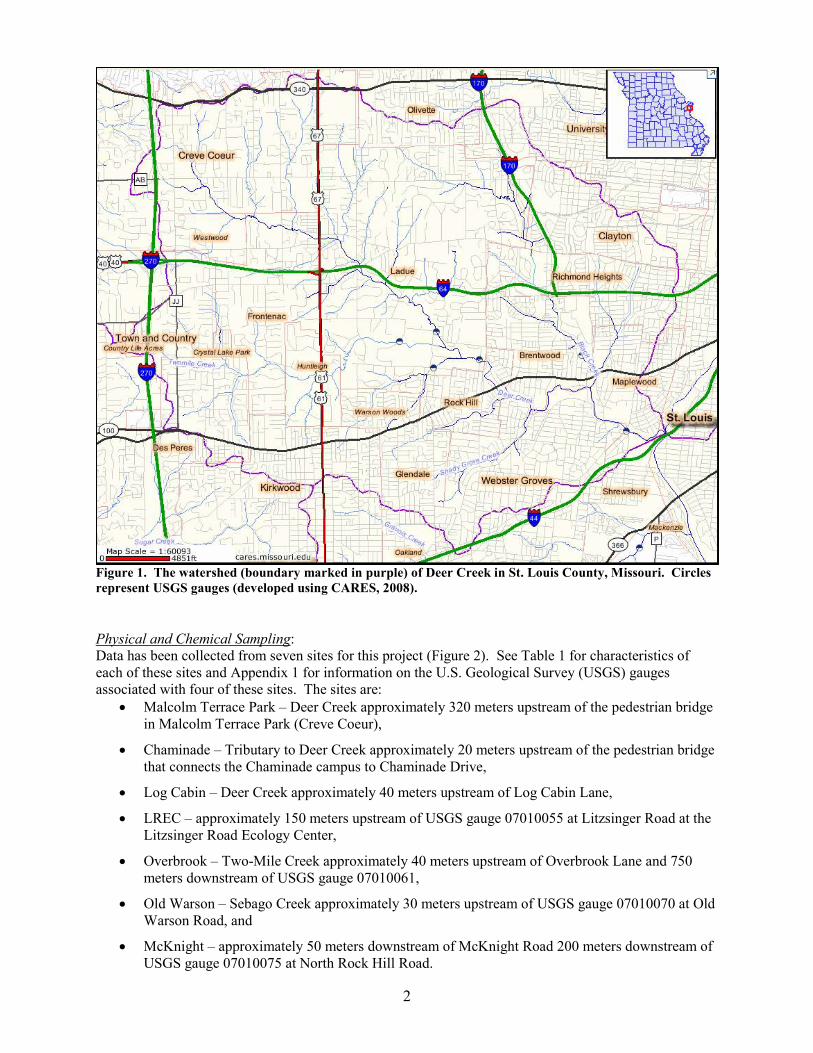
Figure 1. The watershed (boundary marked in purple) of Deer Creek in St. Louis County, Missouri........ 2
Figure 2. Locations of the seven sites monitored by the LREC Stream Team. ........................................... 3
Figure 3. Flow duration curve for Deer Creek at the Litzsinger Road Ecology Center............................... 7
Figure 4. Load duration curve for chloride in Deer Creek at Litzsinger Road. ........................................... 7
Figure 5. Chloride concentrations during the winter in Deer Creek at Litzsinger Road.............................. 8
Figure 6. Concentrations of dissolved oxygen by day of the year in Deer Creek and its tributaries. .......... 9
Figure 7. Hydrology of Deer Creek at LREC ............................................................................................ 10

1
Executive Summary
Staff and volunteers at the Litzsinger Road Ecology Center (LREC) in Ladue, Missouri, monitor water
quality in Deer Creek. Monitoring results presented in this report represent three years of water chemistry
data collection at seven sites along Deer Creek and its tributaries as well as six years of benthic
macroinvertebrate study at LREC.
Water chemistry parameters are sampled monthly using Missouri Stream Team methods: dissolved
oxygen, air temperature, water temperature, nitrate, conductivity, turbidity, flow rate, pH, and chloride.
Data show that pH is periodically lower than desired at the upstream sites. Dissolved oxygen
concentrations fluctuate fairly widely, often falling below the 5 mg/l that is vital to support a healthy fish
and macroinvertebrate community. Chloride concentrations are often very high in winter, reaching levels
that are considered toxic to fish and invertebrates; this chloride is associated with runoff of water
containing road salt during snow melt.
Benthic macroinvertebrate samples are collected annually in both the spring and the fall. Monitoring has
shown that populations in Deer Creek are generally more diverse in the fall than in the spring. The
presence of fish is noted in May through September, but they are rarely seen October through April.
Stream flow data is collected by the U.S. Geological Survey (USGS) at the Litzsinger Road bridge at the
downstream end of the LREC property, as well as several other sites in the watershed. Considering the
urban setting of Deer Creek and the high variability of flow in the stream, the ecology of the stream seems
fairly intact.
Introduction
Deer Creek is a fourth order stream in St. Louis County, Missouri (Figure 1). It is a tributary to the River
Des Peres. The stream length is 10.8 miles (CARES, 2008). Contributing streams include Two-Mile
Creek, Sebago Creek, Shady Grove Creek, and Black Creek. The watershed of Deer Creek is located in
the heart the St. Louis suburbs and drains approximately 37 square miles, including large portions of the
municipalities of Brentwood, Creve Coeur, Frontenac, Glendale, Ladue, Maplewood, Richmond Heights,
Rock Hill, Webster Groves, and others.
Members of Stream Team 2760, Litzsinger Road Ecology Center (LREC) Stream Team, have been
collecting water quality data since 2005. Originally, this effort was intended to provide an opportunity for
members of the LREC community to learn about water quality, to practice their monitoring skills, and to
generate some baseline information on the ecology of Deer Creek. Beginning in 2008, water chemistry
data has been collected as well. This baseline data was to be used by the staff at LREC as well as
members of the St. Louis County Department of Health who were working to fill the needs of a multi-
watershed 319 water quality improvement grant.
More recently, the 319 water quality improvement grant has been transferred to the Missouri Botanical
Garden. A nine-point watershed plan has been submitted to EPA and a new 319 grant has been awarded
to continue the implementation of the plan. The administrators of the grant are utilizing the data set
collected by the LREC Stream Team as part of their monitoring requirements.
Sampling Plan and Results
Regular monitoring commenced on February 28, 2008. Water chemistry samples were collected at seven
sites in the Deer Creek watershed on 30 or 31 occasions; some sites were not sampled on one occasion
due to weather. In addition, 14 sets of aquatic macroinvertebrate samples have been collected at two sites
on LREC property since 2005. Water quality sampling is expected to continue approximately once per
month through the grant period with two biological samples collected per year. The level of interest of
the Stream Team Volunteers for additional sampling beyond the period of the grant will be evaluated at
that time.
2
Figure 1. The watershed (boundary marked in purple) of Deer Creek in St. Louis County, Missouri. Circles
represent USGS gauges (developed using CARES, 2008).
Physical and Chemical Sampling:
Data has been collected from seven sites for this project (Figure 2). See Table 1 for characteristics of
each of these sites and Appendix 1 for information on the U.S. Geological Survey (USGS) gauges
associated with four of these sites. The sites are:
• Malcolm Terrace Park – Deer Creek approximately 320 meters upstream of the pedestrian bridge
in Malcolm Terrace Park (Creve Coeur),
• Chaminade – Tributary to Deer Creek approximately 20 meters upstream of the pedestrian bridge
that connects the Chaminade campus to Chaminade Drive,
• Log Cabin – Deer Creek approximately 40 meters upstream of Log Cabin Lane,
• LREC – approximately 150 meters upstream of USGS gauge 07010055 at Litzsinger Road at the
Litzsinger Road Ecology Center,
• Overbrook – Two-Mile Creek approximately 40 meters upstream of Overbrook Lane and 750
meters downstream of USGS gauge 07010061,
• Old Warson – Sebago Creek approximately 30 meters upstream of USGS gauge 07010070 at Old
Warson Road, and
• McKnight – approximately 50 meters downstream of McKnight Road 200 meters downstream of
USGS gauge 07010075 at North Rock Hill Road.
3
Table 1. Descriptions of the seven sampling sites on Deer Creek.
Site Drainage Area Latitude Longitude Stream Mile
Malcolm Terrace 1 to 2 mi2
38O 39' 08.9” 90
O 26' 02.5” 9.6
Chaminade (Tributary) 1 to 2 mi2 38
O 39' 00.3” 90
O 24' 42.9” 0.5 (8.4*)
Log Cabin 10 to 11 mi2 38
O 37' 47.1” 90
O 23' 07.1” 5.9
LREC 12.0 mi2
38O 37' 25.7” 90
O 22' 32.0” 5.1
Overbrook (Two-Mile) 6.4 mi2 38
O 37' 11.7” 90
O 22' 38.1” 0.2 (4.9*)
Old Warson (Sebago) 1.9 mi2 38
O 36' 52.9” 90
O 22' 35.8” 0.5 (4.8*)
McKnight 21.4 mi2
38O 36' 57.3” 90
O 21' 43.5” 3.9
* Distance from mouth of Deer Creek
Figure 2. Locations of the seven sites monitored by the LREC Stream Team.
The following parameters are sampled on a monthly basis: dissolved oxygen, air temperature, water
temperature, nitrate, conductivity, turbidity, flow rate, pH, and chloride. The sampling protocol has
followed the methods prescribed by the Missouri Stream Team. The data are summarized in Table 2.
At the four downstream sites, instantaneous flow rates at the time of sampling were recorded from the
USGS web site. At the upstream sites, flow was generally noted as present or absent, or sometimes
estimated by an experienced team member.
4
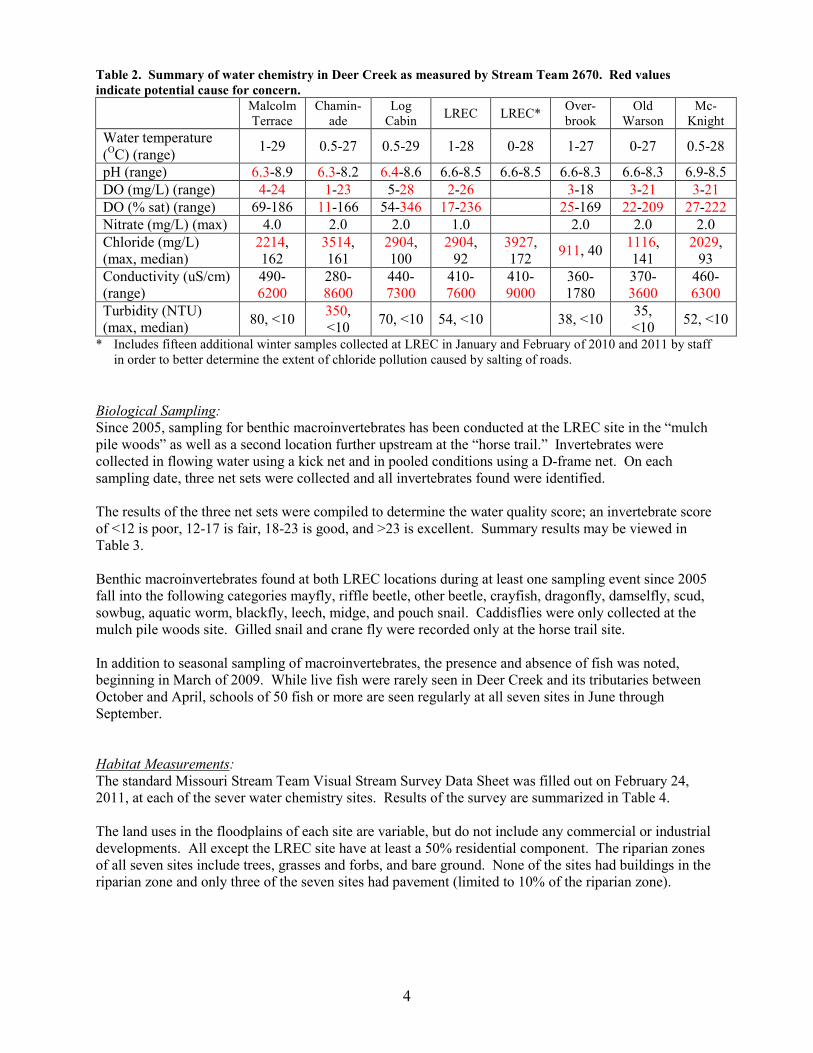
Table 2. Summary of water chemistry in Deer Creek as measured by Stream Team 2670. Red values
indicate potential cause for concern.
Malcolm
Terrace
Chamin-
ade
Log
Cabin LREC LREC*
Over-
brook
Old
Warson
Mc-
Knight
Water temperature
(OC) (range)
1-29 0.5-27 0.5-29 1-28 0-28 1-27 0-27 0.5-28
pH (range) 6.3-8.9 6.3-8.2 6.4-8.6 6.6-8.5 6.6-8.5 6.6-8.3 6.6-8.3 6.9-8.5
DO (mg/L) (range) 4-24 1-23 5-28 2-26 3-18 3-21 3-21
DO (% sat) (range) 69-186 11-166 54-346 17-236 25-169 22-209 27-222
Nitrate (mg/L) (max) 4.0 2.0 2.0 1.0 2.0 2.0 2.0
Chloride (mg/L)
(max, median)
2214,
162
3514,
161
2904,
100
2904,
92
3927,
172 911, 40
1116,
141
2029,
93
Conductivity (uS/cm)
(range)
490-
6200
280-
8600
440-
7300
410-
7600
410-
9000
360-
1780
370-
3600
460-
6300
Turbidity (NTU)
(max, median) 80, <10
350,
<10 70, <10 54, <10 38, <10
35,
<10 52, <10
* Includes fifteen additional winter samples collected at LREC in January and February of 2010 and 2011 by staff
in order to better determine the extent of chloride pollution caused by salting of roads.
Biological Sampling:
Since 2005, sampling for benthic macroinvertebrates has been conducted at the LREC site in the “mulch
pile woods” as well as a second location further upstream at the “horse trail.” Invertebrates were
collected in flowing water using a kick net and in pooled conditions using a D-frame net. On each
sampling date, three net sets were collected and all invertebrates found were identified.
The results of the three net sets were compiled to determine the water quality score; an invertebrate score
of <12 is poor, 12-17 is fair, 18-23 is good, and >23 is excellent. Summary results may be viewed in
Table 3.
Benthic macroinvertebrates found at both LREC locations during at least one sampling event since 2005
fall into the following categories mayfly, riffle beetle, other beetle, crayfish, dragonfly, damselfly, scud,
sowbug, aquatic worm, blackfly, leech, midge, and pouch snail. Caddisflies were only collected at the
mulch pile woods site. Gilled snail and crane fly were recorded only at the horse trail site.
In addition to seasonal sampling of macroinvertebrates, the presence and absence of fish was noted,
beginning in March of 2009. While live fish were rarely seen in Deer Creek and its tributaries between
October and April, schools of 50 fish or more are seen regularly at all seven sites in June through
September.
Habitat Measurements:
The standard Missouri Stream Team Visual Stream Survey Data Sheet was filled out on February 24,
2011, at each of the sever water chemistry sites. Results of the survey are summarized in Table 4.
The land uses in the floodplains of each site are variable, but do not include any commercial or industrial
developments. All except the LREC site have at least a 50% residential component. The riparian zones
of all seven sites include trees, grasses and forbs, and bare ground. None of the sites had buildings in the
riparian zone and only three of the seven sites had pavement (limited to 10% of the riparian zone).
5
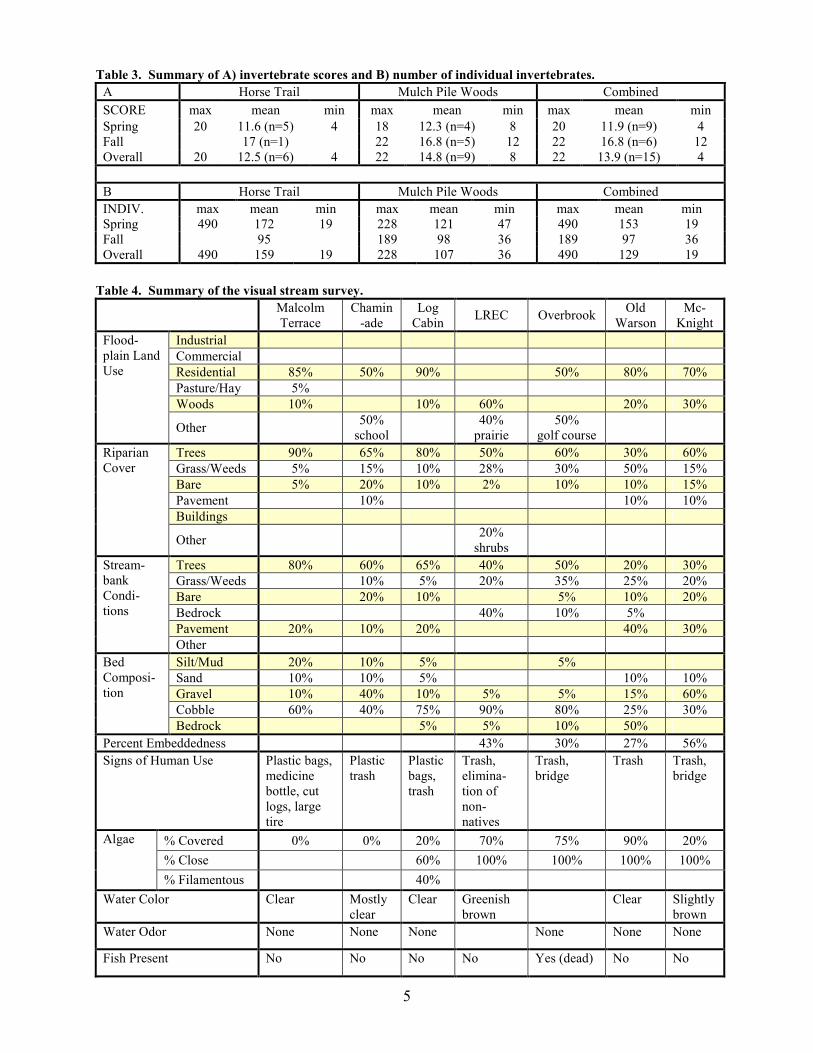
Table 3. Summary of A) invertebrate scores and B) number of individual invertebrates.
A Horse Trail Mulch Pile Woods Combined
SCORE max mean min max mean min max mean min
Spring 20 11.6 (n=5) 4 18 12.3 (n=4) 8 20 11.9 (n=9) 4
Fall 17 (n=1) 22 16.8 (n=5) 12 22 16.8 (n=6) 12
Overall 20 12.5 (n=6) 4 22 14.8 (n=9) 8 22 13.9 (n=15) 4
B Horse Trail Mulch Pile Woods Combined
INDIV. max mean min max mean min max mean min
Spring 490 172 19 228 121 47 490 153 19
Fall 95 189 98 36 189 97 36
Overall 490 159 19 228 107 36 490 129 19
Table 4. Summary of the visual stream survey.
Malcolm
Terrace
Chamin
-ade
Log
Cabin LREC Overbrook
Old
Warson
Mc-
Knight
Industrial
Commercial
Residential 85% 50% 90% 50% 80% 70%
Pasture/Hay 5%
Woods 10% 10% 60% 20% 30%
Flood-
plain Land
Use
Other 50%
school
40%
prairie
50%
golf course
Trees 90% 65% 80% 50% 60% 30% 60%
Grass/Weeds 5% 15% 10% 28% 30% 50% 15%
Bare 5% 20% 10% 2% 10% 10% 15%
Pavement 10% 10% 10%
Buildings
Riparian
Cover
Other 20%
shrubs
Trees 80% 60% 65% 40% 50% 20% 30%
Grass/Weeds 10% 5% 20% 35% 25% 20%
Bare 20% 10% 5% 10% 20%
Bedrock 40% 10% 5%
Pavement 20% 10% 20% 40% 30%
Stream-
bank
Condi-
tions
Other
Silt/Mud 20% 10% 5% 5%
Sand 10% 10% 5% 10% 10%
Gravel 10% 40% 10% 5% 5% 15% 60%
Cobble 60% 40% 75% 90% 80% 25% 30%
Bed
Composi-
tion
Bedrock 5% 5% 10% 50%
Percent Embeddedness 43% 30% 27% 56%
Signs of Human Use Plastic bags,
medicine
bottle, cut
logs, large
tire
Plastic
trash
Plastic
bags,
trash
Trash,
elimina-
tion of
non-
natives
Trash,
bridge
Trash Trash,
bridge
% Covered 0% 0% 20% 70% 75% 90% 20%
% Close 60% 100% 100% 100% 100%
Algae
% Filamentous 40%
Water Color Clear Mostly
clear
Clear Greenish
brown
Clear Slightly
brown
Water Odor None None None None None None
Fish Present No No No No Yes (dead) No No
6
At least 70% of the stream bed at each site is made of gravel or cobble, with the exception of the Old
Warson site which is dominated by bedrock. Algal growth was minimal at sites upstream of LREC,
though it was abundant at the sites along both Two-Mile Creek (Overbrook) and Sebago Creek (Old
Warson). No odors were detected and no live fish were seen.
Analysis and Discussion
pH:
Measurements of pH in the Deer Creek watershed were mostly within normal parameters; levels above
9.0 or below 6.5 are outside the range allowed by the State of Missouri (CSR, 2007). The three sites
upstream of LREC had pH levels periodically below 6.5. These levels were not associated with any
particular season. However, comments made by the team members when four of the six samples of low
pH were taken include mention of the unusually large amount of leaves or other organic material that was
present.
The decomposition of organic matter and respiration by plants, animals and bacteria can result in the
creation of CO2 which contributes to the acidity of water (Hem, 1985). Such decomposition and
respiration can also be indicated by low concentrations of dissolved oxygen which is consumed to create
the CO2. Low concentrations of oxygen were also found on four of the six occasions.
Based on research by Robertson-Bryan, Inc. (2004), the level of variability and range of values found in
Deer Creek seem unlikely to have a substantial health effect on the organisms founding the stream
system. However, there may be behavioral or breeding consequences, depending on how rapidly the pH
is changing.
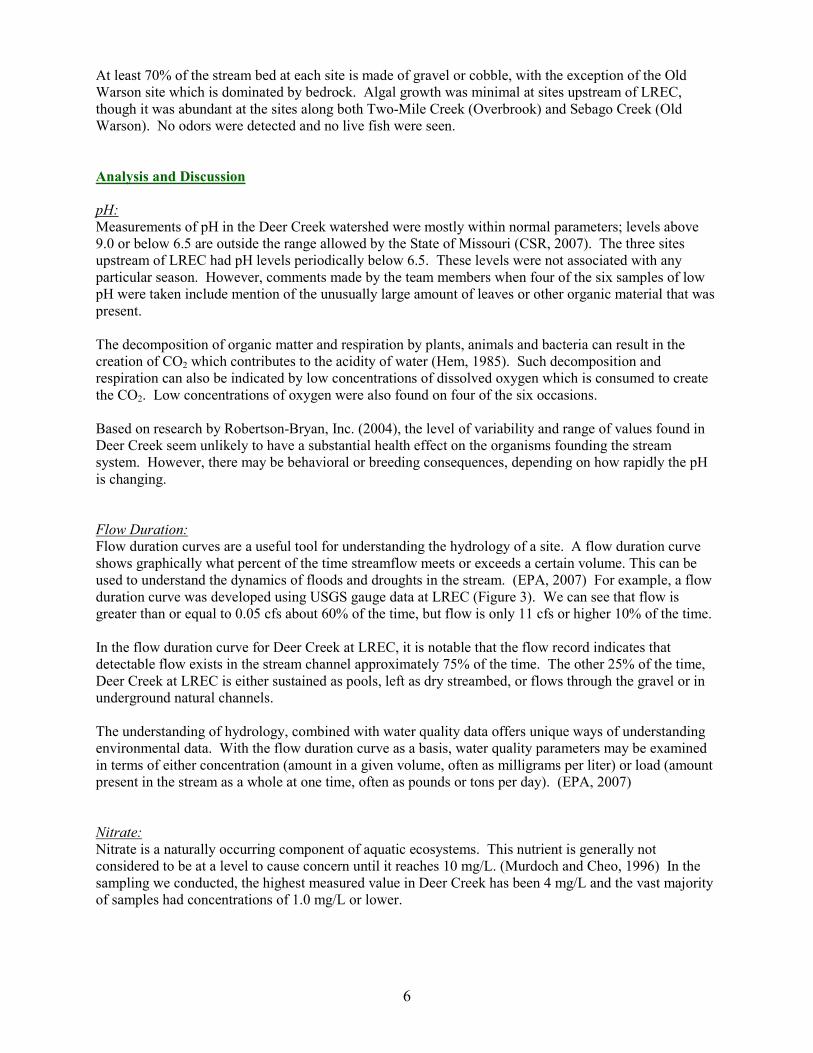
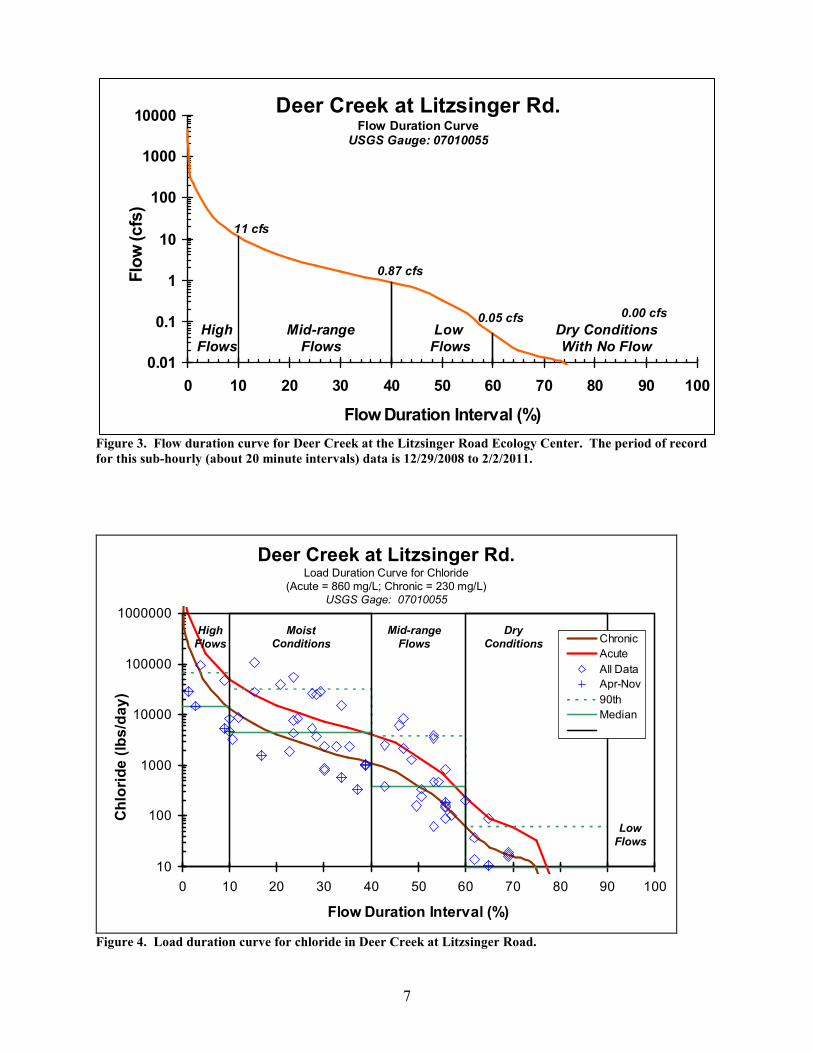
Flow Duration:
Flow duration curves are a useful tool for understanding the hydrology of a site. A flow duration curve
shows graphically what percent of the time streamflow meets or exceeds a certain volume. This can be
used to understand the dynamics of floods and droughts in the stream. (EPA, 2007) For example, a flow
duration curve was developed using USGS gauge data at LREC (Figure 3). We can see that flow is
greater than or equal to 0.05 cfs about 60% of the time, but flow is only 11 cfs or higher 10% of the time.
In the flow duration curve for Deer Creek at LREC, it is notable that the flow record indicates that
detectable flow exists in the stream channel approximately 75% of the time. The other 25% of the time,
Deer Creek at LREC is either sustained as pools, left as dry streambed, or flows through the gravel or in
underground natural channels.
The understanding of hydrology, combined with water quality data offers unique ways of understanding
environmental data. With the flow duration curve as a basis, water quality parameters may be examined
in terms of either concentration (amount in a given volume, often as milligrams per liter) or load (amount
present in the stream as a whole at one time, often as pounds or tons per day). (EPA, 2007)
Nitrate:
Nitrate is a naturally occurring component of aquatic ecosystems. This nutrient is generally not
considered to be at a level to cause concern until it reaches 10 mg/L. (Murdoch and Cheo, 1996) In the
sampling we conducted, the highest measured value in Deer Creek has been 4 mg/L and the vast majority
of samples had concentrations of 1.0 mg/L or lower.
7
Figure 3. Flow duration curve for Deer Creek at the Litzsinger Road Ecology Center. The period of record
for this sub-hourly (about 20 minute intervals) data is 12/29/2008 to 2/2/2011.
10
100
1000
10000
100000
1000000
0 10 20 30 40 50 60 70 80 90 100
Flow Duration Interval (%)
Chloride (lbs/day)
Chronic
Acute
All Data
Apr-Nov
90th
Median
Deer Creek at Litzsinger Rd.Load Duration Curve for Chloride
(Acute = 860 mg/L; Chronic = 230 mg/L)
USGS Gage: 07010055
DryConditions
Low
Flows
HighFlows
Mid-rangeFlows
MoistConditions
Figure 4. Load duration curve for chloride in Deer Creek at Litzsinger Road.
0.01
0.1
1
10
100
1000
10000
0 10 20 30 40 50 60 70 80 90 100
Flow Duration Interval (%)
Flow (cfs)
Deer Creek at Litzsinger Rd. Flow Duration CurveUSGS Gauge: 07010055
Dry Conditions
With No Flow
Mid-range
Flows
High
Flows
Low
Flows
0.87 cfs
0.00 cfs
11 cfs
0.05 cfs
8
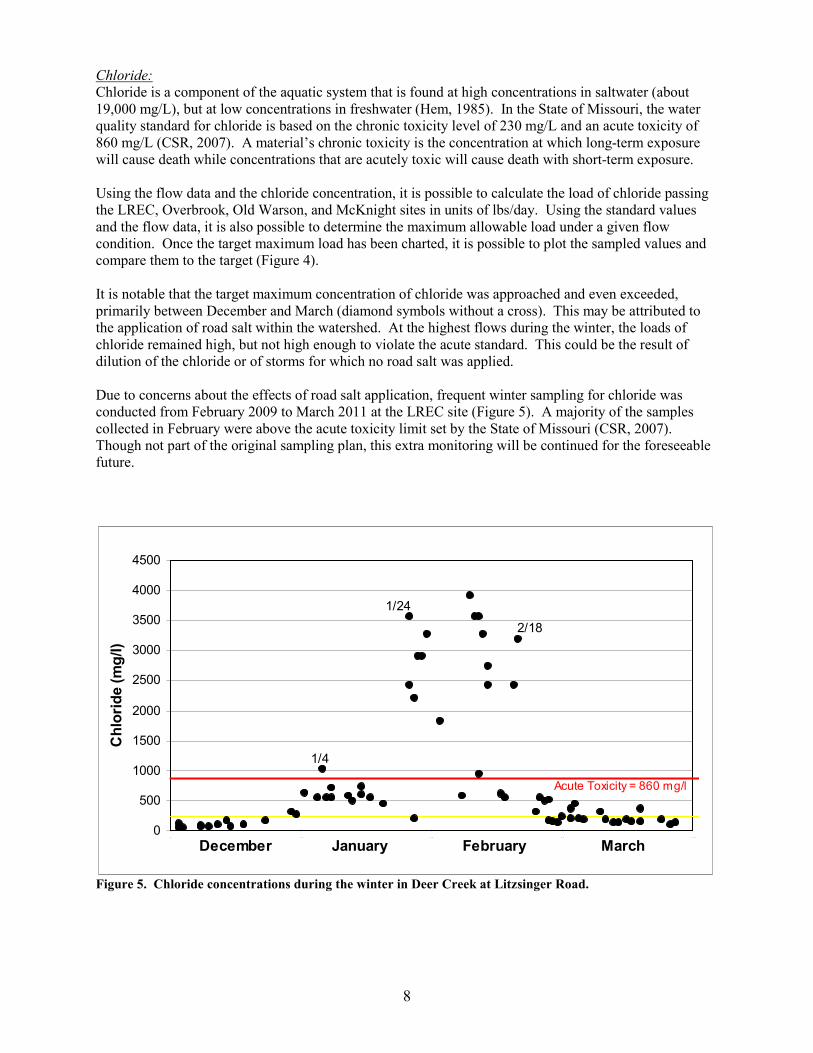
Chloride:
Chloride is a component of the aquatic system that is found at high concentrations in saltwater (about
19,000 mg/L), but at low concentrations in freshwater (Hem, 1985). In the State of Missouri, the water
quality standard for chloride is based on the chronic toxicity level of 230 mg/L and an acute toxicity of
860 mg/L (CSR, 2007). A material’s chronic toxicity is the concentration at which long-term exposure
will cause death while concentrations that are acutely toxic will cause death with short-term exposure.
Using the flow data and the chloride concentration, it is possible to calculate the load of chloride passing
the LREC, Overbrook, Old Warson, and McKnight sites in units of lbs/day. Using the standard values
and the flow data, it is also possible to determine the maximum allowable load under a given flow
condition. Once the target maximum load has been charted, it is possible to plot the sampled values and
compare them to the target (Figure 4).
It is notable that the target maximum concentration of chloride was approached and even exceeded,
primarily between December and March (diamond symbols without a cross). This may be attributed to
the application of road salt within the watershed. At the highest flows during the winter, the loads of
chloride remained high, but not high enough to violate the acute standard. This could be the result of
dilution of the chloride or of storms for which no road salt was applied.
Due to concerns about the effects of road salt application, frequent winter sampling for chloride was
conducted from February 2009 to March 2011 at the LREC site (Figure 5). A majority of the samples
collected in February were above the acute toxicity limit set by the State of Missouri (CSR, 2007).
Though not part of the original sampling plan, this extra monitoring will be continued for the foreseeable
future.
Figure 5. Chloride concentrations during the winter in Deer Creek at Litzsinger Road.
1/4
2/18
1/24
0
500
1000
1500
2000
2500
3000
3500
4000
4500
0 3 0 6 0 9 0 1 2 0
Chloride (mg/l)
December January February March
Acute Toxicity = 860 mg/l
9
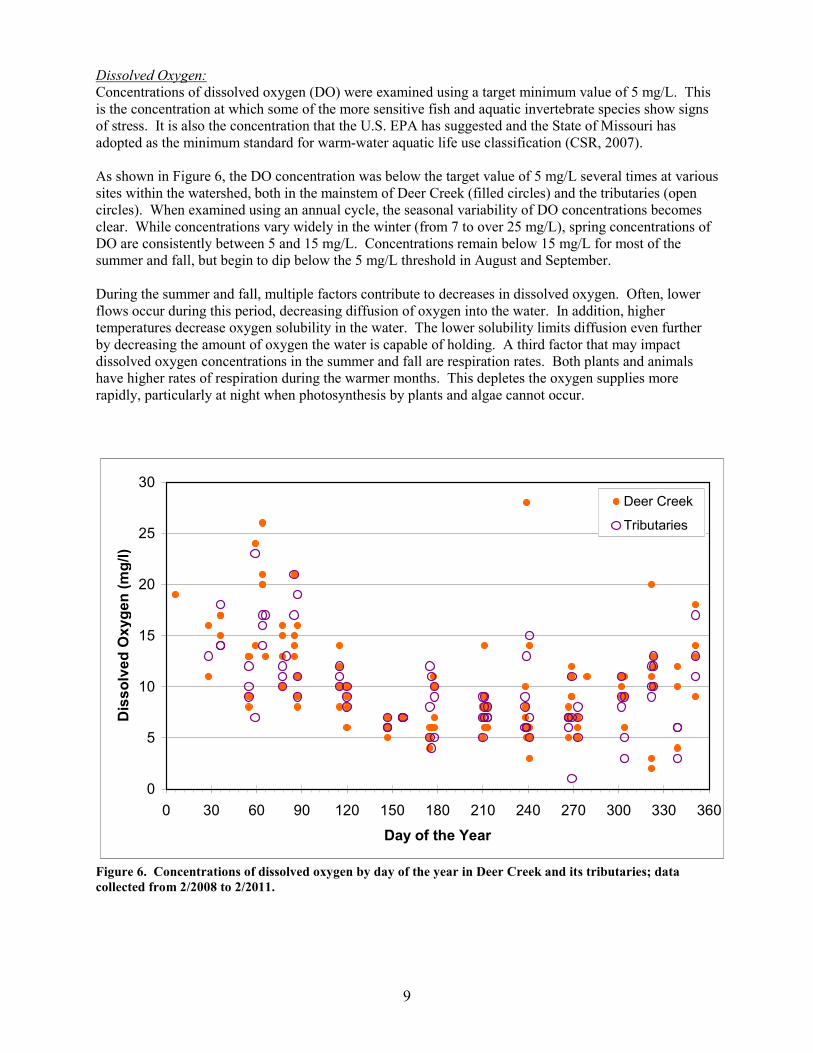
Dissolved Oxygen:
Concentrations of dissolved oxygen (DO) were examined using a target minimum value of 5 mg/L. This
is the concentration at which some of the more sensitive fish and aquatic invertebrate species show signs
of stress. It is also the concentration that the U.S. EPA has suggested and the State of Missouri has
adopted as the minimum standard for warm-water aquatic life use classification (CSR, 2007).
As shown in Figure 6, the DO concentration was below the target value of 5 mg/L several times at various
sites within the watershed, both in the mainstem of Deer Creek (filled circles) and the tributaries (open
circles). When examined using an annual cycle, the seasonal variability of DO concentrations becomes
clear. While concentrations vary widely in the winter (from 7 to over 25 mg/L), spring concentrations of
DO are consistently between 5 and 15 mg/L. Concentrations remain below 15 mg/L for most of the
summer and fall, but begin to dip below the 5 mg/L threshold in August and September.
During the summer and fall, multiple factors contribute to decreases in dissolved oxygen. Often, lower
flows occur during this period, decreasing diffusion of oxygen into the water. In addition, higher
temperatures decrease oxygen solubility in the water. The lower solubility limits diffusion even further
by decreasing the amount of oxygen the water is capable of holding. A third factor that may impact
dissolved oxygen concentrations in the summer and fall are respiration rates. Both plants and animals
have higher rates of respiration during the warmer months. This depletes the oxygen supplies more
rapidly, particularly at night when photosynthesis by plants and algae cannot occur.
0
5
10
15
20
25
30
0 30 60 90 120 150 180 210 240 270 300 330 360
Day of the Year
Dissolved Oxygen (mg/l)
Deer Creek
Tributaries
Figure 6. Concentrations of dissolved oxygen by day of the year in Deer Creek and its tributaries; data
collected from 2/2008 to 2/2011.
10
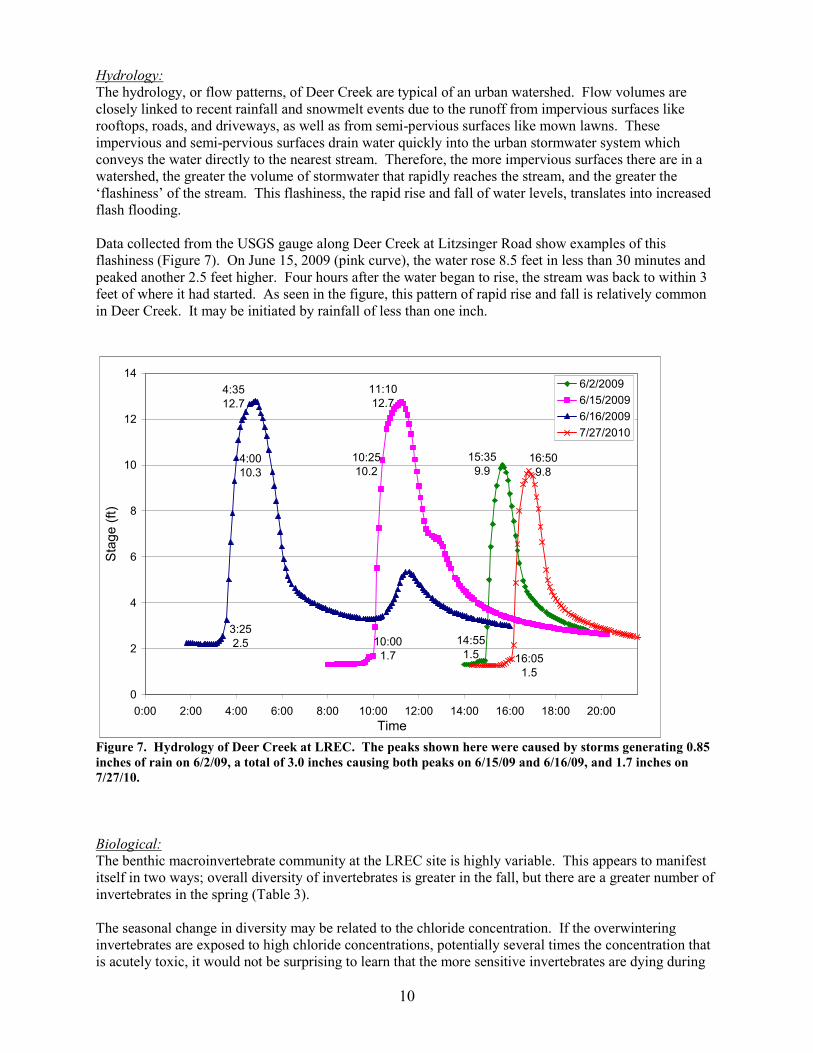
Hydrology:
The hydrology, or flow patterns, of Deer Creek are typical of an urban watershed. Flow volumes are
closely linked to recent rainfall and snowmelt events due to the runoff from impervious surfaces like
rooftops, roads, and driveways, as well as from semi-pervious surfaces like mown lawns. These
impervious and semi-pervious surfaces drain water quickly into the urban stormwater system which
conveys the water directly to the nearest stream. Therefore, the more impervious surfaces there are in a
watershed, the greater the volume of stormwater that rapidly reaches the stream, and the greater the
‘flashiness’ of the stream. This flashiness, the rapid rise and fall of water levels, translates into increased
flash flooding.
Data collected from the USGS gauge along Deer Creek at Litzsinger Road show examples of this
flashiness (Figure 7). On June 15, 2009 (pink curve), the water rose 8.5 feet in less than 30 minutes and
peaked another 2.5 feet higher. Four hours after the water began to rise, the stream was back to within 3
feet of where it had started. As seen in the figure, this pattern of rapid rise and fall is relatively common
in Deer Creek. It may be initiated by rainfall of less than one inch.
14:55
1.5
15:35
9.9
10:25
10.2
10:00
1.7
11:10
12.7
3:25
2.5
4:00
10.3
4:35
12.7
16:50
9.8
16:05
1.5
0
2
4
6
8
10
12
14
0:00 2:00 4:00 6:00 8:00 10:00 12:00 14:00 16:00 18:00 20:00
Time
Stage (ft)
6/2/2009
6/15/2009
6/16/2009
7/27/2010
Figure 7. Hydrology of Deer Creek at LREC. The peaks shown here were caused by storms generating 0.85
inches of rain on 6/2/09, a total of 3.0 inches causing both peaks on 6/15/09 and 6/16/09, and 1.7 inches on
7/27/10.
Biological:
The benthic macroinvertebrate community at the LREC site is highly variable. This appears to manifest
itself in two ways; overall diversity of invertebrates is greater in the fall, but there are a greater number of
invertebrates in the spring (Table 3).
The seasonal change in diversity may be related to the chloride concentration. If the overwintering
invertebrates are exposed to high chloride concentrations, potentially several times the concentration that
is acutely toxic, it would not be surprising to learn that the more sensitive invertebrates are dying during
11
the winter. Over the course of the spring and summer, adult invertebrates may emerge from nearby
streams that have not been so heavily impacted by chloride and leave their offspring in Deer Creek.
These offspring may be the organisms that are found in the fall that were not present in the spring.
Overall, samples collected at the mulch pile woods site tended to have slightly higher scores than those
collected at the horse trail site, though the minimum score at each is in the poor range (<12) while the
maximum score is in the good range (18-23). The differences between the two sites may be due in part to
the seasonality of the sampling; only one fall collection was made at the horse trail site.
Within the mulch pile woods data, there appears to be a seasonal trend. The maximum spring score is an
18, at the bottom of the good range, with a minimum score of 8. Meanwhile the minimum fall score is 12
with a maximum of 22; in both cases this is a difference of 4 which requires the collection of at least two
additional species. This supports the link between invertebrate diversity and the potential for chloride
impacts.
Despite the low invertebrate score at the mulch pile woods site in spring, there are certainly a larger
number of invertebrates captured in the spring than in the fall (mostly scuds, sowbugs, and midges).
Likewise, at the horse trail site, spring fauna was dominated by scuds, midges, and aquatic worms.
However, this abundance is not necessarily a good thing and, in fact, somewhat supports the belief that
chloride is having an impact on Deer Creek. Midges and aquatic worms are among the aquatic organisms
that are most tolerant of pollution (Murdoch and Cheo, 1996). Scuds are known to be tolerant of
exposure to chloride concentrations of 5,000 mg/L for at least 4 days (Blasius and Merritt, 2002)
The chloride concentrations may also be effecting the fish population; the distinct lack of fish in winter
and into spring points in this direction. However, the fish population begins to disappear in October,
before salt operations begin for the winter and before chloride concentrations peak. This indicates that
there is another force at work, either completely independently or in conjunction with the later increase in
chloride concentration. It is possible in some instances, particularly when temperatures drop and fish
seek refuge in the deeper pools, that the water may be too cloudy or turbid to see the fish.
Habitat:
The riparian habitats within the Deer Creek watershed are somewhat variable. While there are no
industrial or commercial developments at any of the sites, there is substantial residential development in
the area. While all seven sites included a bare ground component, it should be noted that this information
was collected during February. It is likely that the bare ground coverage would decrease in spring and
summer as annual vegetation begins to grow.
The in-stream character of Deer Creek changes substantially as you move downstream. The amounts of
silt, mud, and sand forming the stream bed drop while cobble and bedrock increase. The percent of the
stream bank and riparian zone that are wooded also tend to decrease in downstream areas while algal
coverage tends to increase.
Complications
Monitoring in Deer Creek has been complicated by a number of factors. On several occasions, weather
has impacted the ability of the LREC Stream Team to complete sampling. For example, an incomplete
data set was collected in January 2010 when temperatures were so cold that volunteers were beginning to
experience moderate frost bite. In addition, on some occasions, severe weather (either strong storms or
extreme temperatures) during the designated sampling time caused the delay or cancellation of scheduled
sampling.
12
Summary
The physical and chemical data and the biological samples that have been collected show a variety of
urban influences on the system.
• The pH at sites in this study is highly variable and, in the upper parts of the watershed, at times is
below the range considered acceptable for Missouri streams.
• Flow peaks at over 1,000 cubic feet per second; however, there is no detectible, above surface
flow in Deer Creek at LREC approximately 25% of the time.
• High concentrations of chloride and associated high conductivity during the winter are indicative
of the heavy use of road salt during winter storms. Peak concentrations were over 3,500 – more
than four times the amount that is considered toxic to aquatic life.
• Dissolved oxygen concentrations reach unhealthy extremes, dropping below 5 mg/L and reaching
over 25 mg/L.
• The flashiness of Deer Creek is not unexpected for an urban stream, but considering the low
density of development in the upstream reaches, it is somewhat severe.
• The biological diversity in Deer Creek at LREC is relatively good, particularly considering the
chemical conditions in the water during the winter.
• The habitat along the locations sampled is relatively good. Most of the riparian areas and
streambanks are wooded which will slow erosion.
Data has been and will continue to be analyzed regularly. Any major changes in Deer Creek or its
tributaries during the grant period will be reported immediately to the Missouri Botanical Garden’s grant
coordinator, the Missouri Stream Team, and any other appropriate entities.
Acknowledgements
This report would not be possible without the dedication of the LREC Stream Team volunteers and the
participation other members of the LREC staff, both past and present:
Volunteers Staff
Dale Albers
Pauline Ashton
Larry Berglund
Marypat Ehlmann
Susan Lammert
Julie Nicolai
Ron Nimer
Sharon Pederson
Denise Perry
Ray Potter
Lane Richter
Sue Schoening
Theodore Smith
Jennifer Brown
Abigail Carroll
Sean Fears
Jessica King
Deanna Lawlor
Emily Lopez
Malinda Slagle
Anne Wamser
13
References
Blasius, B.J. and Merritt, R.W. 2002. Field and laboratory investigations on the effects of road salt
(NaCl) on stream macroinvertebrate communities. Environmental Pollution 120, 219-31.
CARES (Center for Agricultural, Resource and Environmental Systems). 2008. Watershed evaluation
and comparison tool.
http://ims.missouri.edu/watershedprofile/liststreams.jsp?HUC=07140101 (accessed on January
23, 2008)
CSR (Code of State Regulations). 2007. Water quality standards for the State of Missouri. Code of State
Regulations, Title 10, Division 20, Chapter 7.
Hem, John D. 1985. Study and interpretation of the chemical characteristics of natural water, 3rd Ed.
USGS Water Supply Paper 2254.
Murdoch, Tom and Cheo, Martha. 1996. The Streamkeeper’s Field Guide. Adopt-A-Stream
Foundation; Everett, WA.
Novotny, Vladimir; Smith, Daniel; Kuemmel, David; Mastriano, Joseph; and Bartosova, Alena. 1999.
Urban and highway snowmelt: minimizing the impact on receiving water. Project 94-IRM-2.
Water Environment Research Foundation; Alexandria, VA.
Robertson-Bryan, Inc. 2004. PH requirements of freshwater aquatic life: a technical memorandum.
Robertson-Bryan, Inc.; Elk Grove, CA.
U.S. EPA. 2007. An approach for using load duration curves in the development of TMDLs. Office of
Wetlands, Oceans, and Watersheds: Watershed Branch; EPA 841-B-07-006.
14
Appendix 1: USGS Gauge Data
USGS data available:
McKnight: Deer Creek at N. Rock Hill Road in Ladue
http://waterdata.usgs.gov/nwis/nwisman/?site_no=07010075&agency_cd=USGS
This real-time gauge site has daily data from May 31, 2001 to the present. The data includes discharge in
cubic feet per second. In addition, water quality samples have been collected on several occasions for a
wide variety of organic and inorganic parameters.
LREC: Deer Creek at Litzsinger Road in Ladue
http://waterdata.usgs.gov/nwis/nwisman/?site_no=07010055&agency_cd=USGS
This real-time gauge site has daily data from June 6, 2001 to the present. The data includes discharge in
cubic feet per second. The gauge was taken off-line in late September 2007 during bridge repairs and was
re-started in January 2008; daily flow during this period has been estimated by the USGS.
Overbrook: Two Mile Creek at Overbrook Drive in Ladue
http://waterdata.usgs.gov/nwis/nwisman/?site_no=07010061&agency_cd=USGS
This real-time gauge site has daily data from May 31, 2002 to the present. The data includes discharge in
cubic feet per second.
Old Warson: Sebago Creek at Old Warson Road near Rock Hill
http://waterdata.usgs.gov/nwis/nwisman/?site_no=07010070&agency_cd=USGS
This real-time gauge site has daily data from July 26, 2001 to the present. The data includes discharge in
cubic feet per second.


