78
WATER QUALITY IN THE AMUDARYA AND SYRDARYA RIVER BASINS Analytical Report

WATER QUALITY
IN THE AMUDARYA
AND SYRDARYA RIVER BASINS
Analytical Report

Scientific-Information Center Interstate Commission for Water Coordination
in Central Asia (SIC ICWC)
United Nations Economic Commission for Europe (UNECE)
Central Asian Regional Environmental Center (CAREC)
WATER QUALITY IN THE AMUDARYA AND
SYRDARYA RIVER BASINS
Analytical Report
Tashkent 2011
Water Quality in the Amudarya and Syrdarya River Basins 2
Prepared by:
Gapparov B.Kh. – report drafting Beglov I.F., PhD – report drafting Nazariy A.M. – preparing materials for the report Usmanova O.K. - translation
Given publication was issued with the support of UNECE.
The content of this publication is under responsibility of experts and does not imply the expression of any opinion whatsoever on the part of the UN Economic
Commission for Europe.

Analytical Report 3
CONTENTS
Introduction................................................................................................................. 4
Problems of water resource quality ............................................................................ 5
Problems of Water Resource Quality in the Amudarya River Basin ........................... 9
Problems of Water Resource Quality in the Syrdarya River Basin ........................... 25
Information on water quality available on the CAWater-Info portal ........................... 44
Knowledge Base ................................................................................................... 44
E-Library............................................................................................................ 44
Knowledge Base «Water and Land Resources Use in the Aral Sea Basin» ..... 48
Database............................................................................................................... 49
Analytical tools .................................................................................................. 49
Database on the Amudarya river basin ............................................................. 51
Database on the Syrdarya river basin ............................................................... 51
Database on the Aral Sea ................................................................................. 51
Database «Indicators of sustainable development for the Central Asian countries».......................................................................................................... 52
Annex ....................................................................................................................... 53
Environmental indicators....................................................................................... 71
Kazakhstan – Water resources ......................................................................... 71
Kyrgyzstan – Water resources .......................................................................... 72
Tajikistan – Water resources ............................................................................. 73
Turkmenistan – Water resources ...................................................................... 75
Uzbekistan – Water resources .......................................................................... 76

Water Quality in the Amudarya and Syrdarya River Basins 4
Introduction Central Asia is one of the ancient regions from where irrigated farming originates. Irrigated farming was practiced in the Aral Sea basin as far back as four thousand years before Christ. The local population had used the spring areas, deltas and floodplains of small and medium rivers and mountainous small rivers for their farming since these territories did not need complex structures and long large canals for diversion of water. The total irrigated area has been more than 3 Mha by the early 20th century. Development of land in the Aral Sea basin initiated by the Tsarist Russian Empire in the late 19th century has gained in scope since establishment of soviet power in Central Asia. Before 1913, the total irrigated area has been 3250 thousand ha, whereas it amounted to 4.3 Mha in 1940 and 5 Mha in 1960. This area was comprised of both fallow land in old irrigated areas of oases and new irrigated desert areas, such as the Golodnaya and Dalverzin Steppes, the Ferghana, Vakhsh, and Chu Valleys, as well as the South Kazakhstan and Turkmenistan. Moreover, irrigation was developed in large geomorphologic and hydrogeological formations characterized by complex and very complex natural-climatic conditions: river valleys, intermountain troughs, lower and upper river terraces, talus trains, and deltas of large rivers. Irrigation of such lands required that big and complex challenges related to water-resources development and land reclamation be addressed, such as regulation of river flow by reservoirs and intake structures; construction of high-capacity and long main inter-farm canals, drainage systems and their structures. Intensive development of irrigated farming and land drainage in Central Asia along with growing water use for industrial and household needs resulted in increased abstraction of fresh water and discharges of polluted return flow into water bodies. The main pollution sources are agrochemicals that are washed out into drainage systems and mixed with river water. The second-ranking source in terms of impact on the quality of water resources is the effluent from municipal and industrial sewers. An increased contamination of groundwater due to substandard management of municipal and industrial waste sites, especially in the mining industry is noted also.
River quality statistics for the past 40 years confirm trends of an increased salinity, both over time and along the length of the rivers affected. The possibility of using water for irrigation depends not only on the salinity but also on the chemical content. Thus, a consistent trend has developed for changes in the ionic composition of salts in the water toward a dangerous increase in alkalinity. Until now, due to a high content of gypsum in soils and CaSO4 in water, the alkalinity (SAR) has remained below the maximum allowable level, yet soil reserves of gypsum are expected to diminish, leading to leaching and increasing concentrations of sodium carbonate.
The increasing salinity of water in rivers and the intensity of drainage from irrigated land substantially affect the dynamics of salinization and increase the need for reclamation of irrigated areas.

Analytical Report 5
The above-mentioned indicates to the significance of water quality control.
Given report summarizes information on water quality in the Amudarya and Syrdarya basins, which is available on the Internet, and serves as a certain indicator of accessibility and completeness of such information. While drawing up this report, we were not aiming at verifying whether used quantitative indicators were adequate or not. Therefore, these indicators are presented in initial form as in their sources.
Information on water quality data that are available on the portal of knowledge on water resources and environment in Central Asia - CAWater-Info - is given as well. The authors express hope that dissemination of given report would contribute to improved system aiming to ensure good water quality and strengthened cooperation in this field in Central Asia.
Problems of water resource quality1 Intensive development of irrigation and land drainage in the Aral Sea basin had two major consequences that affected the river water – an increased abstraction of fresh water and discharges of polluted return flow, with toxic salts being the main pollutants. As a result, the river water quality has deteriorated due to discharges of saline and polluted drainage water and agrochemicals that were washed out into drainage systems and mixed with river water. Besides this non-point agricultural pollution by toxic salts and agrochemicals, there are point pollution sources of industrial and municipal sewage, especially from metropolitan area.
The water resource quality in the Aral Sea basin is affected by intensive abstractions from water sources, on the one hand, and by discharges into water bodies and waterways of under-purified sewage water from plants, municipal sector, etc. or untreated waste water from agriculture.
The Amudarya is the largest river in the basin. During the relatively natural regime of river’s existence, its water fell under the hydrocarbonate category, with salinity of 0.3-0.5 g/dm3. With growing anthropogenic load and increasing diversions from the river and discharges of untreated drainage water, the water quality in the river has deteriorated. This process was more intensive in the mid 70s and the early 80s. Increased river water content in the early 90s made the process slower and even led 1 Source: (1) Central Asia Environmental Review / Tajik Youth EcoCenter - www.tabiat.narod.ru (2) The Uzbek National Coordination Center, Clearing House Mechanism of the Convention on Biodiversity - www.cbd.uz (3) Knowledge Base «Water and Land Resources Use in the Aral Sea Basin» - www.cawater-info.net/bk/water_land_resources_use/

Water Quality in the Amudarya and Syrdarya River Basins 6
to downward trends in terms of salinity and pollution of both river and drainage waters. The key main collector-drains in the middle reaches were constructed in the 60s-70s. At the initial stage of the development of saline land, the salinity of drainage water was 6-10 g/dm3. Because of leaching irrigation, the salinity decreased and currently is stabilized within 3-6 g/dm3. Water quality in the flow formation zone of the Amudarya practically does not change, showing only small fluctuations due to variation of flow probability. As a result of discharge of drainage water into the Amudarya, the water salinity varies within 0.4-1.7 g/dm3 in the middle and lower reaches; whereas, the mean annual salinity is 0.8-1.1 g/dm3. In dry years, salinity may reach up to 2 g/dm3 in the estuary, with dominating recharge from groundwater. The chemical composition of water in the main river of the Amudarya basin is determined by agricultural wastewater flowing into the river from the Turkmen and Uzbek territories. In terms of the Water Pollution Index (WPI), the Amudarya water quality in the Termez control section remains unchanged under the II class (clean water) at the level of the year 2000, while water quality in other sections is of the III class (moderately polluted water) and II class as it was in 2001-2002. Part of flow in the Surkhandarya river is generated in Tajikistan. The chemical composition of the river water is formed by effluents from industrial and municipal sectors of Denou and Termez cities, Shirtchi urban village and by agricultural runoff. As to WPI, water quality in this river from its head to the mouth varies from the II class (clean water) to the III class (moderately polluted water). This corresponds to water quality of the year 1996. The Zaravshan river is most subjected to a transboundary impact. Mining and processing works are located in the river flow formation zone in Tajikistan and pollute the river water by toxic metals, antimony, and mercury. Antimony is found in groundwater (Pervomayskaya dam site) - 0.001-0.11 mg/l - and in Chupanata and other intakes - 0.001-0.008 mg/l (MAC – 0.05 mg/l). Antimony content diminishes downstream the river. Monitoring of specific components, such as antimony, mercury, cadmium, strontium, etc. has been conducted since 2002. As a result of implemented environmental measures and strengthened control over wastewater discharges, water quality was improved, and, in terms of the water pollution index, water in the sites bordering with Tajikistan and along the river channel (except for a section after the city of Samarkand) falls under the II class in 2004. The Syrdarya river basin comprises many rivers, the main of which are the Syrdarya, Naryn, Karadarya, Chirchik, and Akhangaran. In the flow transit zone, salinity in the Syrdarya river increases over time and in terms of the length of the river. The mean annual salinity of the Syrdarya in the section of Kal’ village virtually doubles as compared to that of the Naryn river. Further, toward Nadejda village, salinity increases additionally by 20%. Further downstream, salinity grows slower because of intrusion of less saline water from the Chirchik river basin.

Analytical Report 7
Water in the lower reaches of Syrdarya is treated now as moderately polluted one for most of the year. The last years’ hydrological and hydrochemical situation keeps changing. The shift in operation of a number of reservoirs to energy-generation regime has led to changes in hydrological conditions in the middle reaches of Syrdarya. The period of operation of reservoirs when they are full was extended, and winter water releases from the reservoirs were increased. The maximum flow rates in the middle reaches of Syrdarya started to occur in winter and spring instead of the growing season that was typical for natural conditions of the river. In the last years, maximum flow rates in winter well exceeded the summer ones and were comparable only in humid years. Earlier filling of reservoirs and higher inflow in winter months, as well as insufficient capacity of the Syrdarya channel in its lower reaches have resulted in recommencement of regular discharges into Arnasay. The changes in hydrological regime and water quality worsened the spawning conditions, reduced and depleted the fish species composition. The Syrdarya’s water even changed from moderately polluted category into polluted one in the inflow points of collector drains. The Chirchik river is the largest right-bank tributary in the middle reaches of Syrdarya. The river flows through the Uzbek territory downstream the Charvak reservoir. The river water is used for irrigation, industrial and urban water supply of Chirchik-Angren irrigation district (CHAKIR). Big cities (Tashkent, Chirchik, Angren) and mining, processing, and chemical plants are located in this district. As a result of overregulation of the river’s regime, the minimum flow rates in the middle and lower reaches occur in summer. The decreased flowage and water exchange during this period of time lead to intensive heating and primary production. After die-off of producers, the organic matters decay, thus causing secondary pollution. Water is considered as polluted one during this period of time. The development of water hyacinth and duckweed populations, i.e. typical dwellers in polluted and eutrophic waters, in the lower reaches of the Chirchik is an indication of those processes. Significant difference in water levels in the river was the cause of suppressed riverside hydrophilous vegetation. Fish resources in water bodies have depleted as well. The Karadarya river, one of the Syrdarya’s tributaries, has been bringing water of the III class quality (moderately polluted) to Uzbekistan’s area in the last 3 years. The effluents discharged from such Uzbek cities as Andizhan, Asaka, and Khanabad, as well as the discharges of drainage water do not make the river water worse. Small watercourses in the Fergana Valley have water quality of II class (clean water) within Uzbekistan and are used for irrigation. As to WPI, the water quality in all sections along the Syrdarya river refers to the III class. In 2001, in the section upstream of Bekabad city, water quality deteriorated

Water Quality in the Amudarya and Syrdarya River Basins 8
and changed from the II class of clean water to the III class of moderately polluted one. There is a risk of river pollution by toxic radioactive wastes through the Maily-Suu river, where uranium tailing pits and dumps are located in the territory bordering Kyrgyzstan. Water quality of the Syrdarya river within the boundaries of Kazakhstan is formed by pollutants coming into the river from the Uzbek territory. Within the site of Kokbulak village (boundary section), water contains nitrites and phenols, the mean annual values of which reach 4 MAC, iron and oil products up to 1 MAC. The nitrite content is higher than the norm in most analyzed samples; however, typically, high pollution levels in terms of this parameter are not observed. Instead, significant pollution by pesticides is recorded during the growing season. Downstream of Chardara reservoir, the pesticide content in water lowers significantly, while concentration of other pollutants is the same as in the upstream sections. The level of pollution by pesticides increases in the lower reaches and is highest in the area of current delta (Kazalinsk). Besides, higher concentrations of oil products, nitrite nitrogen and organic matters are recorded regularly in this river reach. According to water pollution index and saprobity, the Syrdarya river falls under the category of moderately polluted water bodies (III class water quality) along its whole length. As to the upper reaches of the Keles river, the basic water quality indicators are within the norm, except for nitrite nitrogen. Further to the river mouth, the water quality is significantly deteriorated - the contents of organic matters, phenols, and oil products regularly exceed the MAC. Since the Arys river is located in the area of irrigated farming and intensive animal breeding, its water quality is formed by surface runoff. Some samples show excess over MAC for concentrations of organic matters, phenols, and oil products. For the Badam river, slightly higher concentrations (against MAC) of organic matters and nitrites are observed in the baseline section of Mikhaylovka village. In the area of Chimkent city, the mean annual concentrations of copper and nitrites reach 4 MAC; sometimes zinc and nitrite contents are above the norm. The mean annual concentrations of nitrite, phosphate, and total phosphorus are observed in the river mouth (the section of Obrutchevka village). The water quality refers to the III class of moderately polluted water. Up to 20 billion m3 of collector-drainage water (CDW) is formed annually in the region. Moreover, 50% of this flow is discharged mainly into a desert depression. Such discharges of CDW damage the environment, since, besides higher salt concentrations, this water contains pesticides, defoliants, chemical fertilizers, and
Analytical Report 9
heavy metals. Most of drainage water returns back to rivers and irrigation sources, thus deteriorating the quality of river and irrigation waters. For example, water resources in the Amudarya river, mainly in the lower reaches, contain much salt (1.5-2.7 MAC), hazardous heavy metals, such as manganese (1.3-2.0 MAC), iron (1.5-3.3 MAC), lead (5-10 MAC), cadmium (6-8 MAC), harmful organics: synthetic surfactants (4-8 MAC), oil products (36-46 MAC), phenol (400-1000 MAC) and other toxic matters that cause serious damage to human.
Table 1 Water salinity in Central Asian rivers
Mean annual salinity, mg/l
River Upper reaches Tail
Amudarya 700 (Termez city) 1200
Surkhandarya 385 900
Kashkadarya 270 1600
Zaravshan 255 1500
Garagumdarya 700 900
Syrdarya 650 1400
Naryn 250 500
Karadarya 345 520
Akhangaran 140 660 1 Sources: (1) Central Asia Environmental Review / Tajik Youth EcoCenter - www.tabiat.narod.ru, processed by SIC ICWC
Problems of Water Resource Quality in the Amudarya River Basin2
An anthropogenic load was well heightened in the Amudarya basin over the last 25 years. The large-scale development of urban areas, industry, agriculture and the insufficient investing in the environment have led to the increased pollution of natural water resources throughout the basin. Light, food, textile, coal, iron, nonferrous, chemical and other industries are focused there. Industrial and municipal effluents, the parameters of which exceed the quality targets to a factor of ten, are finally discharged into surface and ground water bodies. The analysis of data on water use and disposal of industrial and municipal enterprises in the basin over 1988-1990 shows that the industry uses from 3.2 to 3.8
2 Sources: (1) Central Asia Environmental Review / Tajik Youth EcoCenter - www.tabiat.narod.ru (2) Report "Developing the scientific and technological basis for the improvement of integrated irrigation-energy regulation of water resources and hydraulic systems in the Syrdarya and Amudarya (under conditions of water shortage and increased highly saline return water), as well as the mathematical models, algorithms, and programs for optimal management of water resources and control of existing river and in-channel reservoirs for seasonal and long-period regulation in the Central Asian river basin "

Water Quality in the Amudarya and Syrdarya River Basins 10
km3 on average, while it discharges 70-80% of used water, of which about 10-15% of untreated wastewater is discharged into water bodies. The municipal sector uses about 1.0 km3 of water and discharges about 50% of used water, of which up to 30% is the untreated sewage. The agricultural water use varies from 0.5 to 0.6 km3, while wastewater discharge from the agriculture is about 45-50%, of which 50-60% is untreated one. The main pollutants in the wastewater are organic matters (BOD, COD), oil products, nitrogen compounds, synthetic surfactants, salinity, sulphates, chlorides, heavy metals, and phenols. Another sizable source of water pollution in the Amudarya basin is the collector-drainage water discharged both into tributaries and the Amudarya river itself. The volume of the discharged water is ten times higher than that of industrial and municipal sectors. Thus, currently the total water withdrawal from the Amudarya river is 61 km3, of which about 41 km3 are used for irrigation. Besides, 15-18% of this withdrawn water is returned back into the river, i.e. 9-11 km3/year. The Vakhsh oasis (Tajikistan) is the upper irrigation project in the Amudarya basin. Here, the mean annual salinity of CDW varies from 1.0 to 2.0 g/dm3; though in some periods of time, the sum of ions in water flowing in a number of collector drains with a rate of 1-2.6 m3/s amounts to 5 g/dm3 (Yavan district). There are about 20 collector drains in total in this project. The lands in the Pyandj river basin are less saline than in the Vakhsh river basin. Therefore, generally, CDW salinity is not high - 0.5-1.0 g/dm3. Only in the Vosa district CDW salinity was 2.0 g/dm3 in certain periods of time. In total, there are 20 large collector drains, the discharge of which is 2.0 m3/s. Irrigated areas in the Kafirnigan river basin are also low saline as in the Pyandj river basin. There are also 20 collector drains and spillways that divert CDW to the river. The mean annual salinity of CDW is 0.35 to 0.70 g/dm3. Water salinity reaches 0.7-0.9 g/dm3 in some of the collector drains. In terms of salinization, the irrigated areas in Sherabad and Surkhandarya basins are varied. This impacts the salinity of CDW. Thus, the CDW salinity is the lowest and varies from 0.2 to 0.7 g/dm3 in submountain zones, then ranges within 0.7-2.3 g/dm3 in the middles reaches of the rivers, and is from 2.3 to 8.7 g/dm3 in the lower reaches, amounting to 10 g/dm3 in some months. Currently, the basin comprises more than 70 collector drains, including 30 ones directly flowing into the Surkhandarya river. Chardjow, Tashauz, and Khorezm oases are located further downstream of the Amudarya river. Collector drains located in the first two oases have water salinity varying from 1.3 to 3.5 g/dm3, while their discharge is from 1.3 to 45 m3/s. The middle reaches of the Amudarya river accommodate the Karshi Steppe, the irrigated area of which is about 315 thousand ha. CDW are collected in the South

Analytical Report 11
main collector drain, its branches and first-order collector drains. The mean monthly salinity of CDW varies from 4.3 to 12 g/dm3 and amounts to 18 g/dm3 in some months. Irrigated lands in the Khorezm province are mainly highly and medium salinized. Existing collector drains flow towards the Sarykamysh depression (Ozerniy and Daryalyk collector drains). The mean annual salinity in inter-farm collector drains ranges from 2.9 to 18 g/dm3, while in inter-republican ones it ranges from 2.3 to 8.0 g/dm3. Irrigated lands in the Zaravshan river basin are non-salinized mainly, and CDW salinity is not higher than 1.9 g/dm3 in the most collector drains and amounts to 3.1 g/dm3 only in Pakhtachi district. The collector-drainage network is well developed in the Bukhara irrigation district. Collector drains and spillways discharge their water into natural depressions and Solyonoye Lake. Since 1973, after overfilling of the lake, CDW has been discharged into the Amudarya river via Parsankul spillway. CDW salinity is 2.5-4.5 g/dm3 in most collector drains and reaches maximum of 14.5 g/dm3 is some of the drains. Up to 2.0 km3 of CDW is formed in the lower reaches of the Amudarya river (Karakalpakstan). This water is discharged either into such recipients as Sudochie, Aychikul, and Khodjikul lakes, Aral Sea or into the Amudarya river directly. The mean annual salinity ranges from 2.8 to 5.7 g/dm3 in the main collector drains and is 1.1-9.5 g/dm3 in the collector drain K-12 (right bank). Thus, CDW discharged into the Amudarya river cause considerable changes in the river’s water-salt regime, especially in the middle and lower reaches. The hydrochemical conditions of the river’s tributaries forming water quality in the flow formation zone largely depend on hydrological regime. The upland reaches of such tributaries as the Vakhsh, Pyandj, and Kafirnigan rivers are located in this zone. The general dynamics of river water salinity in this zone depends inversely on the flow rates of these rivers.
Among the above-mentioned tributaries the Kafirnigan river shows better water quality. Except for turbidity, all indicators do not exceed MAC values along the whole length of the river. As to turbidity, it is higher than the norm (MAC is 1.5 mg/dm3 for drinking and household uses) in all water bodies in the Amudarya basin. Water in the Pyandj river contains more dissolved salts than water in the Kafirnigan river. Moreover, the content of dissolved salts increases from the upper to the lower reaches. For example, water salinity ranges from 0.2 to 0.4 g/dm3 in the upper reaches, while it varies within 0.3-0.8 g/dm3 in the lower reaches (Lower Pyandj section). The maximum salinity is observed in September-April. Water salinity is higher in the Vakhsh river as compared to the Pyandj river. Salinity ranges from 0.3 to 0.7 g/dm3 in the upper reaches (Komsomolabad village) and from 0.5 to 1.1 g/dm3 in the lower reaches (Tigrovaya balka).
Water Quality in the Amudarya and Syrdarya River Basins 12
The most polluted tributary of the Amudary is the Surkhandarya river. It is subjected to anthropogenic influence along the whole length, and this significantly affects on river’s hydrochemical regime and water quality. Thus, water salinity is not higher than 0.5-0.7 g/dm3 in the upstream section (Denou town), whereas it is 1.2-1.4 g/dm3
downstream (Shurtchi town) and even exceeds MAC 1.5 times in the mouth area (Manguzar village). Let us consider water quality dynamics in more details in the Amudarya basin (Fig. 1). As Table 2 shows, flow salinity in terms of salt content under natural conditions (non-irrigation) varies within 0.3-0.35 g/l, but in the sixties, after discharge of salts of natural run-off and of return water formed in Tajikistan, the salinity averaged as much as 0.51 g/l in Termez section. By the seventies, water salinity in this section has increased to 0.6-0.65 g/l and, virtually, remains at this level, with some variations depending on flow probability. The situation in the Kerki section changes drastically after diversion of water by Karakum canal and especiall Karshi canal; salinity increases against the Termez section to 0.65 and then, depending on intensity of runoff from Surkhandarya irrigation project and Turkmen right bank, and after significant diversion in 1981-1985, salinity in this section differed by 0.05 g/l from that in Termez section. Runoffs from Karshi irrigation project and Bukhara oases, as well as from the Turkmen coast in area of Chardjow further change water quality in Il’chik and Darganata sections, where salinity exceeds MAC, and then salinity practically does not change to the Chatlov section. Since the surge of salinity in the dry year 1989, the mean annual salt content has been close to the norm in the downstream sections of Samanbay and Kyzyldjar as well. The increase in river water salinity and likewise in intensity of drainage from irrigated lands affects salt regime and status of irrigated lands that is dependent on water-salt balance of both the river and irrigated areas. Table 3 shows this balance, from which it is evident that only about half of the more than 50 million tons of salt annually ending up in the river stem from a natural run-off, with the rest formed by run-off from the drained return flow. An analysis of the salt balance in rivers and irrigated lands makes it possible to pinpoint salt accumulation areas in terms of reclamation needs of irrigated lands whose productive capacity is either diminishing or remains at the lowest level of safety due to lack of draining or insufficient leaching regime. Such areas include (Table 3) the Turkmen coast, Tashauz, and Karakalpakstan.

Analytical Report 13
Fig. 1. Amudarya river basin
(source: CAREWIB IS)

Water Quality in the Amudarya and Syrdarya River Basins 14
Table 2.1
Dynamics of average annual salinity in the Amudarya river (g/l)
Period Representative sections
Termez Kerki Il’chik* Darganata Tuyamuyun Kipchak Chatly* Samanbay Kyzyldjar
1960-1970 0.51-0.57 0.56 0.61-0.62 - - - 0.60-0.65 0.50-0.51 0.54-0.57
1971-1980 0.60-0.65 0.67-0.73 0.70-0.73 0.88 0.68-0.89 1.1 0.72-0.93 0.69-0.84 0.75-0.85
1981-1990 0.57-0.62 0.73-0.78 0.91 1.05-1.15 0.91-1.07 1.08-1.118 1.1-1.15 1.09-1.41 1.17-1.34
1991-1995 0.65 0.70 - 0.78 0.81 1.001 - 1.02 0.97
* Note: currently closed gauging stations (g/s) ** empty cells - no observations Source: Knowledge Base «Water and Land Resources Use in the Aral Sea Basin»
Table 2.2
Dynamics of average annual salinity in the Amudarya river (g/l)
g/s Kelif g/s Kerki g/s Chardjow g/s Darganata g/s Kipchak g/s Takhiatash g/s Samanbay Year Water salinity, average annual values
1991 0.649 0.694 0.823 0.990 1.008 1.218 1.126 1992 0.451 0.494 0.671 0.703 1.083 1.156 1.095 1993 0.526 0.499 0.689 0.792 0.914 1.031 1.011 1994 0.440 0.467 0.643 0.681 0.978 1.058 1.066 1995 0.458 0.488 0.657 0.749 1.028 1.065 1.034 1996 0.490 0.491 0.601 0.701 0.941 0.956 0.949 1997 0.488 0.526 0.623 0.784 1.293 1.190 1.231 1998 0.445 0.460 0.630 0.655 1.324 1.376 1.288 1999 0.449 0.454 0.649 0.668 1.397 1.446 1.399 2000 0.453 0.492 0.630 0.850 1.509 1.562 1.460
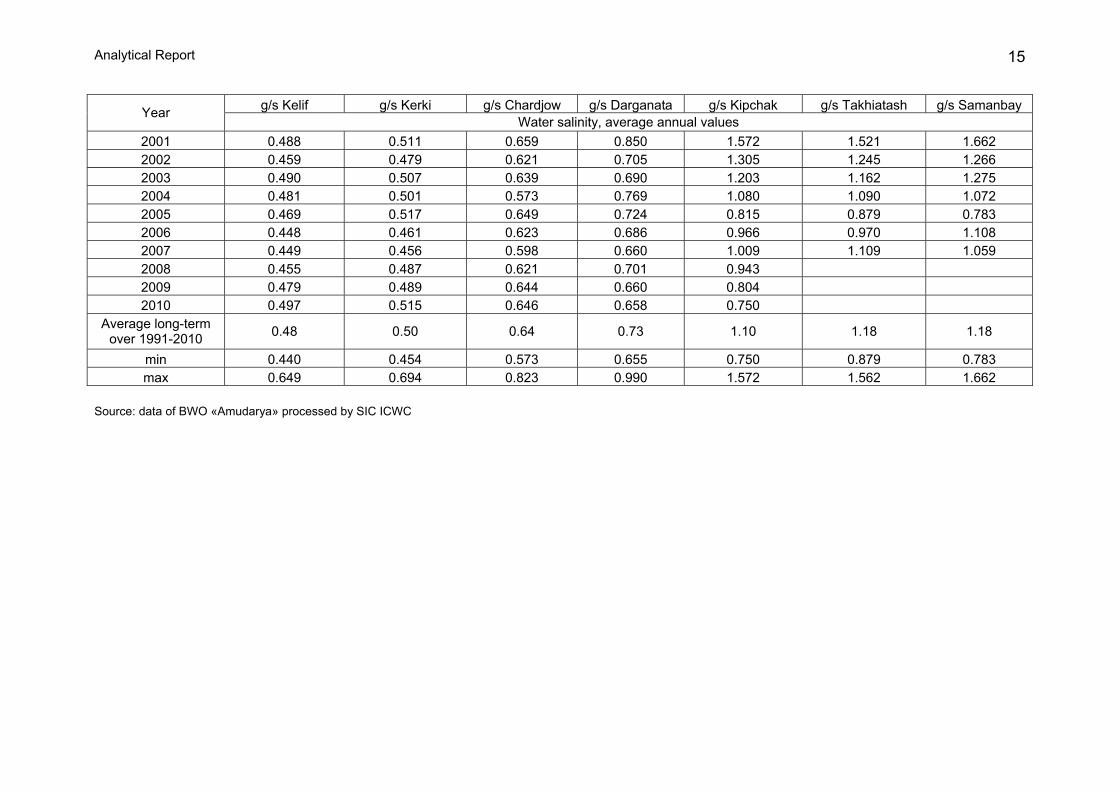
Analytical Report 15
g/s Kelif g/s Kerki g/s Chardjow g/s Darganata g/s Kipchak g/s Takhiatash g/s Samanbay Year Water salinity, average annual values
2001 0.488 0.511 0.659 0.850 1.572 1.521 1.662 2002 0.459 0.479 0.621 0.705 1.305 1.245 1.266 2003 0.490 0.507 0.639 0.690 1.203 1.162 1.275 2004 0.481 0.501 0.573 0.769 1.080 1.090 1.072 2005 0.469 0.517 0.649 0.724 0.815 0.879 0.783 2006 0.448 0.461 0.623 0.686 0.966 0.970 1.108 2007 0.449 0.456 0.598 0.660 1.009 1.109 1.059 2008 0.455 0.487 0.621 0.701 0.943 2009 0.479 0.489 0.644 0.660 0.804 2010 0.497 0.515 0.646 0.658 0.750
Average long-term over 1991-2010 0.48 0.50 0.64 0.73 1.10 1.18 1.18
min 0.440 0.454 0.573 0.655 0.750 0.879 0.783 max 0.649 0.694 0.823 0.990 1.572 1.562 1.662
Source: data of BWO «Amudarya» processed by SIC ICWC

Water Quality in the Amudarya and Syrdarya River Basins 16
Water salinity along the Amudarya river per gauging station, g/l
0.00
0.20
0.40
0.60
0.80
1.00
1.20
1.40
Average long-term for 1991-2010 0.48 0.50 0.64 0.73 1.10 1.18 1.18
g/s Kelif g/s Kerki g/s Chardjow g/s Darganata g/s Kipchak g/s Takhiatash g/s Samanbay
Discharge of CDW Parsankul
Discharge of CDW Gravity Farab coll.drain
Discharge of CDW GLK
Discharge of CDW Main Darganata
Discharge of CDW South Karshi
Discharge of CDW Burdalyk
Discharge of CDW Mekan
Discharge of CDW Khodjambas
Discharge of CDW Khalachpalvart
Discharge of CDW Charshangi
Discharge of CDW KarakalpakstanDischarge CDW
ChumuchkulDischarge CDW Beruny
Fig. 2. Water salinity along the Amudarya river per gauging station

Analytical Report 17
Table 3
Salt balance in the Amudarya basin (Mt)
Salt influx to Amudarya stem stream
of which: Salt mobilization in irrigated lands of irrigation districts Irrigation district Country
Irrigated area,
thousand ha total with natural run-off
with CDW
% of CDW salts out of total
Salt outflux
wth diversion
from Amudarya
Salt mobilization
in Amudarya
stem stream total per 1 ha
Salt influx from
ground water per 1 ha (ton)
Salt accumula
tion per 1 ha
(ton)
Vakhsh Pyandj Kafirnigan
Tajikistan 467 29.4 24.4 5 17 - 29.4 -1.7 -3.64 1.2 -2.44
Surkhansherabat Uzbekistan 310 8.4 5.78 2.62 31.2 1.61 6.79 -3.49 -11.3 5.2 -6.1
Kayrakum Turkmenistan 620 - - - - 6.78 -6.78 -14.2 -22.9 10.6 -12.3
Karshi Uzbekistan 450.8 6.66 - 6.66 100 2.67 3.99 -3.99 -8.9 5.4 -3.5 Bukhara Uzbekistan 254 3.92 - 3.92 100 3.57 0.35 3.16 -12.4 6 -6.4
Turkmen coast Turkmenistan 300 7.92 - 7.92 100 3 4.92 -5.3 17.7 12.3 30
Khorezm Uzbekistan 225 - - - - 4.96 -4.96 -5.7 -25 20.1 -4.9
Tashauz Turkmenistan 260 - - - - 5.32 -5.32 0.5 1.9 8.6 10.5
Karakalpak Uzbekistan 402 1.34 - 1.34 100 12.47 -11.13 4.55 11.3 12.1 23.4
Source: Central Asia Environmental Review / Tajik Youth EcoCenter

Water Quality in the Amudarya and Syrdarya River Basins 18
Let us analyze, where we have excess of salts in the river above the maximum allowable content (1 g/l). As is seen, the largest excess of salts of 10.5 Mt/year is observed in the Darganata section. The closest value (+9.3 Mt) was observed in 1987, while other values were well lower. Thus, if we reduced the salt load by 10-11 Mt a year in the river, we would achieve good quality of water along the whole length of the river. Evidently, the most adequate approach in this context, along with the planned project of Right-bank collector and disposal of collector-drainage water outside the river, would be to set restrictions (limits) on discharge of total quantity of pollutants, an excess of which would be advisable to spread proportionally to amount of salt influx with CDW into the river (Table 4).
Table 4
Setting of limits of salt discharge with collector-drainage water into the river
Irrigation district Country
Salt discharge
with drainage
flow
% of the total
discharge
Necessary reduction of
discharge against allowable
concentration
% of reduction
Mt % Mt % Vakhsh Pyandj Kafirnigan
Tajikistan 5.0 18 1.9 6.5
Surkhandarya Uzbekistan 2.62 9.5 1.0 11.9
Kayrakum Turkmenistan 0 0 0 0
Karshi Uzbekistan
6.66 24.2 2.54 38.2
Bukhara Uzbekistan 3.92 14.27 1.49 38.2
Turkmen coast Turkmenistan 7.92 29.28 3.08 38.2
Khorezm Uzbekistan 0 0 0 0
Dashkhovuz Turkmenistan 0 0 0 0
Karakalpak Uzbekistan 1.34 4.88 0.5 38.2
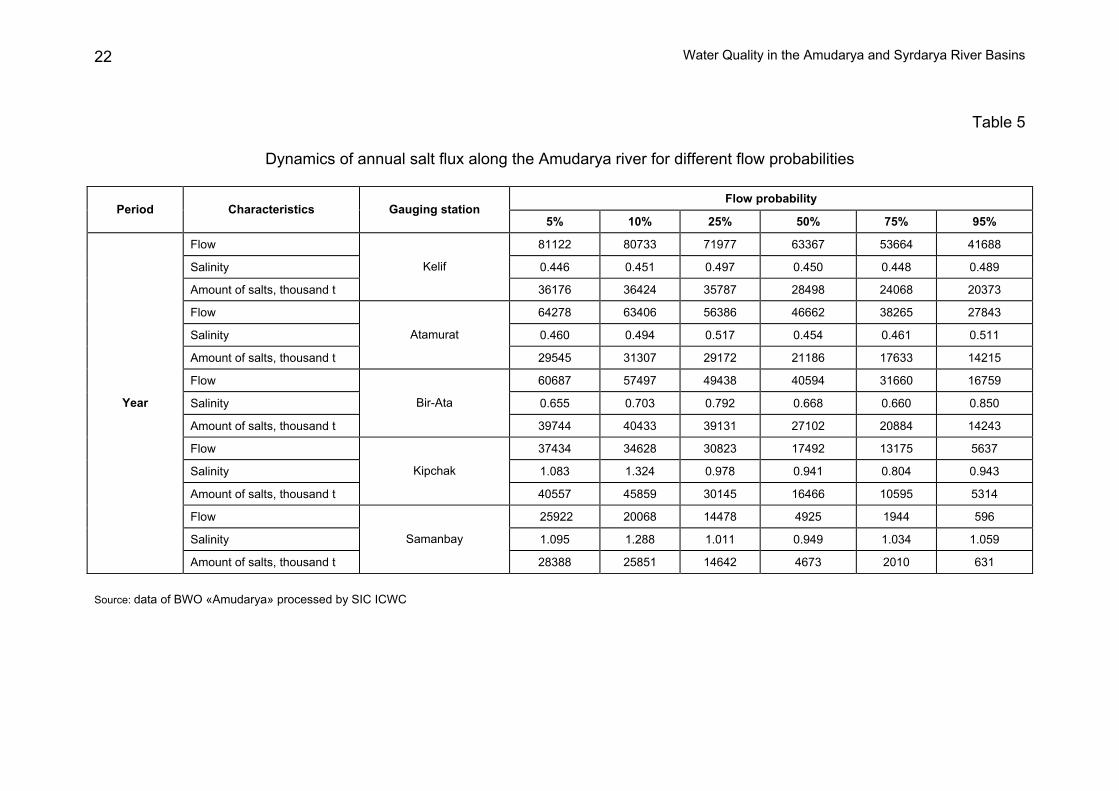
Total 27.46 100 10.5 Source: Central Asia Environmental Review / Tajik Youth EcoCenter The change in water diversion regimes and the reduction of salt discharges with water should be made consistently so that before optimization of land-reclamation regime and lessening of salt influx from groundwater to the aeration zone, the salt discharge could be reduced only through modification of discharges from the Amudarya into other salt recipients but in no way through further decrease of the leaching norm. Similarly, limits on other pollutants can be set by reducing certain types of industrial effluents through the analysis of cumulative amount of pollution against the allowable quantity along the river as a whole in all control sections. Figure 3 and Table 5 show dynamics of annual salt flux along the Amudarya river for different flow probabilities.

Analytical Report 19
Tables 6-7 and Figures 4a-c, 5a-c show changes affecting the middle and lower reaches of the Amudarya river.
Dynamics of annual salt discharge in the Amudarya river along its channel for different flow probabilities
0
20000
40000
60000
80000
100000
120000
140000
160000
180000
200000
Kelif Atamurat Bir-Ata Kipchak Samanbay
Amount of salt, thousand t
5% 10% 25% 50% 75% 95%
Fig. 3
Dynamics of water and salt inflow to Tuyamuyun
0
10000
20000
30000
40000
50000
60000
70000
1991
1992
1993
1994
1995
1996
1997
1998
1999
2000
2001
2002
2003
2004
2005
2006
2007
2008
2009
2010
W,Mm3
0
5000
1000015000
20000
25000
3000035000
40000
45000
G,th.t
River runoff at Tuyamuyun (Bir-Ata) Salt influx to Tuyamuyun
Fig. 4a

Water Quality in the Amudarya and Syrdarya River Basins 20
Dynamics of water abstraction from the site and discharges into this site
0
5000
10000
15000
20000
25000
3000019
91
1992
1993
1994
1995
1996
1997
1998
1999
2000
2001
2002
2003
2004
2005
2006
2007
2008
2009
2010
W,Mm3
0
500
1000
1500
2000
2500
3000
3500
W,Mm3
Water abstraction in the middle reaches Discharge of drainage water into the river
Fig. 4b
Dynamics of salt leaching in the site
0
500
1000
1500
2000
2500
3000
3500
1991
1992
1993
1994
1995
1996
1997
1998
1999
2000
2001
2002
2003
2004
2005
2006
2007
2008
2009
2010
W,Mm3
0
2000
4000
6000
8000
10000
12000
14000
W,Mm3
Discharge of drainage water into the river Salt leaching in the site
Fig. 4c
Dynamics of water and salt inflow to South Prearalie
0
5000
10000
15000
20000
25000
30000
1991
1992
1993
1994
1995
1996
1997
1998
1999
2000
2001
2002
2003
2004
2005
2006
2007
2008
2009
2010
W,Mm3
0
5000
10000
15000
20000
25000
30000
G,th.t
Runoff in Samanbay section Salt influx to Samanbay section
Fig. 5a

Analytical Report 21
Dynamics of water abstraction from the site and discharges into this site
0
5000
10000
15000
20000
25000
3000019
91
1992
1993
1994
1995
1996
1997
1998
1999
2000
2001
2002
2003
2004
2005
2006
2007
2008
W,Mm3
0
100
200
300
400
500
600
G,th.t
Water abstraction in the lower reaches Discharge of drainage water into the river
Fig. 5b
Dynamics of salt leaching in the site
0
100
200
300
400
500
600
1991
1992
1993
1994
1995
1996
1997
1998
1999
2000
2001
2002
2003
2004
2005
2006
2007
2008
W,Mm3
0
500
1000
1500
2000
2500
3000
G,th.t
Discharge of drainage water into the river Salt leaching in the site
Fig. 5c Information processed by SIC ICWC using the data of BWO “Amudarya”
Water Quality in the Amudarya and Syrdarya River Basins 22
Table 5
Dynamics of annual salt flux along the Amudarya river for different flow probabilities
Flow probability
Period Characteristics Gauging station 5% 10% 25% 50% 75% 95%
Flow 81122 80733 71977 63367 53664 41688
Salinity 0.446 0.451 0.497 0.450 0.448 0.489
Amount of salts, thousand t
Kelif
36176 36424 35787 28498 24068 20373
Flow 64278 63406 56386 46662 38265 27843
Salinity 0.460 0.494 0.517 0.454 0.461 0.511
Amount of salts, thousand t
Atamurat
29545 31307 29172 21186 17633 14215
Flow 60687 57497 49438 40594 31660 16759
Salinity 0.655 0.703 0.792 0.668 0.660 0.850
Amount of salts, thousand t
Bir-Ata
39744 40433 39131 27102 20884 14243
Flow 37434 34628 30823 17492 13175 5637
Salinity 1.083 1.324 0.978 0.941 0.804 0.943
Amount of salts, thousand t
Kipchak
40557 45859 30145 16466 10595 5314
Flow 25922 20068 14478 4925 1944 596
Salinity 1.095 1.288 1.011 0.949 1.034 1.059
Year
Amount of salts, thousand t
Samanbay
28388 25851 14642 4673 2010 631
Source: data of BWO «Amudarya» processed by SIC ICWC

Analytical Report 23
Table 6
Changes affecting the middle reaches of the Amudarya river
Factor Unit 1991 1992 1993 1994 1995 1996 1997 1998 1999 2000 2001 2002 2003 2004 2005 2006 2007 2008 2009 2010
Irrigated area Th.ha 1837 1843 1992 2078 2103 2057 2089 2063 2082 2171 2172 2171 2199 2238 2276 2315 2288 2302 2316 2315
River flow in Kerki section Mm3 4510
9 6340
6 5405
2 5996
9 4210
1 4929
5 3613
1 6427
8 4666
2 3157
5 2784
3 4856
9 5168
6 4277
0 5638
6 3826
5 3619
2 2114
5 4064
2 5712
8
Salinity in Kerki section g/l 0.694
0.494
0.499
0.467
0.488
0.491
0.526 0.46 0.45
4 0.49
2 0.51
1 0.47
9 0.50
7 0.50
1 0.51
7 0.46
1 0.45
6 0.48
7 0.48
9 0.51
5
Salt export in Kerki section Th.t 3131
9 3130
7 2697
5 2803
3 2056
0 2420
7 1899
4 2954
5 2118
6 1554
9 1421
5 2324
2 2621
2 2140
9 2917
2 1763
3 1651
5 1029
1 1988
4 2944
7
Water diversion in the middle reaches Mm3 2604
5 2416
1 2162
4 2426
9 2178
0 2251
9 2441
0 2488
9 2459
8 2092
1 1863
1 2330
2 2322
9 2320
7 2330
6 2446
6 2235
4 2014
3 2154
4 2284
5
Salt accommodation in the site Th.t 1808
4 1192
9 1079
1 1134
5 1063
6 1105
8 1283
2 1144
0 1116
8 1030
3 9513 11151
11780
11616
12058
11275
10201 9803 1054
1 1177
6 Drainage inflow in the river Mm3 2703 2389 2918 2147 1857 2271 2873 3170 2841 2672 1891 2610 2745 2777 3104 3104 2590 2659 3273 3201
Salinity of drainage flow g/l 3.25 3.178
2.888
2.995
3.213
3.202
4.237
4.092
3.769
4.087
3.429
3.477
3.133
3.757 3.77 4.01
4 3.95
3 3.78
6 1.98
3 1.83
8
Salt export to the site Th.t 8785 7592 8427 6432 5966 7273 12170
12973
10706
10920 6486 9076 8600 1043
4 1170
2 1245
9 1023
6 1006
7 6490 5884
River flow at Tuyamuyun (Bir-Ata) Mm3 3719
6 5749
7 4943
8 5404
9 3480
0 4336
1 2997
8 6068
7 4059
4 2049
7 1675
9 4196
4 4579
0 3596
4 5182
9 3214
8 2958
5 1606
4 3166
0 4744
7
River salinity at Tuyamuyun (Bir-Ata) g/l 0.89
0 0.70
3 0.79
2 0.68
1 0.74
9 0.70
1 0.78
4 0.65
5 0.66
8 0.85 0.85 0.705 0.69 0.76
9 0.72
4 0.68
6 0.66 0.701 0.66 0.65
8
Salt influx to Tuyamuyun Th.t 33105
40433
39131
36802
26048
30389
23492
39744
27102
17413
14243
29567
31587
27645
37500
22061
19517
11264
20884
31225
Source: data of BWO «Amudarya» processed by SIC ICWC

Water Quality in the Amudarya and Syrdarya River Basins 24
Table 7
Changes affecting the lower reaches of the Amudarya river
Factor Unit 1991 1992 1993 1994 1995 1996 1997 1998 1999 2000 2001 2002 2003 2004 2005 2006 2007 2008 2009 2010
IIrrigated area Th.ha 1103 1126 1150 1180 1187 1189 1185 1181 1184 1187 1188 1188 1189 1191 1193 1197 1192 1192 1196 1201
River flow in Tuyamuyun section Mm3 3423
5 5116
3 4564
2 4208
3 2180
8 2803
9 1690
0 4718
2 2481
0 1170
7 1046
7 2430
3 3262
8 2363
9 4006
5 2149
5 1716
9 1109
5 2034
3 3771
5
Salinity in Tuyamuyun section g/l 0.84
9 0.80
2 0.88
4 0.82
6 0.90
6 0.85
6 1.10
3 1.23 0.981
1.125
1.219
0.754
0.815
0.904
0.728
0.909
0.914
0.863
0.757
0.700
Salt export in Tuyamuyun section Th.t 2905
2 4103
5 4036
7 3475
2 1974
8 2399
7 1863
8 5805
7 2434
4 1316
6 1276
0 1831
5 2659
8 2137
0 2917
9 1954
0 1569
3 9578 15407
26401
Water diversion in the lower reaches Mm3 2073
1 2084
4 2146
1 2043
3 1968
6 2085
9 1781
6 2381
8 2139
5 1205
2 8366 17584
20528
21386
23288
20698
17383
10900
18073
21139
Salt accommodation in the site Th.t 1759
3 1671
8 1898
1 1687
4 1782
6 1785
2 1964
9 2930
8 2099
3 1355
5 1019
8 1325
1 1673
4 1933
3 1696
0 1881
6 1588
8 9409 13688
14797
Drainage inflow in the river Mm3 509 424 378 346 270 354 306 303 324 251 168 209 281 286 326 296 302 190 ** **
Salinity of drainage flow g/l 5.306
5.641
5.378
4.924
4.999
4.801
5.362
4.286
4.034
4.911
5.323 4.12 3.65
4 4.04
3 3.58
4 3.72
9 3.80
8 4.10
1 ** **
Salt export to the site Th.t 2703 2391 2034 1706 1349 1701 1639 1299 1307 1231 894 860 1027 1158 1168 1103 1151 780 ** **
Salt export to the site Mm3 10484
25922
14478
18706 1944 4925 683.
2 2006
8 4039 1378 394.4 3424 9801 4217 1300
0 2566 596.2
470.6 2739 1691
9
River flow in Samanbay section g/l 1.12
6 1.09
5 1.01
1 1.06
6 1.03
4 0.94
9 1.23
1 1.28
8 1.39
9 1.45
9 1.66
2 1.26
6 1.27
5 1.07
2 0.98
3 1.10
8 1.05
9 0.94
3 0.80
4 0.75
0
Salt influx to Samanbay section Th.t 1180
6 2838
8 1464
2 1994
6 2010 4673 840.9
25851 5652 2011 655.
6 4336 12499 4519 1277
9 2842 631.2
443.6 2203 1269
0
Source: data of BWO «Amudarya» processed by SIC ICWC
Analytical Report 25
Problems of Water Resource Quality in the Syrdarya River Basin3
Similar changes in water content have occurred in the Syrdarya basin. Annually, 20 millions tons of salt is washed into the Syrdarya river by drained return flow. This raises water salinity in the river from 300-600 mg/l in the upper reaches to 3000 mg/l4 in the lower reaches of Fergana Valley, with prevalent MgSO4, Ca(HCO3)2, NaCl, and CaSO4 in salt composition. At the same time, the coliform index increases significantly up to 25 000, and concentrations of phenols and anthropogenic pollutants grow as well. Further downstream, where the river exits from the Fergana Valley, water quality is deteriorating largely and remains unsatisfactory right down to the delta and the point of entrance to the northern Aral Sea. Water salinity has increased from 1960-1970 levels in all controlled sections. The increases in the overall salinity are accompanied by higher concentrations of magnesium, copper, iron, sulphates, chlorides, etc. As a result, not only lower reaches but also the medium course of the Syrdarya contain water that is unacceptable for drinking and its significant pollution quite often leads to increased morbidity of the local people. Prevailing diseases are related to the quality of drinking water and include hepatitis, typhoid and gastrointestinal disorders. Along the course, the Syrdarya rivers receives both polluted water from its main tributaries and polluted return flow discharged from numerous collector drains, the largest ones being SBK, Shuruzyak, and KPK-C. Under present conditions, the total amount of the collector and drainage waters (CDW) in the Syrdarya Basin comes to 22.4 km3/year: 0.22 km3/year in the upper course (Naryn); 9.4 km3/year in the Fergana Valley; 3.5 km3/year in the middle course; 2.8 km3/year in CHAKIR; and, 5.5 km3/year in the lower course. Out of this amount 14.1 km3/year are returned back into basin’s rivers and 5.5 km3/year are carried away to natural depressions and sands (Table 8).
3 Sources: (1) The Uzbek National Coordination Center, Clearing House Mechanism of the Convention on Biodiversity - www.cbd.uz (2) Toryanikova R.V. Water Quality Assessment and Management in the Syrdarya River Basin / EPIC-USAID, ftp://ftp.crwr.utexas.edu/pub/outgoing/mckinney/EPIC 4 According to the expert Z.Yarullina (State Committee for Nature Conservation of the Republic of Uzbekistan), the maximum water salinity was 1880 mg/l in 2009

Water Quality in the Amudarya and Syrdarya River Basins 26
Table 8
Collector and drainage waters flowing into the
Syrdarya river under present conditions
Basin, irrigation district
Amount of CDW incoming to the
river and its tributaries, Mm3/year
Average salinity of CDW, g/l
Salt content incoming to the
river, Mt/year
Syrdarya from the river source to Toktogul waterworks facility 190 0.75 0.143
Syrdarya from Toktogul waterworks facility to Kairakkum reservoir 8680 2.205 19.139
Syrdarya from Kairakkum reservoir to Chardara reservoir 3360 3.005 10.097
Syrdarya from Chardara reservoir to the river mouth 1860 3.20 5.952
TOTAL on the Syrdarya river 14090 35.331
Sources: (1) The Uzbek National Coordination Center, Clearing House Mechanism of the Convention on Biodiversity - www.cbd.uz (2) Toryanikova R.V. Water Quality Assessment and Management in the Syrdarya River Basin / EPIC-USAID, ftp://ftp.crwr.utexas.edu/pub/outgoing/mckinney/EPIC CDW salinity varies within 1.0-2.68 g/l in upper reaches, 2.0-5.6 g/l in middle reaches, and 1.2-5.2 g/l in lower reaches. Under present-day conditions, moving away from the flow formation zone, with diversion of river water for irrigation, the river runoff decreases and its quality changes, i.e. a share of return water in the river increases and, consequently, river water salinity is growing, its ionic and biogenic composition degrades. Thus, the Syrdarya river and its constituent catchment basins should be considered as different interrelated transit ecosystems, where water quality and environmental conditions in catchment sites fit the natural (background) state or are subjected to a change in a varying degree under anthropogenic impact. The quality of water resources is assessed by using MAC criteria (maximum allowable concentration). MAC is the maximum concentration of a harmful substance in the unit water, which when exerting a continuous impact does not cause adverse changes in the living organism and its generation. MAC is based on a conception that chemical characteristics of the water body changed as a result of pollution may have a direct or indirect adverse impact on people’s health and aquatic biota due to deterioration of water quality.

Analytical Report 27
Fig. 6. Syrdarya river basin
(source: CAREWIB IS)
Water Quality in the Amudarya and Syrdarya River Basins 28
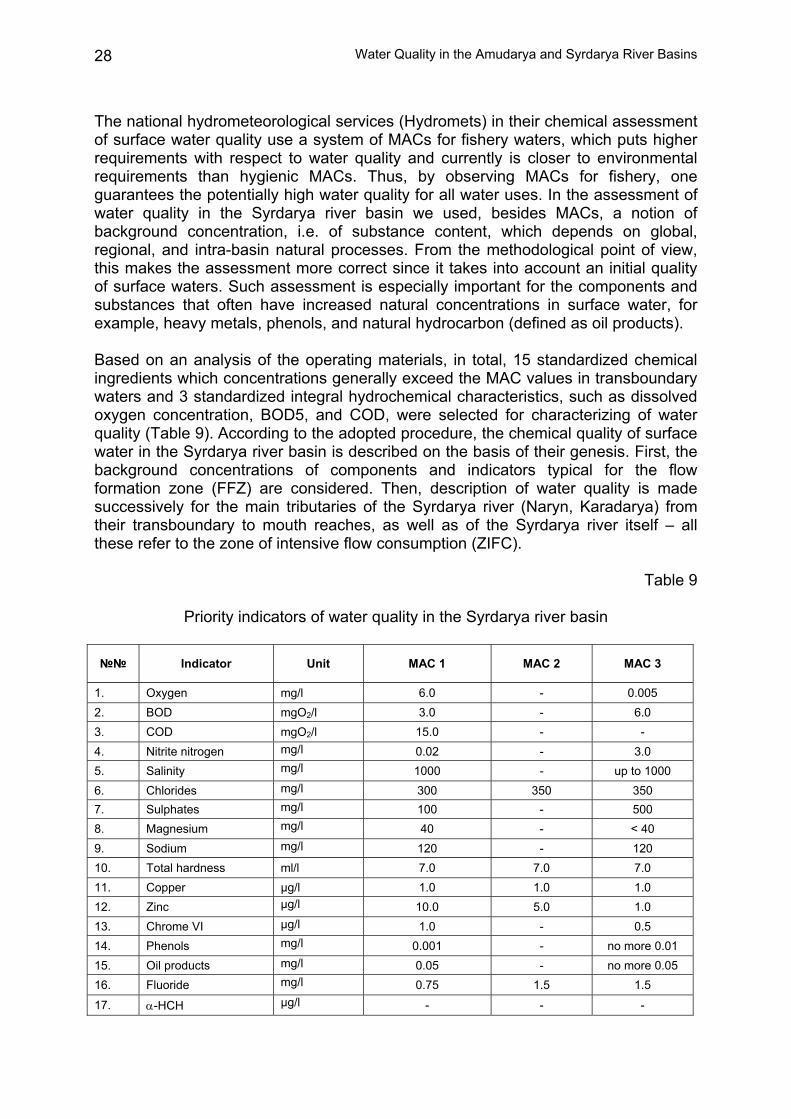
The national hydrometeorological services (Hydromets) in their chemical assessment of surface water quality use a system of MACs for fishery waters, which puts higher requirements with respect to water quality and currently is closer to environmental requirements than hygienic MACs. Thus, by observing MACs for fishery, one guarantees the potentially high water quality for all water uses. In the assessment of water quality in the Syrdarya river basin we used, besides MACs, a notion of background concentration, i.e. of substance content, which depends on global, regional, and intra-basin natural processes. From the methodological point of view, this makes the assessment more correct since it takes into account an initial quality of surface waters. Such assessment is especially important for the components and substances that often have increased natural concentrations in surface water, for example, heavy metals, phenols, and natural hydrocarbon (defined as oil products). Based on an analysis of the operating materials, in total, 15 standardized chemical ingredients which concentrations generally exceed the MAC values in transboundary waters and 3 standardized integral hydrochemical characteristics, such as dissolved oxygen concentration, BOD5, and COD, were selected for characterizing of water quality (Table 9). According to the adopted procedure, the chemical quality of surface water in the Syrdarya river basin is described on the basis of their genesis. First, the background concentrations of components and indicators typical for the flow formation zone (FFZ) are considered. Then, description of water quality is made successively for the main tributaries of the Syrdarya river (Naryn, Karadarya) from their transboundary to mouth reaches, as well as of the Syrdarya river itself – all these refer to the zone of intensive flow consumption (ZIFC).
Table 9
Priority indicators of water quality in the Syrdarya river basin
№№ Indicator Unit MAC 1 MAC 2 MAC 3
1. Oxygen mg/l 6.0 - 0.005 2. BOD mgО2/l 3.0 - 6.0 3. COD mgО2/l 15.0 - - 4. Nitrite nitrogen mg/l 0.02 - 3.0 5. Salinity mg/l 1000 - up to 1000 6. Chlorides mg/l 300 350 350 7. Sulphates mg/l 100 - 500 8. Magnesium mg/l 40 - < 40 9. Sodium mg/l 120 - 120 10. Total hardness ml/l 7.0 7.0 7.0 11. Copper µg/l 1.0 1.0 1.0 12. Zinc µg/l 10.0 5.0 1.0 13. Chrome VI µg/l 1.0 - 0.5 14. Phenols mg/l 0.001 - no more 0.01 15. Oil products mg/l 0.05 - no more 0.05 16. Fluoride mg/l 0.75 1.5 1.5
17. α-HCH µg/l - - -

Analytical Report 29
№№ Indicator Unit MAC 1 MAC 2 MAC 3
18. γ-HCH µg/l - - -
Note: MAC 1 – for fishery waters MAC 2 – for drinking water MAC 3 – for water in open water bodies served for drinking 1 Toryanikova R.V. Water Quality Assessment and Management in the Syrdarya River Basin / EPIC-USAID, ftp://ftp.crwr.utexas.edu/pub/outgoing/mckinney/EPIC
Surface Water Quality in the Flow Formation Zone5 Water quality in the flow formation zone (FFZ) is mainly determined by the lithology of rocks forming the drainage basins and by the conditions of flow formation. Water resources in the rivers of this zone are low and medium saline. The maximum salinity is observed during the low water period, while the minimum one is reached at the time of recession of flood. The salinity increases greatly at the peak of flood. Generally, the excess over MAC is typical for the ingredients with increased geochemical background, namely heavy metals, such as copper, zinc, and chrome (Table 10).
Table 10
Average indicators (1986 - 1996) of the river water chemistry in the flow formation zone
Range of indicators in river basins
Indicator Unit Right-bank tributaries of Syrdarya in
Fergana Valley
Left-bank tributaries of
Syrdarya Akhangaran Chirchik Naryn
Salinity mg/dm3 135-360 180-400 130-520 110-240 360 Hardness Mmole/dm3 1.7-4.4 2.3-6.2 1.6-6.7 1.5-3.0 3.4-3.7 COD mgО/dm3 4.5-6.0 3.7-6.7 4.0-7.0 2.7-9.5 6.8-7.8 BOD5 mgО/dm3 0.5-1.6 0.3-2.3 1.4-2.6 0.5-2.2 1.0-1.8 Fe mg/dm3 0.01-0.04 0.01-0.05 0.02-0.04 0.02-0.19 0.02-0.04 NH4 mgN/dm3 0.02-0.10 0.02-0.15 0.01-0.13 0.01-0.56 0.02-0.06 NO3 mgN/dm3 0.77-1.85 0.45-1.66 0.29-1.46 0.28-2.09 0.71-1.10 NO2 mgN/dm3 0.002-0.013 0.004-0.026 0.007-0.039 0.002-0.190 0.004-0.13Mineral phosphorus mg/dm3 0.003-0.012 0.002-0.037 0.005-0.018 0.001-0.018 0.005-0.011Oil products mg/dm3 0.0-0.04 0.0-0.04 0.02-0.09 0.01-0.10 0.03-0.05 Phenols mg/dm3 0.001-0.003 0.001-0.006 0.001-0.006 0.001-0.005 0.002-0.005Hexachloran µg/dm3 0.0-0.089 0.008-0.110 0.007-0.253 0.002-0.037 0.015-0.025Lindane µg/dm3 0.0-0.067 0.002-0.057 0.005-0.042 0.001-0.037 0.007-0.026Rogor µg/dm3 0.0-15.5 - 0.13-0.56 - 0.073-1.374Al µg/dm3 1.4-8.1 1.8-9.8 3.5-15.6 2.3-22.2 3.5-8.1 Mn µg/dm3 0.6-4.5 0.5-6.7 6.0-6.1 0.0-6.6 0.0-1.1 As µg/dm3 - - 0.0-8.1 1.68-5.44 0.5-6.4
5 Toryanikova R.V. Water Quality Assessment and Management in the Syrdarya River Basin / EPIC-USAID, ftp://ftp.crwr.utexas.edu/pub/outgoing/mckinney/EPIC

Water Quality in the Amudarya and Syrdarya River Basins 30
Range of indicators in river basins
Indicator Unit Right-bank tributaries of Syrdarya in
Fergana Valley
Left-bank tributaries of
Syrdarya Akhangaran Chirchik Naryn
Ti µg/dm3 1.6-3.0 0.0-2.3 1.0-3.2 0.0-8.1 0.6-2.1 Fluoride µg/dm3 - - 0.33-0.62 0.0*-1.5* 0.34-0.39 Cyanides µg/dm3 - - 0.003-0.006 - - Cu µg/dm3 0.0-10.1 0.0-5.7* 0.0-3.87 0.0*-6.3* 0.0-7.85 Zn µg/dm3 0.6-22.8 0.0*-9.6 5.84-13.9 0.9*-15.4 0.0-13.1 Pb µg/dm3 0.0-3.1* 0.0-0.76 0.0-4.74 0.0-12.6 0.0-1.2 Hg µg/dm3 - - 0.10*-0.17 0.06-0.10 0 Note: * - single observations 1 Toryanikova R.V. Water Quality Assessment and Management in the Syrdarya River Basin / EPIC-USAID, ftp://ftp.crwr.utexas.edu/pub/outgoing/mckinney/EPIC As to the organic ingredients, the general MAC excess is typical for phenols and, to a lesser degree, for oil products (natural hydrocarbons) that is evidently due to natural biochemical processes of the organic substance transformation in the river waters of the region. Apparently, isolated cases of MAC exceeding by nitrites also have a similar character although they are found considerably more rarely than for the aforesaid ingredients. As a whole, the surface water quality in the FFZ may be considered as the good one and suitable for all water uses; however, the tendency toward deterioration of water quality may be traced in small watercourses of the flow formation zone.
Quality of Transboundary Water in the Zone of Intensive Flow Consumption6 The main constituents of the Syrdarya river - the Naryn and Karadarya Rivers - are formed in the territory of Kyrgyzstan. According to the data of the Kyrgyz Hydromet, water resources in the Naryn (the sections located upstream and downstream of Naryn town, Uchterek gauging station, and upstream and downstream of Tashkumyr town) and the Karadarya (the sections located upstream and downstream of Uzgen town) are of good quality. For these transboundary river reaches the average annual concentrations of the dissolved oxygen amount to 8.3 - 10.3 mg/l, BOD5: 1.5 - 2.1 mgO2/l, nitrite nitrogen: 0.002 - 0.025 mg/l, and salts - up to 300 mg/g. No MAC excess was recorded for all mineral components. Contents of metals, phenols, oil products and pesticides don’t exceed the background values. Within the boundaries of Uzbekistan, from the transboundary point (town of Uchkurgan) to the mouth of the Naryn River the water salinity increases in average up to 432 - 602 mg/l basically because of sulfates, the average concentration of which exceed MAC 1.2 - 2.0 times (121 -211 mg/l). Again the average annual concentration of nitrite nitrogen considerably increases: up to 0.022 - 0.025 mg/l (MAC 1.1 - 1.2). Concentrations of other ingredients are within the limits of the 6 Toryanikova R.V. Water Quality Assessment and Management in the Syrdarya River Basin / EPIC-USAID, ftp://ftp.crwr.utexas.edu/pub/outgoing/mckinney/EPIC
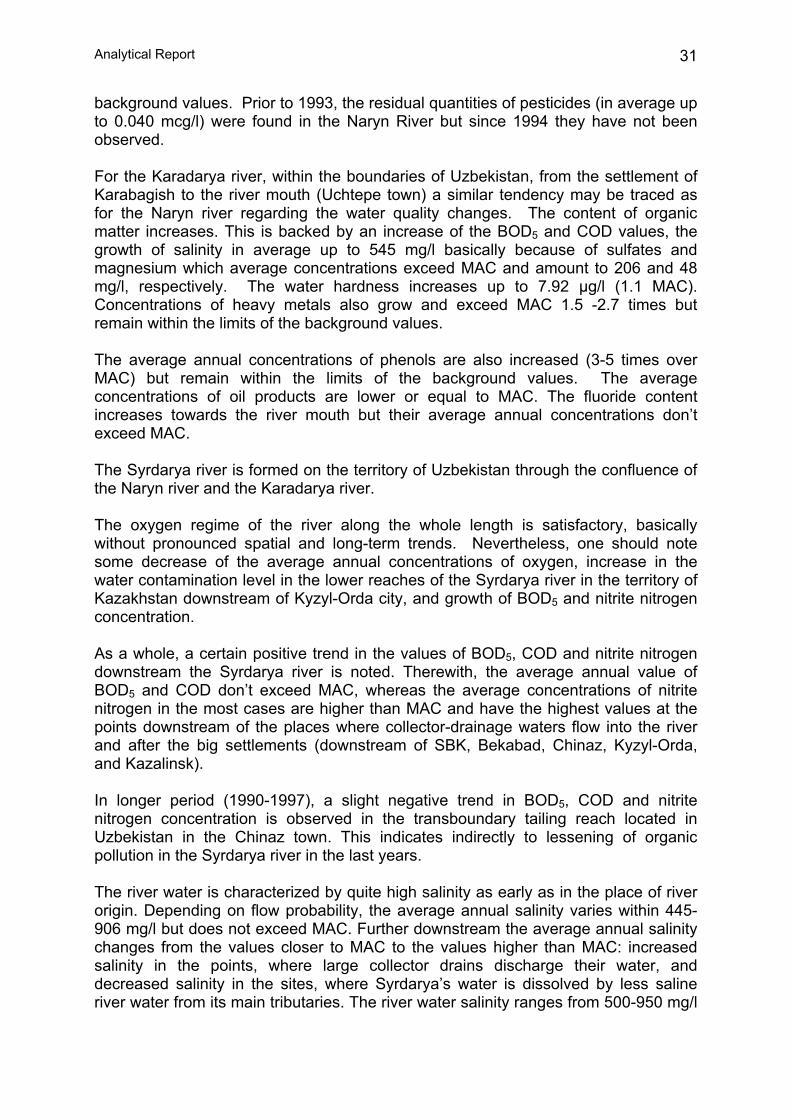
Analytical Report 31
background values. Prior to 1993, the residual quantities of pesticides (in average up to 0.040 mcg/l) were found in the Naryn River but since 1994 they have not been observed. For the Karadarya river, within the boundaries of Uzbekistan, from the settlement of Karabagish to the river mouth (Uchtepe town) a similar tendency may be traced as for the Naryn river regarding the water quality changes. The content of organic matter increases. This is backed by an increase of the BOD5 and COD values, the growth of salinity in average up to 545 mg/l basically because of sulfates and magnesium which average concentrations exceed MAC and amount to 206 and 48 mg/l, respectively. The water hardness increases up to 7.92 µg/l (1.1 MAC). Concentrations of heavy metals also grow and exceed MAC 1.5 -2.7 times but remain within the limits of the background values. The average annual concentrations of phenols are also increased (3-5 times over MAC) but remain within the limits of the background values. The average concentrations of oil products are lower or equal to MAC. The fluoride content increases towards the river mouth but their average annual concentrations don’t exceed MAC. The Syrdarya river is formed on the territory of Uzbekistan through the confluence of the Naryn river and the Karadarya river. The oxygen regime of the river along the whole length is satisfactory, basically without pronounced spatial and long-term trends. Nevertheless, one should note some decrease of the average annual concentrations of oxygen, increase in the water contamination level in the lower reaches of the Syrdarya river in the territory of Kazakhstan downstream of Kyzyl-Orda city, and growth of BOD5 and nitrite nitrogen concentration. As a whole, a certain positive trend in the values of BOD5, COD and nitrite nitrogen downstream the Syrdarya river is noted. Therewith, the average annual value of BOD5 and COD don’t exceed MAC, whereas the average concentrations of nitrite nitrogen in the most cases are higher than MAC and have the highest values at the points downstream of the places where collector-drainage waters flow into the river and after the big settlements (downstream of SBK, Bekabad, Chinaz, Kyzyl-Orda, and Kazalinsk). In longer period (1990-1997), a slight negative trend in BOD5, COD and nitrite nitrogen concentration is observed in the transboundary tailing reach located in Uzbekistan in the Chinaz town. This indicates indirectly to lessening of organic pollution in the Syrdarya river in the last years. The river water is characterized by quite high salinity as early as in the place of river origin. Depending on flow probability, the average annual salinity varies within 445-906 mg/l but does not exceed MAC. Further downstream the average annual salinity changes from the values closer to MAC to the values higher than MAC: increased salinity in the points, where large collector drains discharge their water, and decreased salinity in the sites, where Syrdarya’s water is dissolved by less saline river water from its main tributaries. The river water salinity ranges from 500-950 mg/l

Water Quality in the Amudarya and Syrdarya River Basins 32
during flood period and to 960-2000 mg/l in the low water time. In general, a positive spatial trend of salinity growth is observed downstream the river channel. Dynamics of the average annual salinity along the length is shown in Table 11.
Table 11
Average annual salinity in the Syrdarya river, g/l
Year Section
Kal’ Bekabad Nadejdinsky Kzyl-Orda Kazalinsk
1950 0.532 - 0.784 0.745 0.745 1955 0.522 0.514 0.782 0.735 0.726 1960 0.500 0.558 0.681 0.712 0.694 1965 0.589 1.102 0.980 0.861 0.803 1970 0.571 1.014 1.152 1.044 1.075 1975 0.755 1.053 1.139 1.667 1.638 1980 0.624 1.180 1.309 1.360 1.588 1985 0.718 1.172 1.320 1.356 1.632 1990 0.554 1.189 1.237 * * 1993 0.744 1.133 1.315 * * 1994 0.652 1.101 1.150 * * 1997 0.532 1.168 1.425 1.307 1.488
* - no data 1 Toryanikova R.V. Water Quality Assessment and Management in the Syrdarya River Basin / EPIC-USAID, ftp://ftp.crwr.utexas.edu/pub/outgoing/mckinney/EPIC The positive spatial salinity trend is explained by an increase in concentrations of all mineral components downstream the Syrdarya river that, like salinity itself, naturally grow downstream of the points, where collector drains discharge their water into the river, and decrease downstream of the inflow points of large tributaries. Moreover, the annual concentration of chlorides and sodium is within MAC, whereas the concentration of sulphate and magnesium exceeds MAC 2-6 times along the whole length of the Syrdarya river. In the Syrdarya river basin, where water resources are practically exhausted and diversion of flow in the 1990s was governed only by flow probability, the time trends of growing salinity and its mineral components are not pronounced. Water in the Syrdarya river is increasingly hard along the whole its length. The rise and fall of the hardness is synchronic with fluctuations of salinity and, as a whole, follow a positive spatial trend along the river. The content of the toxic metals, such as ions of copper, zinc, and hexavalent chromium exceeds MAC along the whole length of the river and has a slightly pronounced positive spatial trend. Concentrations of heavy metals in the ZIFC are basically within the limits of the background values, but in industrial and urban agglomerations the former may exceed MAC by dozens of times in both collector drains and tributaries, thus causing impulsive and multiple increase of heavy metal content in some reaches of the Syrdarya river. Moreover, the maximum concentrations of those ingredients may be

Analytical Report 33
much higher than the observed background values. In terms of temporal course, in the last eight years a certain negative trend of these concentrations is observed in transboundary waters, probably, due to setback in industrial production. Content of phenols is high along the whole length of the river and does not show apparent spatial and temporal trends. The spatial trend of oil product concentrations along the Syrdarya river is not pronounced as well. The local rise over MAC in their concentrations is typically observed in industrial and urban agglomerations and downstream of the point, where the SBK collector drain inflows to the river. The multi-year trend of oil product concentrations in transboundary waters of the Syrdarya is not apparent. The excessive concentrations of fluorides in the Syrdarya river are typical mainly in the Fergana Valley and in an irrigation project in the Golodnaya Steppe, i.e. in the zone of inflow of drainage water. The temporal multi-year trend of fluoride content is not pronounced. Thus, there are the upward trends of salinity and its mineral components (chloride, sulphate, magnesium, sodium), of organic pollution (BOD5, COD, nitrite nitrogen), hardness, heavy metal (copper, zinc, chromium) and phenol contents in the Syrdarya river basin from the FFZ to the ZIFC and along the main transboundary rivers, such as Naryn and Karadarya, and the Syrdarya river as a whole. The poor quality of the transboundary waters is caused, first of all, by an increased content (against the background and the MAC) of sulfates, magnesium, nitrite nitrogen, fluorides, the excessive water hardness, and higher content of pesticides. The content of phenols, oil products and heavy metals is basically within the limits of the background values typical for the FFZ, with impulsive and multiple increase in the zones of high anthropogenic loads, namely in the reaches affected by industrial populated localities and big collector drains in the irrigated zones. Principally, the average annual COD values are within the limits of MAC but they are considerably higher than the background characteristics, particularly, in the zones of high anthropogenic loads, where the average and maximum values of this indicator amount to 1 -1.5 MAC. National diagnostic reports indicate that a certain reduction in the salinity that occurred in the late 1990s in interstate rivers was due to a temporary slowdown in water use for irrigation and by industries. In the meantime, contamination of groundwater has become widespread. For some pollutants, content levels exceed maximum allowable concentrations by dozens – and, in some areas, by hundreds of times. The highest incidence of groundwater contamination has been recorded around large settlements, chemical, oil refining and non-ferrous metallurgical plants, etc. Statistics for 1995-2001 indicate that, on average, 8-15% of water samples fail to satisfy bacteriological requirements and 20-40% fall short of physical and chemical standards. National experts voice concern over the unsatisfactory technical condition of sewage disposal facilities (in 60-70% of all cases) that fail to provide efficient treatment of sewage and industrial effluent.
Water Quality in the Amudarya and Syrdarya River Basins 34
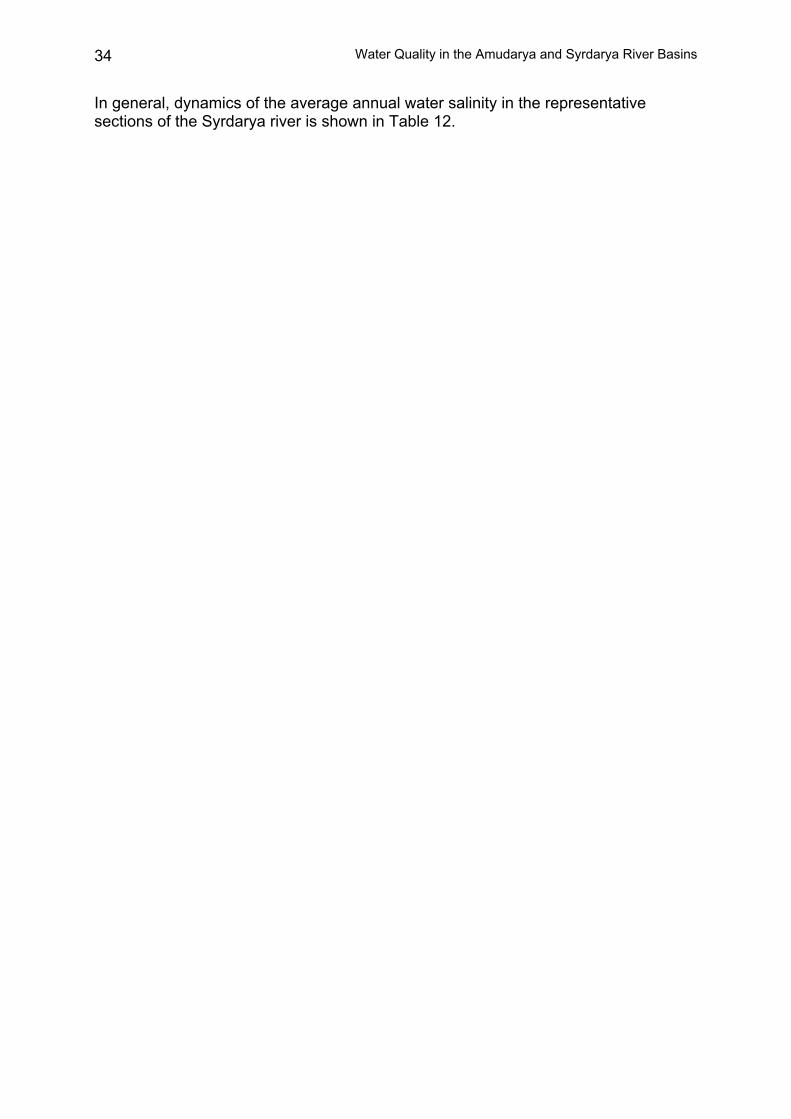
In general, dynamics of the average annual water salinity in the representative sections of the Syrdarya river is shown in Table 12.
Analytical Report 35
Table 12.1
Dynamics of average annual salinity in the Syrdarya river (g/l)
Representative sections
Period Bekabad Shardara Kzylorda Kazalinsk 1960 - 1970 0.64-0.97 0.68-0.94 0.70-0.98 0.95-1.01 1971-1980 0.97-1.38 0.94-1.55 0.98-1.74 1.01-1.72
1981 - 1990 1.38-1.48 1.55-1.46 1.74-1.69 1.72-1.87(2.26) 1991 - 1999 1.48-1.35 1.46-1.24 1.69-1.33 1.87-1.57
Note: Empty cells mean no observations available. Source: Knowledge Base «Water and Land Resources Use in the Aral Sea Basin»
Table 12.2
Dynamics of average annual salinity in the Syrdarya river (g/l)
Uchkurgan waterworks g/s Kal’ g/s Akdjar g/s
Chilmakhram g/s Kzylkishlak Farkhad waterworks
g/s Nadejdenskiy
Mouth of Keles
river Year
Salinity, average annual values, g/l 1990 1.239 1.232 1991 1.028 1.166 1.127 1.189 1992 1.012 1.049 1.111 1.185 1993 0.882 0.921 1.035 1.086 1994 0.960 1.042 1.106 1.167 1995 0.879 0.912 1.177 1.129 1996 1.026 1.071 1.192 1.168 1997 0.892 0.980 1.041 1.162 1.087 1998 1.144 1.232 1999 1.293 1.349 2000 1.320 1.395

Water Quality in the Amudarya and Syrdarya River Basins 36
Uchkurgan waterworks g/s Kal’ g/s Akdjar g/s
Chilmakhram g/s Kzylkishlak Farkhad waterworks
g/s Nadejdenskiy
Mouth of Keles
river Year
Salinity, average annual values, g/l 2001 0.656 0.744 1.058 1.234 2002 0.535 0.809 0.812 1.184 1.270 2003 0.704 0.691 1.166 1.285 2004 0.440 0.672 0.705 1.177 1.283 2005 0.473 0.782 0.864 1.177 1.267 2006 0.490 0.802 0.783 1.158 1.280 2007 0.455 0.731 0.756 1.170 1.280 2008 0.502 0.754 0.779 1.084
Average long-term 0.48 0.74 0.77 0.99 1.05 1.11 1.17 1.23
min 0.44 0.66 0.69 0.88 0.91 1.03 1.06 1.09 max 0.54 0.81 0.86 1.24 1.23 1.19 1.32 1.39
Source: data of BWO «Syrdarya» processed by SIC ICWC

Analytical Report 37
Water salinity in the Syrdarya river per gauging station, g/l
0.00
0.20
0.40
0.60
0.80
1.00
1.20
1.40
1.60
Average annual 0.48 0.74 0.77 0.99 1.05 1.11 1.17 1.23
min 0.44 0.66 0.69 0.88 0.91 1.03 1.06 1.09
max 0.54 0.81 0.86 1.24 1.23 1.19 1.32 1.39
g/s Uchkurgan g/s Kal g/s Akdjar g/s Chilmakhram g/s Kzylkishlak Farkhad w aterw orks g/s Nadejdinsky Keles river mouth
Fig. 7. Salinity at gauging stations of the Syrdarya river
Water Quality in the Amudarya and Syrdarya River Basins 38
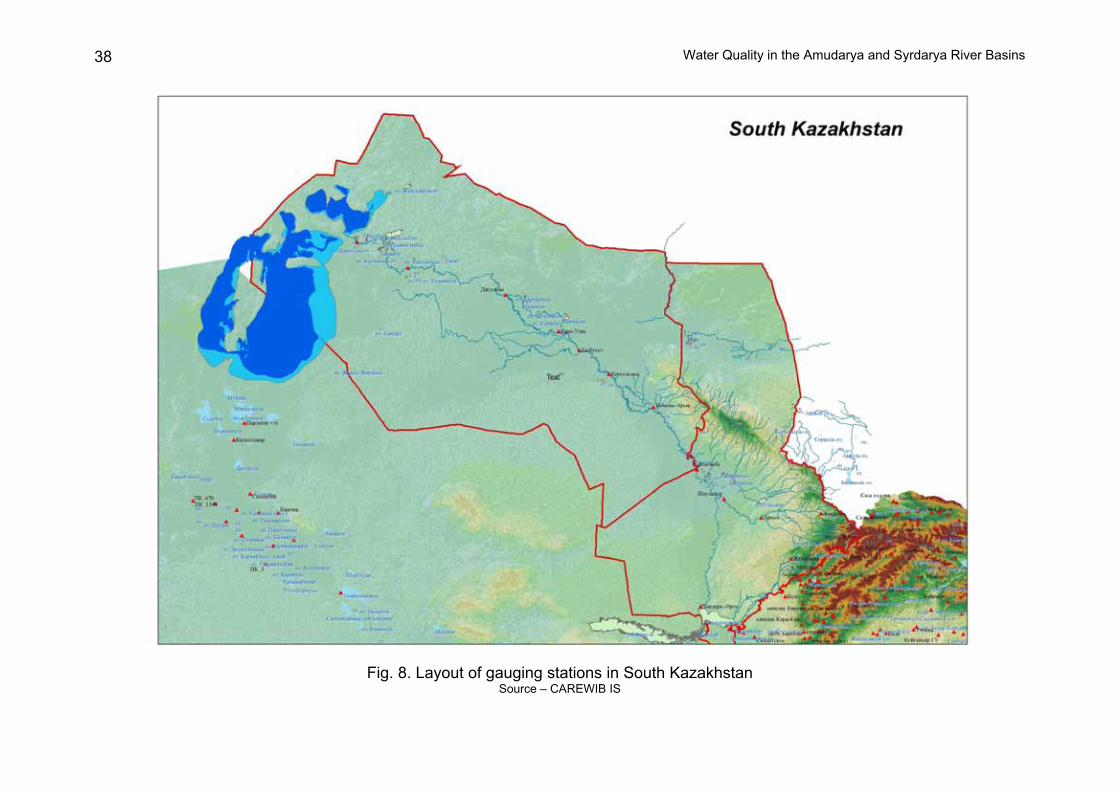
Fig. 8. Layout of gauging stations in South Kazakhstan Source – CAREWIB IS

Analytical Report 39
Fig. 9. Layout of gauging stations in Kyrgyzstan
Source – CAREWIB IS
Water Quality in the Amudarya and Syrdarya River Basins 40
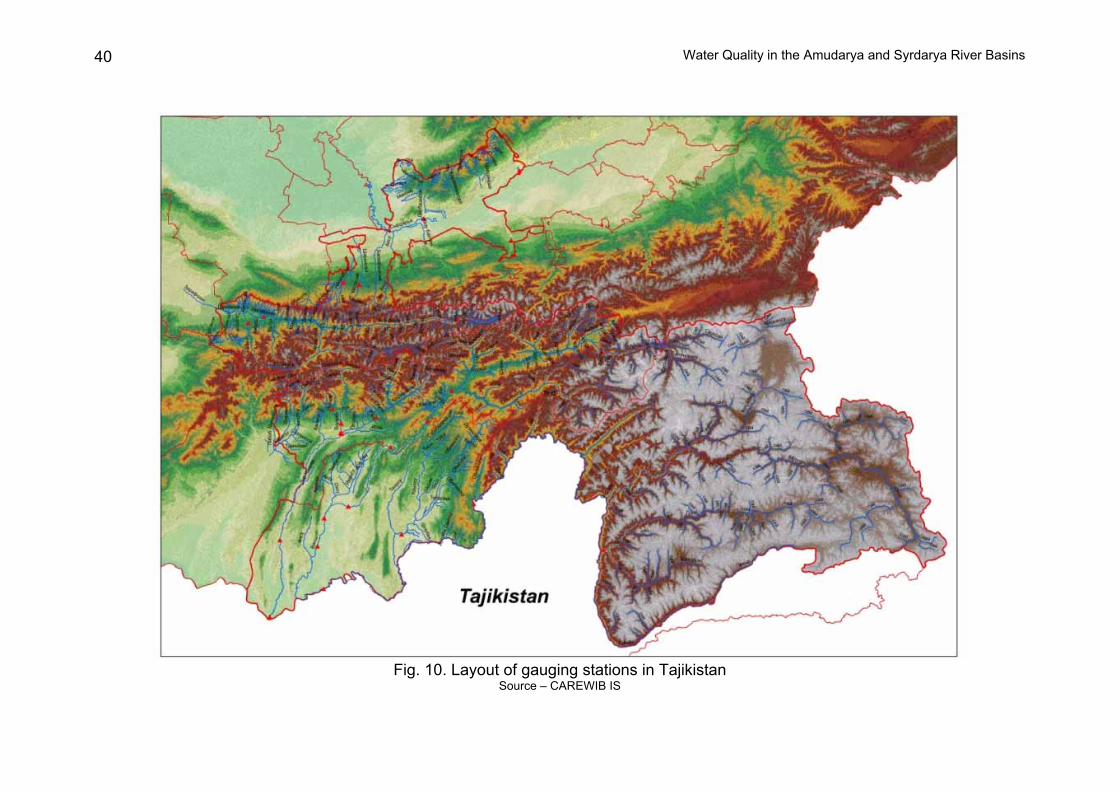
Fig. 10. Layout of gauging stations in Tajikistan
Source – CAREWIB IS

Analytical Report 41
Fig. 11. Layout of gauging stations in Turkmenistan
Source – CAREWIB IS

Water Quality in the Amudarya and Syrdarya River Basins 42
Fig. 12. Layout of gauging stations in Uzbekistan
Source – CAREWIB IS
Analytical Report 43
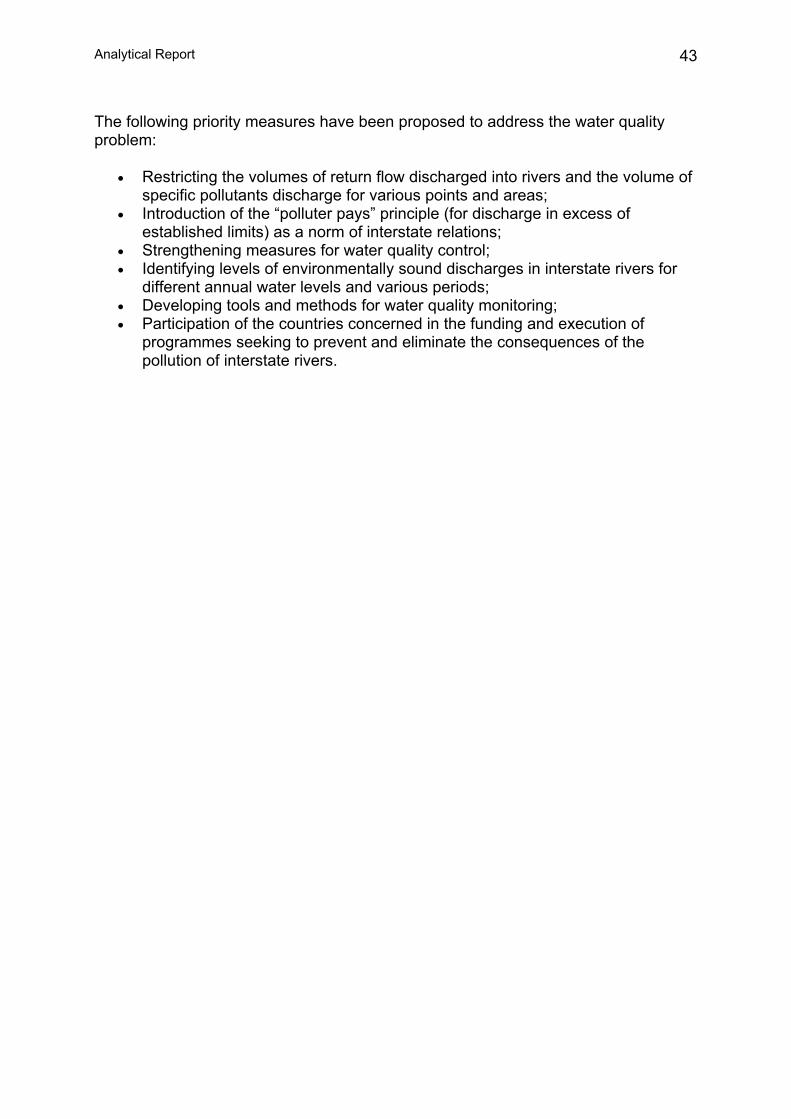
The following priority measures have been proposed to address the water quality problem:
• Restricting the volumes of return flow discharged into rivers and the volume of specific pollutants discharge for various points and areas;
• Introduction of the “polluter pays” principle (for discharge in excess of established limits) as a norm of interstate relations;
• Strengthening measures for water quality control; • Identifying levels of environmentally sound discharges in interstate rivers for
different annual water levels and various periods; • Developing tools and methods for water quality monitoring; • Participation of the countries concerned in the funding and execution of
programmes seeking to prevent and eliminate the consequences of the pollution of interstate rivers.

Water Quality in the Amudarya and Syrdarya River Basins 44
Information on water quality available on the CAWater-Info portal
Knowledge Base
E-Library Aral Sea Basin Initiative: Towards a strategy for sustainable irrigated agriculture with feasible investment in drainage - Synthesis Report (FAO IPTRID, in Russian published by SIC ICWC), 2006 This report synthesizes a number of research works conducted by various organizations that was mobilized by the IPTRID Secretariat. The report includes 14 chapters. Water quality issues are discussed in chapters three (Hydrogeology and salt in ASB) and four (Drainage in ASB). www.cawater-info.net/library/books.htm Collected works on the issues of ecology, drinking water, land reclamation, energy, pumping irrigation in the area of pilot canals (2006) The analysis pinpoints the following pressing issues for the pilot canals:
1. Water-protection zones (WPZ). Political, legal, and financial problems prevent from clear delimiting and determining of ownership and responsibilities for WPS of a pilot canal. As a consequence we have:
a. Polluted WPZ (using as trash, wash, toilet, pumps, and garage places); b. Unauthorized acquisition of land in WPZ; c. Deteriorated water quality (trash, dead animals and drowned,
diseases). 2. Supply of population and domestic animals with water during both growing
and especially non-growing seasons. This issue is very topical in light of significant shortage of drinking water in the area of pilot canals.
3. Land reclamation: groundwater rise in downstream plots due to inefficient water use there.
The collection consists of 3 parts (Part 1 - South Fergana Canal; Part 2 - Aravan-Akbura Canal; and, Part 3 - Khodja-Bakirgan Canal).
www.cawater-info.net/library/books.htm
Irrigation management for combating desertification in the Aral Sea basin. Assessment and tools (2005)

Analytical Report 45
This book is a compilation of scientific and technical texts purposefully prepared to present the main results of the cooperative research project “Crop irrigation management for combating irrigation induced desertification in the Aral Sea Basin”, funded by the European Union, INCO-Copernicus Program.
The application perspective, the implementation conditions and the usefulness for the end users were always present in this research.
The book consists of 6 parts, the water quality issues being addressed in the 4th Part (Chapter 15. Drainage and salinity control: review of related problems in Central Asia).
www.cawater-info.net/library/books.htm
Transition to integrated water resources management (IWRM) in the lowlands and deltas of the Amudarya and Syrdarya (2005) The IWRM, as understood in the CAR refers to a water management system that includes all available water resources and water sources, needing to be used conjunctively, involves coordination of interests of different industries and all levels of water management hierarchy, using a hydro-geographical unit as a basis for the management, and participation of water users and stakeholders in the management process. As such, rational water use and reliable water supply for the population and sectors of the economy can be achieved, with viable ecological systems preserved. The project also focuses on sustainability of water supply to the lowlands and deltas in terms of quantity and quality, depending on water availability. This report consists of 5 chapters, and water quality is dealt with in the first chapter. www.cawater-info.net/library/books.htm Comprehensive solution of the issues related to water and land use in EECCA (collection of scientific papers) (2010) This collection describes the results of 13 research efforts aimed to achieve efficient water use, ensure environmental protection and find ways to overcome obstacles in implementing IWRM. Water quality is described in the work titled «Problems of water quality and public health in the Aral Sea coastal area - Prearalie» www.cawater-info.net/library/books.htm Central Asia Environmental Assessment Reports (2006) – ICSD publications This book contains 5 reports. Water quality issues are considered in the “Assessment report on transboundary water pollution in Central Asia“. www.cawater-info.net/library/icsd.htm

Water Quality in the Amudarya and Syrdarya River Basins 46
Indicator-based environmental review for Uzbekistan (2008) This environmental review was prepared by the joint Project of the Government of Uzbekistan and the United Nations Development Program “Enhancement of the Environmental Indicators Database with GIS application to monitor the state of the environment in Uzbekistan”. This book gives the analysis of the current state of the basic nature elements (atmosphere, water and land resources) and the main environmental problems (climate change, pollution by industrial and domestic wastes, Aral Sea shrinkage) and assesses the state of biodiversity and the processes of desertification. One section discusses the environmental impact on the public health in the Republic. The book consists of 7 chapters, the water quality issues being discussed in Chapter 3 (water quality, water quality in the flow formation zone, and surface water pollution). www.cawater-info.net/library/icsd.htm Environmental Atlas of Uzbekistan (2008) This Atlas was prepared by the joint Project of the Government of Uzbekistan and the United Nations Development Program “Enhancement of the Environmental Indicators Database with GIS application to monitor the state of the environment in Uzbekistan”. The analysis of the current environmental situation and trends is based on environmental indicators reflecting national environmental priorities in line with the international environmental approaches, based on ongoing observations and reliable information that enables predicting effectiveness of the undertaken measures. The selected indicators describe national prioritized environmental issues related to climate change, atmospheric air, water and land resources, biodiversity, public health, current state of the Aral Sea, and waste management. Thematic maps, tables, and graphs are prepared based on the analysis of information in the Database of environmental indicators for 1991-2006 using GIS-technology. Water quality is touched upon on pages 16, 26-31, 51, 58-60. www.cawater-info.net/library/icsd.htm Fundamental principles of national water legislation in area of water quality regulation in the Central Asian countries, Volume 1 (2011) This collection contains legal texts on water quality regulation in the Kyrgyz Republic and in the Republic of Tajikistan:
• Law of the Kyrgyz Republic about environmental protection • Law of the Kyrgyz Republic about drinking water
Analytical Report 47
• Law of the Kyrgyz Republic about sanitary and epidemiological welfare of the population
• Law of the Republic of Tajikistan about provision of sanitary and epidemiological safety of the population
• Law of the Republic of Tajikistan about technical rate setting • Law of the Republic of Tajikistan about drinking water and its supply
www.cawater-info.net/library/carewib.htm Fundamental principles of national water legislation in area of water quality regulation in the Central Asian countries, Volume 2 (2011) This collection contains legal texts on water quality regulation in the Republic of Kazakhstan and Turkmenistan:
• Law of the Republic of Kazakhstan about sanitary and epidemiological welfare of the population
• Law of the Republic of Kazakhstan about technical regulation • Sanitary an epidemiological rules and standards «Sanitary epidemiological
requirements of operation and maintenance of the centralized hot-water supply system»
• Sanitary an epidemiological rules and standards «Sanitary epidemiological requirements of water quality in the centralized drinking water supply systems»
• Law of Turkmenistan about nature protection • Law of Turkmenistan about drinking water
www.cawater-info.net/library/carewib.htm Fundamental principles of national water legislation in area of water quality regulation in the Central Asian countries, Volume 3 (2011) This collection contains legal texts on water quality regulation in the Republic of Uzbekistan:
• Law of the Republic of Uzbekistan about water and water use • Law of the Republic of Uzbekistan about amendments of some legislative
enactments of the Republic of Uzbekistan due to deeper economic reforms in agriculture and water sector
• Law of the Republic of Uzbekistan about state sanitary control • Law of the Republic of Uzbekistan about nature protection • Law of the Republic of Uzbekistan about amendments of the law on nature
protection www.cawater-info.net/library/carewib.htm

Water Quality in the Amudarya and Syrdarya River Basins 48
Knowledge Base «Water and Land Resources Use in the Aral Sea Basin» The Knowledge base covers the following categories:
• physical-geographic characteristics of the region; • water resources; • water use; • desertification and its monitoring; • institutional and legal aspects of water management and financing.
The water quality issues are touched upon in the following sections
• Water quality • Water quality criteria • Drinking water quality • Surface water quality • Groundwater quality • Wastewater quality • Water quality management

Analytical Report 49
The knowledge base also contains the electronic thesaurus “Hydrochemistry”. The background materials on hydrochemistry are structured in such a way that the user can have information on physical-chemical properties, forms of migration, main regulated indicators (MACwater bodies and MACfishery bodies), as well as information on potential sources of pollutants for water bodies. The thesaurus lists the general, aggregate, and individual indicators of water quality reflecting the existing gradation and obligatory parameters for observation programs, mainly those conducted by Hydromets. www.cawater-info.net/bk/water_land_resources_use/
Database
Analytical tools Regional Information System on Land and Water Resources The regional information system on water and land resources in the Aral Sea Basin, first of all, is designed to support decision-making in the water sector of Central Asia. The main objective of IS to serve as a common tool for accounting land and water resources in the Aral Sea basin, including capacities for assessment of diverse aspects of these resources use and effectiveness and for forecasting. It should facilitate sustainable management and control of water resources use. The system gives an opportunity to steadily evaluate water effectiveness in all uses and identify the non-productive losses. The information system shared by all riparian states encourages confidence, solidarity and a sense of mutual responsibility. Available data series since 1980 (time interval: year/season [growing, non-growing]/month). As a whole, the information system includes more than 150 parameters A new section “Water quality” was added to IS during implementation of the project “Water Quality in Central Asia”.

Water Quality in the Amudarya and Syrdarya River Basins 50
Fig. 13 www.cawater-info.net/data_ca/

Analytical Report 51
Database on the Amudarya river basin This section contains the following data on water quality In the tabular form:
• The reach from Kelif gauging station to Tuyamuyun reservoir o Collector-drainage water flowing into the Amudarya river o Salinity of CDW flowing into the Amudarya river
• The reach from Tuyamuyun reservoir to Samanbay gauging station
o Collector-drainage water flowing into the Amudarya river o Salinity of CDW flowing into the Amudarya river
• The reach from Samanbay gauging station to the Aral Sea
o Collector-drainage water flowing into Prearalie o Salinity of CDW flowing into the Amudarya river
• Dynamics of annual salt influx in the Amudarya along its stem stream for
different flow probabilities • History of changes that influence the lower reaches of the Amudarya • History of changes that influence the middle reaches of the Amudarya
In the graphical form:
• Dynamics of annual salt influx in the Amudarya along its stem stream for different flow probabilities
• Dynamics of water and salt inflows in South Prearalie • Dynamics of water and salt inflows to Tuyamuyun
www.cawater-info.net/amudarya/
Database on the Syrdarya river basin This section contains the following data on water quality:
• Dynamics of average annual water salinity in Syrdarya www.cawater-info.net/syrdarya/
Database on the Aral Sea Water quality is touched upon in the following pages of this section: Bathymetry of the Aral Sea (1950-2009) Salt influx in the Aral Sea

Water Quality in the Amudarya and Syrdarya River Basins 52
www.cawater-info/aral/data/
Database «Indicators of sustainable development for the Central Asian countries»
This section, which was developed together with the Interstate Commission for Sustainable Development, contains data on the indicators of sustainable development for the Central Asian countries. The water quality issues are dealt with in the indicator section “Water resources”. www.cawater-info/ecoindicators/

Analytical Report 53
Annex

Water Quality in the Amudarya and Syrdarya River Basins 54
List of abbreviations BOD biochemical oxygen demand BOD5 biochemical oxygen demand for 5 days ZIFC zone of intensive flow consumption FFZ flow formation zone WPI water pollution index CDW collector drainage water CDF collector drainage flow MAC maximum allowable concentration MACwater bodies MAC for water bodies MACfishery bodies MAC for fishery water bodies COD chemical oxygen demand CHAKIR Chirchik-Angren irrigation district
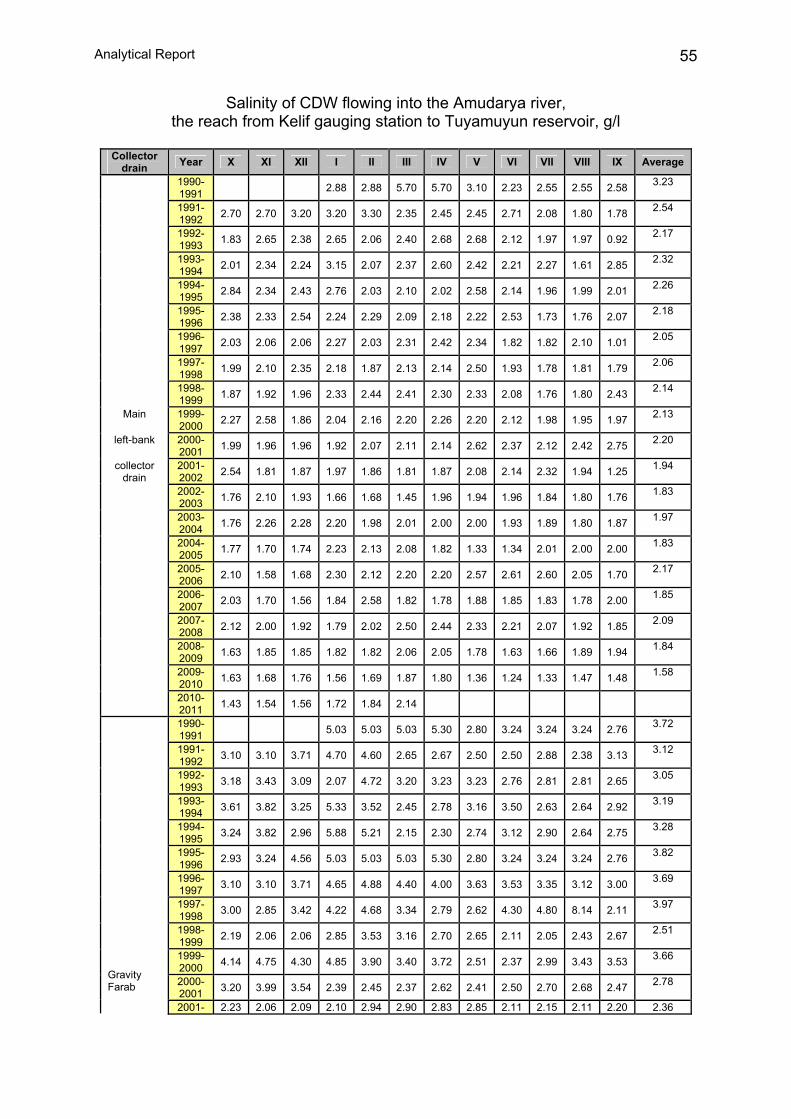
Analytical Report 55
Salinity of CDW flowing into the Amudarya river, the reach from Kelif gauging station to Tuyamuyun reservoir, g/l
Collector drain Year X XI XII I II III IV V VI VII VIII IX Average
1990-1991
2.88 2.88 5.70 5.70 3.10 2.23 2.55 2.55 2.58 3.23
1991-1992 2.70 2.70 3.20 3.20 3.30 2.35 2.45 2.45 2.71 2.08 1.80 1.78 2.54
1992-1993 1.83 2.65 2.38 2.65 2.06 2.40 2.68 2.68 2.12 1.97 1.97 0.92 2.17
1993-1994 2.01 2.34 2.24 3.15 2.07 2.37 2.60 2.42 2.21 2.27 1.61 2.85 2.32
1994-1995 2.84 2.34 2.43 2.76 2.03 2.10 2.02 2.58 2.14 1.96 1.99 2.01 2.26
1995-1996 2.38 2.33 2.54 2.24 2.29 2.09 2.18 2.22 2.53 1.73 1.76 2.07 2.18
1996-1997 2.03 2.06 2.06 2.27 2.03 2.31 2.42 2.34 1.82 1.82 2.10 1.01 2.05
1997-1998 1.99 2.10 2.35 2.18 1.87 2.13 2.14 2.50 1.93 1.78 1.81 1.79 2.06
1998-1999 1.87 1.92 1.96 2.33 2.44 2.41 2.30 2.33 2.08 1.76 1.80 2.43 2.14
Main 1999-2000 2.27 2.58 1.86 2.04 2.16 2.20 2.26 2.20 2.12 1.98 1.95 1.97 2.13
left-bank 2000-2001 1.99 1.96 1.96 1.92 2.07 2.11 2.14 2.62 2.37 2.12 2.42 2.75 2.20
collector drain
2001-2002 2.54 1.81 1.87 1.97 1.86 1.81 1.87 2.08 2.14 2.32 1.94 1.25 1.94
2002-2003 1.76 2.10 1.93 1.66 1.68 1.45 1.96 1.94 1.96 1.84 1.80 1.76 1.83
2003-2004 1.76 2.26 2.28 2.20 1.98 2.01 2.00 2.00 1.93 1.89 1.80 1.87 1.97
2004-2005 1.77 1.70 1.74 2.23 2.13 2.08 1.82 1.33 1.34 2.01 2.00 2.00 1.83
2005-2006 2.10 1.58 1.68 2.30 2.12 2.20 2.20 2.57 2.61 2.60 2.05 1.70 2.17
2006-2007 2.03 1.70 1.56 1.84 2.58 1.82 1.78 1.88 1.85 1.83 1.78 2.00 1.85
2007-2008 2.12 2.00 1.92 1.79 2.02 2.50 2.44 2.33 2.21 2.07 1.92 1.85 2.09
2008-2009 1.63 1.85 1.85 1.82 1.82 2.06 2.05 1.78 1.63 1.66 1.89 1.94 1.84
2009-2010 1.63 1.68 1.76 1.56 1.69 1.87 1.80 1.36 1.24 1.33 1.47 1.48 1.58
2010-2011 1.43 1.54 1.56 1.72 1.84 2.14
1990-1991
5.03 5.03 5.03 5.30 2.80 3.24 3.24 3.24 2.76 3.72
1991-1992 3.10 3.10 3.71 4.70 4.60 2.65 2.67 2.50 2.50 2.88 2.38 3.13 3.12
1992-1993 3.18 3.43 3.09 2.07 4.72 3.20 3.23 3.23 2.76 2.81 2.81 2.65 3.05
1993-1994 3.61 3.82 3.25 5.33 3.52 2.45 2.78 3.16 3.50 2.63 2.64 2.92 3.19
1994-1995 3.24 3.82 2.96 5.88 5.21 2.15 2.30 2.74 3.12 2.90 2.64 2.75 3.28
1995-1996 2.93 3.24 4.56 5.03 5.03 5.03 5.30 2.80 3.24 3.24 3.24 2.76 3.82
1996-1997 3.10 3.10 3.71 4.65 4.88 4.40 4.00 3.63 3.53 3.35 3.12 3.00 3.69
1997-1998 3.00 2.85 3.42 4.22 4.68 3.34 2.79 2.62 4.30 4.80 8.14 2.11 3.97
1998-1999 2.19 2.06 2.06 2.85 3.53 3.16 2.70 2.65 2.11 2.05 2.43 2.67 2.51
1999-2000 4.14 4.75 4.30 4.85 3.90 3.40 3.72 2.51 2.37 2.99 3.43 3.53 3.66
2000-2001 3.20 3.99 3.54 2.39 2.45 2.37 2.62 2.41 2.50 2.70 2.68 2.47 2.78 Gravity
Farab
2001- 2.23 2.06 2.09 2.10 2.94 2.90 2.83 2.85 2.11 2.15 2.11 2.20 2.36

Water Quality in the Amudarya and Syrdarya River Basins 56
Collector drain Year X XI XII I II III IV V VI VII VIII IX Average
2002 2002-
2003 2.18 2.12 2.25 1.53 1.86 1.94 2.24 2.74 2.49 2.31 1.77 1.83 2.11
2003-2004 2.09 3.83 2.88 3.23 2.07 2.21 2.20 2.00 2.22 2.23 1.89 1.92 2.30
2004-2005 1.99 2.10 2.10 2.70 0.00 2.12 2.18 2.13 2.00 2.02 1.93 1.96 1.95
2005-2006 1.78 1.75 2.13 2.65 2.38 2.43 2.69 2.95 2.83 2.26 2.20 2.19 2.38
2006-2007 1.95 2.00 1.96 2.10 2.03 2.01 2.18 2.84 3.00 2.86 3.56 3.98 2.51
2007-2008 3.92 3.56 3.50 1.87 2.06 1.68 1.16 2.36 2.06 2.93 1.96 1.93 2.32
2008-2009 1.98 1.83 2.06 1.87 3.24 2.10 2.20 1.90 1.85 1.92 1.95 2.40 2.09
2009-2010 2.61 2.78 2.70 1.98 2.11 2.29 3.40 2.13 2.00 1.70 1.67 1.87 2.29
2010-2011 2.16 2.09 2.02 1.91 2.47 2.02
1990-1991
4.25 4.25 3.85 3.85 3.30 4.63 3.96 3.96 3.53 4.05
1991-1992 4.81 4.81 4.15 5.00 5.10 4.57 2.61 2.50 2.50 3.27 2.71 2.85 3.57
1992-1993 2.47 4.69 3.89 4.22 4.23 3.38 4.35 4.35 2.65 2.91 2.91 2.99 3.57
1993-1994 5.53 4.97 3.62 4.47 4.48 3.45 3.37 3.08 3.20 4.24 3.34 2.82 3.79
1994-1995 4.56 4.97 3.80 6.75 4.79 3.09 3.30 4.04 3.12 2.28 2.23 2.27 3.75
1995-1996 3.03 3.24 5.00 4.32 5.10 1.41 2.81 3.45 2.95 2.10 2.37 2.66 3.17
1996-1997 2.95 3.26 3.29 3.56 3.50 3.70 4.38 4.62 4.28 4.34 4.20 3.90 3.97
1997-1998 4.47 6.12 5.55 6.76 3.57 3.84 2.26 2.14 2.20 2.39 2.18 3.68 3.03
1998-1999 2.49 3.57 3.57 2.91 2.50 3.21 3.53 1.83 2.50 1.95 2.20 2.15 3.00
1999-2000 2.84 3.41 3.92 3.00 2.43 2.14 2.53 3.22 2.12 2.14 2.27 2.34 2.68
2000-2001 2.32 2.33 0.00 3.86 2.99 3.25 3.04 3.55 2.91 3.20 3.34 3.62 2.93 Main
Darganata 2001-2002 3.90 3.00 0.00 0.00 3.25 2.49 2.49 3.23 3.12 3.56 3.22 1.46 2.74
2002-2003 1.67 1.46 0.00 4.27 3.68 2.55 2.29 2.52 1.82 1.43 1.07 1.00 1.96
2003-2004 1.90 2.22 1.05 2.26 2.12 3.06 3.29 3.41 3.45 3.56 3.83 3.21 2.65
2004-2005 3.51 3.79 3.79 3.99 5.19 4.65 4.88 2.32 2.74 1.23 1.16 1.44 2.88
2005-2006 3.71 4.40 4.00 2.88 3.58 5.98 3.54 4.30 2.25 5.94 5.89 5.25 4.79
2006-2007 4.29 3.93 3.39 4.62 4.43 4.13 4.25 4.46 4.43 3.67 3.18 2.80 3.86
2007-2008 3.57 3.20 2.87 3.16 3.12 3.91 1.77 1.80 3.00 3.65 4.42 4.80 3.21
2008-2009 2.20 2.09 5.05 2.35 4.17 2.60 3.32 5.60 2.75 4.37 3.30 4.00 4.00
2009-2010 4.20 4.10 4.00 4.31 4.15 3.64 4.29 3.93 3.90 4.50 4.63 4.57 4.20
2010-2011 4.88 4.11 3.25 3.27 3.81 3.38
1990-1991
1.52 1.52 1.36 1.36 1.40 1.40 1.44 1.44 1.24 1.35
1991-1992 1.10 1.10 1.30 1.20 1.20 1.36 1.36 1.33 1.33 1.13 1.19 1.00 1.25
1992-1993 1.20 1.14 1.26 1.13 1.04 0.94 1.27 1.27 1.40 1.00 1.00 4.81 1.58
1993-1994 1.00 2.05 1.23 1.67 1.21 1.18 1.02 1.22 1.12 1.15 1.18 1.13 1.26
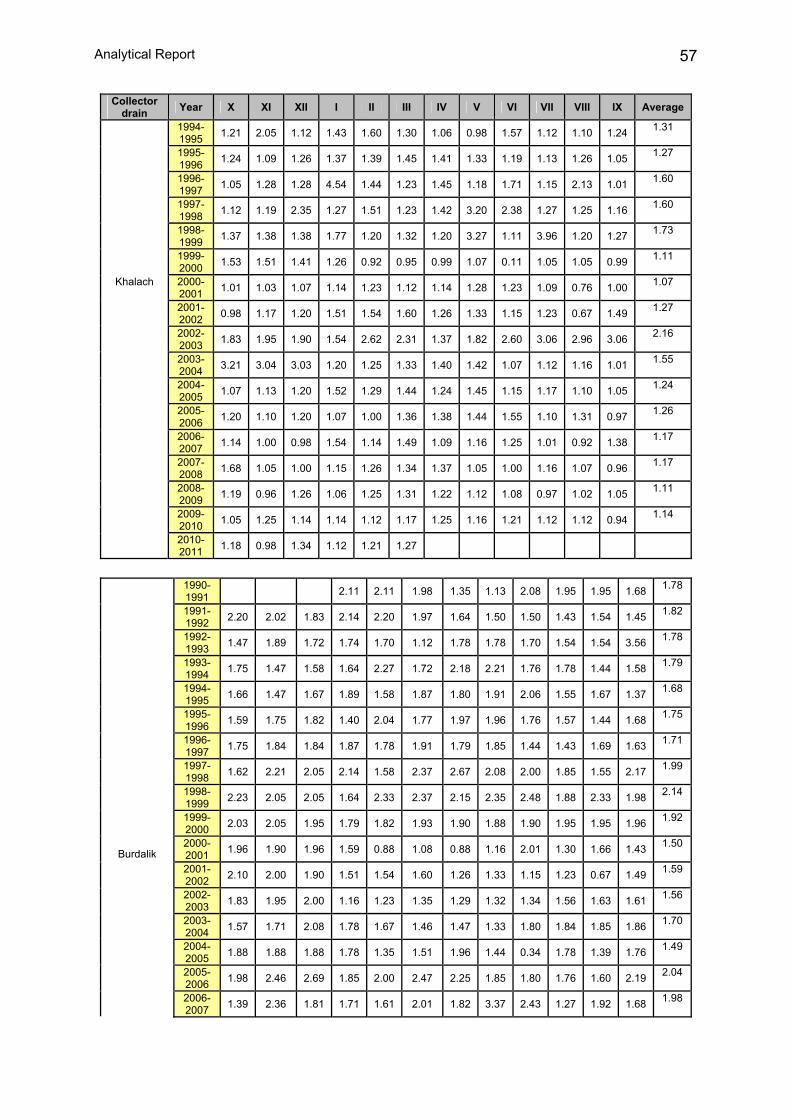
Analytical Report 57
Collector drain Year X XI XII I II III IV V VI VII VIII IX Average
1994-1995 1.21 2.05 1.12 1.43 1.60 1.30 1.06 0.98 1.57 1.12 1.10 1.24 1.31
1995-1996 1.24 1.09 1.26 1.37 1.39 1.45 1.41 1.33 1.19 1.13 1.26 1.05 1.27
1996-1997 1.05 1.28 1.28 4.54 1.44 1.23 1.45 1.18 1.71 1.15 2.13 1.01 1.60
1997-1998 1.12 1.19 2.35 1.27 1.51 1.23 1.42 3.20 2.38 1.27 1.25 1.16 1.60
1998-1999 1.37 1.38 1.38 1.77 1.20 1.32 1.20 3.27 1.11 3.96 1.20 1.27 1.73
1999-2000 1.53 1.51 1.41 1.26 0.92 0.95 0.99 1.07 0.11 1.05 1.05 0.99 1.11
2000-2001 1.01 1.03 1.07 1.14 1.23 1.12 1.14 1.28 1.23 1.09 0.76 1.00 1.07
2001-2002 0.98 1.17 1.20 1.51 1.54 1.60 1.26 1.33 1.15 1.23 0.67 1.49 1.27
2002-2003 1.83 1.95 1.90 1.54 2.62 2.31 1.37 1.82 2.60 3.06 2.96 3.06 2.16
2003-2004 3.21 3.04 3.03 1.20 1.25 1.33 1.40 1.42 1.07 1.12 1.16 1.01 1.55
2004-2005 1.07 1.13 1.20 1.52 1.29 1.44 1.24 1.45 1.15 1.17 1.10 1.05 1.24
2005-2006 1.20 1.10 1.20 1.07 1.00 1.36 1.38 1.44 1.55 1.10 1.31 0.97 1.26
2006-2007 1.14 1.00 0.98 1.54 1.14 1.49 1.09 1.16 1.25 1.01 0.92 1.38 1.17
2007-2008 1.68 1.05 1.00 1.15 1.26 1.34 1.37 1.05 1.00 1.16 1.07 0.96 1.17
2008-2009 1.19 0.96 1.26 1.06 1.25 1.31 1.22 1.12 1.08 0.97 1.02 1.05 1.11
2009-2010 1.05 1.25 1.14 1.14 1.12 1.17 1.25 1.16 1.21 1.12 1.12 0.94 1.14
Khalach
2010-2011 1.18 0.98 1.34 1.12 1.21 1.27
1990-1991
2.11 2.11 1.98 1.35 1.13 2.08 1.95 1.95 1.68 1.78
1991-1992 2.20 2.02 1.83 2.14 2.20 1.97 1.64 1.50 1.50 1.43 1.54 1.45 1.82
1992-1993 1.47 1.89 1.72 1.74 1.70 1.12 1.78 1.78 1.70 1.54 1.54 3.56 1.78
1993-1994 1.75 1.47 1.58 1.64 2.27 1.72 2.18 2.21 1.76 1.78 1.44 1.58 1.79
1994-1995 1.66 1.47 1.67 1.89 1.58 1.87 1.80 1.91 2.06 1.55 1.67 1.37 1.68
1995-1996 1.59 1.75 1.82 1.40 2.04 1.77 1.97 1.96 1.76 1.57 1.44 1.68 1.75
1996-1997 1.75 1.84 1.84 1.87 1.78 1.91 1.79 1.85 1.44 1.43 1.69 1.63 1.71
1997-1998 1.62 2.21 2.05 2.14 1.58 2.37 2.67 2.08 2.00 1.85 1.55 2.17 1.99
1998-1999 2.23 2.05 2.05 1.64 2.33 2.37 2.15 2.35 2.48 1.88 2.33 1.98 2.14
1999-2000 2.03 2.05 1.95 1.79 1.82 1.93 1.90 1.88 1.90 1.95 1.95 1.96 1.92
Burdalik 2000-2001 1.96 1.90 1.96 1.59 0.88 1.08 0.88 1.16 2.01 1.30 1.66 1.43 1.50
2001-2002 2.10 2.00 1.90 1.51 1.54 1.60 1.26 1.33 1.15 1.23 0.67 1.49 1.59
2002-2003 1.83 1.95 2.00 1.16 1.23 1.35 1.29 1.32 1.34 1.56 1.63 1.61 1.56
2003-2004 1.57 1.71 2.08 1.78 1.67 1.46 1.47 1.33 1.80 1.84 1.85 1.86 1.70
2004-2005 1.88 1.88 1.88 1.78 1.35 1.51 1.96 1.44 0.34 1.78 1.39 1.76 1.49
2005-2006 1.98 2.46 2.69 1.85 2.00 2.47 2.25 1.85 1.80 1.76 1.60 2.19 2.04
2006-2007 1.39 2.36 1.81 1.71 1.61 2.01 1.82 3.37 2.43 1.27 1.92 1.68 1.98

Water Quality in the Amudarya and Syrdarya River Basins 58
2007-2008 1.70 2.02 2.23 1.92 1.88 1.64 1.71 1.64 1.48 2.16 1.03 1.65 1.69
2008-2009 1.90 1.68 1.88 2.02 1.40 1.50 1.57 1.50 1.44 1.16 1.46 3.78 1.73
2009-2010 3.29 2.90 1.81 1.77 2.07 1.37 1.84 2.00 2.23 4.87 3.19 3.37 2.57
2010-2011 3.97 4.78 2.95 1.90 1.78 1.50
1990-1991
0.97 1.20 3.50 3.50 3.08 3.45 4.33 4.33 3.70 3.22
1991-1992 3.60 3.65 3.22 3.60 3.70 4.65 4.45 4.36 4.35 4.84 4.64 4.57 4.16
1992-1993 4.38 4.41 4.29 3.12 3.12 4.90 5.44 5.44 5.67 5.44 5.44 4.57 4.96
1993-1994 5.08 4.80 5.00 2.81 4.07 3.96 3.36 4.09 4.48 4.39 3.45 2.52 4.08
1994-1995 3.10 2.65 4.69 5.01 5.45 12.04 5.51 4.17 3.86 8.86 4.35 4.87 5.47
1995-1996 4.52 10.11 4.14 4.91 7.67 3.83 9.60 4.03 3.84 7.11 5.09 1.97 5.57
1996-1997 3.72 5.56 5.56 4.16 4.30 4.50 4.69 4.68 4.74 4.15 4.75 4.18 4.55
1997-1998 1.60 4.80 4.45 4.37 5.00 4.72 4.98 5.35 4.41 4.84 4.85 3.94 4.58
1998-1999 4.06 4.10 4.10 4.77 5.11 5.58 4.29 3.48 6.76 5.61 4.57 4.93 4.71
1999-2000 4.11 3.78 3.59 4.00 4.91 5.00 4.19 4.00 4.53 5.24 5.80 5.94 4.55
Charshangi 2000-2001 4.53 4.04 4.38 3.96 4.05 4.15 4.02 3.22 2.41 2.89 3.94 4.98 3.94
2001-2002 3.59 3.44 3.29 3.87 3.97 4.08 4.15 4.07 4.11 4.08 4.18 3.92 3.92
2002-2003 3.68 3.29 3.20 3.81 3.11 2.64 1.83 2.84 3.87 5.52 5.64 5.89 3.69
2003-2004 6.05 11.43 6.96 3.90 3.90 4.05 4.17 3.80 3.78 3.90 4.00 6.60 4.90
2004-2005 4.99 4.73 4.73 2.85 3.34 5.78 4.38 8.81 4.29 4.43 3.82 3.94 4.81
2005-2006 3.71 3.91 3.44 2.85 3.39 5.78 4.38 8.81 4.29 4.43 3.82 3.94 4.82
2006-2007 3.71 3.91 3.44 3.34 4.74 3.40 4.57 6.05 4.77 3.54 6.15 4.24 4.27
2007-2008 3.96 4.97 4.86 5.04 4.60 3.75 4.10 4.10 4.02 3.55 3.39 4.11 4.13
2008-2009 4.29 4.68 4.51 4.09 6.52 4.00 3.98 3.83 5.38 4.61 5.04 5.82 4.78
2009-2010 8.06 7.00 6.27 5.74 5.51 6.35 4.42 4.24 3.50 2.40 5.46 4.05 5.13
2010-2011 3.51 5.12 5.04 4.96 5.54 4.70
1990-1991
3.26 3.26 0.57 3.64 0.79 2.93 3.16 3.16 2.02 2.47
1991-1992 2.65 2.67 3.24 3.20 3.25 3.19 2.06 2.00 2.00 2.19 2.60 2.35 2.58
1992-1993 2.84 1.71 2.53 1.69 1.69 1.98 2.03 2.03 2.38 2.68 2.68 1.95 2.19
1993-1994 1.24 1.90 2.10 6.97 1.88 3.18 2.79 2.77 1.08 1.10 1.42 1.18 2.12
1994-1995 3.99 1.90 2.39 2.38 5.00 4.60 3.29 4.44 1.52 1.00 1.63 4.16 3.12
1995-1996 2.56 1.60 1.99 1.89 5.40 1.95 4.13 4.31 2.69 3.45 3.36 3.25 3.08
1996-1997 4.54 4.44 4.44 2.13 2.85 2.23 2.50 2.43 1.03 3.15 2.41 2.89 2.86
1997-1998 1.69 1.80 1.96 1.61 2.06 2.67 3.93 3.34 1.58 2.12 2.45 2.87 2.39
1998-1999 4.09 1.56 1.56 1.61 1.99 3.04 2.83 2.73 2.61 2.49 2.64 2.01 2.48
1999-2000 2.16 2.79 2.83 2.12 2.18 2.32 2.55 2.90 2.81 2.75 2.84 2.92 2.54
Khodjamba 2000-2001 3.00 3.02 3.04 1.64 2.24 2.25 2.23 1.68 2.49 2.05 2.11 2.39 2.35
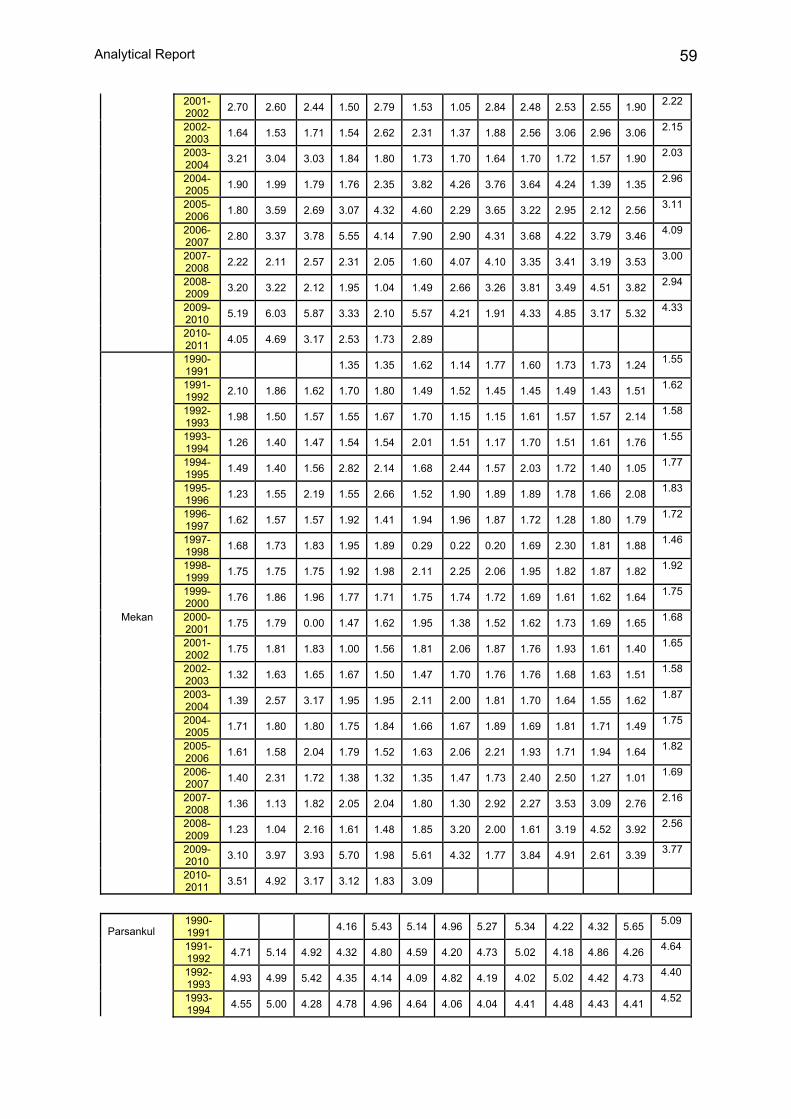
Analytical Report 59
2001-2002 2.70 2.60 2.44 1.50 2.79 1.53 1.05 2.84 2.48 2.53 2.55 1.90 2.22
2002-2003 1.64 1.53 1.71 1.54 2.62 2.31 1.37 1.88 2.56 3.06 2.96 3.06 2.15
2003-2004 3.21 3.04 3.03 1.84 1.80 1.73 1.70 1.64 1.70 1.72 1.57 1.90 2.03
2004-2005 1.90 1.99 1.79 1.76 2.35 3.82 4.26 3.76 3.64 4.24 1.39 1.35 2.96
2005-2006 1.80 3.59 2.69 3.07 4.32 4.60 2.29 3.65 3.22 2.95 2.12 2.56 3.11
2006-2007 2.80 3.37 3.78 5.55 4.14 7.90 2.90 4.31 3.68 4.22 3.79 3.46 4.09
2007-2008 2.22 2.11 2.57 2.31 2.05 1.60 4.07 4.10 3.35 3.41 3.19 3.53 3.00
2008-2009 3.20 3.22 2.12 1.95 1.04 1.49 2.66 3.26 3.81 3.49 4.51 3.82 2.94
2009-2010 5.19 6.03 5.87 3.33 2.10 5.57 4.21 1.91 4.33 4.85 3.17 5.32 4.33
2010-2011 4.05 4.69 3.17 2.53 1.73 2.89
1990-1991
1.35 1.35 1.62 1.14 1.77 1.60 1.73 1.73 1.24 1.55
1991-1992 2.10 1.86 1.62 1.70 1.80 1.49 1.52 1.45 1.45 1.49 1.43 1.51 1.62
1992-1993 1.98 1.50 1.57 1.55 1.67 1.70 1.15 1.15 1.61 1.57 1.57 2.14 1.58
1993-1994 1.26 1.40 1.47 1.54 1.54 2.01 1.51 1.17 1.70 1.51 1.61 1.76 1.55
1994-1995 1.49 1.40 1.56 2.82 2.14 1.68 2.44 1.57 2.03 1.72 1.40 1.05 1.77
1995-1996 1.23 1.55 2.19 1.55 2.66 1.52 1.90 1.89 1.89 1.78 1.66 2.08 1.83
1996-1997 1.62 1.57 1.57 1.92 1.41 1.94 1.96 1.87 1.72 1.28 1.80 1.79 1.72
1997-1998 1.68 1.73 1.83 1.95 1.89 0.29 0.22 0.20 1.69 2.30 1.81 1.88 1.46
1998-1999 1.75 1.75 1.75 1.92 1.98 2.11 2.25 2.06 1.95 1.82 1.87 1.82 1.92
1999-2000 1.76 1.86 1.96 1.77 1.71 1.75 1.74 1.72 1.69 1.61 1.62 1.64 1.75
2000-2001 1.75 1.79 0.00 1.47 1.62 1.95 1.38 1.52 1.62 1.73 1.69 1.65 1.68
2001-2002 1.75 1.81 1.83 1.00 1.56 1.81 2.06 1.87 1.76 1.93 1.61 1.40 1.65
2002-2003 1.32 1.63 1.65 1.67 1.50 1.47 1.70 1.76 1.76 1.68 1.63 1.51 1.58
2003-2004 1.39 2.57 3.17 1.95 1.95 2.11 2.00 1.81 1.70 1.64 1.55 1.62 1.87
2004-2005 1.71 1.80 1.80 1.75 1.84 1.66 1.67 1.89 1.69 1.81 1.71 1.49 1.75
2005-2006 1.61 1.58 2.04 1.79 1.52 1.63 2.06 2.21 1.93 1.71 1.94 1.64 1.82
2006-2007 1.40 2.31 1.72 1.38 1.32 1.35 1.47 1.73 2.40 2.50 1.27 1.01 1.69
2007-2008 1.36 1.13 1.82 2.05 2.04 1.80 1.30 2.92 2.27 3.53 3.09 2.76 2.16
2008-2009 1.23 1.04 2.16 1.61 1.48 1.85 3.20 2.00 1.61 3.19 4.52 3.92 2.56
2009-2010 3.10 3.97 3.93 5.70 1.98 5.61 4.32 1.77 3.84 4.91 2.61 3.39 3.77
Mekan
2010-2011 3.51 4.92 3.17 3.12 1.83 3.09
1990-1991
4.16 5.43 5.14 4.96 5.27 5.34 4.22 4.32 5.65 5.09
1991-1992 4.71 5.14 4.92 4.32 4.80 4.59 4.20 4.73 5.02 4.18 4.86 4.26 4.64
1992-1993 4.93 4.99 5.42 4.35 4.14 4.09 4.82 4.19 4.02 5.02 4.42 4.73 4.40
Parsankul
1993-1994 4.55 5.00 4.28 4.78 4.96 4.64 4.06 4.04 4.41 4.48 4.43 4.41 4.52

Water Quality in the Amudarya and Syrdarya River Basins 60
1994-1995 4.06 3.80 4.00 4.89 6.49 4.69 4.32 4.48 5.41 5.90 6.48 5.66 5.12
1995-1996 4.94 4.71 4.41 5.30 4.86 4.22 4.86 4.00 4.04 4.59 4.55 4.40 4.53
1996-1997 4.35 5.96 5.33 5.24 5.90 4.81 5.14 5.93 4.97 5.48 5.45 4.84 5.27
1997-1998 5.42 4.03 5.05 4.96 4.04 4.47 5.03 4.66 4.04 4.39 5.58 4.91 4.63
1998-1999 5.16 4.70 4.55 4.09 4.71 4.30 4.42 4.49 4.09 4.50 4.71 4.16 4.49
1999-2000 3.74 2.97 4.61 4.09 4.17 4.65 6.00 4.96 4.91 3.89 4.79 4.96 4.58
2000-2001 5.53 5.16 5.68 4.78 4.52 4.03 4.84 4.87 4.72 5.06 5.11 5.55 4.74
2001-2002 5.77 5.90 4.66 4.37 4.55 4.15 4.62 5.29 4.52 5.95 4.97 5.58 4.83
2002-2003 4.21 4.63 4.73 4.25 4.61 4.73 4.67 4.49 4.49 4.90 4.95 5.29 4.66
2003-2004 4.42 4.44 5.33 5.37 5.60 5.88 4.01 4.17 4.70 4.42 4.47 4.42 4.88
2004-2005 5.37 5.06 3.21 4.85 3.27 4.98 4.34 4.43 4.58 4.64 4.93 4.77 4.47
2005-2006 4.22 4.65 4.90 4.57 4.19 4.81 5.81 4.94 4.16 4.50 5.37 4.81 4.77
2006-2007 4.65 5.16 5.19 4.47 3.66 4.19 5.73 4.90 4.89 4.24 4.37 4.62 4.54
2007-2008 4.34 4.88 4.45 4.71 4.61 4.64 4.76 5.12 5.84 5.06 5.61 4.58 4.84
2008-2009 3.90 4.56 4.13
2009-2010
2010-2011
1990-1991
1991-1992
1992-1993
1993-1994
1994-1995
1995-1996
7.13 6.25 5.37 6.96 6.71 6.79 4.45 4.49 5.00
1996-1997 4.44 4.63 4.63 7.23 6.87 5.88 4.95 5.10 5.21 7.04 6.85 7.59 6.15
1997-1998 7.00 6.94 7.03 7.60 6.87 5.88 5.39 7.20 6.35 6.28 5.30 6.86 6.53
1998-1999 7.12 6.55 6.55 6.34 7.61 7.31 5.27 6.18 5.82 6.28 6.29 6.81 6.40
1999-2000 7.54 6.47 6.23 5.99 6.08 5.95 6.03 6.77 6.52 5.08 8.13 7.93 6.88
2000-2001 7.66 7.32 0.00 6.56 6.95 6.05 7.85 8.94 10.03 9.84 7.84 7.45 7.91
2001-2002 7.32 7.19 6.96 5.90 4.58 4.57 4.90 2.86 1.68 7.60 7.46 7.23 5.33
2002-2003 0.00 6.88 0.00 2.97 3.14 3.31 2.89 1.92 2.50 2.04 1.17 1.70 2.27
2003-2004 1.20 1.27 1.05 6.82 6.76 6.41 6.56 6.66 6.46 6.36 6.28 6.52 6.43
2004-2005 4.94 5.84 5.82 6.32 6.25 5.97 6.39 5.96 6.11 6.20 6.10 6.42 6.14
2005-2006 6.67 6.21 5.68 6.02 5.66 6.50 7.08 7.04 7.56 8.04 7.80 6.87 7.09
2006-2007 6.03 6.00 5.95 6.15 5.89 6.35 6.17 8.04 7.50 7.00 7.34 7.58 7.04
2007-2008 6.59 6.25 6.11 6.00 6.00 5.73 6.63 7.45 7.07 6.97 7.28 7.18 6.93
South Karshi
2008-2009 7.09 7.14 5.98 5.27 5.65 5.24 5.72 6.38 6.44 7.22 7.22 7.00 6.62

Analytical Report 61
2009-2010 7,09 7,18 6,93 6,27 5,98 3,36 5,77 6,03 5,91 5,87 3,82 5,85 5,62
2010-2011
6,31 5,99 5,94 5,85 5,88 4,78
Source: Database of BWO “Amudarya”
Salinity of CDW flowing into the Amudarya river, the reach from Tuyamuyun reservoir to Samanbay gauging station, g/l
Collector drain Year X XI XII I II III IV V VI VII VIII IX Aver
age 1990-1991 6.81 5.91 6.02 6.13 5.49 5.02 4.77 3.92 5.35 5.31 1991-1992 5.19 5.10 5.12 5.88 6.36 6.33 6.55 8.12 5.02 4.85 3.47 3.96 5.53 1992-1993 5.37 8.00 4.71 8.80 7.24 6.48 6.33 5.21 5.87 4.80 3.77 4.54 5.53 1993-1994 4.76 4.73 4.53 4.57 5.94 4.99 6.44 4.73 4.81 4.57 5.21 4.43 5.03 1994-1995 3.38 3.51 4.88 4.74 4.62 5.27 6.25 5.15 5.30 5.06 4.90 4.45 4.98 1995-1996 4.36 4.16 3.70 3.91 4.83 5.57 5.19 6.28 5.67 5.50 3.47 4.12 4.86 1996-1997 3.80 4.58 3.85 4.93 5.66 6.42 6.49 5.76 4.14 5.36 5.84 5.12 5.20 1997-1998 4.81 4.45 4.36 4.46 5.32 4.92 5.77 5.01 4.34 4.32 2.55 3.12 4.43 1998-1999 3.74 3.47 3.80 5.36 3.94 4.82 4.54 3.90 4.93 3.22 3.98 4.46 4.18
1999-2000 2.47 3.93 3.58 5.35 5.42 4.06 5.54 5.15 4.84 6.46 4.27 3.12 4.50
2000-2001 5.37 4.61 4.23 4.53 5.73 4.85 5.38 5.39 4.88 4.31 6.61 7.02 5.16
2001-2002 5.50 5.40 5.44 5.48 5.37 5.45 6.12 5.09 3.86 2.64 2.65 3.17 4.34
2002-2003 3.68 3.96 4.18 3.85 3.89 3.85 3.86 4.24 3.23 2.42 2.47 3.32 3.49
2003-2004 4.61 6.36 3.34 5.21 4.19 4.74 4.59 4.49 3.46 2.94 2.85 3.54 4.07
2004-2005 4.78 4.71 4.50 3.41 4.47 3.88 4.04 3.35 3.61 2.77 2.71 3.78 3.72
2005-2006 2.90 4.61 3.97 4.42 4.94 3.37 5.23 3.85 3.77 2.92 2.81 3.84 3.75
2006-2007 4.65 4.22 2.99 4.02 5.09 4.07 4.47 3.74 2.76 2.76 2.98 4.32 3.74
2007-2008 3.40 4.40 4.31 3.84 3.97 5.02 3.78 4.56 4.42 3.46 3.01 3.51 4.12
Beruny
2008-2009 * 3.67 4.11 3.76
* The collector flows towards Prearalie into lakes. Source: Database of BWO “Amudarya”
Salinity of CDW flowing into the Amudarya river, the reach from Samanbay gauging station to the Aral Sea, g/l
Collector drain Year X XI XII I II III IV V VI VII VIII IX Average
1990-1991 4.46 5.48 3.19 4.30 2.40 2.87 3.37 2.09 2.79 2.99 1991-1992 2.37 2.14 2.20 2.96 3.74 4.06 4.13 4.67 2.32 2.19 2.75 2.72 2.69 1992-1993 8.11 9.11 2.79 4.29 5.59 4.68 3.89 3.07 2.88 2.31 2.09 4.06 3.21 1993-1994 2.82 3.40 2.38 2.94 1.60 3.08 4.52 3.56 2.17 2.31 2.42 2.83 2.62 1994-1995 2.83 3.28 1.75 3.17 2.58 3.31 5.63 3.18 3.58 3.42 2.67 2.80 3.19 1995-1996 2.97 3.20 2.03 3.28 1.87 2.83 3.54 3.01 2.26 2.20 2.25 2.50 2.54 1996-1997 4.03 3.33 3.50 4.28 4.34 4.54 5.57 2.60 3.28 3.36 3.46 3.67 3.79 1997-1998 4.15 4.56 4.11 1.70 2.87 3.17 3.30 3.89 1.57 1.56 1.67 3.42 2.48 1998-1999 4.38 2.37 3.03 3.05 3.91 2.86 5.04 2.49 2.52 2.15 2.06 2.75 2.93 1999-2000 3.19 4.18 3.36 4.28 4.18 3.44 3.21 6.60 4.20 5.69 5.98 4.24 4.16
KC - 1 2000-2001 4.20 4.35 3.74 3.21 3.09 3.62 4.05 4.25 3.56 3.69 4.80 4.35 3.87 2001-2002 0.00 0.00 0.00 0.00 0.00 3.27 3.90 3.00 2.07 1.65 2.13 2.44 2.07 2002-2003 3.13 2.25 2.55 2.56 1.90 2.64 4.18 4.92 1.78 2.77 2.04 2.50 2.88 2003-2004 3.05 2.62 2.05 2.85 4.85 2.94 3.01 3.28 2.18 1.87 1.95 2.28 2.49 2004-2005 2.40 3.24 3.91 2.66 3.36 2.45 3.56 2.96 2.24 1.61 1.80 2.56 2.34 2005-2006 2.52 2.22 1.75 2.87 2.68 4.89 4.33 3.64 1.95 2.25 2.70 2.96 2.72

Water Quality in the Amudarya and Syrdarya River Basins 62
Collector drain Year X XI XII I II III IV V VI VII VIII IX Average
2006-2007 4.43 4.36 2.44 3.89 4.87 4.49 5.56 3.56 2.43 2.31 2.40 2.67 3.48 2007-2008 3.18 3.13 2.55 3.46 3.24 3.39 3.83 4.84 4.34 2.99 3.17 2.97 3.38 2008-2009 3.04 2.67 3.16 2009-2010 3.27 3.15 4.35 0.00 2.87 2.19 2.80 1.79 1.44 2010-2011 3.17 2.07 1.68 3.11 4.09 4.09 1990-1991 5.15 4.56 4.73 5.80 1.69 2.63 2.64 2.57 3.53 3.27 1991-1992 3.62 3.15 4.27 4.85 2.46 5.56 5.51 4.57 3.76 3.02 2.47 2.63 3.34 1992-1993 3.94 2.82 3.47 4.96 4.07 4.37 4.13 3.09 3.01 2.80 3.22 4.03 3.49 1993-1994 4.84 2.45 3.80 3.69 3.33 3.72 3.74 4.04 3.09 2.16 2.13 2.46 2.95 1994-1995 1.90 3.70 2.55 5.56 3.97 4.20 5.06 4.14 4.14 3.34 2.45 2.95 3.58 1995-1996 3.60 5.25 3.96 4.70 3.88 3.89 4.17 4.12 3.11 3.14 2.24 3.51 3.42 1996-1997 3.39 3.67 4.75 4.47 4.67 4.81 6.06 5.01 4.72 4.94 4.30 3.17 4.55 1997-1998 5.07 4.96 8.68 6.89 5.68 3.05 4.53 4.25 2.38 2.41 2.13 4.42 3.61 1998-1999 4.61 2.16 2.94 4.36 4.98 3.32 5.14 3.54 3.09 2.50 2.41 2.63 3.32 1999-2000 4.86 4.66 2.97 4.94 4.90 4.30 5.18 6.91 6.45 3.25 11.34 0.00 5.03
2000-2001 0.00 0.00 0.00 0.00 0.00 0.00 0.00 0.00 0.00 0.00 0.00 0.00 0.00 2001-2002 0.00 0.00 0.00 0.00 0.00 0.00 0.00 0.00 3.11 1.61 1.84 1.90 1.97 2002-2003 2.47 2.55 3.32 4.00 4.25 3.97 3.73 3.99 3.38 1.85 2.21 2.46 2.81 2003-2004 5.79 2.66 2.19 3.32 5.05 6.92 6.18 3.63 2.90 2.20 3.33 4.26 3.71 2004-2005 3.53 5.77 5.11 3.91 4.35 3.26 5.57 4.53 3.18 2.31 2.68 3.81 3.70 2005-2006 3.09 3.33 3.51 4.73 5.73 4.82 5.23 4.46 3.79 2.78 3.43 3.42 3.86 2006-2007 6.05 5.06 3.60 4.03 6.22 4.58 6.23 5.85 4.84 3.00 4.52 2.83 4.62 2007-2008 5.27 3.78 3.78 3.12 4.90 4.52 4.16 2.95 6.94 8.37 2.88 6.24 4.76 2008-2009 5.70 5.42 5.55 2009-2010 5.57 4.72 4.84 0.00 5.46 4.01 3.06 4.18 4.67
KC - 3
2010-2011 4.04 2.11 0.81 4.05 3.40 3.40
1990-1991 4.13 4.30 3.50 3.66 2.70 2.55 2.49 1.94 2.36 2.40 1991-1992 3.08 1.66 2.11 3.74 1.80 2.93 4.83 3.74 2.39 2.31 2.38 2.27 2.51 1992-1993 3.56 3.74 3.57 2.73 2.10 4.35 2.50 2.29 2.05 1.96 1.64 2.28 2.06 1993-1994 3.75 3.04 3.21 3.23 1.74 2.11 2.23 2.40 3.12 1.73 1.98 2.29 2.30 1994-1995 2.89 2.97 2.20 2.09 1.97 2.76 4.12 2.82 2.76 2.89 2.25 2.57 2.69 1995-1996 3.25 4.70 1.99 2.22 3.65 2.33 2.83 2.94 2.78 2.52 2.90 2.31 2.73 1996-1997 2.83 2.49 2.58 2.59 2.55 2.12 3.10 2.95 2.72 3.18 3.18 2.65 2.83 1997-1998 2.07 3.11 3.38 3.53 1.57 2.64 3.20 2.19 2.11 2.74 1.88 2.09 2.27 1998-1999 2.99 3.77 3.54 3.26 3.88 3.65 3.42 3.26 2.10 2.67 2.06 3.20 2.98 1999-2000 3.44 2.66 2.72 3.78 2.43 3.17 4.27 5.28 5.21 6.11 6.03 4.51 4.25
KC - 4 2000-2001 3.80 4.66 4.86 5.09 4.14 0.00 0.00 0.00 0.00 0.00 0.00 0.00 4.39 2001-2002 0.00 0.00 0.00 0.00 0.00 0.00 0.00 2.28 1.75 1.70 1.59 2.24 1.84 2002-2003 1.12 1.05 2.58 2.76 3.74 2.46 2.42 2.76 2.22 1.93 2.21 2.47 2.27 2003-2004 1.74 2.77 3.33 2.28 2.18 2.37 3.05 2.42 2.60 2.51 1.43 1.44 2.18 2004-2005 1.57 2.77 2.93 3.24 3.44 1.61 3.22 3.74 4.01 2.54 0.88 1.21 2.25 2005-2006 1.63 1.57 1.18 1.55 1.17 2.57 2.86 1.38 2.02 1.75 1.79 2.00 1.87 2006-2007 2.07 2.31 2.22 2.28 3.27 3.58 3.45 2.71 2.87 2.62 2.91 1.86 2.60 2007-2008 2.57 2.92 2.67 4.40 3.82 3.83 3.88 2.34 5.35 4.81 4.98 0.00 3.64 2008-2009 0.00 0.00 0.00 2009-2010 2.62 3.38 3.60 0.00 1.68 1.84 1.57 1.65 2.03 2010-2011 1.20 1.71 0.97 2.95 1.96 2.62 1990-1991 4.91 4.86 4.02 4.84 4.26 2.91 2.59 2.27 3.07 3.51 1991-1992 4.08 4.49 4.03 4.28 4.60 4.82 4.54 5.13 3.96 3.39 2.84 2.00 3.79 1992-1993 3.07 3.12 3.46 4.50 4.59 4.66 3.96 3.79 3.50 3.72 2.20 3.52 3.60 1993-1994 3.26 2.99 3.93 4.77 3.92 3.32 2.76 4.63 3.72 2.47 2.51 2.86 3.26 1994-1995 2.62 3.13 2.57 3.28 4.58 4.23 4.95 3.92 4.63 4.37 4.46 3.10 4.01 1995-1996 3.78 4.46 3.86 4.71 4.61 4.09 4.23 5.29 4.50 2.30 2.72 3.33 3.70 1996-1997 4.92 3.13 2.82 2.72 3.41 4.15 5.42 4.54 3.89 4.29 4.21 3.17 3.96 1997-1998 3.95 4.78 2.34 3.78 4.16 3.78 4.50 4.48 3.40 2.26 2.34 2.16 3.31

Analytical Report 63
1998-1999 3.13 2.84 2.80 2.63 3.66 4.35 4.62 3.47 3.44 2.76 2.06 2.52 3.06 1999-2000 3.42 4.79 3.39 3.66 4.47 3.71 5.32 5.44 4.47 5.52 5.42 5.40 4.33
2000-2001 5.06 4.49 4.53 6.21 6.75 6.66 4.71 7.62 5.47 5.07 5.92 6.23 5.75 2001-2002 6.45 4.49 4.61 5.15 6.16 5.92 6.17 5.37 4.45 3.98 2.40 1.38 3.53 2002-2003 1.99 1.92 2.59 3.38 4.05 3.06 2.90 3.67 2.97 2.08 1.83 1.86 2.41 2003-2004 3.17 3.18 2.60 3.08 4.18 3.65 4.84 5.17 3.60 1.93 2.11 2.68 3.34 2004-2005 2.50 4.09 2.61 2.97 3.50 3.40 3.84 3.76 3.14 2.01 2.15 2.24 2.91 2005-2006 2.87 1.72 2.31 2.85 4.31 2.91 4.19 4.12 3.65 2.21 2.26 2.41 2.93 2006-2007 3.92 4.62 4.20 2.93 4.32 3.68 5.02 6.83 3.74 2.45 4.17 2.46 3.88 2007-2008 3.11 2.37 4.30 3.12 3.58 3.90 3.05 4.69 3.27 3.20 2.96 3.71 3.47 2008-2009 3.65 3.68 3.77 2009-2010 2.32 2.11 3.40 0.00 4.00 2.40 2.85 2.52 2.40
KKC
2010-2011 1.99 1.32 1.20 1.95 2.17 2.50
1990-1991 0.00 0.00 0.00 0.00 2.23 2.52 1.59 1.69 2.61 1.96 1991-1992 0.00 0.00 0.00 0.00 0.00 0.00 0.00 3.02 1.54 2.05 1.20 4.73 1.86 1992-1993 4.14 0.00 2.20 0.00 0.00 0.00 0.00 0.00 2.04 2.32 2.53 1.93 2.03 1993-1994 0.00 0.00 0.00 0.00 0.00 0.00 0.00 2.27 2.29 1.33 1.96 1.95 1.85 1994-1995 0.00 0.00 0.00 0.00 1.70 2.02 2.74 1.94 3.10 2.89 2.69 3.12 2.50 1995-1996 0.00 0.00 0.00 0.00 2.35 1.44 3.85 2.16 2.20 2.31 2.18 1.70 2.27 1996-1997 0.00 1.05 2.20 0.00 0.00 1.89 0.00 2.92 2.75 2.86 2.50 2.01 2.36 1997-1998 0.00 0.00 0.00 0.00 0.00 3.42 2.82 1.93 1.09 1.31 1.17 2.53 1.49 1998-1999 2.37 1.62 2.42 0.00 3.62 3.66 0.00 2.69 1.74 2.51 2.07 3.46 2.35 1999-2000 3.61 4.07 2.78 3.29 3.25 2.04 3.51 0.00 0.00 0.00 0.00 0.00 2.83 2000-2001 0.00 0.00 0.00 0.00 0.00 0.00 0.00 0.00 0.00 0.00 0.00 0.00 0.00 2001-2002 0.00 0.00 0.00 0.00 0.00 0.00 0.00 0.00 5.10 2.18 1.88 1.22 1.79 2002-2003 1.43 0.95 1.45 0.00 2.62 0.00 0.00 0.00 0.00 1.30 0.00 1.24 0.63 2003-2004 0.00 0.00 0.00 2.60 4.18 2.80 4.51 0.00 2.56 2.16 2.19 2.07 2.37 2004-2005 1.86 0.00 0.00 1.57 3.69 2.88 2.75 3.78 1.58 1.40 1.49 2.05 1.90 2005-2006 0.00 2.12 1.93 1.40 1.03 4.19 3.24 2.79 2.94 1.67 1.62 1.76 2.17 2006-2007 4.05 0.00 2.95 2.27 2.82 2.55 1.71 2.84 2.52 2.52 2.70 2.62 2.58 2007-2008 0.00 0.00 2.99 2.21 0.00 2.65 3.06 0.00 0.00 0.00 0.00 0.00 2.86 2008-2009 0.00 0.00 0.00 2009-2010 2.54 0.00 3.15 0.00 3.03 1.58 2.26 1.92 1.12
Ustyurt
2010-2011 1.38 0.00 1.37 1.15 2.18 2.12
Source: Database of BWO “Amudarya”

Water Quality in the Amudarya and Syrdarya River Basins 64
Bathymetry of the Aral Sea (1950-2009)
Inflow from the river, km3/yr Amudarya Syrdarya Year
s Q s Q
Rai
nfal
l, km
3
Evap
orat
ion
, km
3
Leve
l, m
(B
S)
Wat
er
mas
s,
km3
Wat
er
surfa
ce
area
, km
2
Sal
inity
, g/
l
1950 0.47 41.0 0.58 11.9 9.22 66.06 52.90 1058.0 65607 10.17 1951 0.52 33.4 0.55 13.2 8.07 59.19 52.77 1049.0 64914 9.74 1952 0.41 55.2 0.46 18.8 8.78 62.62 52.79 1050.0 64964 10.67 1953 0.41 54.8 0.45 19.5 9.63 64.11 52.94 1059.0 65706 9.82 1954 0.41 55.1 0.43 21.1 10.87 62.87 53.21 1076.0 67042 10.21 1955 0.47 41.9 0.49 16.7 9.17 66.13 53.27 1079.0 67290 10.13 1956 0.44 48.0 0.50 16.4 9.30 67.20 53.32 1082.0 67537 10.19 1957 0.54 30.9 0.63 9.5 8.51 68.11 53.27 1080.0 67389 10.01 1958 0.42 52.3 0.60 10.9 7.94 68.93 53.23 1078.0 67240 10.42 1959 0.45 46.3 0.47 18.3 9.92 70.05 53.39 1086.0 67884 10.19 1960 0.47 42.0 0.43 21.1 9.41 71.13 53.50 1093.0 68478 9.93 1961 0.57 31.1 1.14 8.9 6.59 70.43 53.38 1087.0 67983 9.97 1962 0.51 38.4 1.60 4.0 8.63 70.93 53.07 1067.0 66350 10.80 1963 0.56 31.8 1.28 7.0 11.56 70.64 52.72 1045.0 64568 10.58 1964 0.51 39.2 1.10 9.4 8.12 64.04 52.58 1038.0 63974 10.13 1965 0.62 25.3 1.71 3.2 8.48 66.35 52.40 1026.0 63308 10.81 1966 0.53 35.6 1.33 6.4 6.64 71.13 51.98 1000.0 62014 11.81 1967 0.58 29.3 1.38 5.9 7.51 57.82 51.66 980.9 61060 11.02 1968 0.54 34.4 1.49 4.9 6.03 67.35 51.35 960.7 60299 11.49 1969 0.36 70.6 1.03 10.6 9.06 52.31 51.39 963.7 60408 10.91 1970 0.56 32.4 1.32 6.5 7.22 62.03 51.44 971.7 60692 11.20 1971 0.65 20.6 1.04 5.6 5.81 59.83 51.11 949.0 59885 11.38 1972 0.59 24.2 1.15 4.8 5.78 55.34 50.65 917.8 58935 11.95 1973 0.40 43.5 0.99 6.0 8.95 56.45 50.32 898.9 58494 11.95 1974 1.01 6.9 2.16 1.3 4.75 60.18 49.92 874.4 57924 13.02 1975 0.92 9.2 2.47 0.8 4.43 59.99 49.09 824.2 56757 13.40 1976 0.85 11.3 2.88 0.3 5.79 51.09 48.36 785.3 55718 14.57 1977 0.99 7.2 2.98 0.2 5.04 45.75 47.74 749.2 54792 15.44 1978 0.68 18.9 2.79 0.4 6.42 52.52 47.06 717.6 53981 14.97 1979 0.87 10.9 1.80 2.1 4.87 52.14 46.45 683.4 52989 15.09 1980 0.92 9.3 1.96 1.7 9.73 50.24 45.76 648.7 51743 16.80 1981 1.33 6.9 2.03 1.7 11.92 47.11 45.19 620.0 50714 17.70 1982 2.75 0.3 2.31 1.3 8.52 38.50 44.39 579.8 49270 18.80 1983 2.06 2.4 3.20 0.5 4.51 47.59 43.55 537.5 47753 20.30 1984 1.23 8.0 3.53 0.3 5.99 44.33 42.75 502.7 46243 21.90 1985 2.11 2.2 3.53 0.3 7.19 42.52 41.95 475.0 44382 22.90 1986 2.69 0.46 3.73 0.20 0.11 0.98 41.94 448.00 41047 22.9 1987 1.17 8.68 2.58 1.00 0.10 1.00 41.10 432.00 38831 23.9 1988 0.72 17.81 1.01 5.00 0.11 0.94 40.29 401.00 37410 25.0 1989 2.30 1.51 1.42 3.10 0.15 0.97 39.75 380.00 36562 28.0 1990 1.33 6.89 1.67 2.41 0.70 1.04 39.08 354.00 35349 30.0 1991 1.33 10.48 1.89 2.58 0.80 1.06 38.24 323.00 33831 32.0 1992 0.78 24.27 1.73 3.34 0.10 0.92 37.56 299.00 32649 34.0 1993 1.06 15.52 1.17 7.50 0.90 0.83 37.20 286.00 32017 35.0 1994 0.93 18.72 1.09 8.46 0.12 0.97 36.95 278.00 31564 36.0 1995 2.13 3.24 1.52 4.53 0.90 0.98 36.60 266.00 30879 37.0 1996 1.87 4.92 1.47 4.89 0.19 0.97 36.11 250.00 29872 42.0 1997 2.68 0.73 1.64 3.82 0.24 0.93 35.48 230.00 28530 43.5 1998 0.89 20.07 1.18 7.41 0.17 0.88 34.80 210.00 26959 49.8 1999 1.97 4.17 1.32 6.03 0.90 1.00 34.24 194.00 25519 50.6 2000 2.51 1.37 1.83 2.86 0.13 0.96 33.80 181.00 24266 55.8 2001 2.87 0.09 1.79 3.03 0.16 0.95 33.30 169.00 22745 58.6 2002 30.90 70.0

Analytical Report 65
Inflow from the river, km3/yr Amudarya Syrdarya Year
s Q s Q
Rai
nfal
l, km
3
Evap
orat
ion
, km
3
Leve
l, m
(B
S)
Wat
er
mas
s,
km3
Wat
er
surfa
ce
area
, km
2
Sal
inity
, g/
l
2003 30.34 78.7 2004 30.51 86.3 2005 30.33 125 19600 90.0 2006 30.08 92.1 2007 29.51 95.3 2008 28.31 97.6 2009 27.53 105 13500 102 Source: INTAS-0511 REBASOWS PROJECT
Salt influx in the Aral Sea
Mass of precipitating salts, Mt Year
Volume of water body,
km3
Salt mass, Mt Salinity, g/l Sedimentation Precipitation in
the coastal zone Ice Sum
1950 1058 10760 10.17 9.97 0.00 13.93 23.90 1951 1049 10217 9.74 8.77 0.08 14.56 23.41 1952 1050 11204 10.67 14.11 0.03 14.85 28.98 1953 1059 10399 9.82 13.97 -0.24 16.84 30.56 1954 1076 10986 10.21 14.10 -0.55 18.64 32.19 1955 1079 10930 10.13 10.73 -0.01 14.75 25.47 1956 1082 11026 10.19 11.83 -0.02 12.63 24.45 1957 1080 10811 10.01 7.37 0.05 14.68 22.10 1958 1078 11233 10.42 13.14 0.03 14.17 27.34 1959 1086 11066 10.19 12.10 -0.06 15.89 27.94 1960 1093 10853 9.93 11.63 -0.01 17.50 29.13 1961 1087 10837 9.97 8.24 0.28 15.16 23.69 1962 1067 11524 10.80 8.40 0.80 14.74 23.94 1963 1045 11056 10.58 8.13 0.69 11.70 20.52 1964 1038 10515 10.13 10.56 0.03 15.56 26.14 1965 1026 11091 10.81 5.82 0.63 14.40 20.85 1966 1000 11810 11.81 9.21 1.31 14.91 25.42 1967 981 10810 11.02 7.75 0.53 15.30 23.58 1968 961 11038 11.49 8.76 1.06 17.39 27.22 1969 964 10514 10.91 18.42 -0.35 18.50 36.57 1970 972 10883 11.20 8.65 -0.27 14.94 23.32 1971 949 10800 11.38 5.88 1.31 12.89 20.08 1972 918 10968 11.95 6.62 0.70 14.89 22.20 1973 899 10742 11.95 11.58 0.01 14.46 26.04 1974 874 11385 13.02 2.24 0.44 16.98 19.66 1975 824 11044 13.40 2.14 2.08 14.92 19.14 1976 785 11442 14.57 2.81 1.87 17.83 22.52 1977 749 11568 15.44 1.76 2.12 19.23 23.11 1978 718 10742 14.97 5.30 1.39 18.03 24.72 1979 683 10313 15.09 3.54 1.08 18.02 22.64 1980 649 10898 16.80 3.10 0.66 22.08 25.84 1981 620 10974 17.70 2.42 0.95 16.29 19.66 1982 580 10900 18.80 0.32 5.33 21.89 27.53 1983 538 10911 20.30 0.70 6.77 13.62 21.09 1984 503 11009 21.90 2.92 1.71 27.52 32.15 1985 475 10878 22.90 0.68 3.83 21.99 26.50 1986 432.00 10325 23.90 0.04 8.29 23.71 32.05 1987 401.00 10025 25.00 3.57 4.14 23.16 30.87 1988 380.00 10640 28.00 10.13 1.32 20.40 31.85 1989 354.00 10620 30.00 1.07 5.75 20.88 27.70 1990 323.00 10336 32.00 3.87 6.87 21.25 31.99 1991 299.00 10166 34.00 6.59 3.87 24.14 34.60 1992 286.00 10010 35.00 15.28 0.38 23.17 38.83 1993 278.00 10008 36.00 11.40 1.13 29.89 42.42 1994 266.00 9842 37.00 15.99 1.18 30.28 47.45 1995 250.00 10500 42.00 3.00 5.27 25.37 33.64

Water Quality in the Amudarya and Syrdarya River Basins 66
Mass of precipitating salts, Mt Year
Volume of water body,
km3
Salt mass, Mt Salinity, g/l Sedimentation Precipitation in
the coastal zone Ice Sum
1996 230.00 10005 43.50 3.74 6.20 33.76 43.70 1997 210.00 10458 49.80 1.89 9.60 27.18 38.67 1998 194.00 9816 50.60 17.86 3.34 33.19 54.40 1999 181.00 10100 55.80 10.14 5.61 33.65 49.41 2000 169.00 9903 58.60 0.63 11.23 27.43 39.28 Source: INTAS-0511 REBASOWS PROJECT
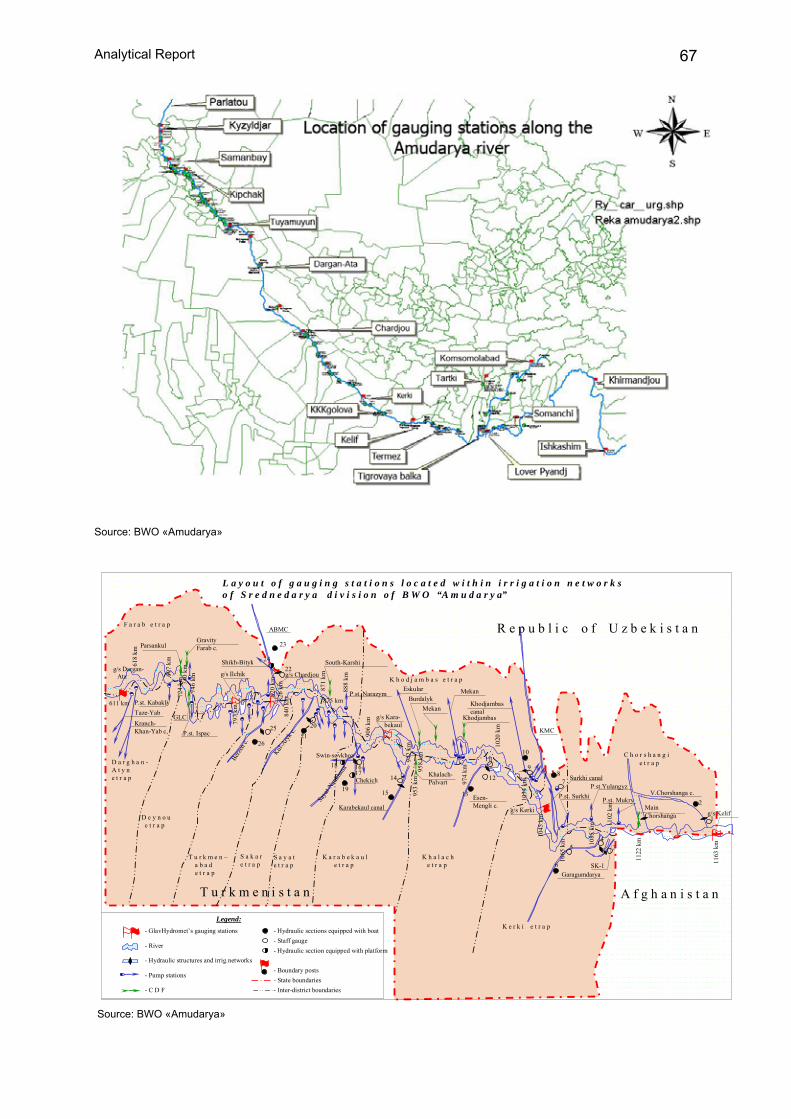
Analytical Report 67
Source: BWO «Amudarya»
611 km
g/s Dargan-Ata
618
km
797
km
820
km82
6 km 87
1 km
888
km
906
km
953
km 974
km
1020
km
1045
km
1065
km
1102
km
1122
km
1163
km
g/s Kelif
V.Chorshanga c.
Main Chorshanga
C h o r s h a n g ie t r a p
P.st. Mukry
P.st.YulangyzP.st. Surkhi
Surkhi canal
KMC
SK-1Garagumdarya
g/s Kerki
Esen-Mengli c.
Khodjambascanal
Khodjambas
Mekan
MekanBurdalyk
Eskular
Khalach-Palvart
Karabekaul canal
K h o d j a m b a s e t r a p
g/s Kara-bekaul
ABMC
g/s Chardjou
Shikh-Bityk
g/s Ilchik
GravityFarab c.Parsankul
F a r a b e t r a p
Taze-YabKranch-Khan-Yab c,
P.st. Kabakly
GLC
P.st. Ispac
Berzen
c.
Kul-Aryk
c.
Chekich
R e p u b l i c o f U z b e k i s t a n
K e r k i e t r a p
K h a l a c he t r a p
K a r a b e k a u le t r a p
S a y a te t r a p
S a k a re t r a p
T u r k m e n –a b a de t r a p
D e y n o ue t r a p
D a r g h a n -A t y ne t r a p
L a y o u t o f g a u g i n g s t a t i o n s l o c a t e d w i t h i n i r r i g a t i o n n e t w o r k s o f S r e d n e d a r y a d i v i s i o n o f B W O “A m u d a r y a”
Legend: - GlavHydromet’s gauging stations
- River
- Hydraulic structures and irrig.networks
- Pump stations
- C D F
- Hydraulic sections equipped with boat- Staff gauge- Hydraulic section equipped with platform
- Boundary posts- State boundaries- Inter-district boundaries
1
2
34
5
6
78
9
1011
12
13
14
15
1617
19
2025
26
22
23
24
A f g h a n i s t a n
697
km
740
km74
6 km
840
km 875 km
942
km
958
km
103 4
km
1085
km
724
km
21
Swin-sovkhoz18
Saya
t-Nau
khan
a
T u r k m e n i s t a n
South-Karshi
P.st. Narazym
Source: BWO «Amudarya»

Water Quality in the Amudarya and Syrdarya River Basins 68
Layout of gauging stationsat head diversion structures of
VerkhneDarya Division
Tupalang reservoir
Sher
abad
cana
l
South Surkhan.reservoir
R e p u b l i k o f T a j i k i s t a n
g/s Komsomolabad
Nurek reservoir
Dangaratunnel
Yavantunnel
Right branch Р-2
Left br
anch
LuchobKazan-Guzar
U z b e k i s t a n
Surkhandarya province
Sher
abad
arya
rive
rK
aras
ur.
Zakh canal
Surk
hand
arya
r.
Kap
hirn
igha
nr.
Nizhne (Lower)-Kaphirniganreservoir
Aktepareservoir
JaikhunKatta-Khum
Uchkyzylreservoir
Termez city
Am
u-Za
ng
g/s
Man
guza
r
GVK
Gulbakhor
Gulzor
g/s Aivadj(non-oper.)
g/s Kelif1163 km
1277 kmg/s Termez g/s Verkhne-Amudarya
1409 km
g/s TigrovayabalkaTeshik-tash
Yakkadin
Djilikul
1240
km
1248
km
1260
km
1278
km
1290
km
1332
km
1235
km
Palvan-Tugai
ВА-6
Central spill
Pump st.Kumsangir
g/s Lower Pyandj
P.st.GaroutyAkjar
Mekhnatabad
Kyzyl-Kala
Shurabad main canal
North branchK
umsa
ngar
cana
l
Kurgan-TyubeVakhsh
r.
VMC
SMC
Head HPP
Zigirty
171
Ilyak r.
Baylazi hydroscheme
249
227
Sary-Guzar
Nurek hydroscheme& HPP
Dushanbe r.
Varzob r.
Kharyngon
r.
Var
zob
r.
Luc
hob
r.
Kar
atog
r.Sher
kent
r.
Mac
hada
rya
rive
rSarbo r.
373
Roghunreservoir
Dek
hkan
abad
MC
Samanchi
Kyzylsu r.
Yakhs
u r. Van
chr. Ba
rtang
r.
Gun
tr.
Obi-Surkh r.
351
g/s Khirmanjow
Pyandj r.
A F G H A N I S T A N
LegendGlavHydromet’s gauging stationsRiverCanal
HydrostructuresState boundaries
CDFPump stations
Staff gaugeHydrauli section equipped with platformHydraulic section equipped with boat
Source: BWO «Amudarya»
A r a l
s e a
g/s Parlatou
Kunya-Darya Bozatau canal
Kazakdarya canal
g/s Kyzyldjar
Dautkullake
Kegeily
Abadyarmysh
Kuvanchzharma
Kyzketken
Bozataug/s Samanbay
g/s Kipchak
Djumabayi-Saka
Left obkeden
Mashinniy canal
Sovbet canal
Taza-Yab canal
VDSS canalTransit
Kha
n-Y
ab(Sov
iet-Y
ab)
GRE
S
Suelli canal
Parallelniycanal
Karabaily waterworks
g/s RaushanUTVS
Tallyk canalKarajar canal
Raushan canal
Zhinishke canal
g/s Takhyatas
Mezhdurechiereservoir
Sudoche lake
R e p u b l i c o f U z b e k i s t a n
Layout of gauging stations of the Nizhnedarya Division of BWO “Amudarya”
Amudarya districtof the Republic of Karakalpakstan
29 km
102
km 128 km179 km
215 km
230
km
283
km
T u r k m e n i s t a n
R e p u b l i c o f U z b e k i s t a n
1
23
45
6
7
89
1011
12 13
14 15
Legend:
- GlavHydromet’s gauging stations- River- Hydraulic structures and irrig.networks
- Hydraulic section equipped with platform- Hydraulic sections equipped with boat
- Staff gauge
- Boundaryposts
- Pump stations
Source: BWO «Amudarya»
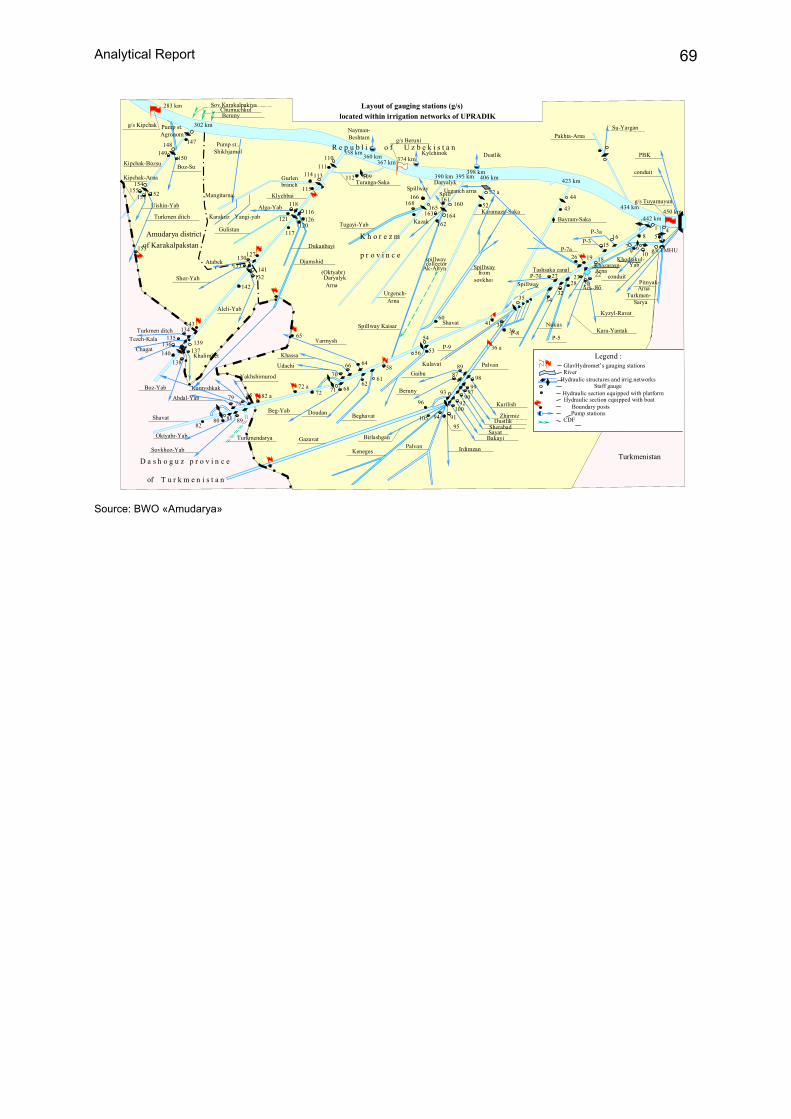
Analytical Report 69
Layout of gauging stations (g/s)located within irrigation networks of UPRADIK
Sov.KarakalpakiyaChumuchkulBeruny
283 km
g/s Kipchak
Kipchak-Bozsu Boz-Su
Kipchak-Arna
Uishin-Yab
Turkmen ditch
Amudarya districtof Karakalpakstan
Atabek
Gulistan
Gurlenbranch
Klychbai
Alga-Yab
Dukanbayi
Djamshid
Pakhta-Arna
PBK
conduit
g/s Tuyamuyun
Bayram-SakaKaramazy-Saka
DustlikKylchinok
g/s Beruni
Nayman-Beshtam
374 km
Turanga-Saka
R e p u b l i c o f U z b e k i s t a n
Shor-Yab
Turkmen ditchTezeh-Kala
Chagat
Aleli-Yab
Khalimbet
Yarmysh
Khassa
Udachi
Yakhshimurod
Boz-Yab Kamyshkak
Abdal-Yab
ShavatBeg-Yab Doudan
Oktyabr-Yab
Sovkhoz-Yab
Turkmendarya Gazavat
D a s h o g u z p r o v i n c e
of T u r k m e n i s t a n
KulavatGaibu
Beruny
Beghavat
Birlashgan
KenegesPalvan Irdimzan
Kurilish
ZhirmizDustlik
SherabadSayat
Bakayi
Р-9
Palvan
Spillway Kaisar
Urgench-Arna
(Oktyabr)DaryalykArna
spillwaycollector
Ak-Altyn Spillwayfrom
sovkhoz
МашинЯрган
(не дейст.)
Shavat
P-8P-5
Nukus
Р-3аР-3
Р-7а
Tashsaka canal
Spillway
450 km
Khodjakul-YabKhazarasp-
Arnaconduit
Pitnyak-Arna
Turkmen-Sarya
Kyzyl-Ravat
Kara-Yantak
Р-7б
Ась-Яб
SpillwaySpill
KazakTugayi-Yab
Su-Yargan
K h o r e z m
p r o v i n c e
148 147
302 km
149150
154155 152157
153
358 km110
111109112
360 km367 km
114113
115
118116126121
120117
127130133 141
132142
143134
135136140
138
139137
390 km 395 km398 km
406 km
166168
165161
160
164162
163
52 а
52
46
4544
43 434 km
423 km
442 km1 458
g/s TMHU79 10
6
1615
26 19 18
222320
2728
323435
41 3836
36 a
60
54
5356
8987 98
9997
9092
10091
9594105
96
93
58
61
646670
62687172
72 а
65
82 а8578
79
89818082
Legend :GlavHydromet’s gauging stationsRiver
Hydraulic structures and irrig.networksStaff gauge
Hydraulic section equipped with platformHydraulic section equipped with boat
Boundary postsPump stations
CDF
Turkmenistan
Urganch arnaDaryalyk
Pump st..Shikhjamol
Mangitarna
Karakuz Yangi-yab
Pump st.Agronom
Source: BWO «Amudarya»

Water Quality in the Amudarya and Syrdarya River Basins 70
Source: BWO «Syrdarya»

Analytical Report 71
Environmental indicators
Kazakhstan – Water resources
Indicator 1990 1991 1992 1993 1994 1995 1996 1997 1998 1999 2000 2001 2002 2003 2004 2005 2006 2007 2008 2009
Impact indicators Annual diversion of groundwater and surface water (Mm3)
36.6 36.1 34.02 33.67 31.91 28.80 7 26.48 3 24.978 23.11 8 20.74 8 19.83 19.69 21.1 21.85 26.42 24.8 21.24 22.81 20.47 21.54
Amount of discharged wastewater (Mm3), incl. CDW
8.7 8.3 7.7 7.1 6.1 5.3 4.2 3.8 3.6 3.6 3.7 3.3 3.9
Annual water use (km3): 30.2 28.4 27.4 26.9 24.9 23.4 20.5 18.3 16 14.2 14.7 14.6 14.9 15.2 20.2
domestic,% 4.5 4.5 4.7 4.2 6.8 5.3 5.2 4.9 7.8 7.9 7.4 7.2 5 5 4 4
industrial,% 23.8 16.9 19.3 17.8 16.2 24.1 22.2 22.4 22.4 23.6 24.4 25.4 25 26 21
agricultural,% 71.7 75.6 76.8 78 77 70.6 72.6 72.7 69.8 68.5 68.2 67.4 70 63 75
Status indicators
Per capita water use (m3) 83.49 80.3 81 81.01 81.51 77.81 72.81 53.38 48.8 43.45 41.89 40.57 39.9 40 44.1
Per capita use of tap water (m3):
4300-6000
Share of population having access to drinking water (%) 75.6 75.2 75.4 75.9 75.3 75 75.1 75.2 75.2 75.1 73 74 73.7 75.1 76.4 77.4 78.7 79.4 82 82
Share of population having access to sanitation (%) 44.1 48.1 46.7 45.2 43 42.5 49.1 48.5 44.2 46.8 47.1 42.1 44.1 43.1 41.1
% of deviation of analyzed drinking water samples from the State Standard
9.1 11.5 10.5
7.9 9 8.5 7.2 4.7 4.3
Water Quality in the Amudarya and Syrdarya River Basins 72
Indicator 1990 1991 1992 1993 1994 1995 1996 1997 1998 1999 2000 2001 2002 2003 2004 2005 2006 2007 2008 2009
Biochemical oxygen demand (BOD ) in water 0.3 0.3 1.3 1.2 0.8 1.1 1.1 1.1 1.1 1.6 1.6 1.5 1.4 1.3 1.4
Response indicators Amount of treated wastewater (Mm3) 256 289 263 227 210 203 164 142 254 228 212 212 217 253 188
Source: http://ecoportal.kz, www.stat.kz, www.cisstat.com, http://web.worldbank.org, http://unfccc.int1
Kyrgyzstan – Water resources
INDICATOR 1990 1991 1992 1993 1994 1995 1996 1997 1998 1999 2000 2001 2002 2003 2004 2005 2006 2007 2008 2009
Impact indicators Annual diversion of groundwater and surface water (Mm3)
11.12 11.15 11.5 11.41 10.92 9.31 9.6 8.47 8.32 9.18 8.03 10.39 8.46 7.56 7.85 7.89 80.07 85.3 84.7 7.6
Amount of discharged wastewater (Mm3), incl. CDW 1.17 1.36 1.35 1.34 1.31 1.18 1.00 0.73 0.93 0.93 0.8 1.16 2.27 1.49 1.51 0.77 0.70 1.04 1.02 0.18
Annual water use (km3): 8.99 8.95 8.95 8.54 8.26 6.94 6.87 6.16 6.42 5.25 4.98 5.75 5.42 4.56 4.54 4.48 4.53 5.55 5.32 4.73
domestic,% 3.3 3.0 2.8 3.5 3.4 3.9 4.3 2.2 5.2 6.6 4.3 3.6 2.2 1.7 1.9 8.5
industrial,% 7.8 7.5 5.9 3.5 3.7 3.8 3.3
2.2 2.1 1.2 1.0 1.7 2.6 2.7 11.8
agricultural,% 88.9 89.5 91.3 93.0 92.9 92.3 92.4 92.6 92.6 91.3 94.5 95.4 96.1 95.7 95.4 79.7
Status indicators
Per capita water use (m3) 66.5 64.3 62.5 70 68.1 60.9 61.2 66.9 66.9 64.4 42.8 37 25.1 18.5 17.2
Per capita use of tap water (m3): 2534 2504 2572 2576 2453 2064 2101
1805 1748 1893 1634 2095 1697 1501 1523
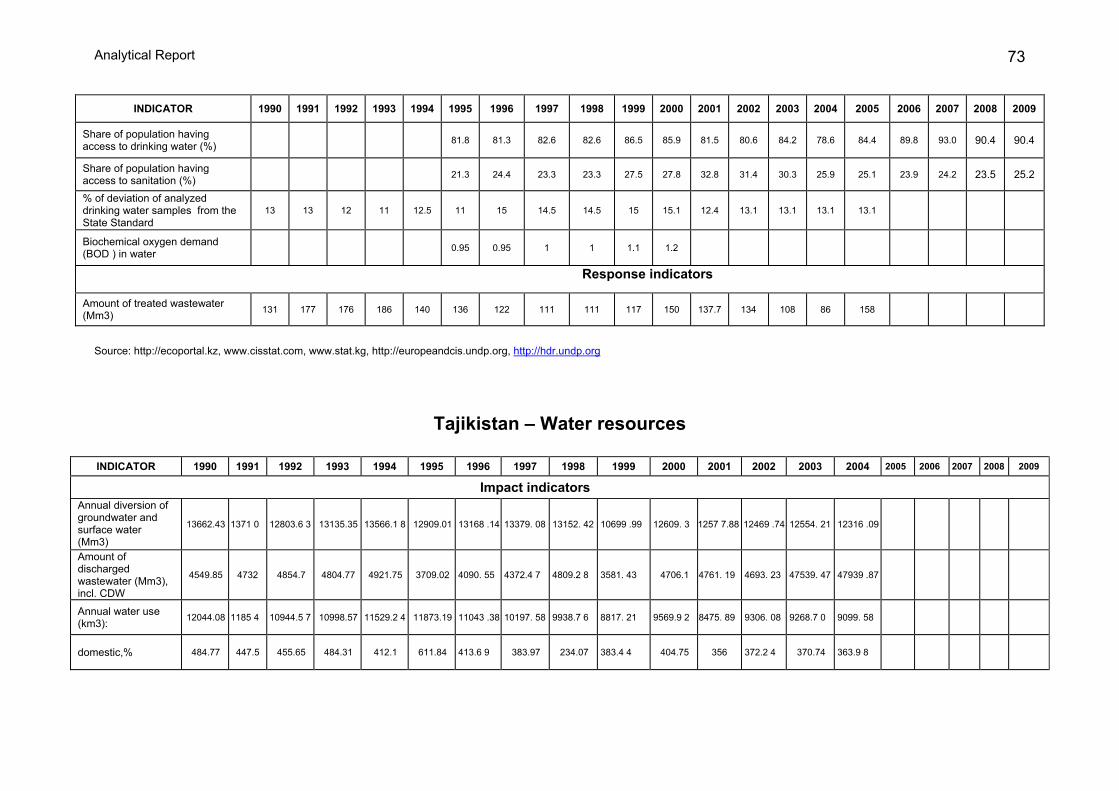
Analytical Report 73
INDICATOR 1990 1991 1992 1993 1994 1995 1996 1997 1998 1999 2000 2001 2002 2003 2004 2005 2006 2007 2008 2009
Share of population having access to drinking water (%)
81.8 81.3 82.6 82.6 86.5 85.9 81.5 80.6 84.2 78.6 84.4 89.8 93.0 90.4 90.4
Share of population having access to sanitation (%)
21.3 24.4 23.3 23.3 27.5 27.8 32.8 31.4 30.3 25.9 25.1 23.9 24.2 23.5 25.2
% of deviation of analyzed drinking water samples from the State Standard
13 13 12 11 12.5 11 15 14.5 14.5 15 15.1 12.4 13.1 13.1 13.1 13.1
Biochemical oxygen demand (BOD ) in water
0.95 0.95 1 1 1.1 1.2
Response indicators
Amount of treated wastewater (Mm3) 131 177 176 186 140 136 122 111 111 117 150 137.7 134 108 86 158
Source: http://ecoportal.kz, www.cisstat.com, www.stat.kg, http://europeandcis.undp.org, http://hdr.undp.org
Tajikistan – Water resources INDICATOR 1990 1991 1992 1993 1994 1995 1996 1997 1998 1999 2000 2001 2002 2003 2004 2005 2006 2007 2008 2009
Impact indicators Annual diversion of groundwater and surface water (Mm3)
13662.43 1371 0 12803.6 3 13135.35 13566.1 8 12909.01 13168 .14 13379. 08 13152. 42 10699 .99 12609. 3 1257 7.88 12469 .74 12554. 21 12316 .09
Amount of discharged wastewater (Mm3), incl. CDW
4549.85 4732 4854.7 4804.77 4921.75 3709.02 4090. 55 4372.4 7 4809.2 8 3581. 43 4706.1 4761. 19 4693. 23 47539. 47 47939 .87
Annual water use (km3): 12044.08 1185 4 10944.5 7 10998.57 11529.2 4 11873.19 11043 .38 10197. 58 9938.7 6 8817. 21 9569.9 2 8475. 89 9306. 08 9268.7 0 9099. 58
domestic,% 484.77 447.5 455.65 484.31 412.1 611.84 413.6 9 383.97 234.07 383.4 4 404.75 356 372.2 4 370.74 363.9 8

Water Quality in the Amudarya and Syrdarya River Basins 74
INDICATOR 1990 1991 1992 1993 1994 1995 1996 1997 1998 1999 2000 2001 2002 2003 2004 2005 2006 2007 2008 2009
industrial,% 594.01 593.2 530.16 536.04 501.3 943.87 922.0 8 535.12 454.16 525.5 4 477.31 428.4 6 465.3 465.3 454.9 7
agricultural,% 695.71 536.8 571.93 408.2 622.63 658.59 608.4 8 601.97 533.28 439.6 9 554.18 461.3 3 651.3 9 646.9 818.9 3
Status indicators Per capita water use (m3) 91.5 82.5 82.4 86.8 73.4 167.8 75.3 65.9 39.4 63.1 64.2 56.5 59.1 63.9 63.7
Per capita use of tap water (m3): 2509 2490 2500 2354 2480 2264 2282 2277 2192 1746 1837 1851 1837 1849 2001
Share of population having access to drinking water (%)
60 60 55.1 55.1 53.3 52 48.5 43.8 43.3 43.7 44.3 47.1 47.3 46.9 47.4
Share of population having access to sanitation (%)
70.3 70.1 69.5 61.4 58.3 45.3 33 30 38.7 64.8 64.4 69.8 69.8 69.6 69.3
% of deviation of analyzed drinking water samples from the State Standard
8 7 12 21 31 32 39 45 47 51 48 39 38 46 47
Biochemical oxygen demand (BOD ) in water 3.8 5 4.1 4.7 3.8 3.7 5.6 6.3 5.2 5.3 6.1 6.3 6.3 6.2 6.3
Response indicators Amount of treated wastewater (Mm3) 4.49 4.62 4.76 4.73 4.88 4.49 4.41 4.35 4.78 3.55 3.58 3.61 3.69 3.57 3.63
Source: www.cisstat.com, http://hdrstats.undp.org, http://hdr.undp.org

Analytical Report 75
Turkmenistan – Water resources
INDICATOR 1990 1991 1992 1993 1994 1995 1996 1997 1998 1999 2000 2001 2002 2003 2004 2005 2006 2007 2008 2009
Impact indicators Annual diversion of groundwater and surface water (Mm3)
24.82 26.12 24.93 25.71 25.97 27.61 26.35 24.21 25.95 27.60 21.94 24.92 27.15 26.67
Amount of discharged wastewater (Mm3), incl. CDW 6.5
5.7 6.2 6.0 6.0 6.7 6.1 3.9 5.9 6.6
Annual water use (km3): domestic,% 1.23 1.50 1.30 1.46 1.49 2.00 2.00 2.00 2.00 2.00 2.48 3.10 2.49 2.34 industrial,% 7.77 6.60 8.80 8.54 7.78 7.00 7.00 8.00 7.00 6.00 7.75 8.39 7.46 7.71 agricultural,% 91 91.90 89.90 90.0 90.73 91.0 91.00 90.00 91.00 92.00 89.77 88.51 90.03 89.93 Status indicators Per capita water use (m3) 63.4 78.76 70.5 68.8 67.4 64.5 63.7 61.9 80.1 76.9 72.7 83.1 80.7 80.5
Per capita use of tap water (m3): 6464 6538 6007 5950 5796 6018.2 5594 4994 5197.4 5306.
7 4086 4295 4571 4234
Share of population having access to drinking water (%)
42.82 56.78 61.95 54.2 54.7 54.19 55
Share of population having access to sanitation (%)
56.5 56.8 58.1 57.6 58.6
% of deviation of analyzed drinking water samples from
the State Standard
Biochemical oxygen demand
(BOD ) in water (Amudarya, Lebap)

Water Quality in the Amudarya and Syrdarya River Basins 76
INDICATOR 1990 1991 1992 1993 1994 1995 1996 1997 1998 1999 2000 2001 2002 2003 2004 2005 2006 2007 2008 2009
Response indicators Amount of treated wastewater (Mm3) 13.3 13.3 13.4 13.5 13.5 18.3 19.3 19.1 19.1 18.3 18.4 18.0
Source: http://geodata.grid.unep.ch, http://hdrstats.undp.org, http://hdr.undp.org 1
Uzbekistan – Water resources
INDICATOR 1990 1991 1992 1993 1994 1995 1996 1997 1998 1999 2000 2001 2002 2003 2004 2005 2006 2007 2008 2009 2010
Impact indicators
Annual diversion of groundwater and surface water (Mm3)
52.4 56.2 61.5 61.51 58.7 60.6 60.3 59.2 59.2 60.7 48.1 44 50.3 56.5 58.5
Amount of discharged wastewater (Mm3), incl. CDW
26.9 26.9 26.9 26.9 26.9 26.9 26.9 26.9 26.9
Annual water use (km3):
52.40 51.4 51.4 50.2 53.3 52.2 52.2 52.1 51.6 50.6 46.9 44 50.2 51.2 58.4 59.5 58.6 53 43.9 50.2
domestic,% 5.7 4.5 5 4.8 6.1 6.1 6.1
industrial,% 1.6 1.5 1.5 1.8 2.2 2.2 2.2
agricultural,% 90.7 92.7 92.4 92.5 90.2 90.2 90.2
Status indicators Per capita water use (m3) Per capita use of tap water (m3):
87.1 87.4 89.2 91 90.7 88.5 86.6 85.8

Analytical Report 77
INDICATOR 1990 1991 1992 1993 1994 1995 1996 1997 1998 1999 2000 2001 2002 2003 2004 2005 2006 2007 2008 2009 2010
Share of population having access to drinking water (%)
65.8 66.5 67.7 68.6 70 71.1 73.7 74.4 75.1 77.1
-
87
Share of population having access to sanitation (%)
58.1 72.1 72.5 72.4 72.0
5 71.5 68.7
-
% of deviation of analyzed drinking water
samples from the State Standard Biochemical oxygen demand (BOD ) in
water (Salar canal, downstream of Tashkent; Chirchik river)
3.38 4.41 4.72 4.35 3.77 3.53 3.68 4.05 4.87 4.56 - -
Response indicators Amount of treated wastewater (Mm3) 1209 - - - - - 1221.
7 1220 1159.7
1137.2
1101.4
1053.4
1070.8 1053 922.
3
Source: 1) National report on environmental status and natural resources use in the Republic of Uzbekistan; 2) Progress report on Agenda 21 in the Republic of Uzbekistan.


