Water Quality Index for measuring drinkingwater quality in rural Bangladesh: a cross-sectional studyTahera Akter1, Fatema Tuz Jhohura1, Fahmida Akter1, Tridib Roy Chowdhury1, Sabuj Kanti Mistry1, Digbijoy Dey3,Milan Kanti Barua3, Md Akramul Islam2,3 and Mahfuzar Rahman1*
Abstract
Background: Public health is at risk due to chemical contaminants in drinking water which may have immediatehealth consequences. Drinking water sources are susceptible to pollutants depending on geological conditions andagricultural, industrial, and other man-made activities. Ensuring the safety of drinking water is, therefore, a growingproblem. To assess drinking water quality, we measured multiple chemical parameters in drinking water samplesfrom across Bangladesh with the aim of improving public health interventions.
Methods: In this cross-sectional study conducted in 24 randomly selected upazilas, arsenic was measured in drinkingwater in the field using an arsenic testing kit and a sub-sample was validated in the laboratory. Water samples werecollected to test water pH in the laboratory as well as a sub-sample of collected drinking water was tested for waterpH using a portable pH meter. For laboratory testing of other chemical parameters, iron, manganese, and salinity,drinking water samples were collected from 12 out of 24 upazilas.
Results: Drinking water at sample sites was slightly alkaline (pH 7.4 ± 0.4) but within acceptable limits. Manganeseconcentrations varied from 0.1 to 5.5 mg/L with a median value of 0.2 mg/L. The median iron concentrations in waterexceeded WHO standards (0.3 mg/L) at most of the sample sites and exceeded Bangladesh standards (1.0 mg/L) at afew sample sites. Salinity was relatively higher in coastal districts. After laboratory confirmation, arsenic concentrationswere found higher in Shibchar (Madaripur) and Alfadanga (Faridpur) compared to other sample sites exceeding WHOstandard (0.01 mg/L). Of the total sampling sites, 33 % had good-quality water for drinking based on the Water QualityIndex (WQI). However, the majority of the households (67 %) used poor-quality drinking water.
Conclusions: Higher values of iron, manganese, and arsenic reduced drinking water quality. Awareness raising onchemical contents in drinking water at household level is required to improve public health.
Keywords: Water quality index, Chemical parameters, WASH program, BRAC, Bangladesh
BackgroundQuality of drinking water indicates water acceptability forhuman consumption. Water quality depends on watercomposition influenced by natural process and humanactivities. Water quality is characterized on the basis ofwater parameters (physical, chemical, and microbio-logical), and human health is at risk if values exceedacceptable limits [1–3]. Various agencies such as the
World Health Organization (WHO) and Centers for Dis-ease Control (CDC) set exposure standards or safe limitsof chemical contaminants in drinking water. A commonperception about water is that clean water is good-qualitywater indicating knowledge gap about the presence ofthese substances in water. Ensuring availability and sus-tainable management of good-quality water is set as oneof the Sustainable Development Goals (SDGs) and is achallenge for policy makers and Water, Sanitation andHygiene (WASH) practitioners, particularly in the face ofchanging climatic conditions, increasing populations, pov-erty, and the negative effects of human development.
* Correspondence: [email protected] Research and Evaluation Division, BRAC Centre, 75 Mohakhali, Dhaka1212, BangladeshFull list of author information is available at the end of the article
Water Quality Index (WQI) is considered as the mosteffective method of measuring water quality. A numberof water quality parameters are included in a mathemat-ical equation to rate water quality, determining the suit-ability of water for drinking [4]. The index was firstdeveloped by Horton in 1965 to measure water qualityby using 10 most regularly used water parameters. Themethod was subsequently modified by different experts.These indices used water quality parameters which varyby number and types. The weights in each parameter arebased on its respective standards, and the assignedweight indicates the parameter’s significance and im-pacts on the index. A usual WQI method follows threesteps which include (1) selection of parameters, (2) de-termination of quality function for each parameter, and(3) aggregation through mathematical equation [5]. Theindex provides a single number that represents overallwater quality at a certain location and time based onsome water parameters. The index enables comparisonbetween different sampling sites. WQI simplifies acomplex dataset into easily understandable and usableinformation. The water quality classification system usedin the WQI denotes how suitable water is for drinking.The single-value output of this index, derived fromseveral parameters, provides important information aboutwater quality that is easily interpretable, even by lay people[6]. In a resource-poor country like Bangladesh whereensuring availability and sustainable management of wateris one of the challenging areas towards development. Thepresent study embraced weighted arithmetic WQI methodto deliver water quality information to WASH practi-tioners. One of the merits of this method is that a lessnumber of parameters are required to compare waterquality for certain use [5].The WASH program of the Bangladesh Rural Advance-
ment Committee (BRAC) has provided interventions in250 upazilas in Bangladesh since 2006 with the aim ofimproving the health of the rural poor. The BRAC WASHprogram selects intervention areas on the basis of somecriteria such as high poverty rate, poor sanitation cover-age, and lack of access to safe water due to high arsenic,salinity, and other contaminants [7]. The program hasadopted a holistic approach integrating water, sanitation,and hygiene components. The water component promotesuse of safe water through a number of activities: (1) deeptubewell installation in arsenic-affected areas; (2) loan toconstruct tubewell platform in order to protect ground-water from pollutions; and (3) water quality testing [8].Besides, awareness building and behavioral change remainat the core of the WASH program [9] to improve healthand hygiene of the rural poor. The types of interventionsvary according to households’ economic status.Earlier, we conducted a number of studies on water-
and hygiene-related issues in intervention areas, such as
use of tubewell water and water safety practices [8],women in water hygiene [10], and knowledge gap on hy-giene and safe water [7]. Some impeding factors towardsaccess to safe drinking are poverty, unhygienic sanitationpractices, low groundwater levels, and impacts of naturalhazards (e.g., arsenic, salinity, extreme weather events)[11]. The program assessed water safety in a crude wayby some proxy indicators such as awareness on brick-builttubewell platform, its cleanliness, and no waterloggingat the bottom of the tubewell. To our knowledge, thepresent study on water quality assessment based onsome water parameters has been the first study con-ducted for the BRAC WASH program. We aimedthrough this research to understand households’ ex-posure to these water parameters according to theirbackground characteristics which might have pro-grammatic implications in the future. The presentstudy measures drinking water quality with the appli-cation of weighted arithmetic WQI method based onsome chemical parameters. These parameters used fordrinking water quality assessment were selected as therequirement of BRAC WASH program. The relevance ofthe present study lies in programmatic implications byproviding evidence-based and useful information ondrinking water quality in a simple way. We expect that thefindings will help in designing program interventions toensure safe drinking water either by raising awarenessabout chemical contamination of water or by improvingwater quality through provision of hardware supply.
MethodsStudy design and areaThis study was part of our research on “The status ofhousehold WASH behaviors in rural Bangladesh,” con-ducted in 24 randomly selected upazilas (5 % of total).The current study on the assessment of drinking waterquality used a cross-sectional study design and wasconducted in 12 out of 24 upazilas across the country:Alfadanga (Faridpur), Kendua (Netrokona), Shibchar(Madaripur), Rupsha (Khulna), Debhata (Satkhira),Patharghata (Barguna), Rangabali (Patuakhali), Anwara(Chittagong), Bijoynagar (Brahmanbaria), Shajahanpur(Bogra), Kamalganj (Moulvibazar), and Kurigram Sadar(Kurigram) (Fig. 1).
Study procedureA total of 960 households from 24 upazilas (40 householdsin each upazila) were randomly selected for socioeconomicsurvey and arsenic test on the spot using test kit at house-hold level. Twelve out of 24 upazilas were considered tocollect water samples from drinking water sources and totest chemical parameters in the laboratory. A total of 542water samples were collected from 293 randomly selectedhouseholds. In each upazila, 20 out of 40 households were
Akter et al. Journal of Health, Population and Nutrition (2016) 35:4 Page 2 of 12
Fig. 1 Selected upazila for water sample collection
Akter et al. Journal of Health, Population and Nutrition (2016) 35:4 Page 3 of 12
initially selected for water samples collection. However, thetotal number of samples varied due to some reasons: (1)samples collected from shared tubewells increased thenumber of households; and (2) a few water samples werediscarded due to label numbers being washed away, ren-dering them unidentifiable. Of the total water samplescollected, same samples (293 samples) were used to testboth iron and manganese levels in water. Similarly, theremaining 249 water samples were used to test both pHand salinity (Table 1).A total of 36 research assistants were recruited and
grouped into 12 to collect water samples from selectedupazilas. They were trained intensively for 3 days and afield test was conducted nearby Dhaka prior to actualfield survey. Groundwater samples from each tubewellwere collected after 2 min of pumping in order to obtaindeep water as the test sample. The water samples werecollected in 100-mL pre-washed bottles with watertightseals. The collected water samples were labeled with thehousehold identification number and name of waterparameters.
Arsenic test on the spotA total of 960 households from 24 upazilas were visitedfor arsenic testing in the field. Simultaneously, a pre-testedstructured questionnaire was used to obtain household-level information on socioeconomic condition. Of the totalhouseholds visited, 66 and 31 % households used shallow(<300 ft) and deep (≥300 ft) tubewells for collecting drink-ing water, respectively. Out of the total households usingtubewells, 645 tubewells (424 shallow and 221 deep tube-wells) were tested on the spot for arsenic using the “econoquick (EQ) arsenic test kit.” The nature of EQ kit readingis quantitative. A color chart in a scale of values between0.0 and 1.0 mg/L was used to record the arsenic status ofwater samples tested in the field. The EQ kit was preferredto use in field test because of its high accuracy (about90 %) of measuring arsenic status of the tubewells [12].Drinking water sources of the remaining households(33 %) were not considered for arsenic testing for variousreasons: tubewells of 29 % of households had already beentested and declared arsenic free (0.0 mg/L) in the recent
past, and 4 % used pond water for drinking and were ex-cluded from arsenic testing.
Testing of water samples using pH meterAcid-base balance is assessed by the pH value of water[13]. A controlled water pH is suggested in WHO guide-lines to reduce adverse health consequences. Accordingto the WHO guidelines of drinking water quality, expos-ure to both high and low pH values causes irritation theeyes, skin, and mucous membrane for humans [14].Here, 123 water samples were randomly selected fromthe total samples collected to test the pH. A portable pHmeter (model PHS-25) was used in the BRAC head of-fice to test the pH. pH meter operating instructions werecarefully followed: the meter was first calibrated by put-ting the electrode into standard buffer solutions ofpH 6.86 and pH 4.00 at set temperature prior to beingwashed with distilled water and sample measurement.
Methods used at laboratory for measuring parametersArsenic results measured in the field using the testingkits were verified in the laboratory. About 10 % ofcollected water samples were picked at random for la-boratory validation. pH meter values were similarlycrosschecked in the laboratory for validation. The otherchemical contents (e.g., iron, manganese, and salinity) inwater samples were also measured in the Water QualityTesting Laboratory of the NGO Forum for Public Health.The water samples were analyzed by flow-injectionhydride generation atomic absorption spectrometry (FI-HG-AAS) method for arsenic detection. The minimumdetection level for this method was 3 (μg/L). Total arsenicwas measured. The efficiency of field kits used by NGOForum for arsenic testing was reported to have low failurerate (11 % for Merck kit, 6.2 % for NIPSOM), supportinghigh kit’s performance in arsenic testing [15]. Manganesewas analyzed in Flame (air-acetylene) AAS. The minimumdetection limit of this method was 0.01 ppm. For botharsenic and manganese, AAS of Shimadzu (model: AA-6300) was used at the laboratory. Iron was analyzed byphenanthroline method using UV-visible spectrophotom-eter where iron was brought into a solution, reduce to aferrous state by treating with acid and hydroxylamine and1, 10-phenanthroline. The minimum detection limit ofthis method was 0.05 ppm. UV-visible spectrophotometerof Shimadzu (model: UV-1601) was used at the laboratory.Salinity was measured at the laboratory by conductivitymethod using an appropriate electrode.
Data analysisDescriptive statistics were used to analyze the mean, me-dian, standard deviation, interquartile range (IQR), andfrequency distribution of each parameter. The house-holds’ wealth index was developed based on ownership
Table 1 Sample distribution
Spot test Laboratory test
Chemicalparameter
Arsenic(As)
Arsenic(As)
Manganese(Mn)
Iron(Fe)
pH Salinity(NaCl)
Householdsvisited
960 293
Sample tested 645 64 293 293 249 249
Total sample 645 542
Akter et al. Journal of Health, Population and Nutrition (2016) 35:4 Page 4 of 12
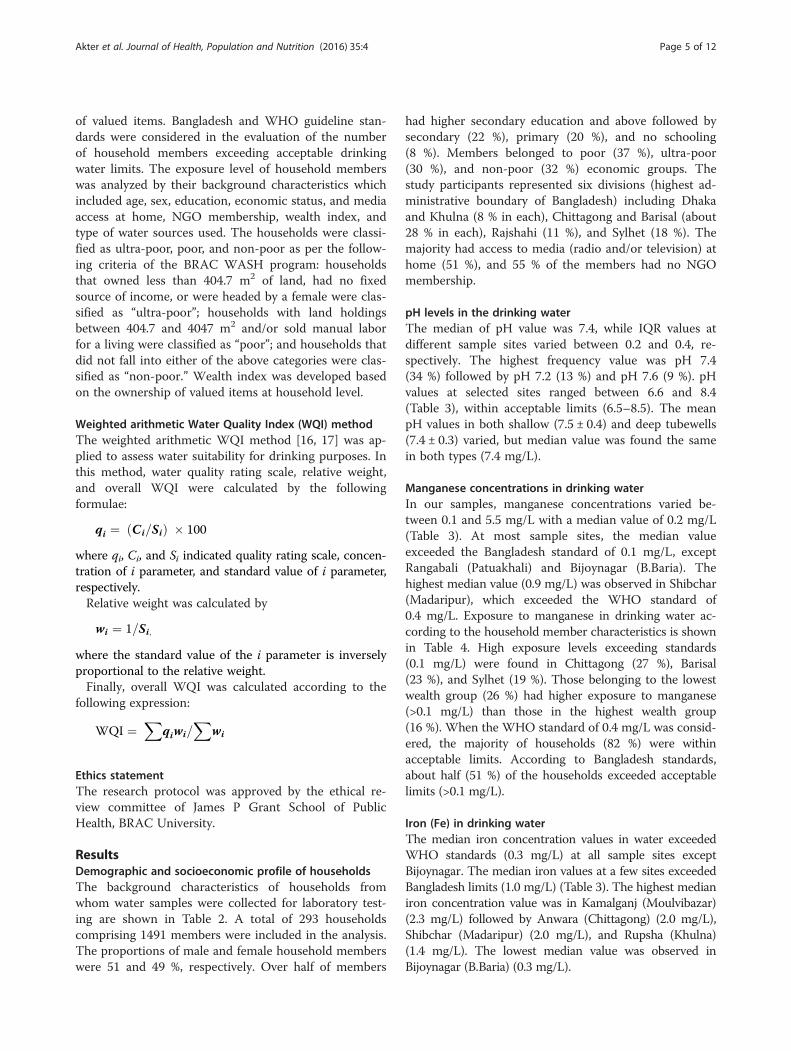
of valued items. Bangladesh and WHO guideline stan-dards were considered in the evaluation of the numberof household members exceeding acceptable drinkingwater limits. The exposure level of household memberswas analyzed by their background characteristics whichincluded age, sex, education, economic status, and mediaaccess at home, NGO membership, wealth index, andtype of water sources used. The households were classi-fied as ultra-poor, poor, and non-poor as per the follow-ing criteria of the BRAC WASH program: householdsthat owned less than 404.7 m2 of land, had no fixedsource of income, or were headed by a female were clas-sified as “ultra-poor”; households with land holdingsbetween 404.7 and 4047 m2 and/or sold manual laborfor a living were classified as “poor”; and households thatdid not fall into either of the above categories were clas-sified as “non-poor.” Wealth index was developed basedon the ownership of valued items at household level.
Weighted arithmetic Water Quality Index (WQI) methodThe weighted arithmetic WQI method [16, 17] was ap-plied to assess water suitability for drinking purposes. Inthis method, water quality rating scale, relative weight,and overall WQI were calculated by the followingformulae:
qi ¼ Ci=Sið Þ � 100
where qi, Ci, and Si indicated quality rating scale, concen-tration of i parameter, and standard value of i parameter,respectively.Relative weight was calculated by
wi ¼ 1=Si;
where the standard value of the i parameter is inverselyproportional to the relative weight.Finally, overall WQI was calculated according to the
following expression:
WQI ¼X
qiwi=X
wi
Ethics statementThe research protocol was approved by the ethical re-view committee of James P Grant School of PublicHealth, BRAC University.
ResultsDemographic and socioeconomic profile of householdsThe background characteristics of households fromwhom water samples were collected for laboratory test-ing are shown in Table 2. A total of 293 householdscomprising 1491 members were included in the analysis.The proportions of male and female household memberswere 51 and 49 %, respectively. Over half of members
had higher secondary education and above followed bysecondary (22 %), primary (20 %), and no schooling(8 %). Members belonged to poor (37 %), ultra-poor(30 %), and non-poor (32 %) economic groups. Thestudy participants represented six divisions (highest ad-ministrative boundary of Bangladesh) including Dhakaand Khulna (8 % in each), Chittagong and Barisal (about28 % in each), Rajshahi (11 %), and Sylhet (18 %). Themajority had access to media (radio and/or television) athome (51 %), and 55 % of the members had no NGOmembership.
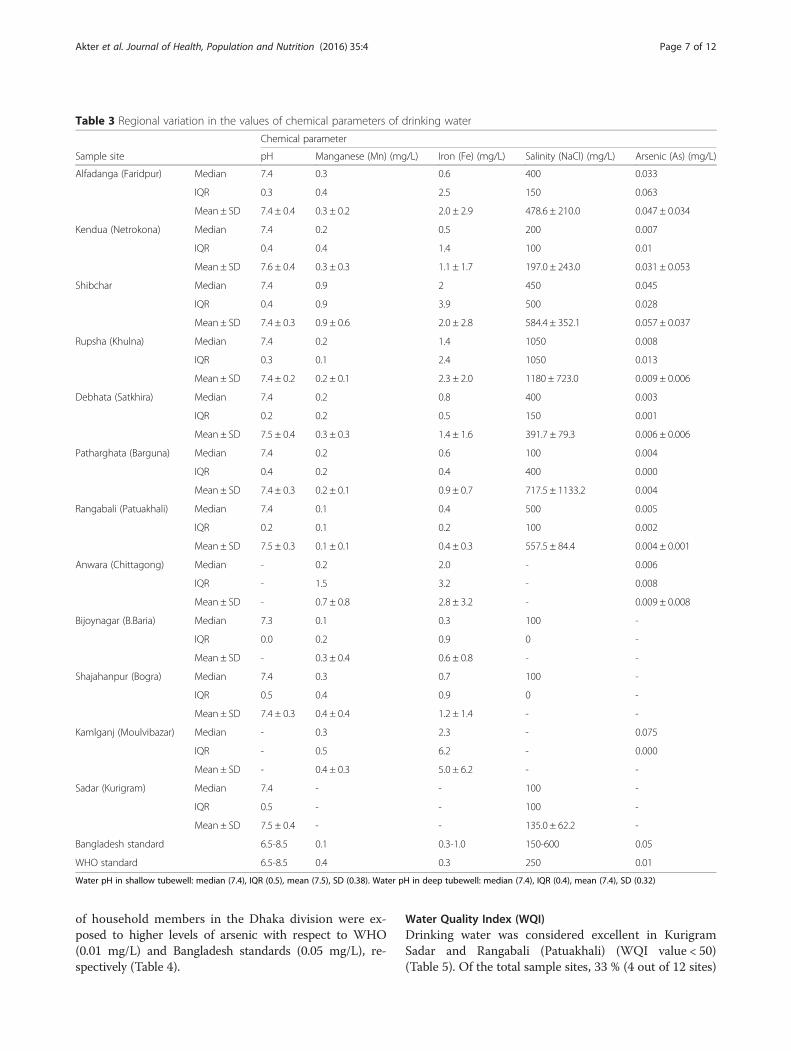
pH levels in the drinking waterThe median of pH value was 7.4, while IQR values atdifferent sample sites varied between 0.2 and 0.4, re-spectively. The highest frequency value was pH 7.4(34 %) followed by pH 7.2 (13 %) and pH 7.6 (9 %). pHvalues at selected sites ranged between 6.6 and 8.4(Table 3), within acceptable limits (6.5–8.5). The meanpH values in both shallow (7.5 ± 0.4) and deep tubewells(7.4 ± 0.3) varied, but median value was found the samein both types (7.4 mg/L).
Manganese concentrations in drinking waterIn our samples, manganese concentrations varied be-tween 0.1 and 5.5 mg/L with a median value of 0.2 mg/L(Table 3). At most sample sites, the median valueexceeded the Bangladesh standard of 0.1 mg/L, exceptRangabali (Patuakhali) and Bijoynagar (B.Baria). Thehighest median value (0.9 mg/L) was observed in Shibchar(Madaripur), which exceeded the WHO standard of0.4 mg/L. Exposure to manganese in drinking water ac-cording to the household member characteristics is shownin Table 4. High exposure levels exceeding standards(0.1 mg/L) were found in Chittagong (27 %), Barisal(23 %), and Sylhet (19 %). Those belonging to the lowestwealth group (26 %) had higher exposure to manganese(>0.1 mg/L) than those in the highest wealth group(16 %). When the WHO standard of 0.4 mg/L was consid-ered, the majority of households (82 %) were withinacceptable limits. According to Bangladesh standards,about half (51 %) of the households exceeded acceptablelimits (>0.1 mg/L).
Iron (Fe) in drinking waterThe median iron concentration values in water exceededWHO standards (0.3 mg/L) at all sample sites exceptBijoynagar. The median iron values at a few sites exceededBangladesh limits (1.0 mg/L) (Table 3). The highest medianiron concentration value was in Kamalganj (Moulvibazar)(2.3 mg/L) followed by Anwara (Chittagong) (2.0 mg/L),Shibchar (Madaripur) (2.0 mg/L), and Rupsha (Khulna)(1.4 mg/L). The lowest median value was observed inBijoynagar (B.Baria) (0.3 mg/L).
Akter et al. Journal of Health, Population and Nutrition (2016) 35:4 Page 5 of 12
About 7 % of young children (≤4 years) were exposed toiron levels in drinking water that exceeded WHO andBangladesh standards. The highest exposure levels, exceed-ing the WHO’s acceptable limit of 0.3 mg/L, were inBarisal (29 %) followed by Chittagong (23 %) and Sylhet(20 %) (Table 4). In Dhaka, only 7 % of household mem-bers were exposed to greater than 0.3 mg/L iron indrinking water. Only 18 % households met WHO stan-dards (≤0.3 mg/L), while a large proportion (82 %) wereexposed to high concentrations of iron in drinkingwater (>0.3 mg/L). The median iron concentration indeep tubewells was slightly higher (0.8 mg/L)than inshallow tubewells (0.7 mg/L), although median valuesin both cases exceeded WHO and lower limit ofBangladesh standards.
Salinity (NaCl) levelsDivision-wise variations in sodium chloride levels indrinking water are shown in Table 4. The highest pro-portion of household members exposed to more than600 mg/L sodium chloride was found in Dhaka (40 %)followed by Barisal (35 %) and Khulna (26 %). Consider-ing Bangladesh standards (upper limit 600 mg/L), morefemales than males exceeded their exposure limits (54 %vs. 46 %) (Table 4). As shown in Table 3, excess sodiumchloride was detected in Rupsha (Khulna) (1050 mg/L)when the upper limit of Bangladesh standard (600 mg/L)was considered.
Arsenic (As) concentrations in drinking waterArsenic testing in the field revealed high arsenic concen-trations exceeding Bangladesh standards in Shibchar(Madaripur), Biswanath (Sylhet), and Dhaka. A randomsub-sample (over 10 %) was selected for laboratory valid-ation, which showed that water samples collected fromShibchar (Madaripur) (median 0.05 mg/L) and Alfadanga(Faridpur) (median 0.03 mg/L) showed higher arsenicconcentrations compared to other sample sites ex-ceeding WHO standard (Table 3). About 68 and 77 %
Table 2 Demographic and socioeconomic characteristics ofhouseholds
Characteristics Frequency(HHa members)
Percentage (%)
Sex
Male 757 50.8
Female 734 49.2
Age(years)
≤4 106 7.2
5–20 516 34.9
21–40 455 30.8
41–60 300 20.3
≥61 102 6.9
Educational level
No schooling 62 7.6
Primary 166 20.3
Secondary 177 21.6
Higher secondary and above 414 50.5
Division
Dhaka 115 7.7
Chittagong 414 27.8
Rajshahi 160 10.7
Khulna 121 8.1
Barisal 411 27.6
Sylhet 270 18.1
Occupation
Agriculture 123 9.0
Laborer (skilled/unskilled) 123 9.0
Housewife/homestead task 408 29.9
Service/professional 87 6.4
Business 88 6.5
Student 427 31.3
Unemployed/disabled 70 5.1
Others 38 2.8
Household economic status
Ultra-poor 452 30.3
Poor 557 37.4
Non-poor 482 32.3
Marital status
Unmarried 692 46.4
Married 728 48.8
Widow/separated/divorced 71 4.8
Access to media at home
No access to media 730 49.0
Access to media 761 51.0
NGO membership
No membership 816 54.7
Table 2 Demographic and socioeconomic characteristics ofhouseholds (Continued)
Member of any NGO 675 45.3
Wealth index
Lowest 342 23.1
Second 301 20.3
Middle 265 17.9
Fourth 262 17.7
Highest 313 21.1
Total 1491 100aHousehold
Akter et al. Journal of Health, Population and Nutrition (2016) 35:4 Page 6 of 12
of household members in the Dhaka division were ex-posed to higher levels of arsenic with respect to WHO(0.01 mg/L) and Bangladesh standards (0.05 mg/L), re-spectively (Table 4).
Water Quality Index (WQI)Drinking water was considered excellent in KurigramSadar and Rangabali (Patuakhali) (WQI value < 50)(Table 5). Of the total sample sites, 33 % (4 out of 12 sites)
Table 3 Regional variation in the values of chemical parameters of drinking water
Chemical parameter
Sample site pH Manganese (Mn) (mg/L) Iron (Fe) (mg/L) Salinity (NaCl) (mg/L) Arsenic (As) (mg/L)
Bangladesh standard 6.5-8.5 0.1 0.3-1.0 150-600 0.05
WHO standard 6.5-8.5 0.4 0.3 250 0.01
Water pH in shallow tubewell: median (7.4), IQR (0.5), mean (7.5), SD (0.38). Water pH in deep tubewell: median (7.4), IQR (0.4), mean (7.4), SD (0.32)
Akter et al. Journal of Health, Population and Nutrition (2016) 35:4 Page 7 of 12
Table 4 Status of chemical parameters by WHO and Bangladesh drinking water standard (%)
Characteristics WHO drinking water standard (mg/L) Bangladesh drinking water standard (mg/L)
p value 0.000*** 0.000*** 0.000*** 0.000*** 0.000*** 0.000*** 0.000*** 0.000***
Akter et al. Journal of Health, Population and Nutrition (2016) 35:4 Page 8 of 12
had good-quality drinking water (WQI value < 100)and the majority (67 %) had poor-quality drinkingwater (WQI value > 100). Quality of drinking water wasfound very poor in Anwara (Chittagong) and Kamalganj(Moulvivazar), while water was categorized as unsuitablefor drinking only in Shibchar (Madaripur).
DiscussionAssessment of drinking water quality is a timely require-ment amid emerging public health problems in thiscontext where availability of safe water is at risk due tonatural and man-made activities. This cross-sectionalstudy conducted across the country aimed at measuringdrinking water quality using WQI which delivered mes-sages on the composite effect of chemical parameters onwater. The present study is a fact finding or exploratory
study contributing to designing and improving programinterventions which cover a larger population includinghigh arsenic, high saline prone coastal areas. There isduality about spatial and temporal variations of somechemical parameters. A periodic assessment on arsenicconcentration depicts no association with seasonal varia-tions, while repeated assessment of arsenic contents inwater based on seasons is assumed to bring little valuein health surveillance [18]. In contrast, seasonal andspatial variations of arsenic concentrations in ground-water have been reported by Shrestha et al. [19].The study findings revealed that drinking water was
slightly alkaline, although the ideal pH for human con-sumption is stated to be 7.4 [20]. A controlled pH of wateris suggested in WHO guideline to reduce the corrosionand contamination of drinking water having healthconsequences. Water pH is influenced by a number offactors including rock and soil composition and thepresence of organic materials or other chemicals. Napachoand Manyele [21] found that pH values in shallow tube-wells varied between 6.7 and 8.3 due to dissolved mineralsfrom the soil and rocks. They further explained higheralkalinity by the presence of two common minerals, cal-cium and magnesium, affecting the hardness of the water.On the other hand, water with low pH values is meant tobe acidic, soft, and corrosive.The median value of manganese concentrations exceeded
Bangladesh standard at most of the study sites. OtherBengali studies have reported higher manganese levels indrinking water in terms of WHO standards [22]. For ex-ample, Islam et al. [23] reported that 52 % of pond-sand fil-ter and 45 % of pond water exceeded Bangladesh drinkingwater standards. The median value at our sample sites wasrelatively lower than some previous findings (about 0.8 and0.9 mg/L) [24, 25] but higher than the 0.1 mg/L reportedby Bouchard [26].Children are reported to be particularly vulnerable
to higher manganese concentrations due to their low
Table 4 Status of chemical parameters by WHO and Bangladesh drinking water standard (%) (Continued)
Table 5 Computed water quality values for sample sites
Sample site upazilaname (district name)
WQI value Water quality classification basedon computed WQI values in samplesites
<50 = excellent; 50–100 = goodwater; 101–200 = poor water;201–300 = very poor water,>300 =water unsuitable for drinking
Rangabali (Patuakhali) 40.05 Excellent water
Sadar (Kurigram) 11.79 Excellent water
Rupsha (Khulna) 92.14 Good water
Patharghata (Barguna) 75.35 Good water
Alfadanga (Faridpur) 169.44 Poor water
Kendua (Netrokona) 142.51 Poor water
Debhata (Satkhira) 113.18 Poor water
Shajahanpur (Bogra) 135.67 Poor water
Bijoynagar (B.baria) 111.83 Poor water
Anwara (Chittagong) 253.29 Very poor water
Kamalganj (Moulvibazar) 258.36 Very poor water
Shibchar (Madaripur) 371.50 Water unsuitable for drinking
Akter et al. Journal of Health, Population and Nutrition (2016) 35:4 Page 9 of 12
protective mechanisms. Approximately 8 % of childrenwere exposed to excess manganese concentrations thatexceeded both WHO and Bangladesh standards (>0.4 and>0.1 mg/L, respectively). We found higher exposure tomanganese in lowest wealth group. This finding has simi-larity with the other study conducted in Araihazar,Bangladesh [27]. Less exposure among the infants wasreported by mothers who had access to TV. Besides,participants living in poor-quality housing type (mud vs.concrete) were more likely to report exposure among theinfants. Several studies have reported that exposure tohigh manganese concentrations threatens children’s cog-nitive [28], behavioral, and neuropsychological health[25]. However, the potential impact of lower exposureand interactions with other metals are less well charac-terized. Infants and children are reported to be moresusceptible to manganese toxicity than adults [27], anda number of Bangladesh studies have shown thatchildren’s intellectual function, and consequently theiracademic achievement, was adversely affected by man-ganese exposure in drinking water [22, 25, 27]. Contra-dictory to these findings, a higher manganese level indrinking water was shown to be protective against fetalloss during pregnancy of undernourished women inBangladesh [29].In most of the sample sites (9 out of 12 sites), iron con-
tent in drinking water exceeded upper acceptable limit(1.0 mg/L) of Bangladesh standard. A previous study inrural Bangladesh revealed 50 times higher iron concentra-tions (mean value 16.7 mg/L) in ground water thanWHO’s limit (0.3 mg/L) and reported that 47 % of womenconsumed above the daily limit of iron (45 mg), likely toincrease the risk of health problems [30]. Consumption of>30 mg of iron per day in drinking water was associatedwith a reduced risk of anemia in individuals without thal-assemia [31]. In Gaibandha, half of female respondentsconsuming >42 mg of iron from drinking water stayedwithin tolerable limits. If this limit were exceeded,however, the populations would be likely to experiencehealth-related problems including gastrointestinal distress,zinc absorption, and others [32].Approximately 2 % of women in developed countries
but 50 % in developing countries are anemic, contribut-ing to high rates of maternal mortality in developingcountries [33]. Iron-deficiency anemia is one of the topten contributing factors to the global burden of diseasesand is considered a public health problem with a highrisk of morbidity and mortality in pregnant women andyoung children [34]. In our study, about half of the fe-male participants were exposed to higher iron concen-trations in drinking water which exceeded both WHOand Bangladesh standard. The health impacts of exceed-ing recommended WHO levels of chemical substancessuch as iron are often not well documented [32]. There
is a duality to iron concentrations: on the one hand, irondeficiency can cause anemia and fatigue, while on theother, excess iron can cause multiple organ dysfunction(e.g., liver fibrosis and diabetes) [35]. In a 10-year periodof study in Bangladesh, the prevalence of anemia inwomen of reproductive age ranged between 23 and 95 %depending on age, pregnancy status, and residency.However, more recent studies have reported iron defi-ciency as the most important determinant of 7 to 60 %of anemia cases in Bangladesh [36].Salinity in drinking water was found higher (>600 mg/L)
only in Rupsha (Khulna) and Patharghata (Barguna). Geo-graphically, these two upazilas are coastal areas. Salinityproblems in coastal regions are assumed to be the effectsof climate change [37], although industrial and domesticwastes [38] and geological and soil characteristics [21] arealso thought to contribute. Bangladesh is at the forefrontof the negative effects of climate change and has faceddramatic rises in sea level over the last three decades. Ap-proximately 20 million people living in coastal Bangladesh[24] are dependent on tubewells, rivers, and ponds fordrinking water, and these sources are increasingly becom-ing saline due to rising sea levels [39]. Salinity has in-truded over 100 km inland from the Bay of Bengal withconsequent health impacts: in a 2008 survey, higher ratesof preeclampsia and hypertension were reported in thecoastal than non-coastal population [40]. Consistent withthis, Khan et al. [41] reported that hypertensive disor-ders were associated with salinity in drinking water.Furthermore, reducing salt consumption from the glo-bal estimated levels of 9–12 g/day [42] to an acceptablelimit of 5 g/day [43] would be predicted to reduceblood pressure and stroke/cardiovascular disease by 23and 17 %, respectively [44].Most households in Dohar, Shibchar, and Sonargaon
used shallow tubewells for drinking, which were affectedby high levels of arsenic. In Shibchar (West Kakorvillage), most tubewells were affected by arsenic, and thevillagers were unaware of which tubewell was arsenicfree; therefore, they collected drinking water from anytubewell. In some cases (e.g., Sonargaon), people usedarsenic-affected drinking water sources even though theyknew that the water was contaminated and damaging tohealth. Bladder cancer risk is increased 2.7 and 4.2 timesby arsenic exposure of 10 and 50 μg/L in water, respect-ively. In this study, there was an 83 % chance of develop-ing bladder cancer and a 74 % probability of mortality ata 50 μg/L exposure level. Mortality rates are 30 % higherat 150 than 10 μg/L [45]. According to a national surveyconducted in 2009 by UNICEF/BBS (2011), 53 and 22million people were exposed to arsenic according toWHO and BDWS standards, respectively. Arsenic hasbeen detected in the groundwater of 322 upazilas (sub-districts) and 61 districts in Bangladesh [46]. The health
Akter et al. Journal of Health, Population and Nutrition (2016) 35:4 Page 10 of 12
effects of prolonged and excessive inorganic arsenic ex-posure include arsenicosis, skin diseases, skin cancers,internal cancers (bladder, kidney, and lung), diabetes,raised blood pressure, and reproductive disorders [47].The overall suitability of drinking water was assessed
using a combined measure of water quality parameters:the WQI. The chemical parameters (pH, iron, manga-nese, salinity, and arsenic) of water samples were used tocalculate the WQI value at each site. We applied theweighted arithmetic WQI method to calculate WQIvalues. In this method, the permissible WQI value fordrinking is considered to be 100, the water quality beingconsidered poor if the value exceeded this acceptablelimit. Water quality was found excellent only in Rangabali(Patuakhali) and Kurigram Sadar. The water was consid-ered excellent at these sites mainly due to low chemicalparameter values contributing to lower composite effecton drinking water quality. In Shibchar (Madaripur), waterwas categorized as unsuitable for drinking, mainly due tohigh manganese and arsenic levels found in water at thesesites. At most sample sites (e.g., Alfadanga, Kendua,Debhata, Shajahanpur, and Bijoynagar), water was clas-sified as “poor” for drinking due to high manganesevalues. Moreover, arsenic was also found to be high inAlfadanga (Faridpur) and Kendua (Netrokona). However,in Anwara (Chittagong) and Kamalganj (Moulvibazar), thechemical parameter values in the water samples werevery high and contributed to very poor-quality drink-ing water.Most respondents at the sample sites used shallow tube-
wells to obtain drinking water due to lower installationcosts. In some areas, such water from shallow tubewellswas reported to have high iron and arsenic levels. Incoastal districts such as Barguna, Satkhira, and Khulna,water from both shallow and deep tubewells were salty, asreported by the respondents. Yisa and Jimoh [16] reportedhigher levels of iron and manganese that contributed topoor-quality drinking water. These characteristics are con-sistent with unplanned waste disposal, agricultural run-offincluding pesticide or fertilizer, and other environmentallyhazardous activities polluting surface water [48].The study had some limitations. This study embraced
cross-sectional study design. However, it would have beenbetter to collect samples throughout the year addressingseasonality and depth of wells. We could not collect dataon other WHO-recommended parameters which was be-yond our scope of work. Therefore, the analysis has beenlimited to few water parameters as the requirement ofBRAC WASH program and due to resource constraints.Measuring other WHO-recommended chemical parame-ters might have been a future concern for the program. Inaddition, water pH would have been tested on the spotusing pH meter which was not possible for this study dueto limited resources. The limitations observed in this
study highlight the insights of future scope of work for re-search divisions and WASH program.
ConclusionsHere, we report that drinking water in Bangladesh wasmainly alkaline with pH values within acceptable limits.According to WHO standards, a greater proportion ofhousehold members are exposed to excessive amounts ofiron compared to manganese (82 % vs. 18 %). About half ofhouseholds exceeded acceptable limits of manganese ex-posure when considering Bangladeshi standards. Majorityof the households used poor quality of drinking water ac-cording to WQI values. Higher values of iron, manganese,and arsenic reduced drinking water quality. Awarenessraising on chemical contents in drinking water at house-hold level is required to improve public health.
AbbreviationsAs: arsenic; BRAC: Bangladesh Rural Advancement Committee; CDC: Centersfor Disease Control; EQ: econo quick; Fe: iron; IQR: interquartile range;MDG: Millennium Development Goals; Mn: manganese; NaCl: sodiumchloride; NGO: non-government organization; UNICEF: United NationsInternational Children’s Emergency Fund; WASH: Water, Sanitation andHygiene; WHO: World Health Organization; WQI: Water Quality Index.
Competing interestsThe authors declare that they have no competing interests.
Authors’ contributionsTA, MR, FTJ, and FA conceived and designed the study. SKM, TRC, and DDcontributed to the data collection. TA, FTJ, and MR conducted the data analysisand participated in the result interpretation. TA and FTJ wrote the manuscript.MR, MAI, and MKB commented on the manuscript draft. All authors read andapproved the final manuscript.
AcknowledgementsWe would like to thank the respondents who provided valuable informationand time for this study. We thank all the interviewers involved in the datacollection and the field staff of the BRAC WASH program for their assistancein conducting this study. We acknowledge the Data Management Unit ofRED for their support in data entry and cleaning. Finally, we acknowledgethe Government of the Netherlands for funding the study. We thank theNextgenediting Global Initiative (www.nextgenediting.com) for editorialassistance.
Author details1BRAC Research and Evaluation Division, BRAC Centre, 75 Mohakhali, Dhaka1212, Bangladesh. 2BRAC Tuberculosis Programme, BRAC Centre, 75Mohakhali, Dhaka 1212, Bangladesh. 3BRAC Water, Sanitation and HygieneProgramme, BRAC Centre, 75 Mohakhali, Dhaka 1212, Bangladesh.
Received: 18 September 2015 Accepted: 3 February 2016
References1. Bureau of Indian Standards (BIS). Specification for drinking water. New Delhi,
India: Food and Agricultural Division Council; 2012.2. Central Pollution Control Board (CPCB). Guide manual: water and waste
water. New Delhi, India: Central Pollution Control Board; 2013. Available: http://www.cpcb.nic.in/upload/Latest/Latest_67_guidemanualw&wwanalysis.pdf.
3. World Health Organization (WHO). Guideline for drinking water quality. 2012.4. Ochuko U, Thaddeus O, Oghenero OA, John EE. A comparative assessment
of water quality index (WQI) and suitability of river Ase for domestic watersupply in urban and rural communities in Southern Nigeria. Int J HumanSoc Sci. 2014;4(1):234–45.
Akter et al. Journal of Health, Population and Nutrition (2016) 35:4 Page 11 of 12
5. Tyagi S, Sharma B, Singh P, Dobhal R. Water quality assessment in terms ofWater Quality Index. Am J Water Resour. 2013;1(3):34–8.
6. Chowdhury RM, Muntasir SY, Hossain MM. Water Quality Index of water bodiesalong Faridpur-Barisal Road in Bangladesh. Glob Eng Tech Rev. 2012;2:1–8.
7. Akter T, Ali ARMM. Factors influencing knowledge and practice of hygienein Water, Sanitation and Hygiene (WASH) programme areas of BangladeshRural Advancement Committee. Rural Remote Health. 2014;14:2628. Online.
8. Dey NC, Rabbi SE. Studies on the impact of BRAC WASH-1 interventions: anoverview. In: achievements of BRAC Water, Sanitation and Hygiene programmetowards Millennium Development Goals and beyond. Dhaka: BRAC; 2013.
9. Rabbi SE, Dey NC. Exploring the gap between hand washing knowledgeand practices in Bangladesh: a cross-sectional comparative study.BMC Public Health. 2013;13:89.
10. Dey NC, Akter T. Women in water-hygiene and sanitation management athouseholds in rural Bangladesh: changes from baseline to end line survey.In: achievements of BRAC Water, Sanitation and Hygiene programmetowards Millennium Development Goals and beyond. Dhaka: BRAC; 2013.
11. UNICEF. First annual high level meeting for sanitation and water for allaims to be a watershed for reaching the MDG targets. 2010. Available:http://www.unicef.org/bangladesh/media_6193.htm
12. George CM, Zheng Y, Graziano JH, Rasul SB, Hossain Z, Mey JL, et al.Evaluation of an arsenic test kit for rapid well screening in Bangladesh.Environ Sci Technol. 2012;46(20):11213–9.
13. World Health Organization (WHO). pH in drinking water. Guidelines fordrinking water quality. Geneva: World Health Organization; 1996. Available:http://www.who.int/water_sanitation_health/dwq/chemicals/en/ph.pdf.
14. Ambica A. Groundwater quality characteristics study by using water qualityindex in Tambaram area, Chennai, Tamil Nadu. Middle East J Sci Res.2014;20(11):1396–401.
15. Rahman MM, Mukherjee D, Sengupta MK, Chowdhury UK, Lodh D, Ranjan C,et al. Effectiveness and reliability of arsenic field testing kits: are the milliondollar screening projects effective or not. Environ Sci Technol. 2002;36(24):5385–94.
16. Yisa J, Jimoh T. Analytical studies on water quality index of river Landzu.Am J Appl Sci. 2010;7:453–8.
17. Tyagi S, Singh P, Sharma B, Singh R. Assessment of water quality for drinkingpurpose in District Pauri of Uttarkhand India. Appl Ecol Environ Sci.2014;2(4):94–9.
18. Thundiyil JG, Yuan Y, Smith AH, Steinmaus C. Seasonal variation of arsenicconcentration in wells in Nevada. Environ Res. 2007;104(3):367–73.
19. Shrestha SM, Rijal K, Pokhrel MR. Spatial distribution and seasonal variationof arsenic in groundwater of the Kathmandu Valley Nepal. J Inst SciTechnol. 2014;19(2):7–13.
20. Parker KT. What are the benefits of drinking alkaline water? 2013. Available:http://www.livestrong.com/article/498701-what-are-the-benefits-of-drinking-alkaline-water/.
21. Napacho ZA, Manyele SV. Quality assessment of drinking water in Temekedistrict (part II): characterization of chemical parameters. Afr J Environ SciTechnol. 2010;4:775–89.
22. Khan K, Wasserman GA, Liu X, Ahmed E, Parvez F, et al. Manganeseexposure from drinking water and children’s academic achievement.Neurotoxicology. 2012;33:91–7.
23. Islam MA, Karim MR, Higuchi T, Sakakibara H, Sekine M. Comparison of thetrace metal concentration of drinking water supply options in southwestcoastal areas of Bangladesh. Appl Water Sci. 2014;4:183–91.
24. Khan AE, Ireson A, Kovats S, Mojumder SK, Khusru A, et al. Drinking watersalinity and maternal health in coastal Bangladesh: implications of climatechange. Environ Health Perspect. 2011;119:1328–32.
25. Wasserman GA, Liu X, Parvez F, Ahsan H, Levy D, et al. Water manganeseexposure and children’s intellectual function in Araihazar Bangladesh.Environ Health Perspect. 2006;114:124–9.
26. Bouchard MF, Sauve S, Barbeau B, Legrand M, Brodeur M-E, et al. Intellectualimpairment in school-age children exposed to manganese from drinkingwater. Environ Health Perspect. 2011;119:138–43.
27. Hafeman D, Factor-Litvak P, Cheng Z, van Geen A, Ahsan H. Associationbetween manganese exposure through drinking water and infant mortalityin Bangladesh. Environ Health Perspect. 2007;115:1107–12.
28. Roels HA, Bowler RM, Kim Y, Henn BC, Mergler D, et al. Manganeseexposure and cognitive deficits: a growing concern for manganeseneurotoxicity. Neurotoxicology. 2012;33:1–19.
29. Rahman SM, Åkesson A, Kippler M, Grandér M, Hamadani JD, et al. Elevatedmanganese concentrations in drinking water may be beneficial for fetalsurvival. PLoS ONE. 2013;8:e74119.
30. Merrill RD. Dietary iron may flow from tubewells in rural Bangladesh, 2012.Available: http://water.jhu.edu/magazine/dietary-iron-may-flow-from-tubewells-in-rural-bangladesh/.
31. Merrill RD, Shamim AA, Ali H, Labrique AB, Schulz K, et al. High prevalence ofanemia with lack of iron deficiency among women in rural Bangladesh: a rolefor thalassemia and iron in groundwater. Asia Pac J Clin Nutr. 2012;21:416–24.
32. Merrill RD, Shamim AA, Ali H, Jahan N, Labrique AB, et al. Iron status ofwomen is associated with the iron concentration of potable groundwaterin rural Bangladesh. J Nutr. 2011;141:944–9.
33. Baby A, Venugopal J, D’silva R, Chacko S, Vineesha P, et al. Knowledge onmanagement of anemia during pregnancy: a descriptive study. Med HealthSci. 2014;2:140–4.
34. Kraft S. What is nutritional deficiency anemia? What causes nutritionaldeficiency anemia? 2014.
35. Heming N, Montravers P, Lasocki S. Iron deficiency in critically ill patients:highlighting the role of hepcidin. Crit Care. 2011;15:210.
36. Lindstrom E, Hossain MB, Lonnerdal B, Raqib R, Arifeen SE, et al. Prevalenceof anemia and micronutrient deficiencies in early pregnancy in rural Bangladesh.Acta Obstet Gynecol Scand. 2011;90:47–56.
37. Haque M, Budi A, Azam Malik A, Suzanne Yamamoto S, Louis V, et al. Healthcoping strategies of the people vulnerable to climate change in a resource-poor rural setting in Bangladesh. BMC Public Health. 2013;13:565.
38. Egereonu UU, Nwachukwu UL. Evaluation of the surface and groundwaterresources of Efuru river catchment, Mbano, South Eastern Nigeria. Modelling,Measurement and Control. 2005. 66
39. Rahman AA, Ravenscroft P. Groundwater resources and development inBangladesh: background to the arsenic crisis, agricultural potential and theenvironment. Dhaka: The University Press Limited; 2003. 466 p.
40. Rasheed S, Jahan S, Sharmin T, Hoque S, Khanam MA, et al. How much saltdo adults consume in climate vulnerable coastal Bangladesh? BMC PublicHealth. 2014;14.
41. Khan AE, Scheelbeek PFD, Shilpi AB, Chan Q, Mojumder SK, et al. Salinity indrinking water and the risk of (pre)eclampsia and gestational hypertensionin coastal Bangladesh: a case-control study. PLoS ONE. 2014;9:e108715.
42. Brown IJ, Tzoulaki I, Candeias V, Elliott P. Salt intakes around the world:implications for public health. Int J Epidemiol. 2009;38:791–813.
43. World Health Organization (WHO). Population salt reduction strategies forthe prevention and control of non-communicable diseases in South-EastAsia region. New Delhi: World Health Organization; 2013. p. 48.
44. He FJ, Li J, MacGregor GA. Effect of longer term modest salt reduction onblood pressure: Cochrane systematic review and meta-analysis of randomizedtrials. BMJ. 2013;346.
45. Saint-Jacques N, Parker L, Brown P, Dummer T. Arsenic in drinking waterand urinary tract cancers: a systematic review of 30 years of epidemiologicalevidence. Environ Health. 2014;13:44.
46. Hossain M, Rahman SN, Bhattacharya P, Jacks G, Saha R, et al. Sustainabilityof arsenic mitigation interventions—an evaluation of different alternativesafe drinking water options provided in MATLAB, an arsenic hot spot inBangladesh. Front Environ Sci. 2015;3.
47. Santra SC, Samal AC, Bhattacharya P, Banerjee S, Biswas A, et al. Arsenic infood chain and community health risk: a study in gangetic west Bengal.Procedia Environ Sci. 2013;18:2–13.
48. Chapman D. Water quality assessment—a guide to use biota, sedimentand water in environmental monitoring. Report No. 041921590. London:E&FN Spon, an imprint of Chapman & Hall; 1996. 626 p.
Akter et al. Journal of Health, Population and Nutrition (2016) 35:4 Page 12 of 12