PWGSC Contract Number: H1011-08009/001/CY POR Registration Number: 095-08 HC POR: 08-14 Contract Award Date: February 27, 2009 Water Quality On-Reserve Quantitative Research FINAL REPORT Ce rapport est également disponible en français Submitted to: Health Canada [email protected]EKOS RESEARCH ASSOCIATES INC. July 28, 2009
Transcript
PWGSC Contract Number: H1011-08009/001/CY
POR Registration Number: 095-08
HC POR: 08-14
Contract Award Date: February 27, 2009
Water Quality On-Reserve Quantitative Research
FINAL REPORT Ce rapport est également disponible en français
2.1 Sources of Water Quality....................................................................................... 7 2.2 Perceptions of Water Quality and Safety............................................................. 8 2.3 Communications Needs Regarding Water Quality.......................................... 16 2.4 Tap Water Usage................................................................................................... 19 2.5 Use of Unfiltered Tap Water............................................................................... 21 2.6 Water Advisories................................................................................................... 24 2.7 Communications of Boil Water Advisories....................................................... 26 2.8 Profile of Recent BWA or DWA Reserve Residents....................................... 29
APPENDIX A: First Nations Survey Instrument APPENDIX B: General Population, Small Communities Survey Instrument APPENDIX C: Response Rates APPENDIX D: Detailed Tables (under separate cover)
EKOS RESEARCH ASSOCIATES, 2009 • iii
EXECUTIVE SUMMARY
Health Canada (HC), in collaboration with Indian and Northern Affairs Canada, assists First Nations (FN) in
ensuring safe drinking water in their communities. Part of the challenge facing HC is the role of perception of
the members of First Nations communities with regards to the safety of their drinking water. Water
treatment, monitoring and testing are ineffective if people don’t believe that their water is safe to drink and
are using alternative sources, such as bottled water, instead of that provided by the community. The
purpose of this research is to gain insight into the views of the First Nations On-Reserve population on the
quality of the water to which they have access on reserves. This will help to assess the effect of current on-
reserve water quality programs and allow us to compare perceptions of water quality to those living in other
small communities. The major objective is to find out how people feel about the safety of their water, and
whether there has been a change in this perception since the implementation of the First Nations Water and
Wastewater Action Plan (FNWWAP) in order to measure how effective programs are (whether through
increased communication, education or actual improvement of facilities, treatment and monitoring) in
increasing people’s confidence in and use of the water provided by the community.
The study involved the collection of a brief (ten minute) interview with roughly 700 residents of First Nations
communities and 700 residents of other small communities (not on a reserve) with populations of less than
5,000, which are not bordering a large urban area. Common questions were used to assess perceptions of
water quality, safety, changes over time and uses of filtered, unfiltered and bottled water, as well as,
incidence and frequency of Boil Water Advisories, and in the case of First Nations residents, recall of Boil
Water Advisories on the radio. Results are national in scope and were collected by telephone in March and
April of 2009.
MAIN FINDINGS
Results highlight the dramatic difference in confidence levels between First Nations and other residents
when it comes to the quality of their water. First Nations residents are less positive about the quality of the
water they receive than are residents of other small communities. Fewer than half of First Nations residents
rated the quality of their drinking water as good, which is considerably lower than the 63 per cent of
residents of other small communities (i.e., the general public) who provided the same positive rating about
their own water. In fact, more than one-quarter of First Nations residents consider their drinking water quality
to be poor, whereas smaller proportions of residents of other small communities provided the same type of
negative rating of their water. Comparison to results in 2007 suggests, however, that perhaps the
perceptions around water quality have improved marginally for First Nations in the worst cases, given that
fewer today say that the quality is poor, compared with the 33 per cent who provided this rating of the water
quality in 2007.
In terms of safety, results were marginally more positive; whereby three in ten First Nations residents view
their tap water supply as very safe, and nearly four in ten think it somewhat safe. Nonetheless, three in ten
iv • EKOS RESEARCH ASSOCIATES, 2009
feel that their water is either somewhat or very unsafe. Considerably higher proportions of residents of other
small communities perceive their tap water supply to be safe (89 per cent saying somewhat or very safe,
compared with 69 per cent of residents on reserves). Again, results suggest a slight improvement since
2007 for First Nations on-reserve, when 62 per cent said that their water was somewhat or very safe and 36
per cent said that it was unsafe (contrasted against 29 per cent today).
Among First Nations residents living on-reserve, the region they are located in, their proximity to other
communities, and the population size, along with whether they have had any Boil Water Advisories (BWA’s)
(currently or in the past) each have linkages to perceptions of the quality and safety of water on their
reserve. This is also true of the number of individuals in the home which contribute to a sense of
vulnerability, as they tend to increase concerns about water quality and safety.
The presence of pollutants and/or mineral content was noted by one-quarter of First Nations respondents as
the reason they think their water supply is unsafe. A comparison against the responses of residents of other
small communities suggests that First Nations residents are more likely to blame their unsafe water on
pollution and the qualities of the water that they can feel/perceive themselves (i.e., pollution, chemicals,
taste). Other members of the general public are more apt to suspect the treatment facilities, the water
source, and to point to BWA’s and general discussion (e.g., in the media) about poor water quality in small
communities.
More than one-third of First Nations residents believe that their water quality has remained the same over
the past five years. Four in ten believe that the water is now safer than it was, although, just under one in
five judge the water to be less safe to drink than it was five years ago. The general public, on the other
hand, are slightly less apt to say there had been a deterioration in their water quality over the last five years.
Results for First Nations communities show a marginal improvement over 2007 when 23 per cent judged
their water to be very or somewhat unsafe (compared with the current 18 per cent).
In terms of what would make First Nations on reserve feel safer about their tap water quality, water
filtration/treatment and/or utilities infrastructure topped the list, according to one in four. This was followed by
more frequent water quality testing. Results were similar for residents of other small communities.
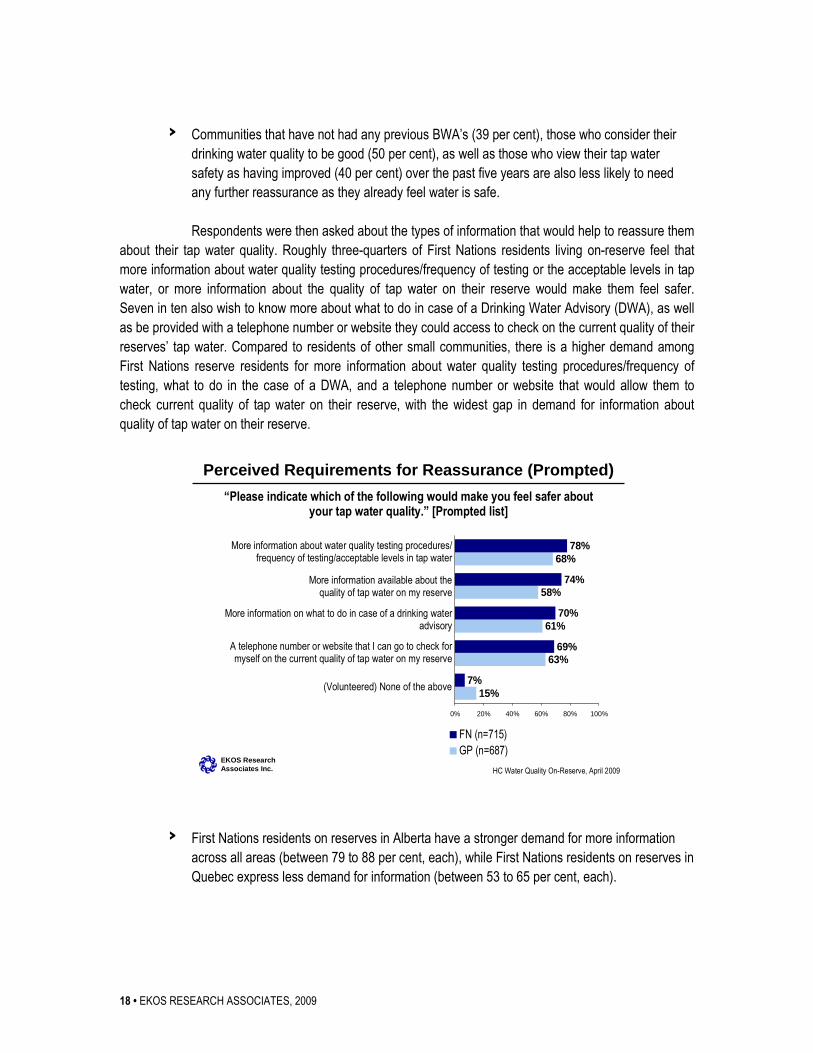
When prompted specifically about the types of information that would help to reassure them about their tap
water quality, roughly three-quarters of First Nations residents living on-reserve each said that more
information about water quality testing procedures/frequency of testing or the acceptable levels in tap water,
or information about the quality of tap water on their reserve, would make them feel safer. Seven in ten also
wish to know more about what to do in case of a Drinking Water Advisory (DWA), as well as being provided
with a telephone number or website they could access to check on the current quality of their reserves tap
water. Compared to residents of other small communities, there is a higher demand among First Nations
reserve residents for more information about quality of tap water on their reserve, water quality testing
procedures/frequency of testing, what to do in the case of a DWA and a telephone number or website that
would allow them to check current quality of tap water on their reserve.
EKOS RESEARCH ASSOCIATES, 2009 • v
First Nations residents are generally less apt to use their tap water across all applications compared with
residents of other small communities. They are, for example, most apt to use their tap water for brushing
teeth, and washing food, followed by it’s use in cooking, and, to a lesser extent, coffee or tea preparation. It
is less frequently used for drinking, or for food preparation that involves mixing ingredients with water. And,
these are less frequently used applications on-reserve, relative to the usage in other small communities (in
the general public). In most cases, there is a slightly increase of a few percentage points in use of tap water
for individual applications on-reserve since 2007, with the most notable increase occurring in drinking.
Only one in four residents on reserves use purely unfiltered water for drinking. Usage of unfiltered water
increases to roughly half of residents in its application for food and beverage preparation, such as water for
use as an ingredient in food preparation or for coffee or tea preparation. It increases again for cooking,
washing food, and brushing teeth. Residents on reserves are more likely than residents of other small
communities to use a combination of bottled and filtered water for all applications explored in the survey.
One in five First Nations people living on-reserve said that they use bottled instead of tap water because it is
supposed to be better for you, because they don’t trust their tap water, because they prefer the taste or
smell of bottled water, or because bottled water is more convenient to drink. Significantly more residents of
other small communities cited the latter two reasons (i.e., taste and convenience).
Four in ten First Nations people living on-reserve indicate that they have been or are currently under a
Drinking or Boil Water Advisory. This is compared with one in four residents in other small communities. In
fact, one in ten residents on reserves reported a boil water advisory at the time or within a few weeks of the
survey collection (in April).
Nearly half of First Nations people on-reserve who reported a DWA within the past 12 months
also reported that they recall hearing a public service announcement on the radio, most of them saying that
they found the announcement useful. Fewer than one in five have seen a door hanger addressing DWA’s on
their reserve, with about eight in ten of them saying that they found the information on the door hanger be
useful. Awareness of a poster discussing DWA’s is mixed, with just under half indicating that they have seen
the poster. Of those who have seen the poster, most found it to be useful.
Supplier Name: EKOS Research Associates
PWGSC Contract Number: H1011-08009/001/CY
HC POR: 08-14
Contract Award Date: February 25, 2009
To obtain more information on this study, please e-mail [email protected]
vi • EKOS RESEARCH ASSOCIATES, 2009
SOMMAIRE
Santé Canada (SC), en collaboration avec les Affaires indiennes et du Nord Canada, aide les Premières
nations à s’assurer de la salubrité de l’eau potable de leurs communautés. Le rôle des perceptions des
membres des communautés des Premières nations en ce qui concerne la salubrité de leur eau potable
représente l’un des défis auxquels SC fait face. L’épuration, la surveillance et l’analyse de l’eau s’avèrent
inefficaces si les gens ne croient pas que leur eau est bonne à boire et s’ils utilisent d’autres sources,
comme de l’eau embouteillée, au lieu de celle fournie dans leur communauté. Le but de la présente
recherche est de mieux comprendre les opinions des résidents des Premières nations vivant dans des
réserves en ce qui concerne la qualité de l’eau à laquelle ils ont accès dans leur propre réserve. Cela aidera
à évaluer l’effet des programmes actuels sur la qualité de l’eau dans les réserves et nous permettra de
comparer leurs perceptions sur la qualité de l’eau avec celles d’autres petites communautés. Le principal
objectif de la présente étude consiste à savoir comment les gens se sentent par rapport à la salubrité de
leur eau et à découvrir s’il y a eu un changement dans ces perceptions depuis la mise en œuvre du Plan
d'action pour l'approvisionnement en eau potable et le traitement des eaux usées des Premières nations
(Plan d’action pour l’eau) de manière à mesurer l’efficacité des programmes (que ce soit par le biais d’une
communication accrue, de formations ou d’une amélioration réelle des installations, de l’épuration et de la
surveillance) et à augmenter la confiance des gens à l’égard de l’eau et de l’utilisation de l’eau fournie aux
communautés.
L’étude suppose la collecte de renseignements par le biais d’un court entretien (de dix minutes) avec
environ 700 résidents de communautés des Premières nations et de 700 résidents d’autres petites
communautés (à l’extérieur des réserves) de moins de 5000 habitants qui ne sont pas situées à proximité
de grands centres urbains. Des questions communes ont été utilisées pour évaluer les perceptions
concernant la qualité et la salubrité de l’eau, les changements de l’eau au fil du temps, l’utilisation d’eau
embouteillée, d’eau filtrée et d’eau non filtrée, ainsi que l’incidence et la fréquence des Avis d’ébullition de
l’eau et, dans le cas des résidents des Premières nations, des rappels radiophoniques des Avis d’ébullition
de l’eau. Les résultats, de portée nationale, ont été recueillis par téléphone en mars et en avril 2009.
PRINCIPAUX RÉSULTATS
Les résultats mettent en évidence la différence remarquable entre les niveaux de confiance des membres
des Premières nations et ceux d’autres résidents lorsqu’il est question de la qualité de leur eau. Les
résidents des Premières nations sont moins positifs que les résidents d’autres petites communautés à
l’égard de la qualité de l’eau à laquelle ils ont accès. Un peu moins de la moitié des résidents des Premières
nations considère la qualité de leur eau potable comme bonne, ce qui est considérablement plus bas que le
63 p. cent des résidents d’autres petites communautés (c.-à-d. le grand public) qui ont donné cette même
note positive. En fait, plus du quart des résidents des Premières nations considère la qualité de leur eau
potable comme faible, alors que de plus petites proportions de résidents d’autres petites communautés ont
attribué la même évaluation négative à leur eau. Toutefois, une comparaison avec les résultats de 2007
EKOS RESEARCH ASSOCIATES, 2009 • vii
donne à penser que les perceptions entourant la qualité de l’eau se sont peut-être légèrement améliorées
pour les Premières nations dans les pires cas puisqu’un moins grand nombre de ces résidents affirment
aujourd’hui que la qualité de l’eau est faible, comparativement aux 33 p. cent qui avaient ainsi évalué la
qualité de leur eau en 2007.
En ce qui concerne la salubrité de l’eau, les résultats étaient légèrement plus positifs : trois résidents des
Premières nations sur dix considèrent leur eau de robinet comme très salubre et près de quatre sur dix
croient qu’elle est plutôt salubre. Néanmoins, trois répondants sur dix sont d’avis que leur eau est plutôt
insalubre ou très insalubre. Des proportions considérablement plus élevées de résidents de petites
communautés considèrent leur eau de robinet comme salubre (89 p. cent affirment qu’elle est plutôt salubre
ou très salubre, comparativement à 69 p. cent des résidents vivant dans des réserves). Encore une fois, les
résultats suggèrent une légère amélioration par rapport à 2007 pour les résidents des Premières nations
vivant dans des réserves; en effet, 62 p. cent affirmaient alors que leur eau était plutôt salubre ou très
salubre et 36 p. cent estimant qu’elle était insalubre (comparativement à 29 p. cent aujourd’hui).
Parmi les résidents des Premières nations vivant dans des réserves, la région dans laquelle ils se trouvent,
leur proximité à d’autres communautés, la taille de leur population ainsi que le fait qu’ils aient reçu ou non
des Avis d’ébullition de l’eau (maintenant ou par le passé) ont tous des liens avec les perceptions qu’ils ont
de la qualité et de la salubrité de l’eau dans leur réserve. Cela est également vrai pour le nombre d’individus
par maison, ce fait contribuant au sentiment de vulnérabilité, ce qui a tendance à faire hausser les
préoccupations concernant la qualité et la salubrité de l’eau.
La présence de polluants et/ou de minéraux a été notée par le quart des répondants des Premières nations
comme la raison pour laquelle ils estiment que leur eau est insalubre. Une comparaison avec les réponses
de résidents d’autres petites communautés donne à penser que les résidents des Premières nations sont
plus susceptibles d’attribuer à l’insalubrité et à la qualité de leur eau les aspects qu’ils peuvent eux-mêmes
sentir/percevoir (c.-à-d. pollution, produits chimiques, goût). D’autres membres du grand public sont plus
susceptibles de suspecter les installations d’épuration ainsi que la source de l’eau et de nommer les Avis
d’ébullition de l’eau et les études générales (p. ex., dans les médias) pour faire remarquer la faible qualité
de l’eau dans les petites communautés.
Plus du tiers des résidents des Premières nations estime que la qualité de leur eau est demeurée la même
au cours des cinq dernières années. Quatre répondants sur dix sont d’avis que l’eau est maintenant plus
salubre qu’elle ne l’était et un peu moins d’un répondant sur cinq croit qu’il est moins sécuritaire de boire
l’eau maintenant qu’il y a cinq ans. Le grand public, par contre, est légèrement moins susceptible d’affirmer
qu’il y a eu une détérioration de la qualité de leur eau au cours des cinq dernières années. Les résultats des
communautés des Premières nations démontrent une légère amélioration par rapport à 2007 où 23 p. cent
des répondants étaient d’avis que leur eau était plutôt insalubre ou très insalubre (comparativement à 18
p. cent à l’heure actuelle).
Pour ce qui est de ce qui aiderait les Premières nations vivant dans des réserves à se sentir plus en
sécurité par rapport à la qualité de leur eau de robinet, selon un répondant sur quatre, la filtration et
viii • EKOS RESEARCH ASSOCIATES, 2009
l’épuration de l’eau et/ou l’infrastructure des installations apparaissaient au haut de la liste, suivi par
l’analyse plus fréquente de la qualité de l’eau. Les résultats étaient semblables pour les résidents d’autres
petites communautés.
Lorsque nous les avons invités à préciser les types de renseignements qui aideraient à les rassurer quant à
la qualité de leur eau de robinet, environ les trois quarts des résidents des Premières nations vivant dans
des réserves ont évoqué l’information sur les procédures d’analyse de la qualité de l’eau/la fréquence de
l’analyse, les niveaux acceptables dans l’eau de robinet ou la qualité de l’eau de robinet de leur réserve.
Sept répondants sur dix ont également manifesté le désir d’en savoir plus sur ce qu’il faut faire lors d’un
Avis d’ébullition de l’eau et d’avoir un numéro de téléphone où ils peuvent appeler ou un site Web qu’ils
peuvent consulter pour vérifier la qualité actuelle de l’eau de robinet de leur réserve. Comparativement aux
résidents d’autres petites communautés, les résidents des Premières nations vivant dans des réserves
veulent davantage d’information sur la qualité de l’eau de robinet des réserves, les procédures d’analyse de
la qualité de l’eau et la fréquence de l’analyse, la marche à suivre lors d’un Avis d’ébullition de l’eau et un
numéro de téléphone où ils peuvent appeler ou d’un site Web qu’ils peuvent consulter pour vérifier la qualité
actuelle de l’eau de robinet de leur réserve.
Les résidents des Premières nations sont généralement moins susceptibles que les résidents d’autres
petites communautés d’utiliser leur eau de robinet pour toutes les applications mentionnées dans l’étude.
Par exemple, ils sont plus susceptibles d’utiliser leur eau de robinet pour se brosser les dents et nettoyer de
la nourriture, suivi par l’utilisation pour cuisiner et, d’une façon moins considérable, pour préparer du thé ou
du café. L’eau est moins fréquemment utilisée pour être bue ou pour préparer de la nourriture lorsqu’il faut
la mélanger à des ingrédients. Ces applications sont moins souvent utilisées dans les réserves que dans les
petites communautés (par le grand public). Dans la plupart des cas, il y a une légère augmentation de
quelques points de pourcentage dans l’utilisation de l’eau de robinet pour les applications dans les réserves
depuis 2007, l’augmentation la plus notable étant le fait de boire l’eau.
Seul un résident des réserves sur quatre boit de l’eau pure non filtrée. L’utilisation d’eau non filtrée
augmente à environ la moitié des résidents pour la préparation de nourriture/boissons et pour l’utilisation de
l’eau comme ingrédient dans la préparation de nourriture, de thé ou de café. Elle augmente également
lorsqu’il est question de cuisiner, de nettoyer des aliments et de se brosser les dents. Les résidents des
réserves sont plus susceptibles que ceux d’autres petites communautés d’utiliser une combinaison d’eau
filtrée et non filtrée pour toutes les applications abordées dans le sondage.
Seul un répondant sur cinq des résidents des Premières nations vivant dans une réserve affirme utiliser de
l’eau embouteillée au lieu de l’eau du robinet parce qu’elle est censée être meilleure, parce qu’il ne se fie
pas à l’eau de robinet, parce qu’il préfère le goût ou l’odeur de l’eau embouteillée ou parce que l’eau
embouteillée est plus pratique à boire. Beaucoup plus de résidents d’autres petites communautés ont cité
les deux dernières raisons évoquées (c.-à-d. le goût et l’aspect pratique).
Quatre répondants sur dix des résidents des Premières nations vivant dans une réserve indiquent qu’ils ont
reçu un Avis d’ébullition de l’eau potable ou qu’un tel avis est actuellement en vigueur dans leur réserve,
EKOS RESEARCH ASSOCIATES, 2009 • ix
comparativement à un résident sur quatre des autres petites communautés. En fait, un résident sur dix
vivant dans une réserve déclarait avoir reçu un Avis d’ébullition de l’eau au moment de répondre au
sondage (en avril) ou quelques semaines auparavant.
Près de la moitié des membres des Premières nations vivant dans des réserves qui ont fait mention d’un
Avis d’ébullition de l’eau au cours des douze mois précédents ont également déclaré se rappeler avoir
entendu un message d’intérêt public à la radio, la plupart d’entre eux affirmant trouver le message utile.
Moins d’un répondant sur cinq a vu dans sa réserve un carton à la porte annonçant un Avis d’ébullition de
l’eau. Environ huit de ces répondants sur dix affirment trouver utiles les renseignements se trouvant sur ces
cartons. La sensibilisation entourant les affiches annonçant les Avis d’ébullition de l’eau était mitigée, un
peu moins de la moitié des répondants indiquant avoir vu l’affiche. La plupart de ceux qui ont vu l’affiche la
trouvaient utile.
Nom du fournisseur : Les Associés de recherche EKOS
Numéro de contrat à TPSGC : H1011-08009/001/CY
RPO de SC : 08-14
Date d’attribution du contrat : 25 février 2009
Pour obtenir de plus amples renseignements sur cette étude, veuillez en voyer un courriel à : por-rop@hc-
sc.gc.ca
EKOS RESEARCH ASSOCIATES, 2009 • 1
1. INTRODUCTION
1.1 CONTEXT AND RATIONALE
Health Canada (HC), in collaboration with Indian and Northern Affairs Canada, assists First
Nations (FN) in ensuring safe drinking water in their communities. Health Canada works in partnership with
First Nations communities to ensure drinking water quality monitoring programs are in place in communities,
south of 60 degrees parallel, as per the Guidelines for Canadian Drinking Water Quality (GCDWQ).
Environmental Health Officers (EHOs) employed by HC, review and interpret drinking water quality results
for four types of GCDWQ: microbiological, chemical, physical and radiological parameters. Drinking water
quality results are then disseminated by EHOs or Community-Based Drinking Water Quality Monitors
(CBWMs) to FN communities and other appropriate stakeholders.
In communities where it is difficult or impossible to test drinking water samples for
microbiological parameters on a regular basis and/or get microbiological water samples to a laboratory in a
timely manner, HC helps FN communities establish community-based drinking water quality sampling and
testing capabilities. The department facilitates water sampling and testing through the on-going support and
training of CBWMs. Quality assurance and quality control are maintained by EHOs, employed by HC. If a
community does not have a CBWM, with the community's permission, an EHO will sample and test drinking
water quality for microbiological parameters.
EHOs are also responsible for recommending orally and in writing to the appropriate parties
that a Boil Water Advisory (BWA) should be issued in the event of unsatisfactory results in water distribution
systems with five or more connections. It is then the responsibility of Chief and Council to issue the BWA,
orally and in writing, to all users of the drinking water, government health officials, elected officials, the
media, and the general public. The EHO is available to provide Chief and Council advice, assistance and
recommendations.
Part of the challenge facing HC is the role of perception of the members of First Nations
communities with regards to the safety of their drinking water. Water treatment, monitoring and testing are
ineffective if people don’t believe that their water is safe to drink and are using alternative sources, such as
bottled water, instead of that provided by the community. Therefore, it is necessary to find out how people
feel about the safety of their water, and whether there has been a change in this perception since the
implementation of the First Nations Water and Wastewater Action Plan (FNWWAP), formerly known as the
First Nations Water Management Strategy (FNWMS) in order to measure how effective programs are
(whether through increased communication, education or actual improvement of facilities, treatment and
monitoring) in increasing people’s confidence in and use of the water provided by the community.
2 • EKOS RESEARCH ASSOCIATES, 2009
Perceptions around water quality and safety clearly have a strong impact on decisions about
how to use tap water. Most residents on reserves use their tap water for a wide range of everyday
applications, such as tooth brushing, food preparation and cooking. Depending on whether the tap water is
or is not safe, there are households either drinking unsafe tap water, or households consuming bottled water
who need not do so.
1.2 RESEARCH OBJECTIVES The purpose of this research is to gain insight into the views of the First Nations On-Reserve
population on the quality of the water to which they have access on reserves. This will help to assess the
effect of current on-reserve water quality programs and allow us to compare perceptions of water quality to
those living off reserve.
Specific objectives include:
› Assess perceived satisfaction with quality, quantity and safety of drinking water quality on
reserves;
› Understand purposes for which tap water is used on reserves;
› Determine the sources used in supplying First Nations households with water;
› Compare responses to similar research conducted in 2007; and,
› Evaluate drinking water quality of First Nations living on-reserve compared to the general
population living in similarly small communities.
1.3 METHODOLOGY
During the data collection, the survey team collected 687 interviews with residents of small
communities in the broader general public, as well as 715 cases among residents of First Nations reserves
across the country. No stratification was performed to increase the representation of any particular region of
the country. In the small communities where members of the general public were interviewed, the
community size was capped at 5,000 residents. As well, any communities that were located within or
immediately next to (i.e. within 1 km) Census Metropolitan Areas (CMAs) were also excluded, assuming that
they would have access to urban water filtration systems. All reserve communities were included in the First
Nations sample, including 15 per cent that have more than 5000 residents. From the two sample frames
built (i.e., all communities that are not classified as a reserve and are not located near a large city, with no
more than 5,000 residents, and all reserve communities), a randomly selected number of households were
drawn for the telephone survey samples. All participants were asked if they consider themselves an
Aboriginal person and if they live on a reserve for at least six months a year. In the analysis, 13 cases that
were originally collected in the general public sample were re-coded to the First Nations sample of on-
reserve residents, based on the answers of these respondents. Each of the two samples yields a level of
EKOS RESEARCH ASSOCIATES, 2009 • 3
precision of up to +/-3.7 per cent for the sample overall at a 0.05 confidence level (i.e., 19 times out of 20)
and +/-8 to 10 per cent for most sub-groups that could be isolated in the analysis (including regions).
The survey data were collected over two and three-week periods for the general public (March
17 to March 29) and First Nations on-reserve (April 8 to April 29) samples. Data collection relied on standard
monitoring and call-back techniques (i.e., rotation of sample to different times and days of the week and six
call-backs). The average length of the interview was nine minutes for the general public and 11 for First
Nations residents on reserves (including a few additional questions targeted for only residents on reserves).
The survey collection obtained a response rate of 19 per cent for the general public and 24 per cent for First
Nations residents on reserves. Appendix B presents details of these calculations.
Prior to conducting the general population survey, the survey instrument was tested with 30
(15 in English and 15 in French) participants, with changes being made after the first 5 to 10 and then again
after 10 interviews, to ensure that any changes were addressing particular issues experienced in the
interviews. These related to small wording changes and skip logic. The final survey instruments can be
found in Appendices A and B.
Survey data were weighted regionally to reflect population figures for First Nations people
living on-reserve and for small communities with populations of under 5,000 (i.e., the general public). Survey
data were also coded for open ended responses and tabular results were generated to test for differences
between residents of First Nations and residents of other small communities in the general public. Results
for First Nations residents on reserves were also generated in tables by key segments of the sample,
including demographic characteristics (e.g., gender age, education, presence of children), characteristics of
the community (e.g., size, proximity to a large centre, frequency of Boil Water Advisories) and perceptions
about the water (e.g., quality, safety, change over time).
Some questions are repeated measures from a survey conducted with First Nations residents
in 20071. Where applicable, survey results from 2007 are featured in the charts and discussed in the report.
1.4 SAMPLE CHARACTERISTICS
The following is a comparison of the sample for First Nations residents on reserves as well as
the sample of residents of other small communities under 5,000 (in the general public).
1 Custom questions included on the 2007-2008 EKOS Research First Nations On-Reserve Syndicated Study.
4 • EKOS RESEARCH ASSOCIATES, 2009
Characteristics of the Samples
FN GP
Province
British Columbia 22% 10%
Alberta 12% 8%
Saskatchewan 15% 10%
Manitoba 17% 7%
Ontario 15% 10%
Quebec 10% 33%
Maritimes 5% 19%
Yukon/NWT/Nunavut 5% 2%
As far as you know, how far is your community from the closest major city
(in kilometres)?
1-50 km 26% 40%
51-100 km 16% 26%
Over 100 km 36% 27%
Gender
Male 43% 45%
Female 57% 55%
In what year were you born? (What is your age?)
<25 12% 1%
25-34 17% 10%
35-44 21% 14%
45-54 21% 25%
65+ 26% 49%
What is the highest level of education that you have completed?
Grade school 32% 11%
High school 34% 36%
College 11% 26%
University 19% 24%
How many people typically live in your household?
1 11% 19%
2 18% 44%
3-4 33% 28%
5+ 38% 9%
How many of those who typically live in your household are children?
None 37% 69%
1-2 34% 23%
3+ 26% 7%
EKOS RESEARCH ASSOCIATES, 2009 • 5
FN GP
Age of Child(en)
Under 2 36% 15%
2-5 years old 41% 29%
6 years or older 80% 79%
How many people over the age of 64 live in your household?
None 74% 68%
1+ 24% 32%
Excluding any young children or seniors over the age of 64, is there anyone living in
your household who is vulnerable to illness?
Yes 16% 10%
No 82% 90%
Is your house used as a daycare for children who do not live in your household?
Yes 5% 3%
No 95% 97%
Vulnerability (Total Computed taking into account those households with: children
under the age of 2, with people over the age of 64, others who are vulnerable to illness
and households used as a daycare)
Yes 52% 44%
No 48% 56%
As shown in the table of sample characteristics, there is a greater concentration
geographically in the west for the on-reserve sample, and First Nations communities are more often located
large distances from major urban centres. The gender split is similar between the two samples. The First
Nations sample is considerably younger than the one collected in other small communities in the general
public. The level of education is also considerably lower in First Nations communities, particularly in the
proportion with grade school. The number of people in the household is often higher in First Nations
communities, with over one-third reporting five or more household members. Twice as many households
report children in them in First Nations communities relative to other rural communities, and children are
often younger (with more than twice as many of households with children reporting at least one child under
than age of two). Given that it is a younger sample, it is not surprising to see that fewer First Nations
households have a senior citizen. Overall, however, including young children, seniors, the presence of a
daycare in the home and other vulnerable members of the household, more First Nations households on-
reserve can be classified as a ‘vulnerable household2’. Survey results show that perceptions of water quality
vary based not only on the characteristics of the community and incidence of Boil Water Advisories, but also
on the characteristics of the household, including whether or not they have young children, vulnerable
household members and are generally considered a ‘vulnerable household’.
2 Vulnerable household is computed on the basis of having young children (or operation of a day care), a senior
citizen, or someone who is otherwise considered vulnerable to illness in the home.
EKOS RESEARCH ASSOCIATES, 2009 • 7
2. SURVEY FINDINGS
Study findings explore the perceptions of First Nations residents on reserves and compare
them to the results of residents in other small communities (i.e., with populations under 5,000) in the general
public. First Nations results are also compared over time to results collected in 2007, where applicable. Sub-
group findings within the First Nations sample of residents living on-reserve are also provided. Survey
findings examine overall perceptions of residents regarding the quality and safety of their water supply, as
well as perceptions about the change in the quality over time. Uses of tap water and frequency of using
bottled or filtered water are also captured, along with the incidence and frequency of Boil Water Advisories
(BWA) in the community. Some elements of communications are also explored, including the type of
information that would enhance confidence in the water supply and also recall of Boil Water Advisory
announcements in First Nations communities.
2.1 SOURCES OF WATER QUALITY
Over half (56 per cent) of First Nations people on-reserve indicate that their main source of
household tap water is piped directly to the home. Other sources of tap water include a cistern (19 per cent),
or an individual well (17 per cent). While these results have not changed significantly over time among First
Nations residents, fewer residents of other small communities have their water piped directly to the home or
through a cistern, and are much more apt than those on-reserve to use an individual well as their source of
tap water. While nearly all (98 per cent) of the general population indicate they receive enough household
tap water, 93 per cent of those on-reserve feel they have enough for all their domestic needs (again within
three points of the results for First Nations communities in 2007).
8 • EKOS RESEARCH ASSOCIATES, 2009
EKOS ResearchAssociates Inc. HC Water Quality On-Reserve, April 2009
Source and Quantity of Household Tap Water“What is the main source of your
household tap water? Is it...?”
3%
40%
4%
48%
2%
17%
19%
56%
0% 20% 40% 60%
FN (n=715)
GP (n=687)
Individual well
Piped directly to the home
Community Well
Cistern (water in a holding tank)
“Do you receive enough household tap water for all your domestic
needs?”
2%
98%
6%
93%
0% 20% 40% 60% 80% 100%
FN (n=715)
GP (n=687)
Yes
No
FN 2007
56
20
18
EKOS FN Syndicated - Wave 1, 2007
FN 2007
90
1
› First Nations residents on reserves in British Columbia (67 per cent) are more apt than those
in any other region to report having their water piped directly to their home. Those in Alberta
(37 per cent) are more likely to have an individual well, while those in Manitoba (28 per cent)
are more likely to have a cistern as their tap water source. Water piped into the home is more
common in the smallest communities (68 per cent with a population under 1000), whereas
wells are cited more frequently in the largest communities (35 per cent with more than 5000
residents).
2.2 PERCEPTIONS OF WATER QUALITY AND SAFETY
Survey respondents were first asked to rate the quality of drinking water in their communities.
Results highlight the dramatic difference in confidence levels between First Nations and other residents
when it comes to the quality of their water. First Nations residents are less positive about the quality of the
water they receive than are residents of other small communities. Fewer than half of First Nations residents
rated the quality of their drinking water as good (44 per cent), which is considerably lower than the 63 per
cent of residents of other small communities (i.e., the general public) who provided the same positive rating
about their water. In fact, more than one-quarter of First Nations residents (27 per cent) consider their
drinking water quality to be poor, and the same proportion provided a more neutral rating of the quality of
their drinking water on-reserve. Smaller proportions of residents of other small communities provided the
same type of negative or neutral rating of their water.
EKOS RESEARCH ASSOCIATES, 2009 • 9
These results are similar to results obtained among First Nations residents two years ago, in
2007. The comparison suggests, however, that perhaps the perceptions around water quality have
improved marginally in the worst cases, given that fewer today say that the quality is poor, compared with
the 33 per cent who provided this rating of the water quality in 2007.
In terms of safety, results were marginally more positive; whereby three in ten First Nations
residents view the safety of their tap water supply as very safe (31 per cent) and nearly four in ten (38 per
cent) think it is somewhat safe. That said, three in ten feel that their water is either somewhat unsafe (18 per
cent) or very unsafe (11 per cent). By comparison, considerably higher proportions of residents of other
small communities perceive their tap water supply to be safe (88 per cent saying somewhat or very safe,
compared with 69 per cent of residents on reserves).
Again, while a comparison to the general public highlights a much greater problem on-reserve,
results over time suggest a slight improvement since 2007, when 62 per cent said that their water was
somewhat or very safe and 36 per cent said that it was unsafe (contrasted against 29 per cent today).
EKOS ResearchAssociates Inc. HC Water Quality On-Reserve, April 2009
Water Quality and Safety“How would you rate the quality of drinking water on your reserve?”
Bad (1-2)
Neither (3)
Good (4-5)
“How safe or unsafe do you think your tap water supply is? Is it…?”
63%
19%
15%
44%
27%
27%
0% 20% 40% 60% 80% 100%
FN (n=715)
GP (n=687)
4%
6%
35%
53%
11%
18%
38%
31%
0% 20% 40% 60% 80% 100%
FN (n=715)
GP (n=687)
Somewhat safe
Very safe
Somewhat unsafe
Very unsafe
FN 2007
33
22
44
EKOS FN Syndicated - Wave 1, 2007
FN 2007
27
35
20
16
10 • EKOS RESEARCH ASSOCIATES, 2009
Among First Nations residents living on-reserve, the region they are located in, their proximity
to other communities, and the population size, along with whether they have had any Boil Water Advisories
(BWA’s) (currently or in the past), each have linkages to perceptions of the quality and safety of water on
their reserve. This is also true of the number of individuals and children in the home which contribute to a
sense of vulnerability and increases concerns about water quality and safety.
› Reserve residents in British Columbia (60 per cent) and in Quebec (64 per cent), as well as in
smaller First Nations communities (i.e., under 500 individuals) typically provide more positive
ratings of their drinking water quality. Residents on reserves in British Columbia (48 per cent),
the smallest reserves, and those closest to a major city, as well as reserves that have not
experienced any BWA’s also hold more positive perceptions of water safety than others do
(rating their tap water supply as very safe). More positive responses about safety come from
residents who believe there has been improvement in the safety of their tap water over the last
five years. In contrast, residents on reserves in Manitoba (32 per cent rate quality as good)
and Alberta (26 per cent) are more critical of the quality of their drinking water.
› Households with children under the age of five and those who have vulnerable individuals in
their home are more critical of the quality of their drinking water. Similarly, households with
children particularly where the children are young (i.e., under two) are typically more negative
in their assessment of the safety of their water. This is also true of households with more
occupants in them.
› Ratings of water quality and safety are typically more negative among residents on reserves in
Alberta (40 per cent rate quality as poor and 20 per cent view tap water supply as very safe),
and in the largest communities (i.e., with over 5000 residents) (43 per cent poor and 19 per
cent very safe), as well as among those who live more than 50kms away from a major city (32
per cent bad and 26 per cent very safe), or are currently or have recently had a drinking/boil
water advisory (46 per cent view water quality as poor and 11 per cent rate safety of water
supply as very safe). The contrast is strongest among those who recall three or more BWA’s in
the past five years (44 per cent rate quality as poor and 13 per cent feel water supply is very
safe); providing the most negative ratings of all residents.
› Residents with tap water piped directly to their homes are more likely to be satisfied overall
with the quality (68 per cent view as good) and safety (70 per cent) of their tap water. Those
with an individual well (31 per cent rate quality as bad and 10 per cent as very safe) or cistern
(25 per cent rate quality as bad and 11 per cent as very safe) more often rate the quality and
safety of their tap water poorly.
EKOS RESEARCH ASSOCIATES, 2009 • 11
Respondents who feel their tap water supply is unsafe (somewhat or very) were asked why
they believe this to be the case. The presence of pollutants and/or mineral content was noted by one-
quarter of First Nations respondents. This was followed by taste (14 per cent), outdated/unsafe treatment
procedures/facilities and utilities (13 per cent), and then appearance (11 per cent). Unsafe/untrustworthiness
of the source of water (11 per cent), presence of chemicals, as well as odour (both cited by 10 per cent of
First Nations respondents) were among the top seven reasons provided for unsafe water.
A comparison against the responses of residents of other small communities suggests that
First Nations residents are more likely to blame pollution and the qualities of the water that they can
feel/perceive themselves (i.e., pollution, chemicals and taste). Other members of the general public are
more apt to suspect the treatment facilities, the water source, and to point to BWA’s and general discussion
(e.g., in the media) about poor water quality in small communities.
› First Nations people on-reserve in British Columbia are more likely than those in any other
region to use unfiltered water for all six water consumption uses (ranging from 40 to 77 per
cent). Residents of the Atlantic also seem higher in their consumption of unfiltered water;
however, the results are not statistically different, often because of small sample size in this
region. Residents on reserves in Ontario are more apt than those in other regions to use both
bottled and filtered water for drinking (54 per cent), as are residents of larger reserves in
general (51 per cent). Ontario residents are also more apt to use bottled and filtered water for
washing food (19 per cent), cooking (22 per cent), brushing teeth (17 per cent) and coffee/tea
preparation (28 per cent).
› Those on-reserve who use bottled plus filtered water are less likely to be comfortable with the
quality and safety of their water, and more apt to have had BWA’s in the past, particularly
when using the water for drinking, cooking or preparing food/drinks.
First Nations people living on-reserve provide a variety of reasons for using bottled instead of
tap water. One in five said that bottled water is supposed to be better for you (23 per cent), that they don’t
trust their tap water (22 per cent), they prefer the taste or smell of bottled water (20 per cent), or that bottled
water is more convenient to drink (19 per cent). Significantly more residents of other small communities
cited the latter two reasons; that they prefer the taste or smell of bottled water or the convenience, when
compared with First Nations residents. A scattering of other reasons for using bottled water were also
provided by residents on reserves, including better filtration in bottled water (of contaminants, minerals, etc.)
(eight per cent), its appearance, that the reserve has had Drinking Water Advisories in the past or is
currently under a drinking Water Advisory, that they prefer it generally, or that it is a habit, or that they have
a greater water supply with bottled water than tap water.
EKOS RESEARCH ASSOCIATES, 2009 • 23
Reasons for Using Bottled Water Over Tap Water
“Why is it that you use bottled water instead of tap water?”
Appearance
Presence of contaminants, mineral content, better filtration
Don't trust my tap water
I prefer the taste/smell of bottled water
Bottled water is supposed to be better for you
Because it is more convenient/easier
3%
4%
31%
26%
15%
13%
5%
8%
19%
20%
22%
23%
EKOS ResearchAssociates Inc. HC Water Quality On-Reserve, April 2009
2%
7%
4%
2%
3%
4%
7%
4%
2%
3%
3%
3%
0% 20% 40% 60%
FN (n=456)GP (n=312)
Other
I have a greater water supply with bottled water than tap water
My reserve is currently under a Drinking Water Advisory
My reserve has been under Drinking Water Advisories in the past
Don’t know
Prefer it generally, habit
(Asked of those who use bottled water for anything in their household)
› First Nations people living on-reserve in Alberta are more likely than those in any other region
to use bottled water because they don’t trust their tap water (39 per cent) or because of the
appearance of their tap water (14 per cent). Residents on reserves in Manitoba are more apt
(36 per cent) than those in other regions to use bottled water because it is supposed to be
better for them. Quebec reserve residents are more likely than others to use bottled water as it
is more convenient and/or easier (32 per cent).
› As one might expect, First Nations residents who drink bottled water because they don’t trust
their tap water are typically less satisfied with the quality (43 per cent) and safety (53 per cent)
of their tap water. Conversely, those who use bottled water because it is more convenient are
24 • EKOS RESEARCH ASSOCIATES, 2009
more apt to be satisfied with the quality (35 per cent rate quality as good) and safety of their
tap water (41 per cent rate tap water as very safe).
2.6 WATER ADVISORIES
Four in ten (42 per cent) First Nations people living on-reserve indicate that they have been or
are currently under a Drinking or Boil Water Advisory. This is compared with 25 per cent of residents in
other small communities. One in ten (11 per cent) residents on reserves reported a boil water advisory
within the past few weeks. One-third (32 per cent) experienced their most recent DWA months ago, while
two in five (41 per cent) recall that the last DWA took place a year or more ago. In comparison, in terms of
when the last DWA or BWA was experienced by the general public, this is rather similar to that which was
experienced by those on-reserve although fewer within the general public were unsure when the last
advisory was issued and thus more (within the general public) identified the last one as having taken place
months ago.
EKOS ResearchAssociates Inc. HC Water Quality On-Reserve, April 2009
Drinking Water Advisories
“Has your reserve ever been or are you currently under a Drinking or Boil Water
Advisory, as far as you know?”
“When was the last Drinking or Boil Water Advisory issued on your reserve?”
9%
41%
40%
10%
16%
41%
32%
11%
0% 20% 40% 60% 80% 100%
FN (n=302)
GP (n=165)
Weeks
Months
Years ago
2%
74%
25%
3%
55%
42%
0% 20% 40% 60% 80% 100%
FN (n=715)
GP (n=687)
Yes
No
Don’t knowDon’t know
› As might be expected, residents on reserves that have had an Advisory are typically less
comfortable overall with the quality (52 per cent rate quality as bad), safety (57 per cent rate
tap water as very unsafe) and deterioration (56 per cent view tap water as less safe compared
to five years ago) of their water.
First Nations people living on-reserve who have not experienced a DWA/BWA within the last
12 months provide a more positive rating of the quality and safety of their tap water supply compared to First
EKOS RESEARCH ASSOCIATES, 2009 • 25
Nations people living on-reserve who have been under a water advisory within this timeframe. While half (51
per cent) of those who have not experienced a DWA/BWA rate their drinking water quality as good, less
than one quarter (23 per cent) of First Nations reserve residents who have experienced a DWA/BWA within
the last 12 months feel the same. Similarly, nearly three quarters (73 per cent) of reserve residents who
have not experienced a DWA/BWA within the last 12 months perceive their tap water supply as somewhat
or very safe, while only half (51 per cent) of First Nations reserve residents who have experienced an
advisory within the last 12 months view their tap water supply this way.
EKOS ResearchAssociates Inc. HC Water Quality On-Reserve, April 2009
Water Quality and Safety: Replicated (1)
EKOS ResearchAssociates Inc. HC Water Quality On-Reserve, April 2009
Water Quality and Safety: Replicated“How would you rate the quality of drinking water on your reserve?”
Bad (1-2)
Neither (3)
Good (4-5)
“How safe or unsafe do you think your tap water supply is? Is it…?”
48%
22%
29%
23%
32%
43%
0% 20% 40% 60% 80% 100%
FN (n=129)
GP (n=79)
11%
14%
34%
38%
21%
26%
39%
12%
0% 20% 40% 60% 80% 100%
FN (n=129)
GP (n=79)
Somewhat safe
Very safe
Somewhat unsafe
Very unsafe
Those who have experienced a DWA/BWA
within the last 12 months
EKOS ResearchAssociates Inc. HC Water Quality On-Reserve, April 2009
Water Quality and Safety: Replicated (2)“How would you rate the quality of drinking water on your reserve?”
Bad (1-2)
Neither (3)
Good (4-5)
“How safe or unsafe do you think your tap water supply is? Is it…?”
68%
17%
12%
51%
25%
23%
0% 20% 40% 60% 80% 100%
FN (n=537)
GP (n=589)
3%
4%
35%
57%
8%
16%
37%
36%
0% 20% 40% 60% 80% 100%
FN (n=537)
GP (n=589)
Somewhat safe
Very safe
Somewhat unsafe
Very unsafe
Those who have not experienced a DWA/BWA
within the last 12 months
26 • EKOS RESEARCH ASSOCIATES, 2009
2.7 COMMUNICATIONS OF BOIL WATER ADVISORIES
Nearly half (45 per cent) of First Nations people on-reserve who reported a DWA within the
past 12 months also reported that they recall hearing a public service announcement about a DWA on the
radio. Of those who had heard this announcement, one in three (36 per cent) recalled being told to boil
water before consuming it, just over one in two (22 per cent) recalled that there was a problem with the
water and another one in six (14 per cent) recalled that they should exercise caution in using/how they use
the water. Of those who heard the radio announcement, most (88 per cent) found the announcement useful.
EKOS ResearchAssociates Inc. HC Water Quality On-Reserve, April 2009
55%
45%
0%20%40%60%80%100%
12%
88%
0% 20% 40% 60% 80% 100%
Awareness of Public Service Announcement on DWA
“Have you heard a public service announcement on the radio regarding
Drinking Water Advisories on your reserve?”
“Did you find this announcement useful?”
NO
YES
n=173 n=78
› Residents on reserve in Manitoba (65 per cent) are more likely than those in any other region
to have heard about the DWA on the radio.
› Households identified as more vulnerable (including having younger children, under the age of
two) are more apt (54 per cent) to have heard the radio announcement.
EKOS RESEARCH ASSOCIATES, 2009 • 27
Fewer than one in five (17 per cent) have seen a door hanger addressing DWA’s on their
reserve. Nearly four in five of those who recall the door hanger (78 per cent) found the information on the
door hanger to be useful in the Advisory and two in three (64 per cent) recall the notification as having
provided purification suggestions.
EKOS ResearchAssociates Inc. HC Water Quality On-Reserve, April 2009
Awareness of A Door Hanger on DWA
“Have you seen a door hanger addressing Drinking Water Advisories
on your reserve?”
“Did you find this useful?”
82%
17%
0%20%40%60%80%100%
19%
78%
0% 20% 40% 60% 80% 100%
NO
YES
n=173 n=30
› Reserve residents whose community has recently or are currently under a DWA are more apt
(27 per cent) to have seen a door hanger addressing these issues.
28 • EKOS RESEARCH ASSOCIATES, 2009
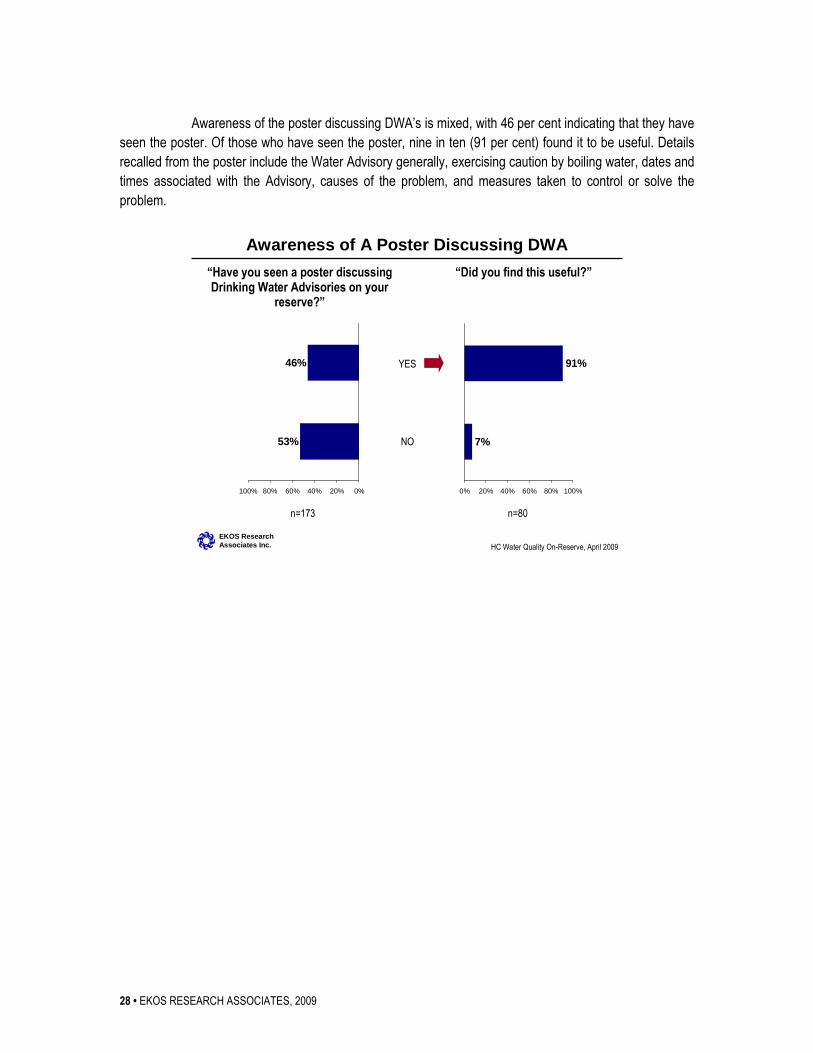
Awareness of the poster discussing DWA’s is mixed, with 46 per cent indicating that they have
seen the poster. Of those who have seen the poster, nine in ten (91 per cent) found it to be useful. Details
recalled from the poster include the Water Advisory generally, exercising caution by boiling water, dates and
times associated with the Advisory, causes of the problem, and measures taken to control or solve the
problem.
EKOS ResearchAssociates Inc. HC Water Quality On-Reserve, April 2009
Awareness of A Poster Discussing DWA
“Have you seen a poster discussing Drinking Water Advisories on your
reserve?”
“Did you find this useful?”
53%
46%
0%20%40%60%80%100%
7%
91%
0% 20% 40% 60% 80% 100%
NO
YES
n=173 n=80
EKOS RESEARCH ASSOCIATES, 2009 • 29
2.8 PROFILE OF RECENT BWA OR DWA RESERVE RESIDENTS
Following is a brief snapshot of the First Nations residents who recently experienced a BWA or
DWA. The results suggest some differences among residents who have experienced an Advisory in the past
four weeks, while other results suggest that a BWA/DWA in the previous year generates different views.
Profile of Reserve Residents According to Last Drinking or Boil Water Advisory Issued
Within the last
1-4 weeks
In last year (but not
in last month)
More than 1
year ago Never
How would you rate the quality of drinking water on your reserve?
Bad 46% 41% 22% 23
How safe or unsafe do you think your tap water supply is? Is it...
Very safe 11% 13% 34% 36
Very unsafe 30% 16% 7% 8
Would you consider your tap water to be more or less safe to drink than five years ago? Is it...
Less safe 34% 27% 21% 14
Why do you consider your current tap water to be safer to drink than 5 years ago?
Improved/updated filtration/treatment
procedures/infrastructure
18% 20% 44% 29
Do you use your tap water for any of the following...
Drinking 52% 66% 73% 73
Cooking 72% 87% 89% 89
Brushing teeth 74% 92% 92% 92
Washing food 74% 79% 93% 88
Food preparation where you are mixing with water 46% 66% 70% 71
Coffee or tea preparation 65% 78% 82% 82
None of the above 14% 3% 3% 3
Do you use your bottled water for any of the following...
Drinking 97% 95% 88% 94
Cooking 61% 40% 36% 40
Brushing teeth 42% 31% 32% 31
Washing food 50% 32% 25% 32
Food preparation where you are mixing with water 61% 50% 52% 51
Coffee or tea preparation 57% 49% 42% 41
Have you seen a door hanger addressing Drinking Water Advisories on your reserve?
Yes 27% 16% 10% n/a
30 • EKOS RESEARCH ASSOCIATES, 2009
› Reserve residents who have had a DWA within the last month are more likely to perceive the
quality of drinking water in their community as bad and the safety of their tap water supply as
very unsafe. As the recency of the last DWA declines, so too does their rating of the quality
and safety of water in their community being poor. Similarly, those who have experienced a
DWA in the last four weeks are more apt to consider their tap water to be less safe than five
years ago. Once again, this consideration declines with the increasing amount of time since
their last drinking water advisory.
› First Nations reserve residents who believe their current tap water is safer to drink than five
years ago due to improved and/or updated filtration, treatment procedures, and infrastructure
more often had their last drinking water advisory over one year ago.
› First Nations people on reserve who have had a DWA within the last four weeks are less likely
to use their tap water and more apt to use bottled water for any of the applications discussed
compared to those who last experienced a DWA more than one month ago.
› Reserve residents whose community recently (in the last four weeks) experienced a DWA are
more apt to have seen a door hanger addressing DWA’s on their reserve.
APPENDIX A FIRST NATIONS SURVEY INSTRUMENT
EKOS RESEARCH ASSOCIATES, 2009 • 1
INTRO Hello, my name is ... and I work for Ekos Research Associates. We are conducting a survey for the Government of Canada to obtain the views of Canadians living in smaller, rural communities on important health related issues. The survey will only take 8 minutes, and does not involve sales of any kind. Your participation is voluntary and will not affect any services you might receive from the Government of Canada, but it is appreciated as it helps the government to design and deliver better services for all Canadians. The survey is registered with the National Survey Registration System and all of your answers will remain completely confidential. Can I ask if you are at least 18 years old and a regular resident of this household?
Yes May I begin? ....................................................................................................... 1 No............................................................................................................................... 2
INTRO2 If... INTRO.EQ.2
Is there someone at home now that I could speak to who is 18 years of age or older and a regular resident of this household?
Yes Ask to speak to that person and repeat intro........................................................ 1 ->INTRO Person not available arrange callback......................................................................... 2 ->INTRO No, there's nobody else REFUSAL ............................................................................ 3 ->THNK2
PRIV [0,0] This call may be recorded for quality control or training purposes.
SEX Record gender of respondent
DO NOT ASK Male............................................................................................................................ 1 Female ........................................................................................................................ 2
LANGI Record language of correspondence
DO NOT ASK English........................................................................................................................ 1 French......................................................................................................................... 2
2 • EKOS RESEARCH ASSOCIATES, 2009
Q30 Do you consider yourself to be an Aboriginal person?
Yes.............................................................................................................................. 1 No -> THANK & TERMINATE; CODE AS IG ....................................................... 2 ->THNK2
Q31 If... Q30.EQ.1
Do you live on a reserve for at least 6 months of the year?
Yes.............................................................................................................................. 1 No -> THANK & TERMINATE; CODER COMME IG........................................... 2 ->THNK2
CONF1 Before I start the interview, I'd like to confirm the first three digits of your postal code to help us determine the province and size of community that you live in. What I have listed for your postal code is &&APOSTC.
Yes this is correct ....................................................................................................... 1 No this is not correct................................................................................................... 2
CONF2 If... CONF1.EQ.2
Can you provide me with the first 3 digits of your postal code.
first 3 digits of the postal code-> ACONF2; S3 L1 C3 .............................................. 1 DK/NR ....................................................................................................................... 9
SCR1 As far as you know, how many people live on your reserve?
Less than 500.............................................................................................................. 1 501 1000..................................................................................................................... 2 1001 5000................................................................................................................... 3 More than 5000 -> THANK & TERMINATE; CODER COMME IG...................... 4 ->THNK2
EKOS RESEARCH ASSOCIATES, 2009 • 3
Q1 On a scale from 1, very bad to 5, very good with 3 meaning neither good nor bad, how would you rate the quality of drinking water on your reserve?
1 Very bad .................................................................................................................. 1 2.................................................................................................................................. 2 3 Neither good nor bad............................................................................................... 3 4.................................................................................................................................. 4 5 Very good................................................................................................................ 5 (DO NOT READ) Don't know ................................................................................... 8 (DO NOT READ) Refuse .......................................................................................... 9
Q2 How safe or unsafe do you think your tap water supply is? Is it...
READ LIST Very safe .................................................................................................................... 1 Somewhat safe............................................................................................................ 2 Somewhat unsafe........................................................................................................ 3 Very unsafe................................................................................................................. 4 (DO NOT READ) Don't know ................................................................................... 8 B (DO NOT READ) Refuse .......................................................................................... 9 B
Q3 [1,14] If... Q2.EQ.3,4
Why do you consider your tap water supply to be unsafe?
DO NOT READ LIST; CHECK ALL THAT APPLY; PROMPT FOR MORE THAN ONE ANSWER IF THERE IS ONE Your reserve is currently under a drinking/boil water advisory ................................. 1 Your reserve has been under a drinking/boil water advisory in the past .................... 2 You have heard water on your reserve is unsafe ........................................................3 Appearance................................................................................................................. 4 Taste ........................................................................................................................... 5 Odour.......................................................................................................................... 6 There is always talk of bad water quality these days in small communities and reserves, so assume it's bad on my reserve as well (NOTE: to interviewer not related to respondent's community specifically)......................................................... 7 I don't have any confidence in the people responsible for the water supply on my reserve ........................................................................................................................ 8 Other (specify)-> AQ3; C350 L2 C75...................................................................... 77 B Don't know ............................................................................................................... 99 BX
4 • EKOS RESEARCH ASSOCIATES, 2009
Q4 [1,8] If... Q3.EQ.3
Where did you hear that the water supply on your reserve is unsafe?
DO NOT READ; PROMPT FOR AS MANY ANSWERS AS APPLY Television ................................................................................................................... 1 Radio .......................................................................................................................... 2 Local newspaper......................................................................................................... 3 Community/Band/Township council.......................................................................... 4 Government of Canada............................................................................................... 5 Health Canada (specifically) ...................................................................................... 6 Word of Mouth (family or friends)............................................................................. 7 Other (specify)-> AQ4; C350 L2 C75...................................................................... 77 B Do not recall ............................................................................................................. 98 BX
P5 P5=(($Q2==1||$Q2==2)?1:2) even ............................................................................................................................ 1 2.................................................................................................................................. 2
Q5 [1,14] What would make you feel &P5 safer about your tap water quality?
DO NOT READ More frequent water quality testing............................................................................ 1 Better procedures for water quality testing................................................................. 2 More information available on water quality ............................................................. 3 Better information available on water quality ............................................................ 4 Fewer/no boil water advisories................................................................................... 5 Knowing why water is under a Water/Boil Advisory when it's announced ............... 6 Fewer chemicals in the water ..................................................................................... 7 Better smell/appearance of the water.......................................................................... 8 Other (specify)-> AQ5; C350 L2 C75...................................................................... 77 B Nothing already feel water is safe, don't need anything else .................................... 98 BX
Q8 [1,4] Please indicate which of the following would make you feel safer about your tap water quality.
READ LIST AND SELECT ALL THAT APPLY INTERVIEWER NOTE: READ FULL LIST AS YES/NO. YOU MUST GET A YES/NO RESPONSE TO EACH CHOICE OPTION
EKOS RESEARCH ASSOCIATES, 2009 • 5
More information available about the quality of tap water on my reserve ................. 1 More information about water quality testing procedures, frequency of testing on my reserve, and about acceptable levels in tap water ................................................. 2 A telephone number or website that I can go to, to be able to check for myself on the current quality of tap water on my reserve ........................................................... 3 More information on what to do in case of a drinking water advisory....................... 4 VOLUNTEERED NONE OF THE ABOVE ............................................................. 9 BX
Q9 Would you consider your tap water to be more or less safe to drink than five years ago? Is it...
READ LIST Much less safe ............................................................................................................ 1 Somewhat less safe..................................................................................................... 2 No change................................................................................................................... 3 Somewhat safer .......................................................................................................... 4 Much safer.................................................................................................................. 5 (DO NOT READ) Don't know ................................................................................... 8 B (DO NOT READ) Refuse .......................................................................................... 9 B
Q10 [1,12] If... Q9.EQ.1,2
Why do you consider your tap water to be less safe to drink than 5 years ago?
DO NOT READ; TAKE AS MANY AS APPLY; PROMPT FOR MULTIPLE ANSWERS You get less information about drinking water quality on your reserve than you used to ........................................................................................................................ 1 Your trust in drinking water treatment has gone down .............................................. 2 You do not feel well enough informed on water testing procedures on your reserve ........................................................................................................................ 3 You have more information now about how water quality is tested/taken care of on your reserve ........................................................................................................... 4 There is more talk in the media these days about poor water quality ......................... 5 Someone told you that the tap water on the reserve is poor ....................................... 6 Other (specify)-> AQ10; C350 L2 C75.................................................................... 77 B Don't know ............................................................................................................... 99 BX
Q11 [1,8] If... Q10.EQ.6.OR.Q3.EQ.3
Where did you hear that the tap water is poor?
DO NOT READ; PROMPT FOR AS MANY ANSWERS AS APPLY
6 • EKOS RESEARCH ASSOCIATES, 2009
Television ................................................................................................................... 1 Radio .......................................................................................................................... 2 Local newspaper......................................................................................................... 3 Community/Band/Township council.......................................................................... 4 Government of Canada............................................................................................... 5 Health Canada (specifically) ...................................................................................... 6 Word of Mouth (family or friends)............................................................................. 7 Other (specify)-> AQ11; C350 L2 C75.................................................................... 77 B Do not recall ............................................................................................................. 98 BX
Q12 [1,10] If... Q9.EQ.4,5
Why do you consider your current tap water to be safer to drink than 5 years ago?
READ LIST; TAKE ALL THAT APPLY AND PROMPT FOR MORE MULTIPLE ANSWERS You receive more information about drinking water quality on your reserve than you used to.................................................................................................................. 1 There is more of a focus these days on the need for good water quality .................... 2 Your trust level in drinking water treatment has increased ........................................ 3 You feel better informed about water testing procedures on your reserve ................. 4 Someone told you that the tap water on the reserve is good....................................... 5 (DO NOT READ) Other (specify)-> AQ12; C350 L2 C75 ..................................... 77 B (DO NOT READ) None of the above ...................................................................... 98 BX (DO NOT READ) Don't know ................................................................................. 99 BX
Q131 [1,6] Do you use your tap water for any of the following...
READ LIST Drinking ..................................................................................................................... 1 Cooking ...................................................................................................................... 2 Brushing teeth............................................................................................................. 3 Washing food ............................................................................................................. 4 Food preparation where you are mixing with water, such as baby formula or jello... 5 Coffee or tea preparation............................................................................................ 6 (DO NOT READ) None of the above ........................................................................ 7 BX (DO NOT READ) Don't know ................................................................................... 8 BX (DO NOT READ) Refuse .......................................................................................... 9 BX
Q13P [0,0] If... Q131.EQ.1-6
Is that filtered or unfiltered tap water in each of these cases...
Food preparation where you are mixing with water, such as baby formula or jello Filtered ....................................................................................................................... 1 Unfiltered.................................................................................................................... 2 Don't know ................................................................................................................. 8 Refuse......................................................................................................................... 9
Do you use your bottled water for any of the following...
READ LIST Drinking ..................................................................................................................... 1 Cooking ...................................................................................................................... 2 Brushing teeth............................................................................................................. 3 Washing food ............................................................................................................. 4 Food preparation where you are mixing with water, such as baby formula or jello... 5 Coffee or tea preparation............................................................................................ 6 (DO NOT READ) None of the above ........................................................................ 7 BX (DO NOT READ) Don't know ................................................................................... 8 BX (DO NOT READ) Refuse .......................................................................................... 9 BX
Q15 [1,13] If... Q14.EQ.1-6
Why is it that you use bottled water instead of tap water?
DO NOT READ; SELECT ALL THAT APPLY; PROMPT FOR MULTIPLE ANSWERS
EKOS RESEARCH ASSOCIATES, 2009 • 9
Don't trust my tap water ............................................................................................. 1 My reserve is currently under a Drinking Water Advisory ........................................ 2 My reserve has been under Drinking Water Advisories in the past............................ 3 I prefer the taste/smell of bottled water ...................................................................... 4 I have a greater water supply with bottled water than tap water................................. 5 Bottled water is supposed to be better for you............................................................ 6 It looks better to be drinking bottled water it's a status symbol.................................. 7 It was recommended by Health Canada ..................................................................... 8 Because it is more convenient/easier.......................................................................... 9 Other (specify)-> AQ15; C350 L2 C75.................................................................... 77 B Don't know ............................................................................................................... 99 BX
Q16 What is the main source of your household tap water? Is it...
READ LIST Piped directly to the home.......................................................................................... 1 Individual well............................................................................................................ 2 Cistern (water in a holding tank) ................................................................................ 3 (DO NOT READ) Community Well..........................................................................4 B (DO NOT READ) Water Pump.................................................................................. 5 B (DO NOT READ) Something else (specify)-> AQ16; C350 L2 C75 ...................... 77 B (DO NOT READ) No running water.......................................................................... 9 B (DO NOT READ) Don't know ................................................................................... 7 B (DO NOT READ) Refuse .......................................................................................... 8 B
Q17 Do you receive enough household tap water for all your domestic needs?
Yes.............................................................................................................................. 1 No............................................................................................................................... 2 (DO NOT READ) Don't know ................................................................................... 8 (DO NOT READ) Refuse .......................................................................................... 9
Q18 Has your reserve ever been or are you currently under a Drinking or Boil Water Advisory, as far as you know?
When was the last Drinking or Boil Water Advisory issued on your reserve?
Currently under one................................................................................................ 990 enter number-> AQ19A; N2.0 [1-97]....................................................................... 90 N weeks.......................................................................................................................... 1 months ........................................................................................................................ 2 years ago..................................................................................................................... 3 Don't know ............................................................................................................. 998
Q19CL If... Q18.EQ.1
Q19CL = (($Q19A==990)?1:($Q19A==1&&$AQ19A<53)?1:($Q19A==2&&$AQ19A<13)?1:($Q19A==3&&$AQ19A<=1)?1:2) Have been under a drinking water advisory within the last 12 months ...................... 1 Else ............................................................................................................................. 2
Q32 If... Q19CL.EQ.1
Have you heard a public service announcement on the radio regarding Drinking Water Advisories on your reserve?
How many times in the last five years has your reserve been under a Drinking Water Advisory?
enter number of times-> AQ20; N3.0 [0-900]............................................................1 Have not lived here for 5 years............................................................................... 998 Do not recall ........................................................................................................... 999
Q21 As far as you know, how far is your reserve from the closest major city (in kilometres)?
CHK1 CHK1=(($AQ25>$AQ24)?1:2) # CHILDREN GREATER THAN # PEOPLE IN HOUSEHOLD............................. 1 2.................................................................................................................................. 2
SKP1 If... CHK1.EQ.1
The number of children can not be greater than number of people in the household. Please correct your answer. ..................................................................... 1 ->Q24
14 • EKOS RESEARCH ASSOCIATES, 2009
SKP27 If... AQ25.EQ.0.OR.Q25.EQ.99
If no kids, skip to Q27[FR] S’il n’y a pas d’enfants, passer à Q27
The number of children = &&AQ25 &SKP2 children-> AQ26A; N2.0 [0-20]................................................................................. 1 DK/NR ..................................................................................................................... 99
CHK2=((($AQ26A+$AQ26B+$AQ26C+$AQ26D)==$AQ25)?1:2) 1.................................................................................................................................. 1 # OF CHILDREN MUST EQUAL # IN Q25 ............................................................ 2
EKOS RESEARCH ASSOCIATES, 2009 • 15
SKP2 If... CHK2.EQ.2
# OF CHILDREN MUST EQUAL # IN Q25. Please correct your answer. ............. 1 ->Q26A
Q27 Is your house used as a daycare for children who do not live in your household?
CHK3 CHK3=(($AQ28>$AQ24)?1:2) # OVER 64 GREATER THAN # IN HOUSEHOLD ................................................ 1 2.................................................................................................................................. 2
SKP3 If... CHK3.EQ.1
The number of seniors can not be greater than number of people in the household. Please correct your answer. ..................................................................... 1 ->Q28
Q29 Excluding any young children or seniors over the age of 64, is there anyone living in your household who is vulnerable to illness?
QTHNK That is all the questions that I have. Thank you for your time.
Completion ................................................................................................................. 1 D
APPENDIX B GENERAL POPULATION, SMALL
COMMUNITIES SURVEY INSTRUMENT
EKOS RESEARCH ASSOCIATES, 2009 • 1
INTRO Hello, my name is ... and I work for Ekos Research Associates. We are conducting a survey for the Government of Canada to obtain the views of Canadians living in smaller, rural communities on important health related issues. The survey will only take 8 minutes, and does not involve sales of any kind. Your participation is voluntary and will not affect any services you might receive from the Government of Canada, but it is appreciated as it helps the government to design and deliver better services for all Canadians. The survey is registered with the National Survey Registration System and all of your answers will remain completely confidential. Can I ask if you are at least 18 years old and a regular resident of this household?
Yes May I begin? ....................................................................................................... 1 No............................................................................................................................... 2
INTRO2 If... INTRO.EQ.2
Is there someone at home now that I could speak to who is 18 years of age or older and a regular resident of this household?
Yes Ask to speak to that person and repeat intro........................................................ 1 ->INTRO Person not available arrange callback......................................................................... 2 ->INTRO No, there's nobody else REFUSAL ............................................................................ 3 ->THNK2
PRIV [0,0] This call may be recorded for quality control or training purposes.
SEX Record gender of respondent
DO NOT ASK Male............................................................................................................................ 1 Female ........................................................................................................................ 2
LANGI Record language of correspondence
DO NOT ASK English........................................................................................................................ 1 French......................................................................................................................... 2
2 • EKOS RESEARCH ASSOCIATES, 2009
CONF1 Before I start the interview, I'd like to confirm the first three digits of your postal code to help us determine the province and size of community that you live in. What I have listed for your postal code is &&APOSTC.
Yes this is correct ....................................................................................................... 1 No this is not correct................................................................................................... 2
CONF2 If... CONF1.EQ.2
Can you provide me with the first 3 digits of your postal code.
first 3 digits of the postal code-> ACONF2; S3 L1 C3 .............................................. 1 DK/NR ....................................................................................................................... 9
SCR1 As far as you know, how many people live in your community?
Less than 500.............................................................................................................. 1 501 1000..................................................................................................................... 2 1001 5000................................................................................................................... 3 More than 5000 -> THANK & TERMINATE; CODE AS IG................................... 4 ->THNK2
Q1 On a scale from 1, very bad to 5, very good with 3 meaning neither good nor bad, how would you rate the quality of drinking water in your community?
1 Very bad .................................................................................................................. 1 2.................................................................................................................................. 2 3 Neither good nor bad............................................................................................... 3 4.................................................................................................................................. 4 5 Very good................................................................................................................ 5 (DO NOT READ) Don't know ................................................................................... 8 (DO NOT READ) Refuse .......................................................................................... 9
EKOS RESEARCH ASSOCIATES, 2009 • 3
Q2 How safe or unsafe do you think your tap water supply is? Is it...
READ LIST Very safe .................................................................................................................... 1 Somewhat safe............................................................................................................ 2 Somewhat unsafe........................................................................................................ 3 Very unsafe................................................................................................................. 4 (DO NOT READ) Don't know ................................................................................... 8 B (DO NOT READ) Refuse .......................................................................................... 9 B
Q3 [1,9] If... Q2.EQ.3,4
Why do you consider your tap water supply to be unsafe?
DO NOT READ LIST; CHECK ALL THAT APPLY; PROMPT FOR MORE THAN ONE ANSWER IF THERE IS ONE Your community is currently under a drinking/boil water advisory........................... 1 Your community has been under a drinking/boil water advisory in the past.............. 2 You have heard water in your community is unsafe .................................................. 3 Appearance................................................................................................................. 4 Taste ........................................................................................................................... 5 Odour.......................................................................................................................... 6 There is always talk of bad water quality these days in small communities, so assume it's bad in my community as well (NOTE: to interviewer not related to respondent's community specifically) ........................................................................ 7 I don't have any confidence in the people responsible for the water supply in my community.................................................................................................................. 8 Other (specify)-> AQ3; C350 L2 C75...................................................................... 77 B Don't know ............................................................................................................... 99 BX
Q4 [1,8] If... Q3.EQ.3
Where did you hear that the water supply in your community is unsafe?
DO NOT READ; PROMPT FOR AS MANY ANSWERS AS APPLY Television ................................................................................................................... 1 Radio .......................................................................................................................... 2 Local newspaper......................................................................................................... 3 Community/Band/Township council.......................................................................... 4 Government of Canada............................................................................................... 5 Health Canada (specifically) ...................................................................................... 6 Word of Mouth (family or friends)............................................................................. 7 Other (specify)-> AQ4; C350 L2 C75...................................................................... 77 B Do not recall ............................................................................................................. 98 BX
4 • EKOS RESEARCH ASSOCIATES, 2009
P5 P5=(($Q2==1||$Q2==2)?1:2) even ............................................................................................................................ 1 2.................................................................................................................................. 2
Q5 [1,9] What would make you feel &P5 safer about your tap water quality?
DO NOT READ More frequent water quality testing............................................................................ 1 Better procedures for water quality testing................................................................. 2 More information available on water quality ............................................................. 3 Better information available on water quality ............................................................ 4 Fewer/no boil water advisories................................................................................... 5 Knowing why water is under a Water/Boil Advisory when it's announced ............... 6 Fewer chemicals in the water ..................................................................................... 7 Better smell/appearance of the water.......................................................................... 8 Other (specify)-> AQ5; C350 L2 C75...................................................................... 77 B Nothing already feel water is safe, don't need anything else .................................... 98 BX
Q8 [1,4] Please indicate which of the following would make you feel safer about your tap water quality.
READ LIST AND SELECT ALL THAT APPLY INTERVIEWER NOTE: READ FULL LIST AS YES/NO. YOU MUST GET A YES/NO RESPONSE TO EACH CHOICE OPTION More information available about the quality of tap water in my community ........... 1 More information about water quality testing procedures, frequency of testing in my community, and about acceptable levels in tap water .......................................... 2 A telephone number or website that I can go to, to be able to check for myself on the current quality of tap water in my community......................................................3 More information on what to do in case of a drinking water advisory....................... 4 VOLUNTEERED NONE OF THE ABOVE ............................................................. 9 BX
EKOS RESEARCH ASSOCIATES, 2009 • 5
Q9 Would you consider your tap water to be more or less safe to drink than five years ago? Is it...
READ LIST Much less safe ............................................................................................................ 1 Somewhat less safe..................................................................................................... 2 No change................................................................................................................... 3 Somewhat safer .......................................................................................................... 4 Much safer.................................................................................................................. 5 (DO NOT READ) Don't know ................................................................................... 8 B (DO NOT READ) Refuse .......................................................................................... 9 B
Q10 [1,7] If... Q9.EQ.1,2
Why do you consider your tap water to be less safe to drink than 5 years ago?
DO NOT READ; TAKE AS MANY AS APPLY; PROMPT FOR MULTIPLE ANSWERS You get less information about drinking water quality in your community than you used to.................................................................................................................. 1 Your trust in drinking water treatment has gone down .............................................. 2 You do not feel well enough informed on water testing procedures in your community.................................................................................................................. 3 You have more information now about how water quality is tested/taken care of in your community ..................................................................................................... 4 There is more talk in the media these days about poor water quality ......................... 5 Someone told you that the tap water in the community is poor.................................. 6 Other (specify)-> AQ10; C350 L2 C75.................................................................... 77 B Don't know ............................................................................................................... 99 BX
Q11 [1,8] If... Q10.EQ.6.OR.Q3.EQ.3
Where did you hear that the tap water is poor?
DO NOT READ; PROMPT FOR AS MANY ANSWERS AS APPLY Television ................................................................................................................... 1 Radio .......................................................................................................................... 2 Local newspaper......................................................................................................... 3 Community/Band/Township council.......................................................................... 4 Government of Canada............................................................................................... 5 Health Canada (specifically) ...................................................................................... 6 Word of Mouth (family or friends)............................................................................. 7 Other (specify)-> AQ11; C350 L2 C75.................................................................... 77 B Do not recall ............................................................................................................. 98 BX
6 • EKOS RESEARCH ASSOCIATES, 2009
Q12 [1,6] If... Q9.EQ.4,5
Why do you consider your current tap water to be safer to drink than 5 years ago?
READ LIST; TAKE ALL THAT APPLY AND PROMPT FOR MORE MULTIPLE ANSWERS You receive more information about drinking water quality in your community than you used to.......................................................................................................... 1 There is more of a focus these days on the need for good water quality .................... 2 Your trust level in drinking water treatment has increased ........................................ 3 You feel better informed about water testing procedures in your community ........... 4 Someone told you that the tap water in the community is good................................. 5 (DO NOT READ) Other (specify)-> AQ12; C350 L2 C75 ..................................... 77 B (DO NOT READ) None of the above ...................................................................... 98 BX (DO NOT READ) Don't know ................................................................................. 99 BX
Q131 [1,6] Do you use your tap water for any of the following...
READ LIST Drinking ..................................................................................................................... 1 Cooking ...................................................................................................................... 2 Brushing teeth............................................................................................................. 3 Washing food ............................................................................................................. 4 Food preparation where you are mixing with water, such as baby formula or jello... 5 Coffee or tea preparation............................................................................................ 6 (DO NOT READ) None of the above ........................................................................ 7 BX (DO NOT READ) Don't know ................................................................................... 8 BX (DO NOT READ) Refuse .......................................................................................... 9 BX
Q13P [0,0] If... Q131.EQ.1-6
Is that filtered or unfiltered tap water in each of these cases...
Food preparation where you are mixing with water, such as baby formula or jello Filtered ....................................................................................................................... 1 Unfiltered.................................................................................................................... 2 Don't know ................................................................................................................. 8 Refuse......................................................................................................................... 9
Do you use your bottled water for any of the following...
READ LIST Drinking ..................................................................................................................... 1 Cooking ...................................................................................................................... 2 Brushing teeth............................................................................................................. 3 Washing food ............................................................................................................. 4 Food preparation where you are mixing with water, such as baby formula or jello... 5 Coffee or tea preparation............................................................................................ 6 (DO NOT READ) None of the above ........................................................................ 7 BX (DO NOT READ) Don't know ................................................................................... 8 BX (DO NOT READ) Refuse .......................................................................................... 9 BX
Q15 [1,10] If... Q14.EQ.1-6
Why is it that you use bottled water instead of tap water?
DO NOT READ; SELECT ALL THAT APPLY; PROMPT FOR MULTIPLE ANSWERS Don't trust my tap water ............................................................................................. 1 My community is currently under a Drinking Water Advisory.................................. 2 My community has been under Drinking Water Advisories in the past ..................... 3 I prefer the taste/smell of bottled water ...................................................................... 4 I have a greater water supply with bottled water than tap water................................. 5 Bottled water is supposed to be better for you............................................................ 6 It looks better to be drinking bottled water it's a status symbol.................................. 7 It was recommended by Health Canada ..................................................................... 8 Because it is more convenient/easier.......................................................................... 9 Other (specify)-> AQ15; C350 L2 C75.................................................................... 77 B Don't know ............................................................................................................... 99 BX
EKOS RESEARCH ASSOCIATES, 2009 • 9
Q16 What is the main source of your household tap water? Is it...
READ LIST Piped directly to the home.......................................................................................... 1 Individual well............................................................................................................ 2 Cistern (water in a holding tank) ................................................................................ 3 (DO NOT READ) Community Well..........................................................................4 B (DO NOT READ) Water Pump.................................................................................. 5 B (DO NOT READ) Something else (specify)-> AQ16; C350 L2 C75 ...................... 77 B (DO NOT READ) No running water.......................................................................... 9 B (DO NOT READ) Don't know ................................................................................... 7 B (DO NOT READ) Refuse .......................................................................................... 8 B
Q17 Do you receive enough household tap water for all your domestic needs?
Yes.............................................................................................................................. 1 No............................................................................................................................... 2 (DO NOT READ) Don't know ................................................................................... 8 (DO NOT READ) Refuse .......................................................................................... 9
Q18 Has your community ever been or are you currently under a Drinking or Boil Water Advisory, as far as you know?
When was the last Drinking or Boil Water Advisory issued in your community?
enter number-> AQ19A; N2.0 [1-97]....................................................................... 90 N weeks.......................................................................................................................... 1 months ........................................................................................................................ 2 years ago..................................................................................................................... 3 Don't know ............................................................................................................. 998 Refuse..................................................................................................................... 999
10 • EKOS RESEARCH ASSOCIATES, 2009
Q20 If... Q18.EQ.1
How many times in the last five years has your community been under a Drinking Water Advisory?
enter number of times-> AQ20; N3.0 [1-900]............................................................1 Have not lived here for 5 years............................................................................... 998 Do not recall ........................................................................................................... 999
Q21 As far as you know, how far is your community from the closest major city (in kilometres)?
CHK1 CHK1=(($AQ25>$AQ24)?1:2) # CHILDREN GREATER THAN # PEOPLE IN HOUSEHOLD............................. 1 2.................................................................................................................................. 2
SKP1 If... CHK1.EQ.1
The number of children can not be greater than number of people in the household. Please correct your answer. ..................................................................... 1 ->Q24
CHK2 CHK2=((($AQ26A+$AQ26B+$AQ26C+$AQ26D)==$AQ25)?1:2) 1.................................................................................................................................. 1 # OF CHILDREN MUST EQUAL # IN Q25 ............................................................ 2
SKP2 If... CHK2.EQ.2
# OF CHILDREN MUST EQUAL # IN Q25. Please correct your answer. ............. 1 ->Q26A
Q27 Is your house used as a daycare for children who do not live in your household?
CHK3 CHK3=(($AQ28>$AQ24)?1:2) # OVER 64 GREATER THAN # IN HOUSEHOLD ................................................ 1 2.................................................................................................................................. 2
SKP3 If... CHK3.EQ.1
The number of seniors can not be greater than number of people in the household. Please correct your answer. ..................................................................... 1 ->Q28
Q29 Excluding any young children or seniors over the age of 64, is there anyone living in your household who is vulnerable to illness?