Optimizing irrigation efficiency improvements in the Aral Sea Basin Maksud Bekchanov a,c,n , Claudia Ringler b , Anik Bhaduri c , Marc Jeuland d,e a International Water Management Institute (IWMI), Sunil Mawatha 127, Pelawatta, Sri Lanka b International Food and Policy Research Institute (IFPRI), Washington DC, USA c Center for Development Research (ZEF), Bonn University, Bonn, Germany d Duke University, Durham NC, USA e Institute of Water Policy, National University of Singapore, Singapore article info Article history: Received 16 December 2014 Received in revised form 19 August 2015 Accepted 20 August 2015 Keywords: Amu and Syr Darya Basin Hydro-economic model Irrigation intensification Conveyance and water application effi- ciency Water allocation Irrigation investment abstract Water scarcity driven by climate change, growing demand, and inefficient management of water and related infrastructure is a serious threat to livelihoods in the Aral Sea Basin (ASB) of Central Asia. In recent decades, downstream water shortages have become increasingly common and inflows into the Aral Sea have become very limited. Meanwhile, water losses are enormous both at conveyance and field levels because of outdated infrastructure and the dominance of highly inefficient basin and furrow ir- rigation methods. Intensification and modernization of irrigation systems, while requiring investment of scarce capital resources, could thus substantially reduce non-beneficial water consumption and help in coping with increasing water scarcity. This study applies a hydro-economic model that solves for the investment in improved irrigation efficiency across the various irrigation sites in the ASB that delivers the highest economic gains. Improvement of the efficiency of irrigation canals and implementation of field efficiency investments and practices, such as drip irrigation, and alternate dry or short furrow irrigation (for rice), would substantially improve economic outcomes. Conveyance efficiency investments are particularly worthwhile in downstream regions where sandy soils are common and return flows largely feed saline lakes in tail-end depressions. Meanwhile, field-level efficiency should be fully upgraded in all rice-producing regions through the use of drip and alternate wet and dry irrigation, as well as with drip irrigation in the cotton-producing Ferghana Valley of the Syr Darya Basin. The value of these improve- ments increases with reduced water availability. Implementation of an optimal set of investments could increase basinwide benefits by 20% (from US$ 3.2 to 3.8 billion) under normal water availability and by 40% (from US$ 2.5 to 3.5 billion) under dry conditions (80% of normal supply). & 2015 Elsevier B.V. All rights reserved. 1. Introduction Water scarcity is a major challenge facing populations in semi- arid and arid regions across the world [1]. In such water scarce regions, increasing the efficiency of water use is critical to eco- nomic development and food security [2]. Among water users, irrigated agriculture consumes more than 70% of all global water withdrawals [3]. Yet this activity is also typically extraordinarily inefficient: on average, only 40% of water delivered to the sector is used productively by crops [4]. Therefore, irrigated agriculture would seem to be a prime candidate for interventions aimed at reducing water demand and inducing water savings. Measures to improve irrigation water use efficiency appear particularly essential in regions like the Aral Sea Basin (ASB) of Central Asia, which suffers from acute water scarcity. The basin's largely arid climate makes the use of irrigation for agricultural production a necessity, and 90% of total water consumption in the ASB is used for this purpose. The basin – covering the five Central Asian countries of Kazakhstan, Kyrgyzstan, Uzbekistan, Tajikistan, and Turkmenistan – also comprises one of the largest irrigated areas in the world, with more than 8.5 Mha of irrigated land (Fig. 1). Furthermore, the population of the region remains largely rural, and rural livelihoods depend heavily on farming and therefore also on water availability [5]. In the ASB, large-scale water diversions for irrigation began in the 1960s under the Soviet regime. The diversions were largely intended for the massive expansion of cotton cultivation and transformed the agricultural landscape of the region. At the same time, however, they also led to a dramatic reduction of inflows to and the consequent desiccation of the Aral Sea. The large-scale ecological changes that occurred in turn had catastrophic effects in downstream areas, increasing the risks of air- and water-borne illnesses, accelerating the degradation of ecosystems and Contents lists available at ScienceDirect journal homepage: www.elsevier.com/locate/wre Water Resources and Economics http://dx.doi.org/10.1016/j.wre.2015.08.003 2212-4284/& 2015 Elsevier B.V. All rights reserved. n Corresponding author at: International Water Management Institute (IWMI), Sunil Mawatha 127, Pelawatta, Sri Lanka. E-mail address: [email protected](M. Bekchanov). Please cite this article as: M. Bekchanov, et al., Optimizing irrigation efficiency improvements in the Aral Sea Basin, Water Resources and Economics (2015), http://dx.doi.org/10.1016/j.wre.2015.08.003i Water Resources and Economics ∎ (∎∎∎∎) ∎∎∎–∎∎∎
Transcript
Water Resources and Economics ∎ (∎∎∎∎) ∎∎∎–∎∎∎
Contents lists available at ScienceDirect
Water Resources and Economics
http://d2212-42
n CorrSunil M
E-m
Pleasand
journal homepage: www.elsevier.com/locate/wre
Optimizing irrigation efficiency improvements in the Aral Sea Basin
a International Water Management Institute (IWMI), Sunil Mawatha 127, Pelawatta, Sri Lankab International Food and Policy Research Institute (IFPRI), Washington DC, USAc Center for Development Research (ZEF), Bonn University, Bonn, Germanyd Duke University, Durham NC, USAe Institute of Water Policy, National University of Singapore, Singapore
a r t i c l e i n f o
Article history:Received 16 December 2014Received in revised form19 August 2015Accepted 20 August 2015
Keywords:Amu and Syr Darya BasinHydro-economic modelIrrigation intensificationConveyance and water application effi-ciencyWater allocationIrrigation investment
x.doi.org/10.1016/j.wre.2015.08.00384/& 2015 Elsevier B.V. All rights reserved.
esponding author at: International Water Mawatha 127, Pelawatta, Sri Lanka.ail address: [email protected] (M. Bekch
e cite this article as: M. Bekchanov,Economics (2015), http://dx.doi.org/1
a b s t r a c t
Water scarcity driven by climate change, growing demand, and inefficient management of water andrelated infrastructure is a serious threat to livelihoods in the Aral Sea Basin (ASB) of Central Asia. Inrecent decades, downstream water shortages have become increasingly common and inflows into theAral Sea have become very limited. Meanwhile, water losses are enormous both at conveyance and fieldlevels because of outdated infrastructure and the dominance of highly inefficient basin and furrow ir-rigation methods. Intensification and modernization of irrigation systems, while requiring investment ofscarce capital resources, could thus substantially reduce non-beneficial water consumption and help incoping with increasing water scarcity. This study applies a hydro-economic model that solves for theinvestment in improved irrigation efficiency across the various irrigation sites in the ASB that delivers thehighest economic gains. Improvement of the efficiency of irrigation canals and implementation of fieldefficiency investments and practices, such as drip irrigation, and alternate dry or short furrow irrigation(for rice), would substantially improve economic outcomes. Conveyance efficiency investments areparticularly worthwhile in downstream regions where sandy soils are common and return flows largelyfeed saline lakes in tail-end depressions. Meanwhile, field-level efficiency should be fully upgraded in allrice-producing regions through the use of drip and alternate wet and dry irrigation, as well as with dripirrigation in the cotton-producing Ferghana Valley of the Syr Darya Basin. The value of these improve-ments increases with reduced water availability. Implementation of an optimal set of investments couldincrease basinwide benefits by 20% (from US$ 3.2 to 3.8 billion) under normal water availability and by40% (from US$ 2.5 to 3.5 billion) under dry conditions (80% of normal supply).
& 2015 Elsevier B.V. All rights reserved.
1. Introduction
Water scarcity is a major challenge facing populations in semi-arid and arid regions across the world [1]. In such water scarceregions, increasing the efficiency of water use is critical to eco-nomic development and food security [2]. Among water users,irrigated agriculture consumes more than 70% of all global waterwithdrawals [3]. Yet this activity is also typically extraordinarilyinefficient: on average, only 40% of water delivered to the sector isused productively by crops [4]. Therefore, irrigated agriculturewould seem to be a prime candidate for interventions aimed atreducing water demand and inducing water savings.
Measures to improve irrigation water use efficiency appearparticularly essential in regions like the Aral Sea Basin (ASB) of
anagement Institute (IWMI),
anov).
et al., Optimizing irrigation0.1016/j.wre.2015.08.003i
Central Asia, which suffers from acute water scarcity. The basin'slargely arid climate makes the use of irrigation for agriculturalproduction a necessity, and 90% of total water consumption in theASB is used for this purpose. The basin – covering the five CentralAsian countries of Kazakhstan, Kyrgyzstan, Uzbekistan, Tajikistan,and Turkmenistan – also comprises one of the largest irrigatedareas in the world, with more than 8.5 Mha of irrigated land(Fig. 1). Furthermore, the population of the region remains largelyrural, and rural livelihoods depend heavily on farming andtherefore also on water availability [5].
In the ASB, large-scale water diversions for irrigation began inthe 1960s under the Soviet regime. The diversions were largelyintended for the massive expansion of cotton cultivation andtransformed the agricultural landscape of the region. At the sametime, however, they also led to a dramatic reduction of inflows toand the consequent desiccation of the Aral Sea. The large-scaleecological changes that occurred in turn had catastrophic effects indownstream areas, increasing the risks of air- and water-borneillnesses, accelerating the degradation of ecosystems and
efficiency improvements in the Aral Sea Basin, Water Resources
Fig. 1. Irrigated areas of the Aral Sea Basin. Source: FAO. AQUASTAT website, 2015. ⟨http://www.fao.org/nr/water/aquastat/basins/aral-sea/index.stm⟩ (accessed on 15.06.15).
M. Bekchanov et al. / Water Resources and Economics ∎ (∎∎∎∎) ∎∎∎–∎∎∎2
agricultural lands, contributing to the collapse of fisheries andrecreation, and to widespread unemployment [6]. Mitigating oreven reversing the consequences of this ecological disaster wouldrequire the development of new transboundary policies thatwould increase downstream environmental flows.
Other changes in the geo-political landscape of the region makethe rehabilitation of this ecosystem particularly difficult. Theseinclude the emergence of divergent interests among the fivecountries in the territory of the Aral Sea Basin that formed afterthe dissolution of the Soviet Union, climate change with outwardsigns of rising temperatures and aridity [7], growing populations,and upstream reservoir construction [8]. These dynamics continueto decrease and change the temporal pattern of downstreamwateravailability, by increasing water demand throughout the basin, andby reducing water supply during critical periods, in the absence ofa common and accepted agreement by the basin countries on howto manage resources sustainably for the future.
These dynamics notwithstanding, there are reasons to believethat significant improvements in irrigation could be achieved inthe basin. For one, irrigation technology in the region is dominatedby inefficient methods (e.g. basin and furrow techniques), whichhave water application efficiencies of less than 50% [9, 10]. Second,irrigation canal infrastructures are outdated and poorly main-tained and have conveyance efficiencies of less than 60% in manylocations [6, 10].1 While some return flows might be reuseddownstream, much of the ASB return flows from irrigation are
1 Water application efficiency is considered as the ratio of beneficial cropevapotranspiration to total water delivered to the field. Conveyance efficiency iscalculated as the ratio of irrigation water withdrawal from a river or other watersupply node to water actually delivered to the farm gate. Overall irrigation effi-ciency is thus the product of water application and conveyance efficiency.
Please cite this article as: M. Bekchanov, et al., Optimizing irrigationand Economics (2015), http://dx.doi.org/10.1016/j.wre.2015.08.003i
either too saline and/or are diverted in drainage systems to saltlakes that cannot replenish the Sea [6, 10]. Third, many of thecrops that are ubiquitous throughout the region are low in waterproductivity, such as cotton, wheat, and rice, even as watershortages increase in both magnitude and frequency [5, 9].
In light of these realities and challenges, improving the effi-ciency of water and land resources could help make more wateravailable for downstream irrigation, ecosystems, and other uses inthe ASB. The goal of this study is to identify the economicallyoptimal allocation of technological investments in water applica-tion and conveyance efficiency across the irrigation sites, from abasin-wide perspective. To assess the potential water savings andeconomic benefits of these technologies, we apply an integratedhydro-economic model with a monthly time step to optimize thesum of irrigation, hydropower and ecosystem benefits, subject toconstraints reflecting river flows and the complex structure of thehydrologic and agronomic systems of the ASB. The model de-termines the optimal spatial allocation of water, irrigated lands,and irrigation efficiency improvements within a basin-wide co-operation framework. A similar model architecture has previouslybeen applied for analyses of water management options in theMekong, Dong Nai and Maipo River Basins [11–13].
Previous modeling studies that considered changes in irrigationtechnology have mainly used three types of approaches: (a) adiscrete approach that explicitly considers specific technologies –
for example, drip and conventional irrigation – that have distinctwater requirements and crop yields [14–16]; (b) a productionfunction approach that implicitly considers irrigation technologythrough changes in water distribution uniformity [11, 17]; (c) awater savings-cost effectiveness approach that includes the costper unit of saved water through irrigation efficiency improve-ments and implicitly considers irrigation technology through
efficiency improvements in the Aral Sea Basin, Water Resources
M. Bekchanov et al. / Water Resources and Economics ∎ (∎∎∎∎) ∎∎∎–∎∎∎ 3
assumptions about the share of water intake delivered to the farmgate (conveyance efficiency) or the share of applied water that isbeneficially used by crops (for water application efficiency)2 [18].The model used in this paper follows the third approach.
Several studies have previously considered the technical andeconomic aspects of water use efficiency improvements in theASB. Some of these studies provide estimates of the technicalwater saving potential of different conservation technologies in-cluding drip irrigation, surge flow, and laser guided land levelingat the field level [19–21], at a national scale (e.g., for drip irrigationin Uzbekistan [22]), and at the basin scale (e.g., for drip irrigation,alternative furrow, and surge flow irrigation techniques in cottonproduction) [23]. Bekchanov et al. [10] further estimated the costs,benefits, and investment requirements of a range of water con-servation measures including drip irrigation, laser guided landleveling, alternate dry furrow, and surge flow. Researchers of theZEF/UNESCO Uzbekistan Project3 [15, 24] analyzed the economicand production effects of adopting drip irrigation, laser guidedland leveling, and other options of improving water use efficiencyusing farm-level and regional agricultural production models andcurves relating the average costs of water use efficiency im-provement options with their water saving potential [25]. A hydro-economic analysis by Cai et al. [18] is the only prior study from theregion that analyzed the economic and water use effects of watersaving technologies in the Syr Darya Basin using a basin-widewater management model.
The current study includes several modeling improvementsover the previous work, such as increased disaggregation of usersand crops, consideration of more recent data, and analysis of boththe Amu and Syr Darya sub-basins. Including the two sub-basinsof the ASB is especially helpful for better understanding the neteffects of interventions to improve irrigation efficiency on flowsinto the Aral Sea. Additionally, an integrated hydro-economicmodel that has a theoretically consistent water balance modelfrom river to field has been used for assessing the value of irri-gation efficiency improvements for water, food and environmentalsecurity. Moreover, we analyze a relevant policy case that amongother things indicates the spatial distribution of benefits of effi-ciency improvements, their sensitivity to costs, and the tradeoffsin allocating water savings to environmental flows versus addi-tional irrigation intensification and expansion.
The next section describes the hydro-economic model thatcomprises irrigation, hydropower production, and environmentalbenefit functions, hydrological and water flow relationships alongthe river and to the fields in the ASB, and the linkages betweensurface water, groundwater and return flows. It also discusses thedata used in the model, calibration procedures and scenario as-sessments considered in this study. In Section 3, we compare themodeling outcomes across scenarios and consider the economicvalue of irrigation technology improvements. The final sectionsummarizes findings of the modeling simulations and offers ad-ditional concluding remarks.
2 Note that the choice of irrigation technology is implicitly reflected in theextent of savings – for instance, a field application efficiency of 90–95% wouldrequire implementation of drip irrigation for crops, or of transplanting for rice.Lower water application efficiency of 60–70% for cotton can be interpreted asutilization of low cost techniques such as alternate dry furrow or short furrows [10].
3 ⟨http://www.zef.de/proposal_khorezm.0.html⟩
Please cite this article as: M. Bekchanov, et al., Optimizing irrigationand Economics (2015), http://dx.doi.org/10.1016/j.wre.2015.08.003i
2. Basin-wide water management model
2.1. Modeling framework
2.1.1. Objective functionThe objective function of the hydro-economic model max-
imizes the sum of irrigation benefits (IBr) across the irrigation sites( r), energy production benefits ( HPs) by hydropower productionplants ( s), and environmental benefit (EB):4
IB HP EB,1r
rs
s∑ ∑π ω= + + ⋅( )
where π corresponds to the total benefits from these threerespective components (in US$ million); and ω is a weight as-signed to the environmental benefit. Given the lack of monetizedestimates of the value of flows into the Aral Sea, this weight isincluded to allow testing of the sensitivity of the model to thesevalues. In considering the optimal water allocation for the basin,the model treats production at all sites included in each of theirrigation and hydropower sets equally; in other words there is noprioritization of upstream vs. downstream sites, and there are nospecific country demands that must be satisfied. This does notapply to municipal and industrial water demands, however, whichare imposed as constraints that must be satisfied prior and in-dependently of the hydropower and irrigation objectives.
2.1.2. Environmental flow benefitsDue to lack of data indicating temporal variation in the value of
inflows into the Aral Sea and deltaic zones ( EB), environmentalflow benefits are considered to be a linear function of the annualenvironmental flow (the sum of monthly flows [EFt]):
EB b b EF0 12t
t∑= +( )
where b0 and b1 are parameters of the environmental benefitfunction and EFt is the monthly environmental flow from the AmuDarya (the node link “A5 → THE ARAL SEA”) and Syr Darya (thenode link “S4 → THE ARAL SEA”) into the Aral Sea.5 A piecewiselinear relationship between annual environmental flows andbenefits was approximately estimated based on values for a subsetof environmental benefits as they relate to observed levels of flowsinto the Aral Sea [26]. Specifically, these include rough estimates ofbenefits from sustainable wetlands, fishery, sea navigation, resortactivities, and improved rural livelihoods [27]. Because of datalimitations many other important environmental benefits relatedto microclimate regulation, stable groundwater levels, and culturaland intrinsic values are not considered.
2.1.3. Hydropower production benefitsBenefits from hydroelectricity production are estimated as:
HP epr EP3
st
t s t,∑=( )
where eprt is price per unit of hydroelectricity output and EPs t, isthe amount of hydropower produced by power station ( s) in aparticular month (t).
2.1.3.1. Hydropower generation. Hydropower production from
4 Endogenous decision variables and groups of sets are written with upper caseletters while model parameters (exogenous variables) and sets (identifiers) arepresented with lower case letters.
5 For more details on estimating the coefficients of environmental benefitfunction, see Bekchanov [23], section 4.4.6. We note here that there are limited dataon the value of environmental flows in this system, particularly in the context ofunderstanding the long-term sustainability of benefits from the Aral Sea ecosystem.
efficiency improvements in the Aral Sea Basin, Water Resources
Fig. 2. Water balance relationships on irrigation site.
M. Bekchanov et al. / Water Resources and Economics ∎ (∎∎∎∎) ∎∎∎–∎∎∎4
reservoir-based power production plants depends on the conver-sion coefficient (ρ), production efficiency of the plant ( sε ), reservoirwater releases (RSNv n t, , ), and the water level in the reservoir [12]:
⎛⎝⎜⎜
⎞⎠⎟⎟
⎛⎝⎜⎜
⎞⎠⎟⎟
EP RSN RRSH H
htail
2
4
s t sn RNLINK
v n tw DDLINK
v w tv t v t
v
, , , , ,, , 1∑ ∑ρ ε= ⋅ ⋅ +
−
−( )
∈ ∈
−
where RSNv n t, , is river flow from reservoir (v) to node (n) if a linkbetween two of them ( RNLINK ) exists, RRSv w t, , is flow from thereservoir to the next reservoir (w) if there is a link (DDLINK ) be-tween these, Hv t, is water level at the reservoir, and htailv is thetailwater level of the reservoir.
Electricity generation for run-of-river power stations is esti-mated as:
⎛⎝⎜⎜
⎞⎠⎟⎟EP FL ry
5s t s
n NPLINK k RVLINKn k t v, , ,∑ ∑ρ ε=
( )∈ ∈
where FLn k t, , is river flow from the node n( ) to the next down-stream node ( k) at each moth ( t) if a link between the nodes(RVLINK ) exists and ryv is the reservoir yield, which indicates theamount of electricity generation per unit of river water flow. Ad-ditional constraints related to the maximum electricity generationcapacity of hydropower plants are also considered in the model.
2.1.4. Irrigation benefitsIrrigation benefits are determined as the difference between
crop production revenues and costs. Costs include irrigation effi-ciency improvement costs, water conveyance (transportation)costs, return flow use costs, groundwater pumping costs, and thecosts of crop production for all non-water-related inputs:
Please cite this article as: M. Bekchanov, et al., Optimizing irrigationand Economics (2015), http://dx.doi.org/10.1016/j.wre.2015.08.003i
⎛⎝⎜⎜
⎞⎠⎟⎟
IB A pr Y pc
itc IE ie WACP
dsc DE de RW
cc TWF ruc RU
wpc WP
0.001
0
0
6
rc
r c r c r c r c
cr c r c r c
tt
r r rt n NDLINK
n r t
rt
r t rt c
r c t
rg GWDLINK t c
g r c t
, , , ,
, , ,
, ,
, , ,
, , ,
( )( )
( )
( )
∑
∑ ∑
∑ ∑
∑ ∑ ∑
∑ ∑ ∑
= ⋅ −
− ( − )
− −
− −
−( )
∈
∈
where:
Ar c, is area of a particular crop (c) in a certain irrigation site (r)(in thousand ha);prr c, is agricultural commodity price (in US$ per ton);Yr c, is crop yield (in ton per ha);pcr c, is production cost (not including water inputs) per unit ofland (in US$ per ha);itcr c, is the cost per unit of water saved by improving waterapplication efficiency (in US$ per m3);IEr c, is water application efficiency (a dimensionless variableranging from 0 and 1 depending on technology);ie0r c, is baseline water application efficiency without any addi-tional improved technology (a dimensionless parameter thatvaries between 0 and 1);WACPr c t, , is total water applied to each crop at field level (inmillion m3);dscr c, is the cost of a unit of water saved by improving con-veyance efficiency (US$ per m3);DEr is distribution (conveyance) efficiency with improvedtechnology (a dimensionless variable ranging from 0 and 1 de-pending on technology);de0r is baseline distribution (conveyance) efficiency without anynew improved technology (a dimensionless parameters thatvaries between 0 and 1);
efficiency improvements in the Aral Sea Basin, Water Resources
M. Bekchanov et al. / Water Resources and Economics ∎ (∎∎∎∎) ∎∎∎–∎∎∎ 5
RWn r t, , is water withdrawal from river node (n) to irrigation site(r) at a certain month (t) if there is a link between the irrigationsite and the river node (NDLINK ) (in million m3);ccr is conveyance cost per unit of water supplied (in US$ perm3);TWFr t, is water supplied to the field in each month (in millionm3);rucr is cost of reusing return water for irrigation (in US$ per m3);RUr c t, , is the amount of re-used return flow (in million m3);wpcr is the cost of groundwater pumping (in US$ per m3); andWPg r c t, , , is the amount of water pumped from the groundwatersource ( g) to irrigate crops (in million m3) if the irrigation siteand the groundwater aquifer is interrelated (GWDLINK ).
2.1.5. Irrigation: water use and yield relationshipsCrop yield levels (Yr c, ) are estimated considering monthly crop
water consumption amounts, using the FAO method [28]:
⎪
⎪
⎪
⎪
⎧⎨⎩
⎡⎣⎢⎢
⎛⎝⎜⎜
⎞⎠⎟⎟
⎛⎝⎜⎜
⎛⎝⎜
⎞⎠⎟
⎞⎠⎟⎟
⎤⎦⎥⎥
⎫⎬⎭ 7
Ymy
kycET
A etm
kyET
A etm
1 max 10.01
,
max 10.01
r c
r cc
t r c t
t r c r c t
tc t
r c t
r c r c t
,
,
, ,
, , ,
,, ,
, , , ( )
= − −∑
⋅ ∑
−⋅
where myr c, is the maximum attainable yield (in ton per ha),kyc t, is a set of monthly crop coefficients (a dimensionless para-meter), kycc is a seasonal crop coefficient (a dimensionless para-meter), ETr c t, , is total actual crop evapotranspiration (in millionm3), and etmr c t, , is crop reference evapotranspiration (in mm).
2.1.6. Irrigation: water balance at irrigation sitesDetailed hydrological linkages between surface water,
groundwater, and return flows on the one hand, and agriculturalproduction on the other hand, have been incorporated into themodel (Fig. 2). Only a fraction of total surface water withdrawalsreach irrigation sites (or farm gates), with the remaining fractionbeing lost during conveyance. A portion of these conveyance lossesrecharge aquifers, and the remainder becomes drainage water.6
Groundwater, local rainfall, and recycled drainage water alsosupply water to irrigated areas.7
At the field level, only a portion of the water delivered is usedfor beneficial crop evapotranspiration. The remaining water that islost at the field level joins groundwater aquifers through deeppercolation or flows into the drainage system. Drainage flows re-maining after re-use of return flows (recycled water) either flowback into the river or are delivered to tail-end water depressions.Groundwater seepage also partially increases river flows. Themathematical formulations of these complex hydrological dy-namics are described in additional detail below.
2.1.6.1. Total water application at field level. Total water applied toeach crop at field level (WACPr c t, , ) must be equal to the sum ofsurface water application ( WCPr c t, , ), groundwater application(WPg r c t, , , ), and re-use of return flows (RUr c t, , ):
WACP WCP WP RU8
r c t r c tg GWDLINK
g r c t r c t, , , , , , , , ,∑= + +( )∈
6 Given data limitations evaporation losses from conveyance infrastructuresare not explicitly considered but rather are modeled through losses that join thedrainage system and finally reach tail-end water sinks.
7 The proportion of these sources are very limited compared to surface watersupply. For instance, groundwater uses are only 3–4% of total irrigation watersupply. Rainfall occurs mainly during the non-vegetation period and thus haslimited impact on beneficial water consumption by crops. Because of the highsalinity of drainage waters farmers usually only blend them with surface water toimprove water supply for crops during abnormally dry years.
Please cite this article as: M. Bekchanov, et al., Optimizing irrigationand Economics (2015), http://dx.doi.org/10.1016/j.wre.2015.08.003i
2.1.6.2. Seasonal water supply to crops. Total seasonal water supplyto crops in each region (TWACPr c, ) is equal to the sum of total waterapplication for the use of each crop (WACPr c t, , ) and total effectiverainfall over the months:8
⎛⎝⎜⎜
⎞⎠⎟⎟WACP A er TWACP0.01
9tr c t r c r c t r c, , , , , ,∑ + ⋅ =
( )
where err c t, , is effective rainfall measured in mm.
2.1.6.3. Irrigation water consumption by crops. Irrigation water thatis effectively used by crops is equal to the difference betweenseasonal actual crop evapotranspiration ( ETS ETr c t r c t, , ,= ∑ ) andseasonal total effective rainfall, adjusted for the application effi-ciency:
⎛⎝⎜⎜
⎞⎠⎟⎟IE WACP ETS A er0.01
10r c
tr c t r c
tr c r c t, , , , , , ,∑ ∑= − ⋅ ( )
( )
2.1.6.4. Total water consumption for irrigated crops. Actual cropevapotranspiration by months (ETr c t, , ) must be less than or equal tothe sum of water that is actually used by crops and total effectiverainfall:
ET IE WACP A er0.01 11r c t r c r c t r c r c t, , , , , , , ,≤ + ⋅ ( )
2.1.6.5. Maximum feasible water consumption by crops. Actual cropevapotranspiration by months (ETr c t, , ) must be less than or equal tothe total crop reference evapotranspiration:
ET A etm0.01 12r c t r c r c t, , , , ,≤ ⋅ ( )
where etmr c t, , is crop reference evapotranspiration measured inmm.
2.1.6.6. Seasonal water consumption. For each crop, seasonal actualcrop evapotranspiration (ETSr c, ) must be less than or equal to thetotal seasonal water application ( TWACPr c, ) net of seasonal deeppercolation (DPr c, ):
9
ETS TWACP DP 13r c r c r c, , ,≤ − ( )
2.1.6.7. Surface water delivery. Total surface water delivered to ademand site (TWFr t, ) was calculated considering conveyance effi-ciency and water withdrawals from the river node:
TWF RW DE14
r tn NDLINK
n r t r, , ,∑=( )∈
2.1.6.8. Surface water application at field level. The sum of totalsurface water applied to all crops in each site (WCPr c t, , ) must bal-ance with water actually delivered to the site (TWFr t, ):
WCP TWF15c
r c t r t, , ,∑ =( )
2.1.6.9. Monthly deep percolation. Monthly deep percolation de-pends on irrigation efficiency ( IEr c, ) and total water delivered tothe field for each crop (WACPr c t, , ):
8 The term ‘seasonal’ is used to mean “spanning each annual growing season”throughout the text
9 We note here that non-beneficial evapotranspiration is not explicitly mod-eled because of lack of data but is implicitly considered through losses to thedrainage system.
efficiency improvements in the Aral Sea Basin, Water Resources
10 Note that we do not model water quality and salinity tolerance, but ratherimpose this constraint based on assumed tolerance for re-use as revealed by ex-isting practices in the region.
M. Bekchanov et al. / Water Resources and Economics ∎ (∎∎∎∎) ∎∎∎–∎∎∎6
DPSTG WACP IE1 16r c t r c t r c, , , , ,= ( − ) ( )
2.1.6.10. Seasonal deep percolation. Total seasonal deep percolation( DPr c, ) is the sum of monthly deep percolation across monthswithin the season (DPSTGr c t, , ):
DP DPSTG17
r ct
r c t, , ,∑=( )
2.1.6.11. Groundwater seepage into surface water. Groundwaterdischarge to the river system depends on the water volume in theaquifer and the transitivity coefficient (trsg n, ):
DSCH trs gws agw GH 18g n t g n g g g t, , , ,= ( )
2.1.6.12. Groundwater storage balance. The groundwater storage insubsurface aquifers increases due to water percolation from fieldsand irrigation canals, and declines due to groundwater with-drawals (WPg r c t, , , ) and water seepage to the river (DSCHg r c t, , , ):
19
gws agw GH GH DPSTG drn
RW DE
drn WP
DSCH
0.01 1
1
1
g g g t g tr GWDLINK c
r c t r
r GWDLINK n NDLINKn r t r
rr GWDLINK c
g r c t
n GWRLINKg n t
, , 1 , ,
, ,
, , ,
, ,
( ) ( )
( )
∑ ∑
∑ ∑
∑ ∑
∑( )
− = −
+ ( ( − )
− ) −
−
−∈
∈ ∈
∈
∈
where gwsg is yield of groundwater aquifer, agwg is the surfacearea of groundwater aquifer, GHg t, is groundwater depth, DPSTGr c t, ,
is deep percolation from crop fields in each month, and drnr is theproportion of water losses flowing to drainage networks.
2.1.6.13. Generation of return flows. Return flows generated fromeach irrigation site across months (RFr t, ) come from water perco-lation from crop fields ( DPSTGr c t, , ) and irrigation canals that areadjusted considering the proportion of water losses flowed to thedrainage networks (drnr):
RF DPSTG drn RW DE drn120
r tc
r c t rn DNLINK
n r t r c t r, , , , , , ,∑ ∑= + ( − )( )∈
2.1.6.14. Discharge of return flows to surface water. Part of this re-turn flow (RFr t, ) is discharged into the river node (RFRr n t, , ) and theremaning goes to tail end depressions or lakes (RFLr t, ):
RF RFR RFL21
r tn DNLINK
r n t r t, , , ,∑= +( )∈
2.1.6.15. Maximum discharge of return flows. To prevent unrealisticreturn flows back to the river channel (which would not be al-lowed by irrigation canal managers due to concerns over waterquality), an additional constraint on return flows discharged intothe river is introduced:
RFR rr RW22n DNLINK
r n t r tn NDLINK
n r t, , , , ,∑ ∑≤( )∈ ∈
where rrr t, is the maximum ratio of return flows discharged intothe river to the regional water withdrawal.
2.1.6.16. Constraint on use of return flows. Only a portion of returnflows (RFLr t, ) can be re-used for irrigation since full re-use is notacceptable due to the high salinity of return flows:
Please cite this article as: M. Bekchanov, et al., Optimizing irrigationand Economics (2015), http://dx.doi.org/10.1016/j.wre.2015.08.003i
RU rru RFL23c
r c t r r t, , ,∑ ≤( )
where rrur is the rate of return water re-use (this is a di-mensionless parameter that varies between 0 and 1).10
2.1.7. Surface water balance (flow continuity equations)2.1.7.1. Simple river nodes. The water balance in the river nodes isformulated as:
24
F s RSN RFR
DSCH
F NRS
RW idw
m RVLINKm n t n t
v RNLINKv n t
r DNLINKr n t
g GWRLINKg n t
k RVLINKn k t
v NRLINKn v t
r NDLINKn r t n r t
, , , , , , ,
, ,
, , , ,
, , , ,
∑ ∑ ∑
∑
∑ ∑
∑( )
+ + +
+
= +
+ ( + )
∈ ∈ ∈
∈
∈ ∈
∈
where:
Fm n t, , is river flow to the river node (n) from the upper river node(m) if there is a link between these nodes (RVLINK );sn t, is the water supply from source nodes that flow into theriver (e.g., tributaries);RSNv n t, , is river flow from an upstream water reservoir to rivernode;RFRr n t, , is return water from irrigation sites to the river node;DSCHg n t, , is the amount of water that seeps into the river fromgroundwater sources (gw) if there is a link (GWRLINK ) betweena groundwater reservoir ( g) and river node (n);NRSn v t, , is river flow from a river node ( n) to a downstreamwater reservoir;RWn r t, , and idwn r t, , are water withdrawals from a river node (n)to an irrigation site (r) and municipal-industrial water use, re-spectively, if there is a link between the node and the wateruser site ( NDLINK ). Municipal-industrial water demands aretaken as exogenous and must be met first since these sectors areprioritized in national water distribution practices. All water useand flow variables are in million m3.
In addition, the model considers a one year time horizon withmonthly time steps, such that reservoirs are assumed to operate todistribute flows seasonally but not inter-annually. Thus end-of-year reservoir storage is constrained to be equal to the initial re-servoir storage to prevent unrealistic drawdown of reservoirs atthe end of the optimization period.
2.1.7.2. Reservoir nodes. The water level in a reservoir ( Hv t, ) de-pends on the reservoir storage volume (Vv t, ):
H htail d d V d V0 1 2 25v t v v t v t, , ,2− = + + ( )
where d0, d1, and d2 are the parameters of the elevation-sto-rage function, which are determined based on goodness of fitstatistics.
Similarly, the surface area of the reservoir is related to its sto-rage volume following the functional relationship of:
S c c V c V c V0 1 2 3 26v t v t v t v t, , ,2
,3= + + + ( )
where c0, c1, c2, and c3 are the parameters of the function.The water balance in reservoirs is then modeled as:
efficiency improvements in the Aral Sea Basin, Water Resources
M. Bekchanov et al. / Water Resources and Economics ∎ (∎∎∎∎) ∎∎∎–∎∎∎ 7
V NRS RRS
V RSN RRS
S S
0.001
0.5 0.5 27
v tn NRLINK
n v tu DDLINK
u v t
v tn RNLINK
v n tw DDLINK
v w t
v t v t v t
, 1 , , , ,
, , , , ,
, , 1 ,
∑ ∑
∑ ∑
φ
+ +
= + + +
⋅ ( + ) ( )
−∈ ∈
∈ ∈
−
where RRSu v t, , is the flow to the reservoir ( v) from an upperreservoir (u), v t,φ is the rate of evaporation from the surface of thereservoir, and Sv t, is the surface area of the reservoir. Consideringthe maximum size of the reservoirs constraints on reservoir waterstorage capacity is additionally included in the model.
2.2. River node scheme
The schematic used in the hydro-economic basin managementmodel comprises 32 river tributaries, 9 river nodes (where inflowsfrom tributaries enter and water withdrawals occur), 26 irrigationsites (provinces), 7 water storage reservoirs, and 11 hydropowerproduction units (Fig. 3). Although there are more than 80 waterreservoirs operating or planned in the ASB, only the largest andmost important reservoirs were explicitly modeled in this study.Most of these reservoirs serve both for hydroelectricity generationand seasonal water flow regulation. Moreover, the five key run-of-
Table 1Sources of data used in the model.
# Data
1 Monthly water supply by tributaries, water withdrawals for irrigation, industry anmunicipal sector
2 Cropping areas and yields3 Crop ET and Effective rainfall4 Crop production costs, benefits, conveyance costs
5 Water application and conveyance efficiency by site6 Hydropower production capacity, electricity prices, and reservoir storage capacitie7 Environmental flow and benefits8 Costs of water conservation by water application and conveyance efficiency
improvements
Please cite this article as: M. Bekchanov, et al., Optimizing irrigationand Economics (2015), http://dx.doi.org/10.1016/j.wre.2015.08.003i
the-river power stations are modeled.The agricultural production model includes key crops grown in
the basin: cotton, wheat, maize, rice, fodder crops, fruits, vegetablesand gourds and other crops (sugar beet, sunflower). Crop patternsvary across irrigation sites: rice is more common in downstreamreaches of both sub-basins while fodder crops, cereals and horti-cultural crops are more common in upstream reaches.
2.3. Model data
Due to the significant geographic extent of the model and thefact that it spans multiple countries, a large and consistent data-base had to be constructed from a variety of data sources (Table 1).Monthly water availability estimates at supply nodes, and waterwithdrawals for irrigation and municipal-industrial use weresourced from the CAREWIB database [29]. CAREWIB also includesestimates of cropping areas and crop yields across irrigation sites.Data on potential evapotranspiration coefficients and effectiverainfall were taken from IFPRI's IMPACT model [30]. The costs andbenefits of crop production across the provinces of Uzbekistancome from statistical reports of national water management or-ganizations [31]; due to lack of data, those for other ASB countriesare approximated using the costs and benefits in the closest
Source
d SIC-ICWC [29]
SIC-ICWC [29]IFPRI [30]Local water management organization including SIC-ICWC 2008 [31],MAWR [32],GEF [33], Cai [34], EC-TACIS [35]
s Cai [34], EC IFAS [36] and SIC-ICWC [37]INTAS 2006 [38]Cai [34], SIC-ICWC 2002 [39]
efficiency improvements in the Aral Sea Basin, Water Resources
M. Bekchanov et al. / Water Resources and Economics ∎ (∎∎∎∎) ∎∎∎–∎∎∎8
province of Uzbekistan. MAWR provided water conveyance costsfor irrigation sites [32]. Conveyance and water application effi-ciency across the sites are based on GEF [33], Cai [34] and EC-TACIS[35]. Hydropower production capacity, electricity prices, and re-servoir storage capacities are based on Cai [34] and updated usingthe BEAM [36] and ASBOM [37] model databases. Parameters forthe functional relationships between reservoir head, surface areaand volume are from EC IFAS [36] and SIC-ICWC [37]. Environ-mental flows and benefits are based on INTAS report [38]. Finally,the annualized costs per unit of water saved through improvingirrigation and conveyance efficiencies, and the costs per unit ofgroundwater and return flow uses, are estimated based on datafrom Cai [34] and SIC-ICWC [39]. Since most of data on costs andbenefits are available for 2006, all parameters and model resultsare reported in 2006 US$.
2.4. Model calibration, scenarios and solution
The model uses a normative mathematical programming ap-proach that is calibrated to the water availability, use, and totalcropland levels of 1999, since this year had the medianwater supplyover the period between 1980 and 2008. The model is coded andsolved in GAMS. In the analyses reported in this paper, the results oftwo scenarios are compared: a) optimal water allocations andbenefits with existing conveyance and field irrigation technologies( IE ie0r c r c, ,= and DE de0r c r c, ,= ); and b) optimal water allocationsand benefits allowing for economically efficient improvements inconveyance and field irrigation improvements ( IE ie0r c r c, ,> andDE de0r c r c, ,> ). The difference between the benefits generated underthese two scenarios corresponds to the net economic gains fromimplementing technical water savings interventions.
Because of the implicit modeling of technological improvementsthrough water application and conveyance efficiency changes, wehere provide a table that indicates how improved irrigation effi-ciency maps to specific technological improvements (Table 2). Notethat these are examples for technological improvements and that awider range of options is available in practice.
The economic gains from water use efficiency improvementsare estimated for three scenarios of water availability, character-ized by normal supply (1999 flows, srcn t, ), as well as syntheticyears based on uniform 10% and 20% reductions (in space andtime) in the pattern of inflows for that year ( src0.9 n t, and src0.8 n t, ,respectively). In addition, given the relatively limited data on thecost of water saving technologies and on the benefits of environ-mental flows, we conduct additional analysis to test the sensitivityof results to a) the weight on environmental benefits in Eq. (1), andb) the irrigation efficiency cost parameters in the model. In theformer analysis, we varied the relative weight on environmentalbenefits (ω) over a range increasing from 1 to 20. Using a weight of1 as the lower bound can be justified by the fact that the assumedbenefits only correspond to a partial accounting, as described inSection 2.1. In the latter analysis, different combinations of effi-ciency improvement costs per unit of saved water were variedfrom 0.25 to 5 times their baseline levels. In the first analysis, onlythe conveyance improvement costs ( itcr c, ) were modified. Thesecond analysis then considered only changes in the applicationefficiency costs (dscc), and the third included both.
Table
2Con
veya
nce
andwater
applic
a
Efficien
cyim
prove
men
tmea
sures
Con
veya
nce
efficien
cy
WAEof
cotton
WAEof
rice
WAEof
whea
tWAEof
maize
andfodder
crop
sWAEof
fruits,
vege
tables
andgo
urds
3. Results and discussion
Before turning to a summary of the net economic gains from theanalyzed investments in water use efficiency improvement, we firstdiscuss the place and magnitude of these improvements and theirimplications for agricultural land expansion (adjustment on the ex-tensive margin) versus modification of existing cropping patterns
Please cite this article as: M. Bekchanov, et al., Optimizing irrigation efficiency improvements in the Aral Sea Basin, Water Resourcesand Economics (2015), http://dx.doi.org/10.1016/j.wre.2015.08.003i
Fig. 4. Irrigated area and irrigation benefits with and without irrigation efficiency improvements (IEIs) across the sites under normal water supply.
Table 3Conveyance efficiency (CE) and water application efficiency (WAE) rates for cotton, wheat, and rice across irrigation sites in the ASB, with and without optimal efficiencyimprovement and under varying water supply conditions.
M. Bekchanov et al. / Water Resources and Economics ∎ (∎∎∎∎) ∎∎∎–∎∎∎ 9
Please cite this article as: M. Bekchanov, et al., Optimizing irrigation efficiency improvements in the Aral Sea Basin, Water Resourcesand Economics (2015), http://dx.doi.org/10.1016/j.wre.2015.08.003i
Fig. 5. Cropland pattern changes with and without irrigation efficiency improvements (IEIs) across the sites under normal water supply.
M. Bekchanov et al. / Water Resources and Economics ∎ (∎∎∎∎) ∎∎∎–∎∎∎10
(adjustment on the intensive margin), under the different wateravailability scenarios.
3.1. Optimal level of conveyance and water application efficiencyimprovements
According to the model results, the improvement of con-veyance efficiency of many irrigation canals, particularly indownstream provinces of the Amu and Syr Darya Basins, wouldincrease economic net benefits (Table 3). Specifically, canal sys-tems in Khorezm, Karakalpakstan and Dashauz provinces (AmuDarya Basin) and Syrdarya, Jizzakh, South Kazakhstan, and Kyzy-lorda provinces (Syr Darya Basin) should be fully upgraded. Thepreferential conveyance improvements for these downstream ir-rigated areas are largely driven by the fact that losses are higher inthese zones due to their largely sandy soils.
The findings also indicate that there would be considerablebasin-wide benefits from improving the efficiency of water ap-plication (on-farm) in cotton, rice and wheat fields (Table 2). Be-cause of the high fiber quality and higher yields of cotton pro-duction in up- and mid-stream provinces (Ferghana Valley) of theSyr Darya Basin [40], cotton production in these zones generateslarger net benefits. The results indicate that the costs of im-provements in water application efficiency of cotton production inthese zones up to levels of 0.8 to 0.9 (drip irrigation) would be
Table 4Rebound effects of water use efficiency improvements.
Water and land use indicators Scenarios
Without technologi-cal improvements
With technologicalimprovements
Total irrigation water with-drawals at river nodes (km3)
109.5 105.0
Irrigation water delivery to thefields (km3)
63.9 66.9
Total surface, groundwater andreturn flow diversion (km3)
Deep percolation (km3) 31.1 28.8Return flows (km3) 46.0 36Return flows discharge to tail-end depressions (km3)
35.0 26.5
Return flows discharge to river(km3)
11.0 10.3
Flows to the Aral Sea (km3) 14.3 16.6
Please cite this article as: M. Bekchanov, et al., Optimizing irrigationand Economics (2015), http://dx.doi.org/10.1016/j.wre.2015.08.003i
recovered and would deliver substantial basin-wide economicbenefits. These findings are consistent with previous research thatdemonstrates the profitability of adopting drip irrigation tech-nologies for growing high value crops [10].
Furthermore, the optimal magnitude of water application effi-ciency improvements increases in tandem with reduced wateravailability. The economics of more efficient water use improveunder such conditions because the increased marginal value ofwater under reduced water supply offsets the higher marginalcosts of increasing water conservation. If water availability de-creases to 80% of normal supply, for example, irrigation efficiencyimprovements for cotton production become beneficial in severaladditional regions of the Amu Darya Basin – Khatlon, Ahal, andKashkadarya – and in all cotton-producing regions of the SyrDarya Basin except Jizzakh. Under these drier conditions, the waterapplication efficiency of irrigation for wheat production shouldalso be fully improved in a number of regions – Khatlon, RRT,Surkhandarya, Ahal, and Kashkadarya in the Amu Darya Basin andNamangan, Sugd, and South Kazakhstan in the Syr Darya Basin.The use of transplanting for rice production (this is technically notan irrigation technique but rather a farming method that sub-stantially reduces water requirements) or implementing drip ir-rigation (it is not practiced currently in the study region) is simi-larly beneficial in all rice producing regions under these drierconditions.
Table 5Comparing the economic benefits of optimal water allocation with (OPT�) andwithout irrigation modernization (OPTþ) under different levels of water supply.
Scenarios Water supply Change compared to the optimal(baseline) scenario
M. Bekchanov et al. / Water Resources and Economics ∎ (∎∎∎∎) ∎∎∎–∎∎∎ 11
3.2. Adjustments in irrigated areas and crop types
We next consider adjustments along the intensive (crop choiceand intensity) and extensive (cultivated land area) margins of ir-rigation. Regarding the latter, irrigation efficiency improvementssupports irrigated area expansion in the more productive sites inthe ASB (Fig. 4 top). For example, irrigated areas – mainly for riceand cotton production – increase in Khorezm and Karakalpakstanin the Amu Darya Basin after conveyance efficiency improvements(Fig. 5). Similarly, cotton area expands in Ferghana, Namangan,Sugd, Tashkent (which also sees expansion of orchards), Jizzakh,and South Kazakhstan of the Syr Darya Basin. Because of the re-latively low assumed value for environmental flows compared to
Fig. 6. Water withdrawals for irrigation and water allocated for environmental flow purpweighting parameter for environmental flows in the objective function of the model, u
Fig. 7. Irrigation and environmental benefits, with and without irrigation efficiency impin the objective function of the model, under normal supply.
Please cite this article as: M. Bekchanov, et al., Optimizing irrigationand Economics (2015), http://dx.doi.org/10.1016/j.wre.2015.08.003i
irrigation benefits in our base case, most of the water that is savedis re-allocated to this irrigation expansion.
At the intensive margin, we observe more modest changes. Thespatial crop patterns in many irrigation sites shift somewhat to-ward more water-intensive crops for which the marginal net gainsfrom additional water availability are higher (Fig. 5). For instance,cotton cropping increases at the expense of wheat in Mary. Wheatareas decrease somewhat in several other areas, including GBAO,Khatlon, Kashkadarya, Karakalpakstan, and Jalalabad, and this cropis replaced by rice, cotton, and grapes. Cotton expansion is alsorecommended in Ferghana, Namangan, Sugd, Tashkent, Jizzakhand South Kazakhstan of the Syr Darya Basin.
oses, with and without irrigation efficiency improvements (IEIs), as a function of thender normal supply.
rovements (IEIs), as a function of the weighting parameter for environmental flows
efficiency improvements in the Aral Sea Basin, Water Resources
Fig. 8. Optimal annualized investment costs of improving conveyance and water application efficiency (US$ million per year) under normal water supply.
M. Bekchanov et al. / Water Resources and Economics ∎ (∎∎∎∎) ∎∎∎–∎∎∎12
3.3. Implications for water conservation and rebound effects
Irrigation technology improvements clearly lead to water sav-ing at the field or local level, but some specialists question whe-ther these savings translate into measurable basin scale savings[41]. This basin scale effect is ambiguous because a) irrigation ef-ficiency improvements can reduce return flows that also con-tribute to downstream water supply, and b) behavioral adjust-ments may translate into additional abstractions and area expan-sions by upstream irrigators. The latter change, or rebound effect,is driven by the fact that increased water use efficiency effectivelyincreases water availability for irrigated area expansion or morecrop water consumption, since marginal value of water for main-taining environmental flows is low. This potential for reboundeffects can be analyzed using a river basin scale model such as theone employed in this study.
In fact, the model results show that water abstractions fromriver nodes decrease considerably following the irrigation im-provements (Table 4). Nonetheless, the greater conveyance effi-ciencies in canals translate into greater irrigation water availabilityat the farm gate (irrigation water supply increases from 63.9 to66.9 km3). This additional water then translates into both in-creased per hectare water use, and irrigation expansion. The totalirrigated land area increases from 6.8 to 7.2 million ha, and themost significant changes along this extensive margin occur at siteswhere the irrigation efficiency improvements are concentrated.Overall, the beneficial water consumption by irrigated crops thusincreases from 42 to 52 km3. At the same time, deep percolationdecreases somewhat, from 31.1 to 28.8 km3. This reduced deeppercolation however primarily affects the return flows dischargedto tail-end depressions, rather than those that return to the river.As such, the rebound effects or increased upstream water con-sumption that is induced by these technological improvementshave relatively small consequences for downstream users and onlyslightly increase environmental flows into the Aral Sea. Of course,these effects on environmental flows are partly reflective of theprevailing limited allocations and value ascribed to flows into theAral Sea.
3.4. Economic impact of irrigation technology improvements
We next compare the optimal economic benefits for the twoscenarios described above, i.e., with and without investment inoptimal irrigation efficiency (Table 5). Under normal supply andwithout any efficiency improvements, the optimal total economic
Please cite this article as: M. Bekchanov, et al., Optimizing irrigationand Economics (2015), http://dx.doi.org/10.1016/j.wre.2015.08.003i
benefits reach US$3.2 billion (2.8 billion from irrigated agriculture,with the remainder in hydropower and ecosystem gains). Withefficiency improvements, total benefits increase by 20% to US$3.8billion (with irrigation, hydropower and ecosystem benefits in-creasing by 22%, 5% and 21%, respectively). Under the most con-strained water supply conditions (80% of normal flow), the optimalbasin-wide benefits from the set of modeled efficiency improve-ments increase by 36% (with irrigation, hydropower and ecosys-tem benefits increasing by 42%, 1% and 2%, respectively). The im-pact of adopting water conservation technologies on hydropowerbenefits and environmental water supply appears modest, how-ever. This is because most hydropower production occurs up-stream of large scale irrigation, and because of the low estimatedvalue (relative to the alternative use in irrigation) of environ-mental flows in our base case analysis. In drier years, the watersaved due to irrigation efficiency improvements are thus primarilyallocated to maintaining agricultural production.
As increased benefits are mainly in the agricultural sector(Table 5), we can expect that improved irrigation efficiency wouldincrease irrigation benefits across locations (Fig. 4, bottom). Theextent of the changes in the distribution of benefits would dependon how the various efficiency improvements were paid for, butimproved irrigation would make more water available for high-value cash crops such as rice in downstream sites such as Khorezmand Karakalpakstan. Expansion of rice production would also oc-cur through planting of improved rice varieties and use of trans-planting methods. Similarly, water application efficiency im-provements would substantially increase agricultural incomes inmid- and downstream reaches of the Syr Darya Basin.
3.5. Environmental impact of irrigation technology adoptions
Since long-term environmental benefits are uncertain and mayhave been mischaracterized in the objective function of the model(i.e., the magnitude of these largely nonmarket benefits is not wellknown), the model was re-estimated with a higher weight on theenvironmental benefits term of Eq. (1). According to the results ofthis sensitivity analysis, the releases of water to the environmentalsystem are sensitive to this weighting factor, and such releasescome at the expense of reduced irrigation water withdrawals(Fig. 6). Introduction of irrigation efficiency improvement mea-sures reduce optimal irrigation water withdrawal requirementsconsiderably and increase optimal environmental flows.
Similarly, and mirroring the water withdrawal trends, optimalirrigation benefits decrease and environmental benefits increase
efficiency improvements in the Aral Sea Basin, Water Resources
Table 6Sensitivity analysis for key outcomes as a function of the costs of conveyance efficiency (CEI) and water application efficiency improvements (WAEIs).
Land and water use and economic variables Simulated parameters Relative change in efficiency improvement costs
M. Bekchanov et al. / Water Resources and Economics ∎ (∎∎∎∎) ∎∎∎–∎∎∎ 13
as the weight on environmental benefits in the objective functionincreases (Fig. 7). Irrigation benefits are higher with the in-troduction of irrigation efficiency improvement measures, due tothe increased beneficial crop consumption despite reduced waterintake. Environmental benefits are also higher with the efficiencyimprovements because of higher water release for environmentalneeds. The most important implication of this analysis is thatadditional units of water saved through technological improve-ments could be effectively delivered for environmental needs ifthese were found to be of higher value, but that such a re-allo-cation would require institutions that effectively alter water rights.Specifically, compensation to farmers would likely be required inorder for them to relinquish or trade their water use rights [42],since quantity limits would be politically difficult. Alternatively,introducing taxes on water consumption beyond specific thresh-olds might be effective for increasing environmental flows and thefeasibility (and political economy) of this option should also beinvestigated in future studies.
3.6. Investment costs of technological improvements
Implementing the irrigation improvements discussed in thispaper requires substantial investment (Fig. 8). The annualized in-vestment costs (US$61 million per year) required to improveconveyance efficiency11 are substantial, especially in the mid-stream areas of the Syr Darya Basin and the downstream reachesof the Amu Darya Basin. Similarly, the annualized investment costsof improving the full set of field-level water efficiencyimprovements12 (US$214 million per year) are substantial. Thesecosts are concentrated in the rice-producing downstream pro-vinces of the Amu Darya such as Khorezm, Karakalpakstan, andDashauz and in cotton-producing mid-stream provinces in the SyrDarya such as Ferghana, Andizhan, Namangan, Sugd and Tashkent.An earlier study also indicated a high potential of water savings inthe provinces of the Ferghana Valley (Ferghana, Andizhan, andNamangan) through covering furrows with plastic films for cotton,implementing drip irrigation for orchards, and introducing
11 Calculated as: dsc DE de RW0r r r r t n NDLINK n r t, ,∑ [ ( − )( ∑ ∑ )]∈ .12 Calculated as: itc IE ie FCW0r c r c r c r c r c, , , ,∑ [ ∑ ( ( − ) )].
Please cite this article as: M. Bekchanov, et al., Optimizing irrigationand Economics (2015), http://dx.doi.org/10.1016/j.wre.2015.08.003i
alternate dry furrow for vegetables [43]. While incentives aregenerally well aligned for individual farmers to make beneficialfield-level investments, paying for conveyance enhancementsposes significant coordination challenges, since spatial asymme-tries lead to an uneven distribution of benefits across farms.
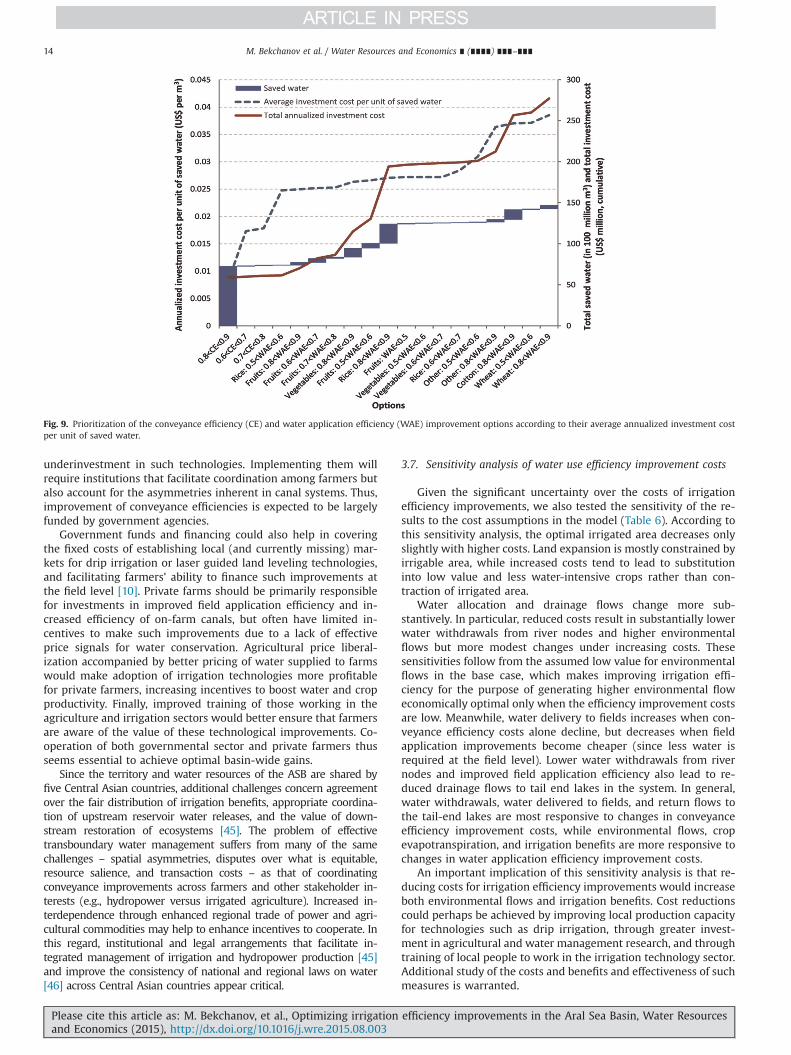
In addition, our model does not include capital constraints,which may be a significant barrier to efficient technology adoptionin the region for both farmers and the government [15, 16, 44].Thus, it may be necessary in the short term to prioritize lower costirrigation efficiency improvements, based on rankings of relativeannualized investment cost per unit of water saved [25] (Fig. 9).Such an ordering of cost effectiveness favors conveyance efficiencyimprovements in downstream sites such as Khorezm, Kar-akalpakstan, Dashauz, South Kazakhstan and Kyzylorda, and morelimited ones in mid- and upstream sites. Such investments woulddeliver a short-run savings of more than 7 km3 of water, or almosthalf of the current average inflow to the Aral Sea.
Beyond these relatively cheap investments, the choice of whichirrigation efficiency improvements to make, given financial con-straints, becomes more difficult. To help guide such decisions, wederive the relationship between water savings and total costsacross the set of potential changes in the ASB (Fig. 9). In Fig. 9, thelowest-cost annualized investment requirement for a given levelof water savings can then be estimated as an integral function ofthe derived cost curve. For instance, efficient investment of US$ 60million would allow savings of up to 7.4 km3 of water, while US$277 million would be required to save 14.7 km3 of water (e.g., fordoubling the environmental flows and maintaining adequate flowlevels to sustain the downstream environmental system).
Of course, there may be significant challenges in achievingeconomically optimal investments in irrigation efficiency, parti-cularly when low cost savings stem from conveyance (rather thanon-farm) improvements. Conveyance infrastructure has char-acteristics of a public good; they are non-exclusive for farmerswithin the affected zone, and generate positive externalities at thebasin level due to reduced water withdrawal requirements.13
There are thus significant risks of free riding and therefore
13 Negative externalities may also occur because of reduced discharge ofaquifers; but groundwater use is only 3–4% of total irrigation water withdrawals inthe ASB so this negative effect is very limited.
efficiency improvements in the Aral Sea Basin, Water Resources
Fig. 9. Prioritization of the conveyance efficiency (CE) and water application efficiency (WAE) improvement options according to their average annualized investment costper unit of saved water.
M. Bekchanov et al. / Water Resources and Economics ∎ (∎∎∎∎) ∎∎∎–∎∎∎14
underinvestment in such technologies. Implementing them willrequire institutions that facilitate coordination among farmers butalso account for the asymmetries inherent in canal systems. Thus,improvement of conveyance efficiencies is expected to be largelyfunded by government agencies.
Government funds and financing could also help in coveringthe fixed costs of establishing local (and currently missing) mar-kets for drip irrigation or laser guided land leveling technologies,and facilitating farmers' ability to finance such improvements atthe field level [10]. Private farms should be primarily responsiblefor investments in improved field application efficiency and in-creased efficiency of on-farm canals, but often have limited in-centives to make such improvements due to a lack of effectiveprice signals for water conservation. Agricultural price liberal-ization accompanied by better pricing of water supplied to farmswould make adoption of irrigation technologies more profitablefor private farmers, increasing incentives to boost water and cropproductivity. Finally, improved training of those working in theagriculture and irrigation sectors would better ensure that farmersare aware of the value of these technological improvements. Co-operation of both governmental sector and private farmers thusseems essential to achieve optimal basin-wide gains.
Since the territory and water resources of the ASB are shared byfive Central Asian countries, additional challenges concern agreementover the fair distribution of irrigation benefits, appropriate coordina-tion of upstream reservoir water releases, and the value of down-stream restoration of ecosystems [45]. The problem of effectivetransboundary water management suffers from many of the samechallenges – spatial asymmetries, disputes over what is equitable,resource salience, and transaction costs – as that of coordinatingconveyance improvements across farmers and other stakeholder in-terests (e.g., hydropower versus irrigated agriculture). Increased in-terdependence through enhanced regional trade of power and agri-cultural commodities may help to enhance incentives to cooperate. Inthis regard, institutional and legal arrangements that facilitate in-tegrated management of irrigation and hydropower production [45]and improve the consistency of national and regional laws on water[46] across Central Asian countries appear critical.
Please cite this article as: M. Bekchanov, et al., Optimizing irrigationand Economics (2015), http://dx.doi.org/10.1016/j.wre.2015.08.003i
3.7. Sensitivity analysis of water use efficiency improvement costs
Given the significant uncertainty over the costs of irrigationefficiency improvements, we also tested the sensitivity of the re-sults to the cost assumptions in the model (Table 6). According tothis sensitivity analysis, the optimal irrigated area decreases onlyslightly with higher costs. Land expansion is mostly constrained byirrigable area, while increased costs tend to lead to substitutioninto low value and less water-intensive crops rather than con-traction of irrigated area.
Water allocation and drainage flows change more sub-stantively. In particular, reduced costs result in substantially lowerwater withdrawals from river nodes and higher environmentalflows but more modest changes under increasing costs. Thesesensitivities follow from the assumed low value for environmentalflows in the base case, which makes improving irrigation effi-ciency for the purpose of generating higher environmental floweconomically optimal only when the efficiency improvement costsare low. Meanwhile, water delivery to fields increases when con-veyance efficiency costs alone decline, but decreases when fieldapplication improvements become cheaper (since less water isrequired at the field level). Lower water withdrawals from rivernodes and improved field application efficiency also lead to re-duced drainage flows to tail end lakes in the system. In general,water withdrawals, water delivered to fields, and return flows tothe tail-end lakes are most responsive to changes in conveyanceefficiency improvement costs, while environmental flows, cropevapotranspiration, and irrigation benefits are more responsive tochanges in water application efficiency improvement costs.
An important implication of this sensitivity analysis is that re-ducing costs for irrigation efficiency improvements would increaseboth environmental flows and irrigation benefits. Cost reductionscould perhaps be achieved by improving local production capacityfor technologies such as drip irrigation, through greater invest-ment in agricultural and water management research, and throughtraining of local people to work in the irrigation technology sector.Additional study of the costs and benefits and effectiveness of suchmeasures is warranted.
efficiency improvements in the Aral Sea Basin, Water Resources
M. Bekchanov et al. / Water Resources and Economics ∎ (∎∎∎∎) ∎∎∎–∎∎∎ 15
4. Summary and conclusions
Irrigated agriculture is the dominant water user in the ASB, butis highly inefficient, due to very low conveyance and water appli-cation efficiencies. Estimates of losses from the sector range from 35to 44 km3 of water per year [26, 47]. Using a basin-wide hydro-economic optimization model, we find that modernizing irrigationnetworks and improving water application at the field level couldsubstantially reduce these losses, to roughly 26 km3 in a normalyear without compromising salinity levels of irrigation water. Thiscould generate large economic net benefits (US$ 600 million in anormal year) and go a long way toward alleviating basin-widewater scarcity. The benefits of modernizing irrigation systems alsoincrease as water supply decreases, in both absolute and relativeterms, from 20% of total benefits under normal water supply, to 40%when supply is reduced by 20%. The increased value of efficiencyimprovements with reduced water availability is particularly im-portant given the expectation that climate change will lead to re-duced precipitation and water availability in this region [48].
The most significant benefits from conveyance efficiency im-provements would come from canal system improvements indownstream irrigation sites. Meanwhile, advanced irrigationtechniques at the field level, such as drip irrigation in cottonproduction and laser guided land leveling in cotton, wheat andrice cultivation [10], would reduce water use and enhance yields ina number of mid-basin and downstream locations in the ASB.These collective improvements would save water, which couldthen be optimally reallocated for crop production and/or formaintenance of downstream ecosystem services around the AralSea, depending on the relative value of each of these benefits.
Implementing irrigation efficiency improvements (and main-tenance) poses substantial policy challenges due to the misalign-ment of costs and benefits of water conservation. This is apparentin the present lack of maintenance of irrigation networks, whichexacerbates their deterioration and increases losses, and is evi-denced by the growing number of silted up and damaged canals,broken gates, outdated pumps, lack of spare parts, and so on. Itseems likely that the widespread adoption and effectiveness ofwater saving technologies, particularly at the field level, woulddepend on a series of reforms related to irrigation water and croppricing, as well as reform of land use rights, which would increaseincentives for the required capital investments and for more pro-ductive use of water resources. In addition to this, conveyanceefficiency improvements would require collective action amongfarmers. The incentive to organize would be bolstered by gov-ernment support and financing, which could reduce problems offree-riding and help farmers to better internalize the significantpositive externalities they would generate. Developing regionalagricultural commodity and energy markets might also create in-centives for inter-state cooperation that would further increase themutual benefits from irrigation sector modernization. Such im-provements would deliver benefits across the basin, by improvingfood and energy security, boosting income, and contributing toprotection of the environment.
Acknowledgments
Data collection, development of the hydro-economic model,and scenario assessments for this paper were conducted as part ofa PhD project at the Center for Development Research (ZEF) ofBonn University, supported by the IPSWaT research scholarship ofthe German Ministry of Education and Research (BMBF; PN21000010). The authors are thankful to the CGIAR Research Pro-gram on Water, Land and Ecosystems (WLE) for supporting the
Please cite this article as: M. Bekchanov, et al., Optimizing irrigationand Economics (2015), http://dx.doi.org/10.1016/j.wre.2015.08.003i
preparation and presentation of the paper at the IWREC WorldBank meeting on 7–8 September 2014. The quality and content ofthe paper benefited greatly from the recommendations, com-ments, and ideas of Prof. Dr. Joachim von Braun (ZEF, Bonn Uni-versity), Prof. Dr. Stephen Vosti (UC Davis), and Dr. Arnim Kuhn(ILR, Bonn University). The authors are also very grateful to thethree anonymous reviewers and the Associate Editor for theircareful review and very helpful and constructive comments thatsubstantially improved the quality of the paper.
References
[1] M.W. Rosegrant, X. Cai, S.A. Cline, World Water and Food to 2025: Dealing withScarcity, IFPRI, Washington D.C, 2002.
[2] World Resources Institute (WRI), World Resources 2005: The Wealth of thePoor-Managing Ecosystems to Fight Poverty, World Resources Institute, Wa-shington D.C., 2005.
[3] J. von Braun, The food crisis isn't over, Nature 456 (2008) 701.[4] D. Pimental, J. Houser, E. Preiss, O. White, H. Fang, L. Mesnick, T. Barsky,
S. Tariche, J. Schreck, S. Alpert, Water resources: agriculture, the environment,and society, BioScience 47 (2) (1997) 97–106.
[5] M. Müller, A general equilibrium analysis of water and land use in Uzbekistan(Ph.D. Dissertation), Bonn University, Bonn, Germany, 2006.
[6] P. Micklin, The Aral Sea disaster, Annu. Rev. Earth Planet. Sci. 35 (2007) 47–72.[7] V.E. Chub, Climate change and its impact on hydrometeorological processes,
agro-climatic and water resources of the Republic of Uzbekistan, Center forHydro-meteorological Service under the Cabinet of Ministers of the Republic ofUzbekistan (Uzhydromet)/Scientific and Research Hydro-meteorological In-stitute (NIGMI), Tashkent (Uzbekistan), 2010.
[9] M. Bekchanov, A. Bhaduri, M. Lenzen, J.P.A. Lamers, Integrating input-outputmodeling with multi-criteria analysis to assess options for sustainable eco-nomic transformation: the case of Uzbekistan, in: A. Bhaduri, J. Bogardi,J. Leentvaar, S. Marx (Eds.), The Global Water System in the Anthropocene,Springer, Dordecht/Heidelberg/London/New York, 2014, pp. 229–245.
[10] M. Bekchanov, J.P.A. Lamers, C. Martius, Pros and cons of adopting water-wiseapproaches in the lower reaches of the amu darya: a socio-economic view,Water 2 (2010) 200–216.
[11] M.W. Rosegrant, C. Ringler, D.C. McKinney, X. Cai, A. Keller, G. Donoso, In-tegrated economic-hydrologic water modeling at the basin scale: the Maiporiver basin, Agric. Econ. 24 (1) (2000) 33–46.
[12] C. Ringler, J. von Braun, M.W. Rosegrant, Water policy analysis for the MekongRiver Basin, Water Int. 29 (1) (2004) 30–42.
[13] C. Ringler, N.V. Huy, S. Msangi, Water allocation policy modeling for the DongNai river basin: an integrated perspective, J. Am. Water Resour. Assoc. 42(2006) 1465–1482.
[14] F.A. Ward, M. Pulido-Velazquez, Water conservation in irrigation can increasewater use, Proc. Natl. Acad. Sci. USA 105 (2008) 18215.
[15] M. Bekchanov, K. Nurmetov, J.P.A. Lamers, Economic incentives for adoptingirrigation innovations in arid environments, in: J.P.A. Lamers, A. Khamzina,I. Rudenko, P.L.G. Vlek (Eds.), Restructuring Land Allocation, Water Use andAgricultural Value Chains: Technologies, Policies and Practices for the LowerAmudarya Region, V&R unipres, Bonn, 2014, pp. 299–318.
[16] A. Bhaduri, U. Manna, Impacts of water supply uncertainty and storage onefficient irrigation technology adoption, Nat. Resour. Model. 27 (1) (2014)1–24.
[17] X. Cai, M.W. Rosegrant, Irrigation technology choices under hydrologic un-certainty: a case study from Maipo River Basin, Chile, Water Resour. Res.(2004), http://dx.doi.org/10.1029/2003WR002810, W04103.
[18] X. Cai, D. McKinney, L. Lasdon, Integrated hydrologic-agronomic-economicmodel for river basin management, J. Water Resour. Pl.: ASCE 129 (1) (2003)4–17.
[19] N. Ibragimov, S.R. Evet, Y. Esanbekov, B. Kamilov, L. Mirzaev, J.P.A. Lamers,Water use efficiency of irrigated cotton in Uzbekistan under drip and furrowirrigation, Agric. Water Manag. 90 (2007) 112–120.
[20] M.G. Horst, S.S. Shamutalov, J.M. Gonçalves, L.S. Pereira, Assessing impacts ofsurge-flow irrigation on water saving and productivity of cotton, Agric. WaterManag. 87 (2007) 115–127.
[21] I. Abdullaev, M. Ul Hassan, K. Jumaboev, Water saving and economic impactsof land leveling: the case study of cotton production in Tajikistan, Irrig. Drain.Syst. 21 (2007) 251–263.
[22] S.A. Nerozin, Drip irrigation regime of agricultural crops, in: Proceedings ofSANIIRI 80 years, Tashkent, Uzbekistan, 2005, pp. 45–57.
[23] R. Tornqvist, J. Jarsjo, Water savings through improved irrigation techniques:basin-scale quantification in semi-arid environments, Water Resour. Manag.26 (2012) 949–962.
[24] I. Bobojonov, J. Franz, E. Berg, J.P.A. Lamers, C. Maritus, Improved policymaking for sustainable farming: a case study on irrigated dryland, J. Sustain.Agric. 34 (7) (2010) 800–817.
[25] McKinsey & Company, Charting Our Water Future–Economic Frameworks to
efficiency improvements in the Aral Sea Basin, Water Resources
M. Bekchanov et al. / Water Resources and Economics ∎ (∎∎∎∎) ∎∎∎–∎∎∎16
Inform Decision-making, Prepared by L. Addams, G. Boccaletti, M. Kerlin, M.Stuchtey, McKinsey & Company, New York.
[26] M. Bekchanov, Efficient water allocation and water conservation modeling(PhD Thesis), Bonn University, Bonn, 2014, Available online at: ⟨http://hss.ulb.uni-bonn.de/2014/3609/3609.pdf⟩.
[27] M. Bekchanov, A. Bhaduri, C. Ringler, Potential gains fromwater rights tradingin the Aral Sea Basin, Agric. Water Manag. 152 (2015) 41–56.
[28] J. Doorenbos, A.H. Kassam, Yield response to water (FAO Irrigation and Drai-nage Paper No. 33), FAO, Rome, 1979.
[29] SIC-ICWC, C.A.R.E.W.I.B. (Central Asian Regional Water Information Base),2011. Available online at: ⟨www.cawater-info.net⟩ (accessed on 27.01.2012).
[30] International Food and Policy Research Institute (IFPRI), Data on crop evapo-transpiration and effective rainfall across the main climatic zones of CentralAsia based on IMPACT model database (Excel files delivered by Dr. ClaudiaRingler and Dr. Tingju Zhu on 24.07.2013), 2013.
[31] SIC-ICWC, Crop production cost and benefit data from different SIC-ICWCreports. Tashkent (Uzbekistan), 2008.
[32] Ministry of Agriculture and Water Resources of Uzbekistan (MAWR), Con-veyance costs of delivering one cubic m of water to the irrigation regions in2006, Tashkent (Uzbekistan), 2007. (Unpublished report).
[33] Global Environment Facility (GEF), Water and environmental managementproject: Subcomponent A1, Regional report No. 2. GEF & IFAS Aral Sea BasinProgram, Tashkent (Uzbekistan), 2002.
[34] X. Cai, Modeling framework for sustainable water resources management (Ph.D. dissertation), University of Texas, Austin, 1999.
[35] EC-TACIS. 1997. Formulation & analysis of regional strategies on land andwater resources: WARMAP project report. Tashkent: EC-TACIS.
[36] Executive Committee of International Fund for Saving the Aral Sea (EC IFAS),The Aral Sea basin economic allocation model BEAM (Report), 2013. Availableonline at: ⟨www.ec-ifas.org⟩ (accessed 20.08.2013).
[37] SIC-ICWC, The database of the Aral Sea Basin Optimization Model (ASBOM)(Excel file), Tashkent (Uzbekistan), 2003.
[38] INTAS, Final report: the rehabilitation of the ecosystem and bioproductivity of
Please cite this article as: M. Bekchanov, et al., Optimizing irrigationand Economics (2015), http://dx.doi.org/10.1016/j.wre.2015.08.003i
the Aral Sea under conditions of water scarcity. SIC-ICWC, Tashkent (Uzbeki-stan), 2006.
[39] SIC-ICWC, Ways of water conservation: results of WUFMAS Sub-Project,WARMAP-2 Project (TACIS) and Sub Component A-2 of GEF Project “WaterResources and Environment Management in the Aral Sea Basin”, Tashkent(Uzbekistan), 2002.
[40] E. Weinthal, Sins of omission: constructing negotiating sets in the Aral SeaBasin, J. Env. Dev. 10 (1) (2001) 50–79.
[41] J. Berbel, C. Gutiérrez-Martín, J.A. Rodríguez-Díaz, E. Camacho, P. Montesinos,Literature review on rebound effect of water saving measures and analysis of aSpanish case study, Water Resour. Manag. 29 (3) (2015) 663–678.
[42] M. Bekchanov, C. Ringler, A. Bhaduri, A water rights trading approach to in-crease inflows to the Aral Sea Basin, Land Degrad. Dev. (2015), http://dx.doi.org/10.1002/ldr.2394.
[43] A. Karimov, D. Molden, T. Khamzina, A. Platonov, Y. Ivanov, A water accountingprocedure to determine the water savings potential of the Fergana Valley,Agric. Water Manag. 108 (2012) 61–72.
[44] A.D. Foster, M.R. Rosenzweig, Microeconomics of technology adoption, Annu.Rev. Econ. (2010), http://dx.doi.org/10.1146/annurev.economics.102308.124433.
[45] M. Bekchanov, C. Ringler, A. Bhaduri, M. Jeuland, How would the Rogun Damaffect water and energy scarcity in Central Asia? Water Int. (2015), http://dx.doi.org/10.1080/02508060.2015.1051788.
[46] N. Djanibekov, V. Valentinov, Evolutionary governance, sustainability, andsystems theory: the case of Central Asia, in: R. Beunen, K. Van Assche,M. Duineveld (Eds.), Evolutionary Governance Theory: Theory and Applica-tions, Springer, Cham/Heidelberg/New York/Dordrecht/London, 2015,pp. 119–134.
[47] N.F. Glazovsky, The Aral crisis: Causes and Ways of Solution, Nauka, Moscow,1990, in Russian.
[48] W.R. Sutton, J.P. Srivastava, J.E. Neumann, A. Iglesias, B.B. Boehlert, Reducingthe vulnerability of Uzbekistan's agricultural systems to climate change: im-pact assessment and adaptation options, World Bank, Washington DC, 2013.
efficiency improvements in the Aral Sea Basin, Water Resources