Carbon and water footprint analysis of a soap bar produced in Brazil by Natura Cosmetics $ I.C.M. Francke a,n , J.F.W. Castro b a Natura Cosméticos, Rodovia Anhanguera s/n1 km 30,5, 07750-000 Cajamar, SP, Brazil b Geoklock Consultoria e Engenharia Ambiental, Av. Nações Unidas, 13.797 B.2 141 andar 04794-000, São Paulo, SP, Brazil article info Keywords: Sustainability strategy Carbon footprint Water footprint Environmental indicator abstract Water shortage represents one of the main threats to life on our planet. Indeed, over the last five years, society and corporate businesses alike have expressed increasing concern about the long- term sustainability of water resources while climate change and freshwater scarcity became important issues for building a consistent sustainability strategy. Here we investigated the relation- ships between the carbon and water footprints (CF and WF, respectively) of one product from Natura Cosméticos, a leading cosmetic company in Latin America. Our main goal was to determine how to deal synergistically with these environmental pressure indicators in order to help building future strategies that are more sustainable. Our analysis reveals that the total for the CF of the Macadamia soap bar (450 g) was 741 g CO 2 e, while the WF was 1.581 l, 1.587 l, and 3.672 l for the green, blue, and gray components, respectively. We found that at the formulation step, the soap has accumulated 84% of the total CF and 99% of the green component of WF while it accumulated only 6% of total blue WF component and 10% of the gray WF component. Our results reveal that the major volumes accounting for blue and gray occur in the use and disposal phase of the product, when the soap is no longer under Natura's outreach. The use and disposal of this product represent 70% of the total WF and only 16% of the CF. WE also found that carbon and water footprints were significantly high in the farming stage, mainly because of the use of fertilizers for palm cultivation. This study reveals some relevant aspects of the carbon and water Contents lists available at ScienceDirect journal homepage: www.elsevier.com/locate/wri Water Resources and Industry 2212-3717/$ - see front matter & 2013 The Authors. Published by Elsevier B.V. All rights reserved. http://dx.doi.org/10.1016/j.wri.2013.03.003 ☆ This is an open-access article distributed under the terms of the Creative Commons Attribution-NonCommercial-ShareAlike License, which permits non-commercial use, distribution, and reproduction in any medium, provided the original author and source are credited. n Corresponding author. Tel.: +55 11 4446 2863; fax: +55 11 4446 2774. E-mail addresses: [email protected], [email protected] (I.C.M. Francke). Water Resources and Industry 1–2 (2013) 37–48
Transcript
Contents lists available at ScienceDirect
Water Resources and Industry
Water Resources and Industry 1–2 (2013) 37–48
2212-37http://d
☆ ThisLicense,source a
n CorrE-m
journal homepage: www.elsevier.com/locate/wri
Carbon and water footprint analysis of a soap barproduced in Brazil by Natura Cosmetics$
I.C.M. Francke a,n, J.F.W. Castro b
a Natura Cosméticos, Rodovia Anhanguera s/n1 km 30,5, 07750-000 Cajamar, SP, Brazilb Geoklock Consultoria e Engenharia Ambiental, Av. Nações Unidas, 13.797 B.2 141 andar 04794-000,São Paulo, SP, Brazil
Water shortage represents one of the main threats to life on ourplanet. Indeed, over the last five years, society and corporatebusinesses alike have expressed increasing concern about the long-term sustainability of water resources while climate change andfreshwater scarcity became important issues for building aconsistent sustainability strategy. Here we investigated the relation-ships between the carbon and water footprints (CF and WF,respectively) of one product from Natura Cosméticos, a leadingcosmetic company in Latin America. Our main goal was todetermine how to deal synergistically with these environmentalpressure indicators in order to help building future strategies thatare more sustainable. Our analysis reveals that the total for the CF ofthe Macadamia soap bar (450 g) was 741 g CO2e, while the WF was1.581 l, 1.587 l, and 3.672 l for the green, blue, and gray components,respectively. We found that at the formulation step, the soap hasaccumulated 84% of the total CF and 99% of the green component ofWF while it accumulated only 6% of total blue WF component and10% of the gray WF component. Our results reveal that the majorvolumes accounting for blue and gray occur in the use and disposalphase of the product, when the soap is no longer under Natura'soutreach. The use and disposal of this product represent 70% of thetotal WF and only 16% of the CF. WE also found that carbonand water footprints were significantly high in the farming stage,mainly because of the use of fertilizers for palm cultivation. Thisstudy reveals some relevant aspects of the carbon and water
. Published by Elsevier B.V. All rights reserved.
the terms of the Creative Commons Attribution-NonCommercial-ShareAlikebution, and reproduction in any medium, provided the original author and
I.C.M. Francke, J.F.W. Castro / Water Resources and Industry 1–2 (2013) 37–4838
footprints and represents an important step for the integration ofdifferent environmental pressure indicators for developing novelsustainability strategies that can also be used to increase consumerperception of all environmental aspects of the company operations.& 2013 The Authors. Published by Elsevier B.V. All rights reserved.
1. Introduction
Water shortage represents one of the main threats to life on our planet. Over the last five years, societyand corporate businesses alike have expressed increasing concern about the long-term sustainability ofwater resources [1]. Thus, climate change and freshwater scarcity became important issues for buildinga consistent sustainability strategy. However, a conflict between other environmental impact indicatorsand freshwater use reduction efforts may occur, because of eventual trade-offs.
Carbon footprint (CF) is an indicator of anthropogenic greenhouse gas (GHG) emissions, which accordingto the Intergovernmental Panel for Climate Change (IPCC) are related to climate change [2]. The waterfootprint (WF) is a consumption indicator of freshwater use that quantifies direct and indirect volumes. It isa multidimensional indicator that shows consumption and pollutedwater volumes, specified geographicallyand temporally. The indicator has three components: the green, blue, and gray water footprints [3].
The carbon and water footprint concepts should complement each other, addressing climatechange and freshwater scarcity issues [4]. Indeed, a sustainable strategy has to contemplate bothfootprints in a way that facilitates impact assessment. However, the first perception when evaluatingCF and WF simultaneously is usually their inverse relationship. A clear example is energy and itsdifferent sources. For instance, hydroelectricity has a high WF and low CF, on the other hand, fossilfuels have lowWF and high CF. This is an obstacle to achieving a consistent sustainability strategy anddemands further analysis. The similarities and differences between the two footprints need to berecognized in order to design wise sustainability strategies.
Here we investigated the relationships between the carbon and water footprints of one productfrom Natura Cosméticos, a cosmetic company in Latin America. The concept of water footprint wasfully applied throughout the production line of the product here analyzed, the Todo Dia Macadamiasoap bar. In this study, we considered not only the supply chain and production processes associatedto this product, but also the consumer use and disposal phase. Our main goal was to determine how todeal synergistically with these environmental pressure indicators in order to help building futurestrategies that are more sustainable.
2. Methods and data
The Todo Dia Macadamia soap bar (here referred to simply as “soap”) is sold as a 5-unit package,including 450 g of soap and 26 g of cardboard packaging.
The main ingredient of the soap is a sodium salt derived from vegetable palm oil. This componentrepresents 90% of total soap noodle. The remaining 10% is composed of specific ingredients such aswater, starch, organic sugar, titanium dioxide, optical brightener, macadamia oil, and others.
2.1. Product life cycle
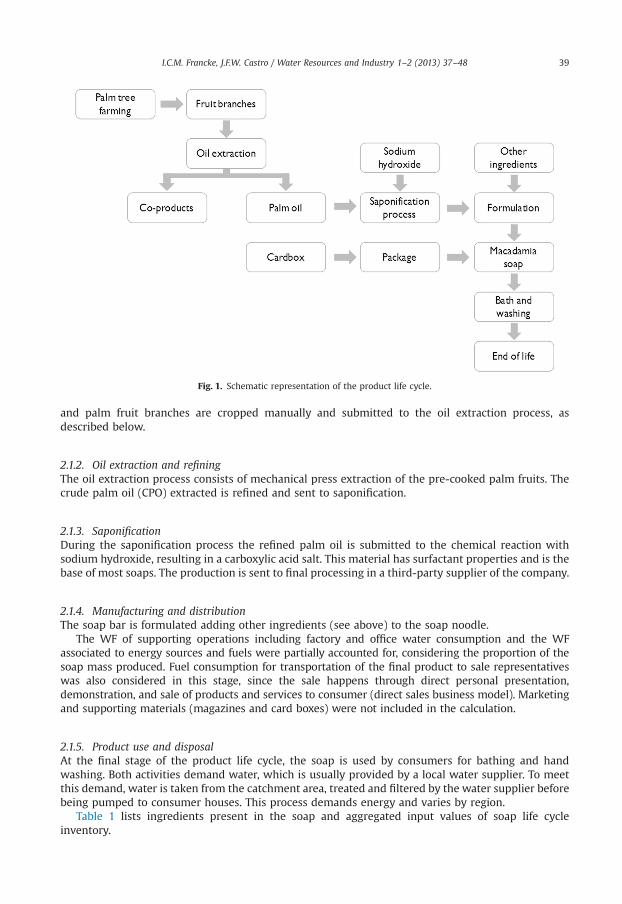
The quantification of carbon footprint (CF) and water footprint (WF) associated to the soap was basedon the product life cycle inventory (Fig. 1), considering one package of soap as a functional unit. Thestages evaluated in the study followed the product life cycle and are described below. In addition, thesame production system was used in the analysis of CF and WF.
2.1.1. FarmingThe vegetal palm oil used for soap production was obtained from a tropical plantation of palm trees(Elaeis guineensis) located in Pará state, Amazon basin, Brazil. Palms are fertilized but not irrigated,
Fig. 1. Schematic representation of the product life cycle.
I.C.M. Francke, J.F.W. Castro / Water Resources and Industry 1–2 (2013) 37–48 39
and palm fruit branches are cropped manually and submitted to the oil extraction process, asdescribed below.
2.1.2. Oil extraction and refiningThe oil extraction process consists of mechanical press extraction of the pre-cooked palm fruits. Thecrude palm oil (CPO) extracted is refined and sent to saponification.
2.1.3. SaponificationDuring the saponification process the refined palm oil is submitted to the chemical reaction withsodium hydroxide, resulting in a carboxylic acid salt. This material has surfactant properties and is thebase of most soaps. The production is sent to final processing in a third-party supplier of the company.
2.1.4. Manufacturing and distributionThe soap bar is formulated adding other ingredients (see above) to the soap noodle.
The WF of supporting operations including factory and office water consumption and the WFassociated to energy sources and fuels were partially accounted for, considering the proportion of thesoap mass produced. Fuel consumption for transportation of the final product to sale representativeswas also considered in this stage, since the sale happens through direct personal presentation,demonstration, and sale of products and services to consumer (direct sales business model). Marketingand supporting materials (magazines and card boxes) were not included in the calculation.
2.1.5. Product use and disposalAt the final stage of the product life cycle, the soap is used by consumers for bathing and handwashing. Both activities demand water, which is usually provided by a local water supplier. To meetthis demand, water is taken from the catchment area, treated and filtered by the water supplier beforebeing pumped to consumer houses. This process demands energy and varies by region.
Table 1 lists ingredients present in the soap and aggregated input values of soap life cycleinventory.
Table 1Aggregated input values of soap life cycle inventory.
MaterialsPalm fruit (brunches) 1.53 kgFertilizers (NPK) 0.04 kgPackage (cardboard) 0.03 kgSodium hydroxide 0.09 kgOther ingredients 0.04 kg
EnergyDiesel 0.080 lElectricity 0.357 kWhEthanol 0.013 lLiquefied petroleum gas 0.006 kgNatural Gas 0.004 m3
Heavy oil 0.005 lGasoline 0.004 lElectricity—use average BR 2103 kWhElectricity—disposal average BR 0.168 kWh
I.C.M. Francke, J.F.W. Castro / Water Resources and Industry 1–2 (2013) 37–4840
In our calculations, we considered the average energy demanded by water suppliers to providewater to consumers. In addition, the main water basin transfers required by the metropolitan areas ofRio de Janeiro, São Paulo, Salvador, and Fortaleza were considered [5].
The energy used to heat water was not considered because it is not a requirement to use the soap.The amounts of water evaporated during bathing and hand washing was not considered either.
After use, the soap and the water used in the shower is flushed away as domestic effluent.Depending on the region, the effluent can reach the water body directly without any treatment or gothrough an effluent treatment station (ETS) before returning to the water body. This study consideredthe average fraction of effluent treated, based on Brazilian sanitation data [6]. The oil component ofthe soap was defined as the main ingredient potentially associated with changes in the quality ofwater resources.
2.2. Carbon footprint
The carbon footprint method described by PAS 2050 was developed for assessing the GHG emissionsof goods and services throughout their life cycle and addresses a single indicator for climate change[2]. It quantifies the emissions from all stages in the product life cycle such as extraction, production,use, and disposal, and is defined as a cradle-to-grave approach [7].
CF is calculated based on the GHG emissions identified and quantified in the stages of the systemboundary. The most common and important GHGs are carbon dioxide (CO2), methane (CH4), andnitrous oxide (N2O). Refrigerant fluids and specific products such as sulfur hexafluoride are alsoconsidered GHGs.
The CF result is presented as mass of carbon dioxide equivalents (CO2e). All GHG emissionsassociated to the product were considered in terms of the global warming potential (GWP), whichconverts the amount of gases to an equivalent carbon dioxide warming potential, converting all theGHG emission to CO2e. The GWP of carbon dioxide, the main GHG, is 1; for methane it is 21, and fornitrous oxide it is 298. In this article, the results are presented as mass of carbon dioxide equivalentper unit of product.
To determine the CF of the soap here analyzed, we used the following sources of emission factorsto estimate the GHG emissions: guidelines for national greenhouse gas inventories [8]; energy contentof fuels from Brazilian national energy balance [9]; emissions of electricity generation [10]; and lifecycle database modeled for GHG emissions [11] (Table 2).
GHG emissions were calculated based on data collected from the direct suppliers (Table 1) andcomplemented with data obtained from life cycle database Ecoinvent when non available [11].
Table 2Energy emission factors.
Source kg CO2e/unit References
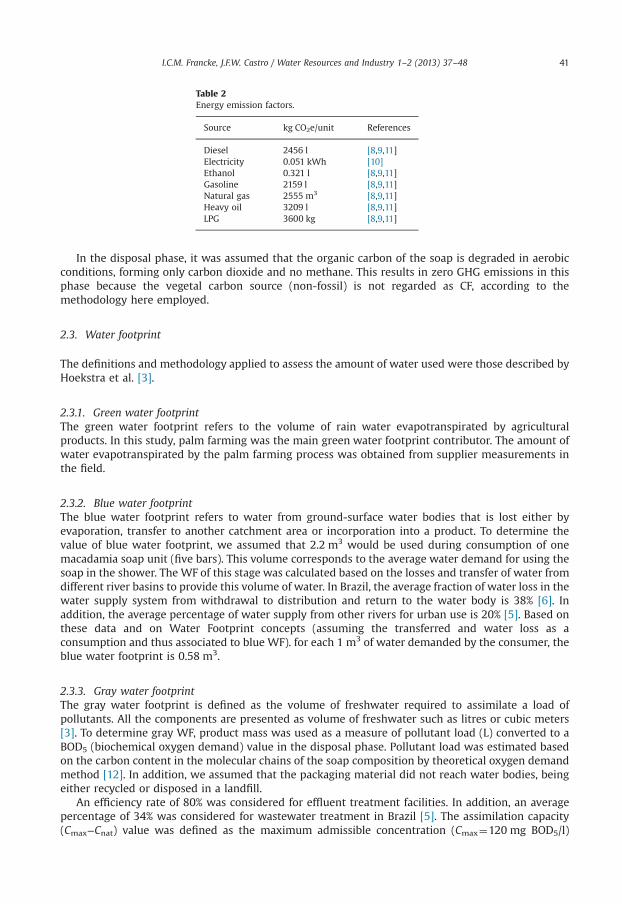
Diesel 2456 l [8,9,11]Electricity 0.051 kWh [10]Ethanol 0.321 l [8,9,11]Gasoline 2159 l [8,9,11]Natural gas 2555 m3 [8,9,11]Heavy oil 3209 l [8,9,11]LPG 3600 kg [8,9,11]
I.C.M. Francke, J.F.W. Castro / Water Resources and Industry 1–2 (2013) 37–48 41
In the disposal phase, it was assumed that the organic carbon of the soap is degraded in aerobicconditions, forming only carbon dioxide and no methane. This results in zero GHG emissions in thisphase because the vegetal carbon source (non-fossil) is not regarded as CF, according to themethodology here employed.
2.3. Water footprint
The definitions and methodology applied to assess the amount of water used were those described byHoekstra et al. [3].
2.3.1. Green water footprintThe green water footprint refers to the volume of rain water evapotranspirated by agriculturalproducts. In this study, palm farming was the main green water footprint contributor. The amount ofwater evapotranspirated by the palm farming process was obtained from supplier measurements inthe field.
2.3.2. Blue water footprintThe blue water footprint refers to water from ground-surface water bodies that is lost either byevaporation, transfer to another catchment area or incorporation into a product. To determine thevalue of blue water footprint, we assumed that 2.2 m3 would be used during consumption of onemacadamia soap unit (five bars). This volume corresponds to the average water demand for using thesoap in the shower. The WF of this stage was calculated based on the losses and transfer of water fromdifferent river basins to provide this volume of water. In Brazil, the average fraction of water loss in thewater supply system from withdrawal to distribution and return to the water body is 38% [6]. Inaddition, the average percentage of water supply from other rivers for urban use is 20% [5]. Based onthese data and on Water Footprint concepts (assuming the transferred and water loss as aconsumption and thus associated to blue WF). for each 1 m3 of water demanded by the consumer, theblue water footprint is 0.58 m3.
2.3.3. Gray water footprintThe gray water footprint is defined as the volume of freshwater required to assimilate a load ofpollutants. All the components are presented as volume of freshwater such as litres or cubic meters[3]. To determine gray WF, product mass was used as a measure of pollutant load (L) converted to aBOD5 (biochemical oxygen demand) value in the disposal phase. Pollutant load was estimated basedon the carbon content in the molecular chains of the soap composition by theoretical oxygen demandmethod [12]. In addition, we assumed that the packaging material did not reach water bodies, beingeither recycled or disposed in a landfill.
An efficiency rate of 80% was considered for effluent treatment facilities. In addition, an averagepercentage of 34% was considered for wastewater treatment in Brazil [5]. The assimilation capacity(Cmax−Cnat) value was defined as the maximum admissible concentration (Cmax¼120 mg BOD5/l)
I.C.M. Francke, J.F.W. Castro / Water Resources and Industry 1–2 (2013) 37–4842
minus the natural concentration of the water resource (Cnat), considered to be 5 mg BOD5/l, asdescribed in national legislation [13].
2.3.4. Other considerationsThe three WF components (green, blue, and gray) were obtained from the supply-chain waterfootprint developed by Natura in 2011, according to Zhang et al. [14]. The WF of the other ingredientswas calculated based on primary data obtained through a survey done with the main suppliers andcompleted by a supporting database [14].
Consumption of electricity and fuels was also considered in the study. Water footprint values forelectricity production in Brazil were obtained through a combination of data from the averagegeneration of main Brazilian electricity sources [15] and water footprint data described by Gerbens-Leenes et al. [16] and Mekonnen and Hoekstra [17,18]. Electricity from hydropower plants represents73% of the total power capacity in 2011 in the country. Evaporation of main reservoirs that supply theBrazilian grid described by Mekonnen and Hoekstra [18] were assumed as blue water of hydropowersector (140 l/kWh). The WF of fossil fuel sources (16% of capacity) were calculated based on datadescribed by Gerbens-Leenes et al. [16], resulting in an average consumption of 1.5 l/kWh forpetroleum-based source. Using the same method, the blue WF was obtained for coal (0.6 l/kWh), andnuclear (0.3 l/kWh) energy. Wind sources has no WF associated according to Gerbens-Leenes [16].Power plants generation using biomass were included in the calculations. For black liquor and generalbiomass source 220 l of green water were assumed as the average [16]. The WF of bagasse of sugarcane electricity plants was based on the global average WF described by Mekonnen and Hoekstra [17],resulting in 90, 37 and 8 l/kWh of green, blue and gray WF, respectively. The average WF valuecalculated for 1 kWh of national grid electricity was 7.8 l of green WF, 105 l of blue WF and 0.5 l ofgray WF.
As for the WF of fossil fuels and biofuels (including biodiesel from soybeans and ethanol fromsugar cane), the data were obtained from the combination of water footprint values described byGerbens-Leenes et al. [16], Mekonnen and Hoekstra [17], and information on heating value gatheredfrom the Brazilian National Energy Balance [9]. The primary energy average WF (excluding biomass)adopted from Gerbens-Leenes [16] was equally allocated as blue and gray WF. Table 3 presents theobtained WF values of fuels.
3. Results and discussion
According to the definition of Life Cycle Assessment (LCA), CF and WF are not environmental impactindicators but rather environmental pressure indicators [19,20] because they do not represent thechanges taking place in the environment. Nevertheless, both measures may be considered in thediscussion on sustainability and equitable human activity. In this study, we investigated therelationships between the carbon and water footprints of Natura's Todo Dia Macadamia soap bar todetermine how to deal synergistically with these environmental pressure indicators to gainknowledge that may allow us to move towards a more sustainable future.
Table 3Water footprint of fuels.
Fuel Unit Green WF (l/unit) Blue WF (l/unit) Gray WF (l/unit) References
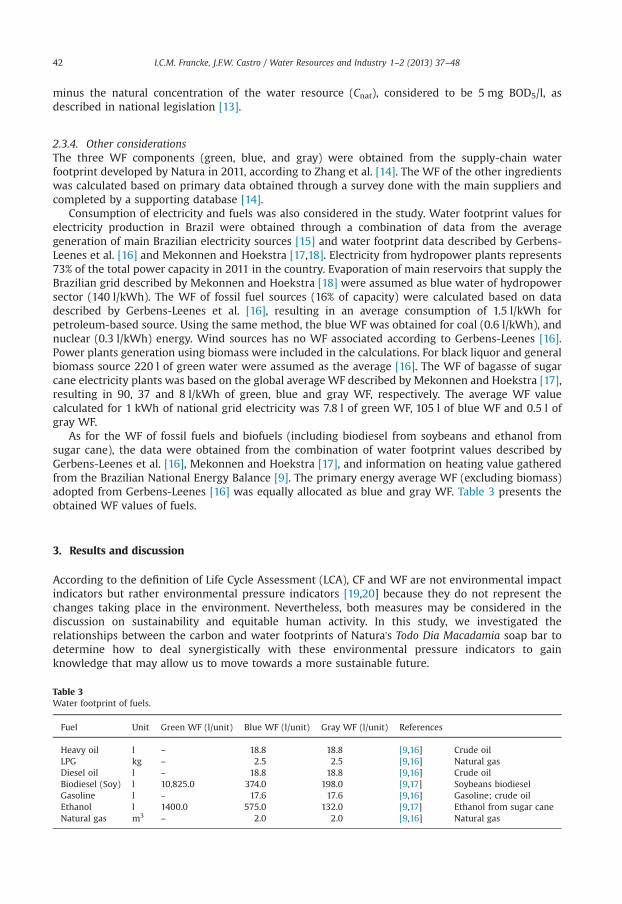
Heavy oil l – 18.8 18.8 [9,16] Crude oilLPG kg – 2.5 2.5 [9,16] Natural gasDiesel oil l – 18.8 18.8 [9,16] Crude oilBiodiesel (Soy) l 10,825.0 374.0 198.0 [9,17] Soybeans biodieselGasoline l – 17.6 17.6 [9,16] Gasoline; crude oilEthanol l 1400.0 575.0 132.0 [9,17] Ethanol from sugar caneNatural gas m3 – 2.0 2.0 [9,16] Natural gas
I.C.M. Francke, J.F.W. Castro / Water Resources and Industry 1–2 (2013) 37–48 43
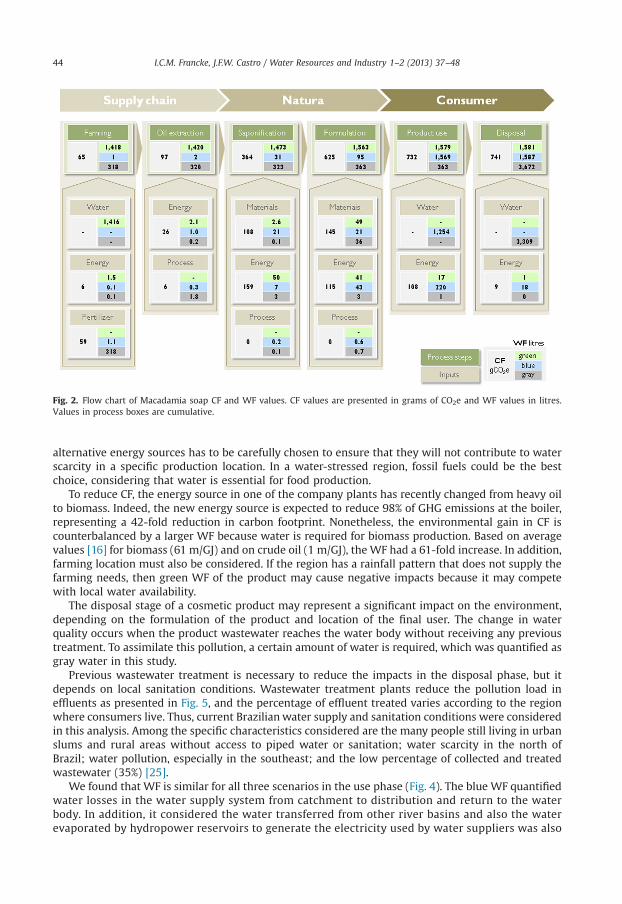
Our analysis reveals that the total for the CF of the Macadamia soap bar (450 g) was 741 g CO2e,while the WF was 1.581 l, 1.587 l, and 3.672 l for the green, blue, and gray components, respectively.
The main inputs and their contribution to CF and WF are indicated in the flow chart (Fig. 2). Eachprocess step is presented as the cumulative CF and WF values. At the formulation step, the soap hasaccumulated 84% of the total CF and 99% of the green component of WF. The soap accumulated only6% of total blue WF component and 10% of the gray WF component. The use and disposal of thisproduct represent 70% of the total WF and only 16% of the CF. Note that the major volumes accountingfor blue and gray occur in the use and disposal phase, when the product is no longer under Natura'soutreach. This information is crucial in order to invest in strategies and marketing approaches aimedat educating users on the most environmentally friendly disposal alternatives for this product.
The contribution to total CF and WF of each stage of the product life cycle is shown in Fig. 3. Greenwater footprint is mainly related to the evapotranspiration of palm farming, which occurs in theAmazonia forest, a region of intensive rainfall. Thus, this indicator has to be carefully analyzed, as thevalue does not necessarily represent an impact to the water availability if the region is taken inconsideration. In the disposal stage, the high values of gray WF might be explained by the fact that inBrazil a large fraction of the effluents is not treated by wastewater treatment facilities beforedischarge into the water bodies, thus increasing the impact to the environment.
Fig. 4 shows use and disposal scenarios for Macadamia soap in three Brazilian regions: averageBrazilian region (BR), São Paulo state (SP), and the Amazonas state (AM). The variations in valuesamong the analyzed regions are due to differences in energy consumption rates from water suppliersand wastewater treatment facilities in each county or region. Fig. 5 shows the average Brazilianscenario of 34% wastewater treatment in the disposal phase and compares it to a 100% wastewatertreatment scenario.
In this study, we found that carbon and water footprints were significantly high in the farmingstage, mainly because of the use of fertilizers for palm cultivation (Fig. 2). The CF of fertilizers is highdue to the high energy demand of the production process. Moreover. N2O fugitive emissions occur atthe palm plantation, contributing to GHG emissions. Additionally, fertilizers have high WF because ofwater pollution in the production process and leaching of nitrogen to water resources when applied incultivation [21].
Considering that fertilizers represent relevant water and carbon environmental pressure indicators,an important strategy for sustainability to be adopted should be reducing the use of fertilizers in thesupply chain. Any reduction in the use of fertilizers would be reflected in smaller carbon and waterfootprints. However, a lack of nutrients may demand more water consumption by the plant [22].
The organic farming approach, excluding the use of synthetic pesticides and chemical fertilizersand relying on techniques such as crop rotation, green manure, compost, and biological pest control,could be one path towards reducing the footprint associated to the product. In the case of the soaphere analyzed, the CF could be reduced by minimizing GHG emissions in the production process.As for the WF, the greater nitrogen retention in the soil through the use of natural fertilizers couldreduce the nitrogen leaching rate to water bodies [22,23].
Energy consumption is also an important topic regarding both carbon and water footprints. Fossilfuels are energy sources releasing great amounts of greenhouse gases, but that usually require smallwater volumes in their value chain. Conversely, some of the main renewable energy sources dependon intensive water consumption. In fact, biofuels and reservoir hydropower plants have a large WF.Biofuels such as ethanol from sugar cane or biodiesel from soy oil demand large amounts of watereither through evapotranspiration (green WF), irrigation of farm fields (blue WF), or use of chemicalpesticides and fertilizers (gray WF). As for reservoir hydropower plants, their large surface area leadsto large amounts of evaporated water, changing the local availability of water resources. Theexceptions to the high WF of renewable energy sources are wind, solar radiation, and run-off riverhydropower plants.
The replacement of fossil fuels with biofuels in Natura's Carbon Reduction Program [24] may haveled to lower CF but larger WF, considering the vegetal origin of biofuels. Thus, in this particular case aconflict between the two environmental indicators raises the question of which indicator deservespriority and there is no simple answer. Nowadays, replacing fossil fuels by renewable energy sourcesis considered a more sustainable choice [24]. But this directly leads to larger WF. As such, the WF of
Fig. 2. Flow chart of Macadamia soap CF and WF values. CF values are presented in grams of CO2e and WF values in litres.Values in process boxes are cumulative.
I.C.M. Francke, J.F.W. Castro / Water Resources and Industry 1–2 (2013) 37–4844
alternative energy sources has to be carefully chosen to ensure that they will not contribute to waterscarcity in a specific production location. In a water-stressed region, fossil fuels could be the bestchoice, considering that water is essential for food production.
To reduce CF, the energy source in one of the company plants has recently changed from heavy oilto biomass. Indeed, the new energy source is expected to reduce 98% of GHG emissions at the boiler,representing a 42-fold reduction in carbon footprint. Nonetheless, the environmental gain in CF iscounterbalanced by a larger WF because water is required for biomass production. Based on averagevalues [16] for biomass (61 m/GJ) and on crude oil (1 m/GJ), the WF had a 61-fold increase. In addition,farming location must also be considered. If the region has a rainfall pattern that does not supply thefarming needs, then green WF of the product may cause negative impacts because it may competewith local water availability.
The disposal stage of a cosmetic product may represent a significant impact on the environment,depending on the formulation of the product and location of the final user. The change in waterquality occurs when the product wastewater reaches the water body without receiving any previoustreatment. To assimilate this pollution, a certain amount of water is required, which was quantified asgray water in this study.
Previous wastewater treatment is necessary to reduce the impacts in the disposal phase, but itdepends on local sanitation conditions. Wastewater treatment plants reduce the pollution load ineffluents as presented in Fig. 5, and the percentage of effluent treated varies according to the regionwhere consumers live. Thus, current Brazilian water supply and sanitation conditions were consideredin this analysis. Among the specific characteristics considered are the many people still living in urbanslums and rural areas without access to piped water or sanitation; water scarcity in the north ofBrazil; water pollution, especially in the southeast; and the low percentage of collected and treatedwastewater (35%) [25].
We found that WF is similar for all three scenarios in the use phase (Fig. 4). The blue WF quantifiedwater losses in the water supply system from catchment to distribution and return to the waterbody. In addition, it considered the water transferred from other river basins and also the waterevaporated by hydropower reservoirs to generate the electricity used by water suppliers was also
Fig. 3. CF and WF of each stage in the Macadamia soap life cycle. CF has one indicator (GHG emissions), whereas WF has three(blue, gray and water). CF and WF are not comparable. (For interpretation of the references to color in this figure legend, thereader is referred to the web version of this article.)
Fig. 4. Disposal scenarios for Macadamia soap in three Brazilian regions. AM: Amazonia State, SP: São Paulo State, BR: Brazil.
Fig. 5. Wastewater treatment effect on water and carbon footprint of Macadamia soap.
I.C.M. Francke, J.F.W. Castro / Water Resources and Industry 1–2 (2013) 37–48 45
I.C.M. Francke, J.F.W. Castro / Water Resources and Industry 1–2 (2013) 37–4846
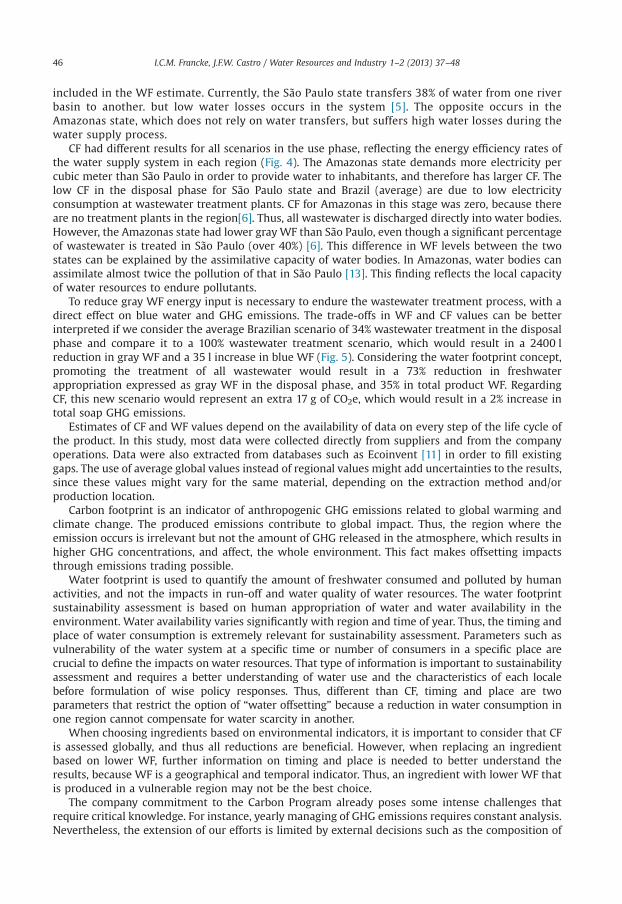
included in the WF estimate. Currently, the São Paulo state transfers 38% of water from one riverbasin to another. but low water losses occurs in the system [5]. The opposite occurs in theAmazonas state, which does not rely on water transfers, but suffers high water losses during thewater supply process.
CF had different results for all scenarios in the use phase, reflecting the energy efficiency rates ofthe water supply system in each region (Fig. 4). The Amazonas state demands more electricity percubic meter than São Paulo in order to provide water to inhabitants, and therefore has larger CF. Thelow CF in the disposal phase for São Paulo state and Brazil (average) are due to low electricityconsumption at wastewater treatment plants. CF for Amazonas in this stage was zero, because thereare no treatment plants in the region[6]. Thus, all wastewater is discharged directly into water bodies.However, the Amazonas state had lower grayWF than São Paulo, even though a significant percentageof wastewater is treated in São Paulo (over 40%) [6]. This difference in WF levels between the twostates can be explained by the assimilative capacity of water bodies. In Amazonas, water bodies canassimilate almost twice the pollution of that in São Paulo [13]. This finding reflects the local capacityof water resources to endure pollutants.
To reduce gray WF energy input is necessary to endure the wastewater treatment process, with adirect effect on blue water and GHG emissions. The trade-offs in WF and CF values can be betterinterpreted if we consider the average Brazilian scenario of 34% wastewater treatment in the disposalphase and compare it to a 100% wastewater treatment scenario, which would result in a 2400 lreduction in gray WF and a 35 l increase in blue WF (Fig. 5). Considering the water footprint concept,promoting the treatment of all wastewater would result in a 73% reduction in freshwaterappropriation expressed as gray WF in the disposal phase, and 35% in total product WF. RegardingCF, this new scenario would represent an extra 17 g of CO2e, which would result in a 2% increase intotal soap GHG emissions.
Estimates of CF and WF values depend on the availability of data on every step of the life cycle ofthe product. In this study, most data were collected directly from suppliers and from the companyoperations. Data were also extracted from databases such as Ecoinvent [11] in order to fill existinggaps. The use of average global values instead of regional values might add uncertainties to the results,since these values might vary for the same material, depending on the extraction method and/orproduction location.
Carbon footprint is an indicator of anthropogenic GHG emissions related to global warming andclimate change. The produced emissions contribute to global impact. Thus, the region where theemission occurs is irrelevant but not the amount of GHG released in the atmosphere, which results inhigher GHG concentrations, and affect, the whole environment. This fact makes offsetting impactsthrough emissions trading possible.
Water footprint is used to quantify the amount of freshwater consumed and polluted by humanactivities, and not the impacts in run-off and water quality of water resources. The water footprintsustainability assessment is based on human appropriation of water and water availability in theenvironment. Water availability varies significantly with region and time of year. Thus, the timing andplace of water consumption is extremely relevant for sustainability assessment. Parameters such asvulnerability of the water system at a specific time or number of consumers in a specific place arecrucial to define the impacts on water resources. That type of information is important to sustainabilityassessment and requires a better understanding of water use and the characteristics of each localebefore formulation of wise policy responses. Thus, different than CF, timing and place are twoparameters that restrict the option of “water offsetting” because a reduction in water consumption inone region cannot compensate for water scarcity in another.
When choosing ingredients based on environmental indicators, it is important to consider that CFis assessed globally, and thus all reductions are beneficial. However, when replacing an ingredientbased on lower WF, further information on timing and place is needed to better understand theresults, because WF is a geographical and temporal indicator. Thus, an ingredient with lower WF thatis produced in a vulnerable region may not be the best choice.
The company commitment to the Carbon Program already poses some intense challenges thatrequire critical knowledge. For instance, yearly managing of GHG emissions requires constant analysis.Nevertheless, the extension of our efforts is limited by external decisions such as the composition of
I.C.M. Francke, J.F.W. Castro / Water Resources and Industry 1–2 (2013) 37–48 47
the Brazilian energy matrix, defined by governmental policies, that considers not only carbon, but alsowater and solid waste management strategies.
This case study reveals some relevant aspects of the carbon and water footprints and represents animportant step for the integration of different environmental pressure indicators for developing novelsustainability strategies that can also be used to increase consumer perception of all environmentalaspects of the company operations.
Sustainability strategies aiming to achieve higher efficiency rates are a wise choice, as they reducethe pressure on natural resources. This reduction can be promoted in all production stages by usingtechnologies that demand less energy, reducing material losses in manufacturing, or selectingenvironmentally efficient materials—with smaller footprints. Further studies should focus onintegrating all environmental aspects in order to lead to a more sustainable path.
4. Conclusions
The carbon and water footprint assessment of the Macadamia soap led to valuable knowledge andinternal reflections regarding the improvement of the company sustainability strategy for environ-mental impact management. Despite the fact that the two pressure indicators seem to be divergent, CFand WF actually complement each other, promoting awareness of climate change and freshwaterscarcity issues.
Also, the ongoing Carbon Reduction Program is compatible with a freshwater corporate strategy,according to the water footprint methodology applied in this study. The example of heavy oilreplacement with biomass — a renewable energy source — is a good practice, even though total WFincreased significantly. The higher water demand does not result in negative impacts, because rainfallis abundant in the region the company plant is located. Thus, the use of renewable energy sourcessuch as biofuels can represent a sustainable choice when water demand does not contribute to waterscarcity. This will depend on what region water is being extracted from. Moreover, the CF and WF ofenergy sources may promote the use of other sources such as wind power with lower carbon andwater footprint.
Furthermore, the results associated to the use of fertilizers at the farming stage bring an interestingoverview of how Carbon and Water pressure indicators may complement each other and support theestablishment of a more sustainable supply chain for the industry. The use of fertilizers demands highenergy consumption in its production process, increasing the CF. In the other hand, a significantnumber appears also in the WF due to water pollution and leaching of nitrogen into water resourceswhen applied to the soil. Thus, reduction in the use of fertilizers or alternative techniques, such asorganic farming, would lead to smaller carbon and water footprints..
In the scenario evaluated, another interesting aspect is found in the use stage. The soap requireswater to be assimilated after used by a consumer. Consequently, a large grey WF is generated in thedisposal phase that is no longer under company's outreach. Even though ecodesign practices mayincrease a product's performance, the real issue still remains at large, since sanitation services must beprovided by the government. Having access to safe drinking water and sanitation is central to living alife in dignity and upholding human rights, as declared by the United Nations (UN, 2010 [26]).
The main challenge ahead is to develop tools that enable the management of two differentpressure indicators with the complexity of carbon and water, providing relevant information in realtime and directing the corporate strategy towards a more sustainable business.
References
[1] Natura Annual Report, ⟨http://natura.infoinvest.com.br/enu/s-15-enu.html⟩ (retrieved on April 13th 2012), 2011.[2] IPCC—Intergovernmental Panel on Climate Change, Climate Change 2007: Synthesis Report, Spain, 2007.[3] A.Y. Hoekstra, A.K. Chapagain, M.M. Aldaya, M.M. Mekonnen, The Water Footprint Assessment Manual: Setting the Global
Standard, Earthscan, London, UK, 2011.[4] E.A. Erchin, A.Y. Hoekstra, Carbon and Water Footprints—Concepts, Methodologies and Policy Responses, Side Publications
I.C.M. Francke, J.F.W. Castro / Water Resources and Industry 1–2 (2013) 37–4848
[5] ANA, Agência Nacional de Águas. Atlas Brasil: Abastecimento Urbano de Água - Panorama Nacional Volume 1”, Brasília/DF.Ministério do Meio Ambiente, 2010.
[6] Ministério das Cidades, Diagnóstico dos Serviços de Água e Esgoto – 2009,. ⟨http://www.snis.gov.br/PaginaCarrega.php?EWRErterterTERTer=89⟩ (retrieved on January 09th 2012. 09:00:00), 2009.
[7] Publicly Available Specification—PAS 2050:2011, Specification for the assessment of the life cycle greenhouse gas emissionsof goods and services, BSI, 2011.
[8] IPCC—Intergovernmental Panel on Climate Change, IPCC Guidelines for National Greenhouse Gas Inventories, Japan, 2006.[9] EPE Empresa de Pesquisa Energética, National Energy Balance 2011: Base year 2010.[10] Brazilian Science and Technology Ministry (MCT), ⟨http://www.mct.gov.br/⟩.[11] Ecoinvent 2.1 database—Life cycle inventories, Ecoinvent v2.1 database and modeled via software SimaPros 7.3 for IPCC
2007 single issue impact method, ⟨http://www.ecoinvent.ch/⟩.[12] Von Sperling, Marcos, Introdução à qualidade das águas e ao tratamento de esgotos, Princípios do tratamento biológico de
água residuárias. 31 edição, vol. 1, Departamento de Engenharia Sanitária e Ambiental; Universidade Federal de MinasGerais, Belo Horizonte, ISBN 85-7041-114-6, 2005.
[13] CONAMA, Resolução no 430. de 13 de maio de 2011—Ministério do Meio Ambiente, Conselho Nacional do Meio Ambiente,2011.
[14] G.P. Zhang, A.Y. Hoekstra, D. Tickner (Eds.), UNESCO-IHE, Delft, the Netherlands, 2012. Plant under Pressure Conference,London, 26 March 2012.
[15] ANEEL, Agência Nacional de Energia Elétrica, “Banco de Informações de Geração”, ⟨www.aneel.gov.br⟩ (retrieved on July4th 2011), 2011.
[16] P.W. Gerbens-Leenes, A.Y. Hoekstra, Th.H. Van Der Meer, Water footprint of bio-energy and other primary energy carriers,UNESCO-IHE, Delft, The Netherlands, 2008 Value of Water Research Report Series no. 29.
[17] M.M. Mekonnen, A.Y. Hoekstra, The water footprint of electricity from hydropower, UNESCO-IHE, Delft, The Netherlands,2011 Value of Water Research Report Series no. 51.
[18] M.M. Mekonnen, A.Y. Hoekstra, The blue water footprint of electricity from hydropower, Hydrology and Earth SystemSciences 16 (1) (2012) 179–187.
[19] J. Rotmans, H.J.M. De Vries (Eds.), Perspectives on Global Change: The TARGETS Approach, Cambridge University Press,Cambridge, UK, 1997.
[20] UNEP (United Nations Environment Programme), Global Environmental Outlook 5: Environment for the Future We Want,UNEP, Nairobi, 2012.
[21] A.K. Chapagain, A.Y. Hoekstra, H.H.G. Savenije, R. Gautam, The water footprint of cotton consumption: an assessment of theimpact of worldwide consumption of cotton products on the water resources in the cotton producing countries, EcologicalEconomics 60 (1) (2006) 186–203.
[22] Ana Primavesi, Manejo ecológico do solo: a agricultura em regiões tropicais, Nobel, São Paulo, 1997.[23] T.N. Ferreira (Coord.), R.A. Schwarz (Coord.), E.V., Streck (Coord.), Solos: manejo integrado e ecológico - elementos básicos.
EMATER/RS, Porto Alegre, 2000.[24] Natura Cosméticos. Programa Carbono Neutro (accessed October 2.10.2012).[25] ANA, Agência Nacional de Águas, Conjuntura dos recursos hídricos no Brasil—Informe 2011”, Brasília/DF, Ministério do
Meio Ambiente, 2011.[26] United Nations, (UN). “Resolution adopted by the General Assembly” Resolution A/RES/64/292, in: Proceedings of the