U.S. Department of the Interior U.S. Geological Survey Water Resources Data Florida Water Year 2001 Volume 2A. South Florida Surface Water By C. Price, J. Woolverton, K. Overton Water-Data Report FL-01-2A Prepared in cooperation with the State of Florida and with other agencies
Transcript
U.S. Department of the InteriorU.S. Geological Survey
Water Resources DataFloridaWater Year 2001Volume 2A. South Florida Surface Water
By C. Price, J. Woolverton, K. Overton
Water-Data Report FL-01-2A
Prepared in cooperation with the State of Florida and with other agencies
U.S. DEPARTMENT OF THE INTERIOR
GALE NORTON, Secretary
U.S. GEOLOGICAL SURVEY
CHARLES G. GROAT, Director
Prepared in cooperation with the
State of Florida
and other agencies as listed
under cooperation
For additional information write to:
Subdistrict ChiefWater Resources DivisionU.S. Geological Survey9100 N.W. 36th Street
Suite 107Miami, Florida 33178
Telephone: (305) 717-5800
2002
WATER RESOURCES DATA - FLORIDA, 2001
VOLUME 2A: SOUTH FLORIDA
III
PREFACE
This volume of the annual hydrologic data report of Florida is one of a series of annual reportsthat document hydrologic data gathered from the U.S. Geological Survey's surface- and ground-waterdata-collection networks in each State, Puerto Rico, and the Trust Territories. These records ofstreamflow, ground-water levels, and quality of water provide the hydrologic information needed bystate, local, and federal agencies, and the private sector for developing and managing ourNation's land and water resources. Hydrologic data for Florida are contained in four volumes.Figure 1 shows the area covered by volume 2A.
This report is the culmination of a concerted effort by dedicated personnel of the U.S. GeologicalSurvey who collected, compiled, analyzed, verified, and organized the data. This report wasprepared for publication by the Hydrologic Records Section under the supervision of M. H. Murray,J. Woolverton, E. C. Price, and S. Prinos. Lillian R. Feltman and Eleanor Seymore were the primarypersons responsible for the compilation of the data report. In addition to the authors, who hadprimary responsibility for assuring that the information contained herein is accurate, complete,and adheres to Geological Survey policy and established guidelines, the following individualscontributed significantly to the collection, processing, and tabulation of the data
Miami Subdistrict Office
This report was prepared in cooperation with the State of Florida and with other agencies under thegeneral supervision of Maria M. Irizarry, Subsdistrict Chief, and Carl Goodwin, District Chief,Florida.
Hydrologic data for south Florida are contained in two volumes
Volume 2A: Surface Water
Volume 2B: Ground Water
Volume 1. Northeast Florida
Volume 2. South Florida
Volume 3. Southwest Florida
Volume 4. Northwest Florida
M. Byrne P. Mackay R. Rodriguez
E. Debiak L. Massey G.C. Romero
M.J. Diamond E. McGuire E. Seymore
L.R. Feltman D. Milewski L. Soderqvist
E. Figueroa-Gibson E. Mangual R. Solis
S. Hammermeister M.H. Murray M. Stewart
N. Keppie M.A. Oliver R. Verdi
D. Kluesner K.B. Overton R. Wali
E. Kozma J. Paulat J. Woolverton
G. Krupp S. Ploos
R.B. Irvin G. Poole
C. Lietz C. Price
J. Lima S. Prinos
WATER RESOURCES DATA - FLORIDA, 2001
VOLUME 2A: SOUTH FLORIDA
IV
REPORT DOCUMENTATION PAGE Form ApprovedOMB No. 0704-0188
NSN 7540-01-280-5500
1. AGENCY USE ONLY (Leave blank)
Public reporting burden for this collection of information is estimated to average 1 hour per response, including the time for reviewing instructions, searching existing data sources, gathering and maintaining the data needed, and completing and reviewing the collection of information. Send comments regarding this burden estimate or any other aspect of this collection of information, including suggestions for reducing this burden, to Washington Headquarters
AJuly 24, 20022. REPORT DATE
nnual Report3. REPORT TYPE AND DATES COVERED
4. TITLE AND SUBTITLE
Water Resources Data Florida, Water Year 2001Volume 2A: South Florida - Surface Water
5. FUNDING NUMBERS
8. PERFORMING ORGANIZATION
C. Price, J. Woolverton, K. Overton6. AUTHOR(S)
7. PERFORMING ORGANIZATION NAME(S) AND ADDRESS(ES)
U.S. Geological SurveyWater Resources Division9100 N.W. 36th Street, Suite #107Miami, Florida 33178
REPORT NUMBER
USGS-WDR-FL-01-2A
10.AGENCY REPORT NUMBERSPONSORING / MONITORING
9. SPONSORING / MONITORING AGENCY NAME(S) AND ADDRESS(ES)
U.S. Geological SurveyWater Resources Division227 North Bronough Street, Suite #3015Tallahassee, Florida 32301
USGS-WDR-FL-01-2A
11. SUPPLEMENTARY NOTES
Prepared in cooperation with the State of Florida and other agencies.
12a. DISTRIBUTION / AVAILABILITY STATEMENT
No restrictions on distribution: This report may be purchased from: NationalTechnical Information Center, Springfield, VA 22161
12b. DISTRIBUTION CODE
13. ABSTRACT (Maximum 200 words)
Water resources data for 2001 water year in Florida consists of continuous or daily discharge for 404 streams, peri-odic discharge for 15 streams, continuous or daily stage for 154 streams, periodic stage for 12 stream, peak dis-charge for 37 streams, and peak stage for 37 streams, continuous or daily elevations for 12 lakes, periodic elevationsfor 50 lakes, continuous ground-water levels for 426 wells, periodic ground-water levels for 1251 wells, quality of wa-ter data for 112 surface-water sites, and 235 wells.
The data for South Florida included continuous or daily discharge for 89 streams, continuous or daily stage for 64streams, no peak stage discharge for streams, 1 continuous elevation for lake, continuous ground-water levels for244 wells, periodic ground-water levels for 255 wells, water quality for 32 surface-water sites, and 166 wells.
The data represent the National Water Data System records collected by the U.S. Geological Survey and cooperationwith local, state, and federal agencies in Florida.
14. SUBJECT TERMS 15. NUMBER OF PAGES
6
*Florida, *Hydrologic data, *Surface Water, *Ground Water, *Water Quality, Flow rate,Gaging stations, Lakes, Reservoirs, Chemical analyses, Sediments, Water temperatures,Sampling sites, Water levels, Water analyses, Elevations, Water wells. 1
Data Presentation .......................................................... 27
Records of Bulk Electrical Conductivity ........................................ 28
Data Collection and Computation ............................................ 28
Accuracy of Bulk Conductivity .............................................. 29
Data Presentation .......................................................... 29
Records of Ground-Water Quality ................................................ 30
Data Collection and Computation ............................................ 30
Data Presentation .......................................................... 30
Access to USGS Water Data.............................................................. 30
WATER RESOURCES DATA - FLORIDA, 2001
VOLUME 2A: SOUTH FLORIDA
VIII
CONTENTS (continued)
Definition of Terms.................................................................... 31Techniques of Water-Resources Investigations........................................... 43Selected References.................................................................... 48Stage, Discharge, and Water Quality of Streams ...................................................... 49
Surface Water Quality Records, Field Measurements .................................................. 265
National Water-Quality Assessment (NAWQA) Data ..................................................... 269
Index to
Introductory text ......................................................................... 283
Figure 1. Geographic area covered by this report .................................................... V
Figure 2. South Florida Areas of Hydrologic Significance ............................................ 3
Figure 3. System for numbering wells and miscellaneous sites ....................................... 14
Figure 4. Location of gaging stations in the portion of the Everglades and the southeastern coastal area north of latitude 26 degrees ....................................................... 50
Figure 5. Typical flow patterns at Lake Okeechobee control structures .............................. 60
Figure 6. South Florida Water Management District, Structure 5 Complex ............................. 67
Figure 7. Location of gaging stations in the portion of the Everglades and southeastern coastal area south of latitude 26 degrees; Florida Bay and the Florida Keys .................... 147
Figure 9. Location of gaging stations in the Big Cypress Swamp and southwestern coastal area; the Caloosahatchee River; and Charlotte Harbor and the coastal area .............. 217
WATER RESOURCES DATA - FLORIDA, 2001
VOLUME 2A: SOUTH FLORIDA
X
This page left intentionally blank
WATER RESOURCES DATA - FLORIDA, 2001
VOLUME 2A: SOUTH FLORIDA
XI
STREAM AND LAKE GAGING STATIONS, IN DOWNSTREAM ORDER, FOR WHICH RECORDS ARE PUBLISHED IN THIS VOLUME
The following list shows the surface water sites where streamflow, stage, lake elevation, or daily waterquality data are collected. [Letters after station names designate type of data collected: (d) discharge,(e) elevation, gage heights, (q) water quality] STATION PAGE NUMBER
EVERGLADES AND SOUTHEASTERN COASTAL AREA St Lucie River:South Fork St Lucie RiverSt Lucie Canal at Lake Okeechobee (S-308), FL (d,g) . . . . . . . . . . . . . . . 02276870 . . 51St Lucie Canal at Lock, near Stuart, FL (d,g) . . . . . . . . . . . . . . . . . . 02277000 . . 53Kitchings Creek near Hobe Sound, FL (d,g) . . . . . . . . . . . . . . . .270022080094600 . . 56Loxahatchee River near Jupiter, FL (d,g) . . . . . . . . . . . . . . . . . . . . 02277600 . . 58West Palm Beach Canal at S352, at Canal Point, FL (d,g) . . . . . . . . . . . . 02278000 . . 61Levee 8 Canal near Canal Point, FL (d,g) . . . . . . . . . . . . . . . .265501080364900 . . 64West Palm Beach Canal above S-5A, near Loxahatchee, FL (d) . . . . . . . . . . 02278450 . . 66Diversions to Conservation Area No 1 at S-5A and S-5A-S, nr Loxahatchee, FL (d,g) 02278500 . . 68Conservation Area No 1 below S-5 Complex, near Loxahatchee, FL (g) . . . . . . . 02278501 . . 70Levee 8 Canal at West Palm Beach Canal, near Loxahatchee, FL (d,g) . . . . . . 02278550 . . 71West Palm Beach Canal below S-5A-E near Loxahatchee, FL (d,g) . . . . . . . . . 02278600 . . 73West Palm Beach Canal at West Palm Beach, FL (d,g) . . . . . . . . . . . . . . . 02279000 . . 75Industrial Canal at Clewiston, FL (d,g) . . . . . . . . . . . . . . . . .264514080550700 . . 78Hillsboro Canal below S-351, near South Bay, FL (d,g) . . . . . . . . . . . . . 02280500 . . 80Hillsboro Canal at S-6 near Shawano, FL (d,g) . . . . . . . . . . . . . . . . . 02281200 . . 82Hillsboro Canal near Margate, FL (d,g) . . . . . . . . . . . . . . . . . . . . 02281400 . . 84Middle River Canal at S-36, near Fort Lauderdale, FL (d,g) . . . . . . . . . . 02282700 . . 86Plantation Road Canal at S-33, near Fort Lauderdale, FL (d,g) . . . . . . . . . 02283200 . . 89North New River Canal at S-2 and S-351, near South Bay, FL (d,g) . . . . . . . 02283498 . . 92North New River Canal below S-2 and S-351, near South Bay, FL (d,g) . . . . . . 02283500 . . 95Site 7 in Conservation Area No. 1 near Shawano, FL (g) . . . . . . . . . .263180080205001 . . 97Site 8T in Conservation Area No. 1 near Boynton Beach, FL (g) . . . . . . .263050080145001 . . 98Site 8C near L-40 in Conservation Area No. 1 near Boynton Beach, FL (g) . .263000080120001 . . 99Site 9 in Conservation Area No. 1 near Boynton Beach, FL (g) . . . . . . .262750080175001 . .100E-4 Canal at Clint-Moore Road, Boca Raton, FL (g) . . . . . . . . . . . .262358080055700 . .101E-3 Canal at NW 51st Street, Boca Raton, FL (g) . . . . . . . . . . . . .262337080074800 . .102Hillsboro Canal at S-10-D near Deerfield Beach, FL (g) . . . . . . . . . .262300080220001 . .103Hillsboro Canal at S-10-C near Deerfield Beach, FL (g) . . . . . . . . . .262200080210001 . .105Hillsboro Canal at S-10-A near Deerfield Beach, FL (g) . . . . . . . . . .262100080190001 . .107S-150 at Terrytown, FL (d,g) . . . . . . . . . . . . . . . . . . . . . . .262007080321500 . .109North New River Canal at S-7 at Terrytown, FL (d,g) . . . . . . . . . . . . . . . 02284300 . .111E-3 Canal, SW 18th Street, Boca Raton, FL (g) . . . . . . . . . . . . . .261952080074500 . .113Site 19 in Conservation Area 2A near Coral Springs, FL (g) . . . . . . . .261710080190001 . .114North New River Canal at S-11-C near Andytown, FL (g) . . . . . . . . . . .261300080280001 . .115Site 17 near L-38, Conservation Area 2A near Coral Springs, FL (g) . . . .262240080258001 . .117North New River Canal at S-11-B near Andytown, FL (g) . . . . . . . . . . .261200080275001 . .118Site 63 in Conservation Area No. 3A near Andytown, FL . . . . . . . . . . .261117080315201 . .120North New River Canal at S-11-A near Andytown, FL (g) . . . . . . . . . . .261150080270001 . .121Site 62 in Conservation Area 3A near Andytown, FL (d,g) . . . . . . . . . .261023080443001 . .123Site 99 near L-35A in Conservation Area 2B near Sunrise, FL (g) . . . . . 260810080222001 . .124South New River Canal at S-13, near Davie, FL (d,g) . . . . . . . . . . . . . 02286100 . .125Site 76 in Conservation Area 3B near Andytown, FL (g) . . . . . . . . . . .260037080303401 . .128Site 64 in Conservation Area 3A near Coopertown, FL (g) . . . . . . . . . .255828080401301 . .129
WATER RESOURCES DATA - FLORIDA, 2001 XII
VOLUME 2A: SOUTH FLORIDA
STREAM AND LAKE GAGING STATIONS, IN DOWNSTREAM ORDER, FOR WHICH RECORDS ARE PUBLISHED IN THIS VOLUME continued
STATION PAGE NUMBER
EVERGLADES AND SOUTHEASTERN COASTAL AREA (continued) Site 69 in Conservation Area 3B near Coopertown, FL (g) . . . . . . . . . .255300080370001 . .130
Site 65 in Conservation Area 3A near Coopertown, FL (g) . . . . . . . . . .254848080432001 . .132Site 71 in Conservation Area 3B near Coopertown, FL (g) . . . . . . . . . .255250080335001 . .133Snake Creek Canal at NW 67th Avenue, near Hialeah, FL (d,g,). . . . . . . . . . . 02286200 . .134Snapper Creek Canal Extension at NW 74th Street, near Hialeah, FL (g) . .255026080231300 . .136Miami Canal at S-354 and S-3, at Lake Harbor, FL (d,g) . . . . . . . . . . . . . 02286400 . .137Miami Canal at S-8 near Lake Harbor, FL (d,g) . . . . . . . . . . . . . . . . . . 02286700 . .139Miami Canal East of Levee 30, near Miami, FL (d,g) . . . . . . . . . . . . . . . 02287395 . .141N.W. Wellfield Canal near Dade Broward Levee near Pennsuco, FL (d,g). . . . . . . 02287497 . .143Miami Canal at NW 36th Street, Miami, FL (d,g) . . . . . . . . . . . . . . . . . 02288600 . .145
BIG CYPRESS SWAMP AND SOUTHWESTERN COASTAL AREATamiami Canal Outlets, Monroe to Carnestown, FL (d,g) . . . . . . . . . . . . . . 02288800 . .149Tamiami Canal Outlets, 40-Mile Bend to Monroe, FL (d,g) . . . . . . . . . . . . . 02288900 . .151
EVERGLADES AND SOUTHEASTERN COASTAL AREAShark River Slough No 1 in Conservation Area 3B near Coopertown, FL (g) . .254754080344300 . .153L-28 Interceptor Canal below S-190 near Clewiston, FL (d,g) . . . . . . .261533080571600 . .154L-28 Canal above S-140 near Clewiston, FL (d,g) . . . . . . . . . . . . .261543080495000 . .156Drainage Canal below G-136 near Clewiston, FL (d,g) . . . . . . . . . . . . . . . 02289027 . .158Levee 3 Canal below G-155 near Clewiston, FL (d,g). . . . . . . . . . . . . . . . 02289031 . .160Levee 4 Canal below G-88 near Clewiston, FL (d,g) . . . . . . . . . . . . . . . . 02289032 . .162Tamiami Canal below S-12-A, near Miami, FL (d,g) . . . . . . . . . . . . .254543080491101 . .164Tamiami Canal below S-12-B, near Miami, FL (d,g) . . . . . . . . . . . . . . . . 02289019 . .167Tamiami Canal Outlets, Levee 67A to 40 Mile Bend, near Miami, FL (d,g) . . . . . 02289040 . .170Tamiami Canal below S-12-C, near Miami, FL (d,g) . . . . . . . . . . . . . . . . 02289041 . .172Tamiami Canal below S-12-D, near Miami, FL (d,g) . . . . . . . . . . . . .254543080405401 . .174Tamiami Canal at S-333, near Miami, FL (d,g) . . . . . . . . . . . . . . . . . . 02289050 . .177Tamiami Canal at S-355A, near Miami, FL (g) . . . . . . . . . . . . . . . 2545400880361500 . .180Tamiami Canal Outlets, Levee 30 to L-67A, near Miami, FL (d,g) . . . . . . . . . 02289060 . .182Tamiami Canal at S-355B, near Miami, FL (g) . . . . . . . . . . . . . . . .254540080325700 . .184Tamiami Canal near Coral Gables, FL (d,g) . . . . . . . . . . . . . . . . . . . . 02289500 . .186Northeast Shark River Slough No 2 near Coopertown, FL (g) . . . . . . . . .254315080331500 . .188Northeast Shark River Slough No 1 near Coopertown, FL (g) . . . . . . . . .254130080380500 . .189L-67 Extended Canal West, near Florida City, FL (g) . . . . . . . . . . . .254100080402400 . .190Northeast Shark River Slough East of L-67 Ext. nr Richmond Heights, FL (g) 254100080402200 . .191Northeast Shark River Slough No 4, North of Grossman, FL (g). . . . . . . .253828080391100 . .192Northeast Shark River Slough No 5, South of Grossman, FL (g) . . . . . . .253753080393600 . .193Black Creek Canal at S-21, near Goulds, FL (d,g) . . . . . . . . . . . . . . . . 02290710 . .194Levee 31 North Extension at 1 mile near West Miami, FL (d,g). . . . . . . . . . .022907647 . .198Levee 31 North Extension at 3 mile near West Miami, FL (d,g). . . . . . . . . . . 02290765 . .200Levee 31 North Extension at 4 mile near West Miami, FL (d,g). . . . . . . . . . . 02290766 . .202Levee 31 North Extension at 5 mile near West Miami, FL (d,g). . . . . . . . . . . 02290767 . .204Levee 31 North Extension at 7 mile near West Miami, FL (d,g). . . . . . . . . . . 02290768 . .206Canal 111 at S-18-C, near Florida City, FL (d,g) . . . . . . . . . . . . . . . . 02290769 . .208Everglades 5A in C-111 Basin near Homestead, FL (g) . . . . . . . . . . . .251716080342100 . .210Everglades 5B in C-111 Basin near Homestead, FL (g) . . . . . . . . . . . .251724080341400 . .211Everglades 2B in C-111 Basin near Homestead, FL (g) . . . . . . . . . . . .251855080283400 . .212Everglades 2A in C-111 Basin near Homestead, FL (g) . . . . . . . . . . . .251906080283400 . .213Everglades 1 in C-111 Basin near Homestead, FL (g). . . . . . . . . . . . .251946080254800 . .214Everglades 4 in C-111 Basin near Homestead, FL (g). . . . . . . . . . . . .252036080324300 . .215Everglades 3 in C-111 Basin near Homestead, FL (g). . . . . . . . . . . . .252043080302400 . .216
WATER RESOURCES DATA - FLORIDA, 2001
VOLUME 2A: SOUTH FLORIDA
XIII
STREAM AND LAKE GAGING STATIONS, IN DOWNSTREAM ORDER, FOR WHICH RECORDS ARE PUBLISHED IN THIS VOLUME continued
DISCONTINUED SURFACE-WATER DISCHARGE OR STAGE-ONLY STATIONS
The following continuous-record surface-water stage and discharge stations in South Florida have been discontinued. Daily streamflow or stage records were collected and published for the period of record, expressed in water years, shown for each station. Discontinued project stations with less than 3 years have not been included. Information regarding these stations may be obtained from the subdistrict office at the address given on the back side of the title page of this report. Drainage area is indeterminate for all of the stations listed below.
Pine Channel near Big Pine, Fl . . . . . . . . . . . . . . .244123081225301 . . . . . . . . . 1976Pinecrest Hammocks near Monroe, Fl (e) . . . . . . . . . . .254635080541500 . . . . . .1979 - 1980Pompano Canal at Pompano Beach, Fl (d) . . . . . . . . . . . . . . 02282000 . . . . . .1964 - 1969 (Prior to October 1948, published as Cypress Creek Canal at Pompano)Pompano Canal at S-38, near Pompano Beach, Fl (d) . . . . . . . . . 02281700 . . . . . .1962 - 1967
Roberts Lake Slough near Monroe, Fl (d) . . . . . . . . . . . . . 02290950 . . . . . .1973 - 1980Rogers River near Everglades, Fl (d) . . . . . . . . . . . . . . . 02290900 . . . . . .1962 - 1965 (period of record published in 1967 volume 2A)
Sanibel River at Snibel, Fl (e) . . . . . . . . . . . . . . . . . . 02293250 . . . . . .1972 - 1977Savannahs Drainage Canal at Port St Lucie, Fl (d) . . . . . . . . . 02276568 . . . . . .1976 - 1977Shark River near Homestead, Fl (d) . . . . . . . . . . . . . . . . 02290850 . . . . . .1960 - 1966 (gage heights only 1967 - 1969)Site 15 nr L-39 in Conserv. Area No. 2A near Shawano, FL (g) 262400080250001 . . . . . .1991 - 1997Site 34 near L-30 in Conservation Area 3B, near Miami, FL (g)255215080291000 . . . . . .1993 - 1997Six Mile Cypress Creek South near Ft. Myers, Fl (d) . . . . . . . . 02291670 . . . . . .1988 - 1990San Carlos Bay at St. James, City, Fl (e) . . . . . . . . . . . . . 02293288 . . . . . .1990 - 1992Snake Creek Canal at S-29, at S-29, at North Miami Beach, Fl (d) . 02286300 . . . . . .1959 - 1985Snake Creek Canal at S-30, near Hialeah, Fl (d) . . . . . . . . . . 02286180 . . . . . .1963 - 1967Snapper Creek Canal at Miller Drive, near South Miami, Fl (e) . . . 02290610 . . . . . .1963 - 1981 (formerly published under station number 02290600)
WATER RESOURCES DATA - FLORIDA, 2001
VOLUME 2A: SOUTH FLORIDA
XVIII
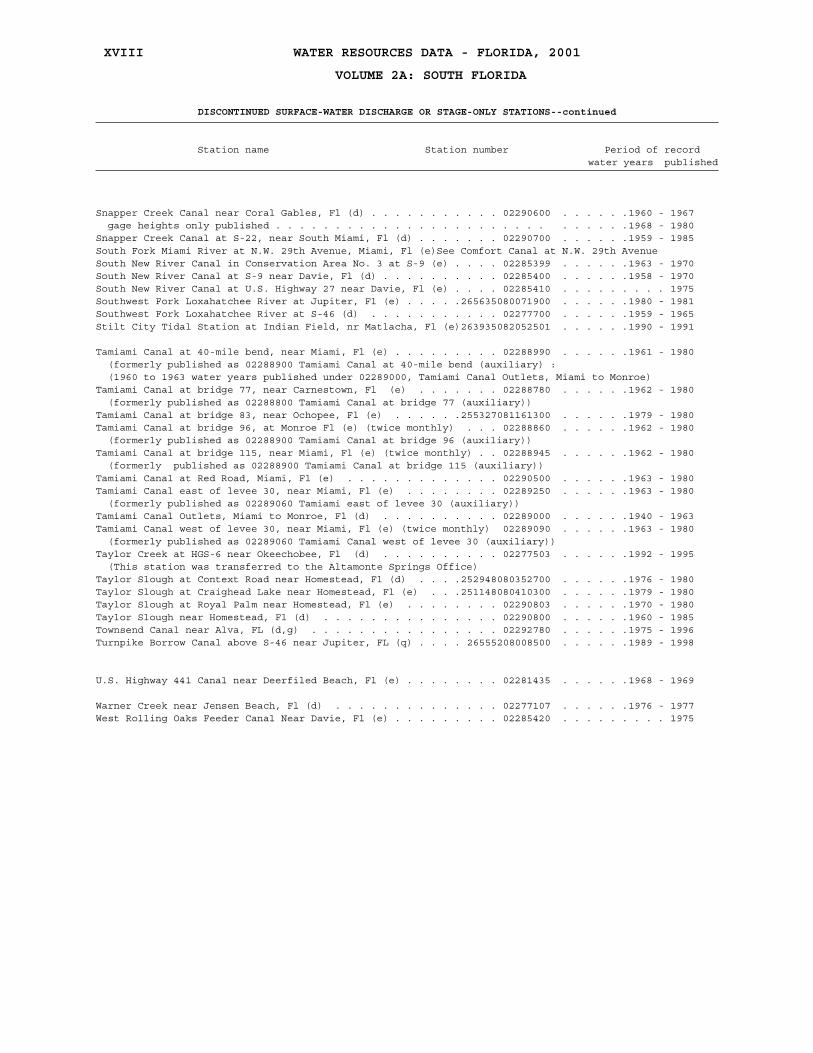
DISCONTINUED SURFACE-WATER DISCHARGE OR STAGE-ONLY STATIONS--continued
Station name Station number Period of record water years published
Snapper Creek Canal near Coral Gables, Fl (d) . . . . . . . . . . . 02290600 . . . . . .1960 - 1967 gage heights only published . . . . . . . . . . . . . . . . . . . . . . . . . . . . .1968 - 1980Snapper Creek Canal at S-22, near South Miami, Fl (d) . . . . . . . 02290700 . . . . . .1959 - 1985South Fork Miami River at N.W. 29th Avenue, Miami, Fl (e)See Comfort Canal at N.W. 29th AvenueSouth New River Canal in Conservation Area No. 3 at S-9 (e) . . . . 02285399 . . . . . .1963 - 1970South New River Canal at S-9 near Davie, Fl (d) . . . . . . . . . . 02285400 . . . . . .1958 - 1970South New River Canal at U.S. Highway 27 near Davie, Fl (e) . . . . 02285410 . . . . . . . . . 1975Southwest Fork Loxahatchee River at Jupiter, Fl (e) . . . . .265635080071900 . . . . . .1980 - 1981Southwest Fork Loxahatchee River at S-46 (d) . . . . . . . . . . . 02277700 . . . . . .1959 - 1965Stilt City Tidal Station at Indian Field, nr Matlacha, Fl (e)263935082052501 . . . . . .1990 - 1991
Tamiami Canal at 40-mile bend, near Miami, Fl (e) . . . . . . . . . 02288990 . . . . . .1961 - 1980 (formerly published as 02288900 Tamiami Canal at 40-mile bend (auxiliary) : (1960 to 1963 water years published under 02289000, Tamiami Canal Outlets, Miami to Monroe)Tamiami Canal at bridge 77, near Carnestown, Fl (e) . . . . . . . 02288780 . . . . . .1962 - 1980 (formerly published as 02288800 Tamiami Canal at bridge 77 (auxiliary))Tamiami Canal at bridge 83, near Ochopee, Fl (e) . . . . . .255327081161300 . . . . . .1979 - 1980Tamiami Canal at bridge 96, at Monroe Fl (e) (twice monthly) . . . 02288860 . . . . . .1962 - 1980 (formerly published as 02288900 Tamiami Canal at bridge 96 (auxiliary))Tamiami Canal at bridge 115, near Miami, Fl (e) (twice monthly) . . 02288945 . . . . . .1962 - 1980 (formerly published as 02288900 Tamiami Canal at bridge 115 (auxiliary))Tamiami Canal at Red Road, Miami, Fl (e) . . . . . . . . . . . . . 02290500 . . . . . .1963 - 1980Tamiami Canal east of levee 30, near Miami, Fl (e) . . . . . . . . 02289250 . . . . . .1963 - 1980 (formerly published as 02289060 Tamiami east of levee 30 (auxiliary))Tamiami Canal Outlets, Miami to Monroe, Fl (d) . . . . . . . . . . 02289000 . . . . . .1940 - 1963Tamiami Canal west of levee 30, near Miami, Fl (e) (twice monthly) 02289090 . . . . . .1963 - 1980 (formerly published as 02289060 Tamiami Canal west of levee 30 (auxiliary))Taylor Creek at HGS-6 near Okeechobee, Fl (d) . . . . . . . . . . 02277503 . . . . . .1992 - 1995 (This station was transferred to the Altamonte Springs Office) Taylor Slough at Context Road near Homestead, Fl (d) . . . .252948080352700 . . . . . .1976 - 1980Taylor Slough at Craighead Lake near Homestead, Fl (e) . . .251148080410300 . . . . . .1979 - 1980Taylor Slough at Royal Palm near Homestead, Fl (e) . . . . . . . . 02290803 . . . . . .1970 - 1980Taylor Slough near Homestead, Fl (d) . . . . . . . . . . . . . . . 02290800 . . . . . .1960 - 1985Townsend Canal near Alva, FL (d,g) . . . . . . . . . . . . . . . . 02292780 . . . . . .1975 - 1996Turnpike Borrow Canal above S-46 near Jupiter, FL (q) . . . . 26555208008500 . . . . . .1989 - 1998
U.S. Highway 441 Canal near Deerfiled Beach, Fl (e) . . . . . . . . 02281435 . . . . . .1968 - 1969
Warner Creek near Jensen Beach, Fl (d) . . . . . . . . . . . . . . 02277107 . . . . . .1976 - 1977West Rolling Oaks Feeder Canal Near Davie, Fl (e) . . . . . . . . . 02285420 . . . . . . . . . 1975
WATER RESOURCES DATA - FLORIDA, 2001
VOLUME 2A: SOUTH FLORIDA
1
INTRODUCTION
The U.S. Geological Survey (USGS), in cooperation with State, County, and other Federalagencies, obtains a large amount of data pertaining to the water resources of Florida each wateryear. These data, accumulated during many water years, constitute a valuable data base fordeveloping an improved understanding of the water resources of the state. To make these datareadily available to interested parties outside the USGS, the data are published annually in thisreport series entitled "Water Resources Data - Florida, Volume 2A: South Florida Surface Water andVolume 2B: South Florida Ground Water."
This report series includes records of stage, discharge, and water quality of streams; andstage, contents, and water quality of lakes; and ground-water levels, contents, and water qualityof ground-water wells. The data for south Florida include continuous or daily discharge for 89streams, continuous or daily stage for 64 streams, continuous elevations for 1 lake, continuousground-water levels for 244 wells, periodic ground-water levels for 255 wells, andquality-of-water data for 32 surface-water sites and 166 wells.
This series of annual reports for Florida began with the 1961 water year, with a report thatcontained only data relating to the quantities of surface water. For the 1964 water year, a similarreport was introduced that contained only data relating to water quality. For the 1975 water year,the report format was changed to one volume presenting data on quantities of surface water, qualityof surface and ground water, and ground-water levels. For the 1977 water year, the report formatwas changed to one volume presenting data on quantity and quality of surface water, and one volumepresenting data on water levels and quality of ground water.
Prior to introduction of this series and for several concurrent water years concurrent with it,water-resources data for Florida were published in USGS Survey Water-Supply Papers. Data on streamdischarge and stage, and on lake or reservoir contents and stage, through September 1960, werepublished annually under the title "Surface-Water Supply of the United States". For the 1961through 1970 water years, the data were published in two 5-year reports. Data on chemical quality,temperature, and suspended sediment for the 1941 through 1970 water years were published annuallyunder the title "Quality of Surface Waters of the United States," and water levels for the 1935through 1974 water years were published under the title "Ground-Water Levels in the UnitedStates." The above-mentioned Water-Supply Papers may be consulted in the libraries of theprincipal cities of the United States and may be purchased from the U.S. Geological Survey, Branchof Information Services, Box 25286, Federal Center, Denver, CO 80115 (telephone: 888-ASK-USGS).
Publications similar to this report are published annually by the USGS for all States. Theseofficial USGS reports have an identification number consisting of the two-letter Stateabbreviation, the last two digits of the water year, and the volume number. For example, thisvolume is identified as "U.S. Geological Survey Water-Data Report FL-xx-2A," where xx representsthe current water year. For archiving and general distribution, reports for the 1971-74 wateryears also are identified as water-data reports. These water-data reports are for sale in papercopy or microfiche by the National Technical Information Service, U.S. Department of Commerce,Springfield, VA 22161. Additional information, including current prices, for ordering specificreports may be obtained from the Office Chief at the address given on the back of the title page orby telephone (305) 717-5800.
WATER RESOURCES DATA - FLORIDA, 2001
VOLUME 2A: SOUTH FLORIDA
2
COOPERATION
The USGS and various federal, state, and local organizations have had cooperative agreements forthe collection of water-resource records since 1930. Oganizations that assisted in collecting the datapresented in this report through cooperative agreement with the Survey are:
Organizations that provided data are acknowledged in station manuscripts.
Broward CountyCity of Boca RatonCity of Cape Coral City of Ft. LauderdaleCity of HallandaleCity of HollywoodEverglades National ParkFlorida Keys Aqueduct Authority
Lee CountyMiami-Dade County Department of Environmental
Resource ManagementSeminole Tribe of FloridaSouth Florida Water Management DistrictU.S. Army Corps of EngineersU.S. Fish and Wildlife Service
WATER RESOURCES DATA - FLORIDA, 2001
VOLUME 2A: SOUTH FLORIDA
3
SUMMARY OF HYDROLOGIC CONDITIONS
This section summarizes important hydrologic events that occurred during the 2001 water year (October
1, 2000 to September 30, 2001) as well as significant natural and water-management responses to these
events. Figure 2 provides a frame of reference for some of the major land areas of hydrologic significance
mentioned in the summary.
Figure 2. South Florida areas of hydrologic significance.
������������
���
���
��
0 25 50 MILES
0 50 KILOMETERS25
Peace
Riv
er
St. LucieRiver
St. Lucie
CanalLake
Okeechobee
Ca
Ca
lo
lo
osa
osa
hat
hat
chee
chee
River
Canal
GU
LF
OF
ME
XIC
O
Florida Bay
Bis
cayne
Bay
CapeRomano
CharlotteHarbor
Miami
AT
LA
NT
ICO
CE
AN
Mya
kka
Riv
er
Kissim
me
eR
iver
EXPLANATION
Everglades
Agricultural Area
Big CypressNational Preserve
Fakahatchee
Strand State Preserve
Biscayne NationalPark
Everglades National
Park
Water Conservation
Native American
Areas (WCA)
Lands
Volume 2
Boundary
1
2B
2A
3A
3B
WATER RESOURCES DATA - FLORIDA, 2001
VOLUME 2A: SOUTH FLORIDA
4
SUMMARY OF HYDROLOGIC CONDITIONS (continued)
During the 2001 water year, the Miami Subdistrict monitored 89 continuous discharge stations, 64continuous stage stations, 1 lake, and collected water-quality data at 32 miscellaneous sites incooperation with local, State, and Federal agencies.
October began with a direct hit by a poorly organized tropical disturbance (which later becameTropical Storm Leslie). About 10 to 20 inches of rain fell in areas of Miami-Dade County and extremesoutheastern Broward County. In response, heavy flood control releases were made from the coastal canalsas needed. After a cold frontal passage on October 9, the month became very dry; in the second half ofthe month, the South Florida Water Management District (SFWMD) kept the canal levels and storage areasas high as allowed to conserve the excess water from the storm. Lake Okeechobee received less thanaverage rainfall for the month, rising in the first half and falling in the second half of the month dueto dry conditions and water demands including water-supply releases to the Caloosahatchee River. Alllocks were open around the lake. The U.S. Army Corps of Engineers (USACE) released excess water from theSt. Lucie Canal into Lake Okeechobee, but there were no releases into the St. Lucie estuary. The USACEinitiated flood-control pumping from the Everglades Agricultural Area (EAA) into Lake Okeechobee due tothe high rainfall. Releases ended at S-333 near the beginning of the month, and releases from the S-12structures continued according to the rainfall regulation control plan.
November 2000 was the driest in 30 years, with rains averaging 19 percent of the monthly historicalaverage. The one exception was Palm Beach County where a localized rain event dropped about 6 inches ofwater in 1 day. This caused the SFWMD to lower water levels in the canals in the area to remove excesswater by releases through some coastal structures and by pumping. Because of the dry conditions, LakeOkeechobee declined about 0.5 foot (to 11.59 feet) at the end of the month. This led to theimplementation of the Supply Side Management (SSM) plan for water delivery in the area. This plan limitsthe amount of agriculture use releases from Lake Okeechobee each week. Water-supply releases were madeinto the Caloosahatchee River according to the SSM plan and navigation needs. Environmental releaseswere made into the Caloosahatchee estuary due to increased chloride concentrations. The stages in allwater-conservation areas (WCA’s) decreased, resulting in more water demand from Lake Okeechobee.
December generally produced well below average rainfall, except for Miami-Dade and Broward Countieswhen a stalled front produced nearly 14 inches of rain in 5 hours over portions of Miami-Dade County.Due to this heavy rain, flood-control releases were made from the coastal canals. To minimize waterusage from storage areas, the SFWMD released excess water in some canals into canals in need of water byoperating control structures or coordinating operation with secondary drainage districts. LakeOkeechobee continued to decline until the end of the month reaching 11.21 feet. All locks around LakeOkeechobee remained open, and releases were made according to the SSM plan and navigation needs. Stagesin the EAA decreased and operations focused on water conservation. Water levels in the WCA’s continuedto decline, though releases were made as necessary.
Drought conditions continued in January with rains averaging only 28 percent of the historicalaverage. Lake Okeechobee continued to fall, reaching an elevation of 10.85 feet. Environmental releaseswere made into the Caloosahatchee River estuary to reduce chloride concentrations. The SSM plan wascontinued in use for the EAA and canals in the area continued to decline. Stages in the WCA’s declined,and operations were designed for water conservation, although releases were made for water supply asneeded. The SFWMD began to make releases into the South Dade Conveyance System from WCA 3B for watersupply at the end of the month, and the SFWMD coordinated with secondary drainage districts to supplywater to the coastal canals. Releases were made through the S-12 structures and S-333 as scheduled.
February was the driest month in 57 years and the driest November-February period on record backthrough 1927. Rains averaged 4 percent of the monthly historical average. Lake Okeechobee continued todecline, ending the month at an elevation of 10.56 feet. Water conservation stages continued to decline;with WCA 2 falling below its minimum water-supply level with WCA 2A falling below its regulation levelfor this time of year. Because of low WCA water levels, canals in Broward County began to decline. Thewater level in WCA 1 decreased rapidly due to high water demands and was near its minimum water-supplylevel by the end of the month. No water was released into the St. Lucie or Caloosahatchee Riverestuaries. In order to prevent high chloride concentrations in the Caloosahatchee Canal, the number oflockages allowed at S-79 was limited. Releases were made through the S-12 structures and S-333 asscheduled. Coastal canals gradually declined, and releases were made from WCA 3 to maintain optimumlevels. No releases were made from WCA 2A; by the end of the month, canal stages in the South DadeConveyance System declined below their water-supply trigger levels.
WATER RESOURCES DATA - FLORIDA, 2001
VOLUME 2A: SOUTH FLORIDA
5
SUMMARY OF HYDROLOGIC CONDITIONS (continued)
March was the wettest month since September 2000. On average, the rains were 161 percent of themonthly historical average, but dry-season rains were still well below average. Lake Okeechobeecontinued to decline to reach 10.22 feet by the end of the month. Because of the low lake levels, somelocks were not usable due to dry ground on the lake side approach. WCA’s levels declined in the firsthalf of the month, however, releases from Lake Okeechobee and the abundant rain caused the stages inWCA 1 and 2A to rise above minimum water-supply levels. No releases were made into the St. Lucie Riverestuary, and flood-control releases were made from the Caloosahatchee Canal into the estuary only thelast 2 days of the month. The SFWMD began to operate pumping stations that released water from LakeOkeechobee into the EAA for water-supply need. The SFWMD also made flood-control releases into WCA’sby gravity and pumps during the higher March rainfall event. The SFWMD Governing Board approvedwater-supply pumping into Lake Okeechobee (referred to as back pumping) as part of the ComprehensiveDrought Management Implementation Plan. Also because of the higher rainfall event, water-supply backpumping was started on March 30th to pump the excess water in the EAA canals into Lake Okeechobee. TheS-12 structures and S-333 were closed the entire month. Water-supply releases from WCA 3A were reducedto the South Dade Conveyance System because of low water levels. Canal water levels increased afterthe rain event, but were still below water-supply trigger levels.
April went back to a well below average month with only 23 percent of the average monthly rainfallreceived. An exception was Miami-Dade County, which received locally heavy rainfall at the end of themonth. Average dry-season rainfall, thus far, was the least since 1971. Back pumping due to the rainsin March was quickly halted, and Lake Okeechobee continued to decline and ended the month at 9.53 feet.Forward pumps were installed at S-351, S-352, and S-354 to access Lake Okeechobee water at stagesbelow 9.5 feet. Some navigation locks remained inoperable. The SFWMD continued to implement the SSMplan. No releases were made into the St. Lucie River estuary, and very limited releases were made intothe Caloosahatchee River estuary. During the last week of the month, the USACE approved deviations towater-supply plans for the WCA’s because of drought conditions. Due to the heavy April rain event, thewater level of WCA 1 was above minimum water-supply levels, and releases were made into coastalcanals. By the end of the month the level of WCA 1 was below the minimum water-supply levels, butreleases continued due to the approved deviations for the water-supply plan. WCA 2A continued to bebelow the minimum water-supply levels schedule and no releases were made. Only small releases weremade through S-333, and the S-12 structures were closed all month. South Dade canals fluctuated withrainfall, and limited releases were made from WCA 3.
Rainfall totals for May were about average ending the driest dry period on record. Despite thenormal rainfall, Lake Okeechobee continued to decline ending the month at 9.05 feet and setting a newall-time low record. There were no releases into the St. Lucie River estuary but there were onlyreleases into the Caloosahatchee River estuary at the end of the month. Excess water from the St. LucieRiver estuary was released into Lake Okeechobee. Forward pumping (pumping water out of LakeOkeechobee) continued with the temporary pumps into the EAA and WCA 1 for coastal needs. No releaseswere made from WCA 2A but regulatory releases continued from WCA 3A. Coastal canals continued tofluctuate with rainfall; at the end of the month with increased rainfall, some flood releases weremade.
Rainfall for June was slightly below average. Water demand from Lake Okeechobee was also low, andthe lake rose slightly to 9.26 feet by the end of the month. The forward pumps at S-352 were operatedfor only a few days, and any excess water from the St. Lucie and Caloosahatchee Canals was releasedinto Lake Okeechobee. Pumps were operated at S-2 and S-3 to pump excess water from the EAA back intothe lake. Releases were made into the Caloosahatchee River estuary. Water levels in the WCA’s rose toregulatory levels, and releases were made from the WCA’s without water from Lake Okeechobee. Insteadof releasing water for Southern Miami-Dade County from WCA 3A, water was released through the S-12structures and S-333 in accordance to the rainfall plan. All coastal canals except for L-8 were intheir optimum ranges due to rainfall.
WATER RESOURCES DATA - FLORIDA, 2001
VOLUME 2A: SOUTH FLORIDA
6
SUMMARY OF HYDROLOGIC CONDITIONS (continued)
In July, 151 percent of the average rainfall was received, making it the wettest month since 1941with the highest totals recorded over the southwestern coast of Florida. Lake Okeechobee rose over 1foot to end the month at 10.48 feet. Even with the rapid rise, the SSM plan was still implemented, butdemand was very low. Water was released from the St. Lucie and Caloosahatchee Canals into the lake allmonth. Releases were made into the Caloosahatchee River estuary all month.
Water releases were made from the WCA’s without inflow from Lake Okeechobee; during the second halfof the month, water was released from WCA 1A to Lake Okeechobee. Coastal canals were at their optimumlevel except for L-8. Water was released into L-8 from the WCA’s, and by the middle of the month LakeOkeechobee was at its optimum level. Some coastal canals made heavy flood control releases.
Much of the precipitation for August occurred during the first week because of rains associated withTropical Storm Barry. Relatively dry conditions occurred later in the month. Lake Okeechobee rose 1.5feet to end the month at 11.96 feet, which is still low for August. Excess water continued to bereleased into Lake Okeechobee from the EAA and WCA 2A. Additionally S-2 and S-3 pumped water into thelake for the entire month. Water from the Caloosahatchee and St. Lucie Canals was released into LakeOkeechobee. Flood releases were made into the Caloosahatchee River estuary all month; S-77 was closeddue to rising lake levels and water was released to tide at S-79. The WCA’s continued to rise toregulatory levels. Releases into the South Dade Conveyance System were made through the S-12 structuresand S-333 according to the SSM plan. Heavy flood releases were made from the coastal canals, and S-197was open at the beginning of the month for flood regulation.
Rain from Tropical Storm Gabriel and an early cold front caused September to be the wettest monthsince 1980 with the highest rainfall totals recorded along the southwestern coast of Florida. About 185percent of the average rainfall was recorded this month. Lake Okeechobee continued to rise to 14.06 feetby the end of the month. Back pumping was stopped near the end of the month. Flood-control pumping atS-2 and S-3 into Lake Okeechobee became necessary due to the heavy rainfall. Water continued to bereleased into the lake from the St. Lucie Canal. S-77 remained closed and excess water was released totide for the rest of the month. Flood-control releases were made into the WCA’s because water levelsrose all month. No releases were made from WCA 3A into the South Dade Conveyance System. Releases weremade through S-12 structures and S-333 until southern trigger well G-3373 rose high enough to meet themaximum water-supply regulation schedule requirements. Water releases under Tamiami Trail were curtailedand discharge was maximized at the S-12 structures. Heavy flood control releases were made though allcoastal canals and water levels were lowered to aid in drainage of secondary systems.
WATER RESOURCES DATA - FLORIDA, 2001
VOLUME 2A: SOUTH FLORIDA
7
SUMMARY OF HYDROLOGIC CONDITIONS (continued)
The relation of period of record mean annual discharge to mean discharge for the current
year for selected representative stations is given below (ft3/s, cubic feet per second; %,
percent). Mean annual discharge for base period computed using only water years where dis-
charge is complete. See station manuscript for further information about which water years
were complete.
STATION NAME MEAN ANNUAL DISCHARGE MEAN DISCHARGE FOR WATER YEAR 2001
STATIONNUMBER
Stations that monitor discharge from Lake Okeechobee into St. Lucie Canal and then into the St. Lucie River Estuary
BASE PERIOD (ft3/s) (ft3/s)DEPARTURE FROM MEAN
(%)
02277000 St. Lucie Canal at Lock (S-80), near Stuart, FL 1953-2001 740 35 -95
STATION NAMEMEAN ANNUAL DISCHARGE
MEAN DISCHARGE FOR WATER YEAR 2001
STATIONNUMBER
Stations at the S-5A complex that monitor the discharge to and from Lake Okeechobee, the water conservation areas and the coast
BASE PERIOD (ft3/s) (ft3/s)DEPARTURE FROM MEAN
(%)
02278450 West Palm Beach Canal above S-5A, near Loxahatchee, FL 1958-2001 398 310 -22
02278500 Diversions to Water Conservation Area No 1 at S-5A and S-5A-S, near Loxahatchee, FL
1958-2001 373 284 -24
02278550 Levee 8 Canal at West Palm Beach Canal, near Loxahatchee, FL
1958-2001 140 -18.3 -113
02278600 West Palm Beach Canal below S-5A-E near Loxahatchee, FL 1956-2001 165 7.05 -96
STATION NAMEMEAN ANNUAL DISCHARGE
MEAN DISCHARGE FOR WATER YEAR 2001
STATIONNUMBER
Stations that monitor discharge from the Everglades Agricultural Area into the water conservation areas
BASE PERIOD (ft3/s) (ft3/s)DEPARTURE FROM MEAN
(%)
02281200 Hillsboro Canal at S-6 near Shawano, FL 1958-811991-2001
227 207 -9
02284300 North New River Canal at S-7 at Terrytown, FL 1960-821991-2001
245 135 -45
WATER RESOURCES DATA - FLORIDA, 2001
VOLUME 2A: SOUTH FLORIDA
8
SUMMARY OF HYDROLOGIC CONDITIONS (continued)
The relation of period of record mean annual discharge to mean discharge for the current year
for selected representative stations is given below (ft3/s, cubic feet per second; %, percent).
Mean annual discharge for base period computed using only water years where discharge is com-
plete. See station manuscript for further information about which water years were complete.
* Discharge records are incomplete in the National Water Information System data base. Mean for period of record determined from discharge records in the files of the U.S. Geological Survey.
STATION NAMEMEAN ANNUAL DISCHARGE
MEAN DISCHARGE FOR WATER YEAR 2001
STATIONNUMBER
Stations that monitor discharge from Lake Okeechobee into the Everglades Agricultural Area
BASE PERIOD (ft3/s) (ft3/s)DEPARTURE FROM MEAN
(%)
02280500 Hillsboro Canal below S-351, near South Bay, FL 1957-2001 15 68.2 355
02283498 North New River Canal at S-2 and S-351, near South Bay, FL
1968-2001 154 -198 -229
02286400 Miami Canal at S-354 and S-3, at Lake Harbor, FL 1958-2001 73.4 -77.5 -206
STATION NAMEMEAN ANNUAL DISCHARGE
MEAN DISCHARGE FOR WATER YEAR 2001
STATIONNUMBER
Stations that monitor discharge into Big Cypress National Preserve and Everglades National Park
BASE PERIOD (ft3/s) (ft3/s)DEPARTURE FROM MEAN
(%)
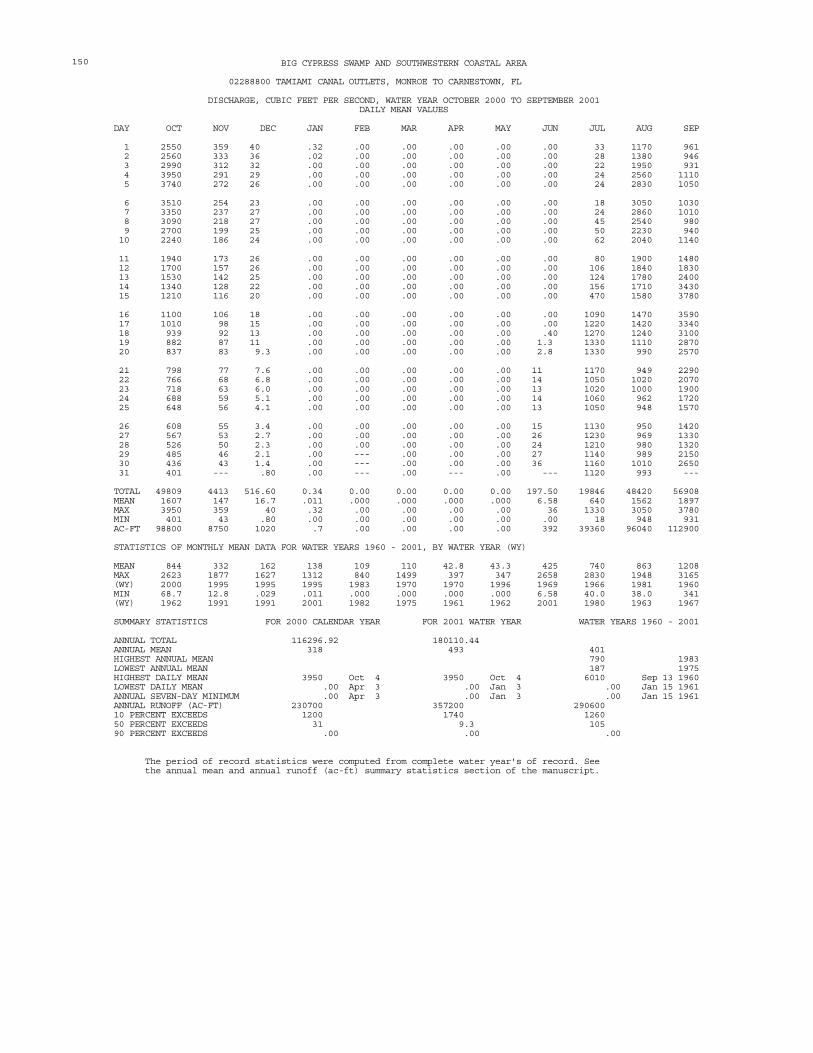
02288800 Tamiami Canal Outlets, Monroe to Carnestown, FL 1960-2001 401 493 23
02288900 Tamiami Canal Outlets, Forty-Mile Bend to Monroe, FL 1964-2001 387 311 -20
02289040 Tamiami Canal Outlets, Levee 67A to 40 Mile Bend, near Miami, FL
264437081550100 Gator Slough at U.S. 41 near Ft. Myers, FL 1987-2001 7.15 7.3 2
WATER RESOURCES DATA - FLORIDA, 2001
VOLUME 2A: SOUTH FLORIDA
10
SUMMARY OF HYDROLOGIC CONDITIONS (continued)
Surface-Water Station Functions
The south Florida surface-water data-collection network has various types of stations to meet the
needs of water managers and others. These stations are grouped below according to major functions. These
groups contain representative stations from the south Florida surface-water data-collection network.
The following USGS stations monitor the release of water from Lake Okeechobee into St. Lucie Canal andthen into the St. Lucie River Estuary:
02276870 St Lucie Canal at Lake Okeechobee (S-308)02277000 St Lucie Canal at Lock, near Stuart (S-80)
The following USGS stations at the S-5A complex monitor water releases to and from Lake Okeechobee, thewater conservation areas, and the coast:
02278450 West Palm Beach Canal above S-5A, near Loxahatchee (pump - west gate)02278500 Diversions to Water Conservation Area No. 1 at S-5A and S-5A-S (pump + south gate) 02278550 Levee 8 Canal at West Palm Beach Canal, nr Loxahatchee (east + west + south gate)02278600 West Palm Beach Canal below S-5A-E near Loxahatchee (east gate only)
The following USGS stations monitor the release of water from Lake Okeechobee into the CaloosahatcheeRiver and then into San Carlos Bay:
02292000 Caloosahatchee Canal at Moore Haven (S-77)02292480 Caloosahatchee Canal at Ortona Lock near La Belle (S-78)02292900 Caloosahatchee River at S-79 near Olga
The following USGS stations monitor the release of water from Lake Okeechobee into the Everglades Ag-ricultural Area:
265501080364900 Levee 8 Canal near Canal Point02278000 West Palm Beach Canal at S-352, at Canal Point02280500 Hillsboro Canal below S-351, near South Bay02283498 North New River Canal at S-2 and S-351, near South Bay02283500 North New River Canal below S-2 and S-351, near South Bay02286400 Miami Canal at S-354 and S-3, at Lake Harbor
The following USGS stations monitor the release of water from the Everglades Agricultural Area into thewater-conservation areas:
02278450 West Palm Beach Canal above S-5A, near Loxahatchee02281200 Hillsboro Canal at S-6 near Shawano02284300 North New River Canal at S-7 at Terrytown02286700 Miami Canal at S-8 near Lake Harbor261533080571600 L-28 Interceptor Canal below S-190 near Clewiston261543080495000 L-28 Canal above S-140 near Clewiston
The following USGS stations monitor the water levels in the water-conservation areas:02278501 Water Conservation Area No. 1 below S-5 Complex, near Loxahatchee263180080205001111 Site 7 in Water Conservation Area No. 1 near Shawano263050080145001112 Site 8T in Water Conservation Area No. 1 near Boynton Beach263000080120001113 Site 8C near L-40 in Water Conservation Area No. 1 nr Boynton Beach262750080175001114 Site 9 in Water Conservation Area No. 1 near Boynton Beach262400080250001115 Site 15 near L-39 in Water Conservation Area No. 2A near Shawano261710080190001129 Site 19 in Water Conservation Area No. 2A near Coral Springs262240080258001132 Site 17 near L-38, Water Conservation Area No. 2A nr Coral Springs261117080315201135 Site 63 in Water Conservation Area No. 3A near Andytown 261023080443001138 Site 62 in Water Conservation Area No. 3A near Andytown260810080222001139 Site 99 near L-35A in Water Conservation Area No. 2B near Sunrise260037080303401146 Site 76 in Water Conservation Area No. 3B near Andytown255828080401301147 Site 64 in Water Conservation Area No. 3A near Coopertown255300080370001152 Site 69 in Water Conservation Area No. 3B near Coopertown254848080432001154 Site 65 in Water Conservation Area No. 3A near Coopertown255250080335001156 Site 71 in Water Conservation Area No. 3B near Coopertown
WATER RESOURCES DATA - FLORIDA, 2001
VOLUME 2A: SOUTH FLORIDA
11
SUMMARY OF HYDROLOGIC CONDITIONS (continued)
Surface-Water Station Functions (continued)
The USGS monitors the following stations to determine the discharge into Big Cypress National Preserveand Everglades National Park:
02288800 Tamiami Canal Outlets, Monroe to Carnestown02288900 Tamiami Canal Outlets, 40 Mile Bend to Monroe02289040 Tamiami Canal Outlets, Levee 67A to 40 Mile Bend (total discharge through S-12A, B, C, D)254543080491101182 Tamiami Canal below S-12A (total discharge through S-12A)02289019 Tamiami Canal below S-12B (total discharge through S-12B) 02289041 Tamiami Canal below S-12C (total discharge through S-12C)254543080405401 Tamiami Canal below S-12D (total discharge through S-12D)02289050 Tamiami Canal above S-333, near Miami02289060 Tamiami Canal Outlets, Levee 30 to L-67A022907647 Levee 31 North Extension at 1 mile near West Miami02290765 Levee 31 North Extension at 3 mile near West Miami02290766 Levee 31 North Extension at 4 mile near West Miami02290767 Levee 31 North Extension at 5 mile near West Miami02290768 Levee 31 North Extension at 7 mile near West Miami02290769 Canal 111 above S-18C, near Florida City02291000 Barron River Canal near Everglades
The following USGS stations are representative of surface-water elevations in southern Miami-Dade Coun-ty:
254315080331500 Northeast Shark River Slough No. 2 near Coopertown 254130080380500 Northeast Shark River Slough No. 1 near Coopertown254100080402400 L-67 Extended Canal West, near Florida City254100080402200 Northeast Shark River Slough East of L-67 Extension nr Richmond Heights253828080391100 Northeast Shark River Slough No. 4, North of Grossman253753080393600 Northeast Shark River Slough No. 5, South of Grossman251716080342100 Everglades 5A in C-111 Basin near Homestead251724080341400 Everglades 5B in C-111 Basin near Homestead251855080283400 Everglades 2B in C-111 Basin near Homestead251906080283400 Everglades 2A in C-111 Basin near Homestead251946080254800 Everglades 1 in C-111 Basin near Homestead252036080324300 Everglades 4 in C-111 Basin near Homestead252043080302400 Everglades 3 in C-111 Basin near Homestead
The following USGS discharge monitoring sites are located along the coast in Miami-Dade, Broward, PalmBeach, and Martin Counties:
02277000 St Lucie Canal at Lock, near Stuart (S-80)02279000 West Palm Beach Canal at West Palm Beach (S-155)02282700 Middle River Canal at S-36, near Fort Lauderdale02283200 Plantation Road Canal at S-33, near Fort Lauderdale02286100 South New River Canal at S-13, near Davie02288600 Miami Canal at NW 36th Street, Miami (S-26)02290710 Black Creek Canal at S-21, near Goulds02292900 Caloosahatchee River at S-79 near Olga
The following USGS discharge monitoring sites are located on the southwestern coast of Florida:02291500 Imperial River near Bonita Springs 02291524 Spring Creek Headwater near Bonita Springs 02291580 North Branch Estero River at Estero, 02291597 South Branch Estero River at Estero02291673 Tenmile Canal at Control Near Estero02293240 Aries Canal at Cape Coral02293241 San Carlos Canal at Cape Coral02293243 Courtney Canal at Cape Coral02293345 Shadroe Canal at Cape Coral02293346 Horseshoe Canal at Cape Coral02293347 Hermosa Canal at Cape Coral264437081550100 Gator Slough at U.S. 41 near Ft. Myers264139082022100 Gator Slough at SR 765 near Ft. Myers
WATER RESOURCES DATA - FLORIDA, 2001
VOLUME 2A: SOUTH FLORIDA
12
SPECIAL NETWORKS AND PROGRAMS
Hydrologic Benchmark Network is a network of 50 sites in small drainage basins around the countrywhose purpose is to provide consistent data on the streamflow from representative undeveloped watershedsnationwide, and to provide analyses on a continuing basis to compare and contrast conditions observed inbasins more obviously affected by human activities. At 10 of these sites, water-quality information isbeing gathered on major ions and nutrients, primarily to assess the affects of acid deposition on streamchemistry. Additional information on the Hydrologic Benchmark Program can be found at http://water.usgs.gov/hbn/.
National Stream-Quality Accounting Network (NASQAN) monitors the water quality of large riverswithin the Nation’s largest river basins. From 1995 through 1999, a network of approximately 40 stationswere operated in the Mississippi, Columbia, Colorado, and Rio Grande. From 2000 through 2004, samplingwas reduced to a few index stations on the Colorado and Columbia so that a network of 5 stations couldbe implemented on the Yukon River. Samples are collected with sufficient frequency that the flux of awide range of constituents can be estimated. The objective of NASQAN is to characterize the waterquality of these large rivers by measuring concentration and mass transport of a wide range of dissolvedand suspended constituents, including nutrients, major ions, dissolved and sediment-bound heavy metals,common pesticides, and inorganic and organic forms of carbon. This information will be used (1) todescribe the long-term trends and changes in concentration and transport of these constituents; (2) totest findings of the National Water-Quality Assessment Program (NAWQA); (3) to characterize processesunique to large-river systems such as storage and re-mobilization of sediments and associatedcontaminants; and (4) to refine existing estimates of off-continent transport of water, sediment, andchemicals for assessing human effects on the world’s oceans and for determining global cycles of carbon,nutrients, and other chemicals. Additional information about the NASQAN Program can be found at athttp://water.usgs.gov/nasqan/.
The National Atmospheric Deposition Program/National Trends Network (NADP/NTN) provides continuousmeasurement and assessment of the chemical constituents in precipitation throughout the United States.As the lead federal agency, the USGS works together with over 100 organizations to provide a long-term,spatial and temporal record of atmospheric deposition generated from a network of 225 precipitationchemistry monitoring sites. This long-term, nationally consistent monitoring program, coupled withecosystem research, provides critical information toward a national scorecard to evaluate theeffectiveness of ongoing and future regulations intended to reduce atmospheric emissions and subsequentimpacts to the Nation’s land and water resources. Reports and other information on the NADP/NTN Program,as well as all data from the individual sites, can be found at http://bqs.usgs.gov/acidrain/.
The National Water-Quality Assessment (NAWQA) Program of the U.S. Geological Survey is a long-termprogram with goals to describe the status and trends of water-quality conditions for a large,representative part of the Nation’s ground- and surface-water resources; provide an improvedunderstanding of the primary natural and human factors affecting these observed conditions and trends;and provide information that supports development and evaluation of management, regulatory, andmonitoring decisions by other agencies.
Assessment activities are being conducted in 59 study units (major watersheds and aquifer systems)that represent a wide range of environmental settings nationwide and that account for a large percentageof the Nation’s water use. A wide array of chemical constituents will be measured in ground water,surface water, streambed sediments, and fish tissues. The coordinated application of comparativehydrologic studies at a wide range of spatial and temporal scales will provide information for decisionmaking by water-resources managers and a foundation for aggregation and comparison of findings toaddress water-quality issues of regional and national interest.
Communication and coordination between USGS personnel and other local, state, and federalinterests are critical components of the NAWQA Program. Each study unit has a local liaison committeeconsisting of representatives from key federal, State, and local water resources agencies, Indiannations, and universities in the study unit. Liaison committees typically meet semiannually to discusstheir information needs, monitoring plans and progress, desired information products, and opportunitiesto collaborate efforts among the agencies. Additional information about the NAWQA Program can be foundat http://water.usgs.gov/nawqa/nawqa_home.html
WATER RESOURCES DATA - FLORIDA, 2001
VOLUME 2A: SOUTH FLORIDA
13
EXPLANATION OF THE RECORDS
A calendar of the water year is provided on the inside of the front cover. The records containstreamflow data, stage and content data for lakes and reservoirs, water-quality data for surface andground water, and ground-water-level data. The following sections of the introductory text arepresented to provide users with a more detailed explanation of how the hydrologic data published inthis report were collected, analyzed, computed, and arranged for presentation.
Station Identification Numbers
Each data station, whether streamsite or well, in this report is assigned a unique identificationnumber. The number usually is assigned when a station is first established and is retained for thatstation indefinitely. The systems used by the U.S. Geological Survey to assign identification numbersfor surface-water stations and for ground-water well sites differ, but both are based on geographiclocation. The “downstream order” system is used for regular surface-water stations and the“latitude-longitude” system is used for wells and for surface-water stations where only miscellaneousobservations are made.
Downstream Order System
Since October 1, 1950, the order of listing hydrologic-station records in Survey reports is in adownstream direction along the main stream. All stations on a tributary entering upstream from amainstream station are listed before that station. A station on a tributary that enters between twomainstream stations is listed between them. A similar order is followed in listing stations on firstrank, second rank, and other ranks of tributaries. The rank of any tributary with respect to thestream to which it is immediately tributary is indicated by an indention in the “List of Stations” inthe front of this report. Each indention represents one rank. This downstream order and system ofindention shows which stations are on tributaries between any two stations and the rank of thetributary on which each station is situated.
The station-identification number is assigned according to downstream order. In assigning stationnumbers, no distinction is made between partial-record stations and other stations; therefore, thestation number for a partial-record station indicates downstream-order position in a list made up ofboth types of stations. Gaps are left in the series of numbers to allow for new stations that may beestablished; hence, the numbers are not consecutive. The complete eight-digit number for each station,such as 02228500, which appears just to the left of the station name, includes the 2-digit part number“02” plus the 6- to 12-digit downstream-order number “228500.” The part number designates the majorriver basin; for example, part “02” is the South Atlantic Slope and eastern Gulf of Mexico basins.
Numbering System For Wells and Miscellaneos Surface-Water Sites
The eight-digit downstream order station numbers are not assigned to wells and miscellaneoussurface water sites. Where only random water-quality samples or discharge measurements are taken. In
South Florida occassionally discharge sites are not assigned to downstream order number if located in
areas where it is difficult to determine the downstream order.
The identification numbers for wells and miscellaneous surface-water sites are assigned accordingto the grid system of latitude and longitude. The number consists of 15 digits. The first six digitsdenote the degrees, minutes, and seconds of latitude, the next seven digits denote degrees, minutes,and seconds of longitude, and the last two digits (assigned sequentially) identify the wells or othersites within a 1-second grid. This site identification number, once assigned, is a pure number and hasno locational significance. In the rare instance where the initial determination of latitude andlongitude are found to be in error, the station will retain its initial identification number;however, its true latitude and longitude will be listed in the LOCATION paragraph of the stationdescription. (See Figure 13.)
WATER RESOURCES DATA - FLORIDA, 2001
VOLUME 2A: SOUTH FLORIDA
14
RECORDS OF STAGE AND WATER DISCHARGE
Records of stage and water discharge may be complete or partial. Complete records of discharge arethose obtained using a stage-recording device through which either instantaneous or mean dailydischarges may be computed for any time, or any period of time, during the period of record. Completerecords of lake elevation, similarly, are those for which stage may be computed or estimated withreasonable accuracy for any time, or period of time. They may be obtained using a stage-recording deviceor daily or weekly observations, but need not be. Because daily mean discharges and lake elevationscommonly are published for such stations, they are referred to as “daily stations.”
By contrast, partial records are obtained through discrete measurements without using a continuousstage- recording device and pertain only to a few flow characteristics, or perhaps only one. The natureof the partial record is indicated by table titles such as “Crest-stage partial records,” or “Low-flowpartial records.” Records of miscellaneous discharge measurements or of measurements from specialstudies, such as low-flow seepage studies, may be considered as partial records, but they are presentedseparately in this report.
Location of all complete-record and partial-record stations for which data are given in this reportare shown in figures preceding each sub-basin.
Data Collection and Computation
The data obtained at a complete-record gaging station on a stream or canal consist of a record ofstage, individual measurements of discharge throughout a range of stages, and notations regardingfactors that may affect the relationships between stage and discharge. These data, together withsupplemental information, such as weather records, are used to compute daily mean discharges.
Records of stage are obtained with analog recorders that trace continuous graphs of stage or withdigital recorders that punch stage values on paper tapes at selected time intervals. Measurements ofdischarge are made with current meters using methods adopted by the Geological Survey as a result ofexperience accumulated since 1880. These methods are described in standard textbooks, in Water-SupplyPaper 2175, and in U.S. Geological Survey Techniques of Water-Resources Investigations, Book 3, ChapterA1 through A19 and Book 8, Chapters A2 and B2. The methods are consistent with the American Society forTesting and Materials (ASTM) standards and generally follow the standards of the InternationalOrganization for Standards (ISO).
In computing discharge records, results of individual measurements are plotted against thecorresponding stages, and stage-discharge relation curves are then constructed. From these curves,rating tables indicating the approximate discharge for any stage within the range of the measurementsare prepared. If it is necessary to define extremes of discharge outside the range of the current-metermeasurements, the curves are extended using: (1) logarithmic plotting; (2) velocity-area studies; (3)results of indirect measurements of peak discharge, such as slope-area or contracted-openingmeasurements, and computations of flow over dams or weirs; or (4) step-backwater techniques.
Daily mean discharges are computed by applying the daily mean stages (gage heights) to thestage-discharge curves or tables. If the stage-discharge relation is subject to change because offrequent or continual change in the physical features that form the control, the daily mean discharge is
Coordinates for miscellaneoussite C (304214083193701)
Coordinates for well A(304213083193701) andmiscellaneous site B(304213083193702)
Coordinates for wellsD (304213083193801) andE (304213083193802)
30o42'15"
30o42'13"
14"
ED
B
A
C
83o 1
9'39
"
38"
83o 1
9'37
"
Figure 3. System for numbering wells and miscellaneous sites. (latitude and longitude)
WATER RESOURCES DATA - FLORIDA, 2001
VOLUME 2A: SOUTH FLORIDA
15
determined by the shifting-control method, in which correction factors based on the individualdischarge measurements and notes of the personnel making the measurements are applied to the gageheights before the discharges are determined from the curves or tables. This shifting-control methodalso is used if the stage-discharge relation is changed temporarily because of aquatic growth ordebris on the control. For some stations, formation of ice in the winter may so obscure thestage-discharge relations that daily mean discharges must be estimated from other information such astemperature and precipitation records, notes of observations, and records for other stations in thesame or nearby basins for comparable periods.
At some stream-gaging stations, the stage-discharge relation is affected by the backwater fromreservoirs, tributary streams, or other sources. This necessitates the use of the slope method inwhich the slope or fall in a reach of the stream is a factor in computing discharge. The slope or fallis obtained by means of an auxiliary gage set at some distance from the base gage. At some stations thestage-discharge relation is affected by changing stage; at these stations the rate of change in stageis used as a factor in computing discharge.
At some gaging stations, acoustic velocity meter (AVM) systems are used to compute discharge. TheAVM system measures the stream’s velocity at one or more paths in the cross section. Coefficients aredeveloped to relate this path velocity to the mean velocity in the cross section. Because the AVMsensors are fixed in position, the adjustment coefficients generally vary with stage. Cross-sectionalarea curves are developed to relate stage, recorded as noted above, to cross section area. Dischargeis computed by multiplying path velocity by the appropriate stage related coefficient and area.
In computing records of lake or reservoir contents, it is necessary to have available fromsurveys, curves or tables defining the relationship of stage and content. The application of stage tothe stage-content curves or tables gives the contents from which daily, monthly, or yearly changesthen are determined.
If the stage-content relationship changes because of deposition of sediment in a lake orreservoir, periodic resurveys may be necessary to redefine the relationship. Even when this is done,the contents computed may become increasingly in error as the lapsed time since the last surveyincreases. Discharges over lake or reservoir spillways are computed from stage-discharge relationshipsmuch as other stream discharges are computed.
For some gaging stations, there are periods when no gage-height record is obtained, or therecorded gage height is so faulty that it cannot be used to compute daily discharge or contents. Thishappens when the recorder stops or otherwise fails to operate properly, intakes are plugged, the floatis frozen in the well, or for various other reasons.
For such periods, the daily discharges are estimated from the recorded range in stage, previous orfollowing record, discharge measurements, weather records, and comparison with other station recordsfrom the same or nearby basins. Likewise, daily contents may be estimated from operator’s logs,previous or following record, inflow-outflow studies, and other information. Information explaininghow estimated daily-discharge values are identified in station records is included in the next twosections, “Data Presentation” (REMARKS paragraph) and “Identifying Estimated Daily Discharge.”
Data Presentation
Streamflow data in this report are presented in a new format that is considerably different fromthe format in data reports prior to the 1991 water year. The major changes are that statisticalcharacteristics of discharge now appear in tabular summaries following the water-year data table andless information is provided in the text or state manuscript above the table. These changes representthe results of a pilot program to reformat the annual water-data report to meet current user needs anddata preference.
The records published for each continuous-record surface-water discharge station (gaging station)now consist of four parts, the manuscript or station description; the data table of daily mean valuesof discharge for the current water year with summary data; a tabular statistical summary of monthlymean flow data for a designated period, by water year; and a summary statistics table that includesstatistical data of annual, daily and instantaneous flows as well as data pertaining to annual runoff,7-day low-flow minimums, and flow duration.
WATER RESOURCES DATA - FLORIDA, 2001
VOLUME 2A: SOUTH FLORIDA
16
Station manuscript
The manuscript provides, under various headings, descriptive information, such as station location;period of record; historical extremes outside the period of record; record accuracy; and other remarkspertinent to station operation and regulation. The following information, as appropriate, is providedwith each continuous record of discharge or lake content. Comments to follow clarify informationpresented under the various headings of the station description.
LOCATION.--Information on locations is obtained from the most accurate base maps available. Thelocation of the gage with respect to the cultural and physical features in the vicinity and with respectto the reference place mentioned in the station name is given. River mileages, given for only a fewstations, were determined by methods given in "River Mileage Measurements," Bulletin 14, Revision ofOctober 1968, prepared by the Water Resources Council or were provided by the U.S. Army Corps ofEngineers.
DRAINAGE AREA.--Drainage areas are measured using the most accurate maps available. Because the typeof maps available varies from one drainage basin to another, the accuracy of drainage areas likewisevaries. Drainage areas are updated as better maps become available.
PERIOD OF RECORD.--This indicates the period for which there are published records for the stationor for an equivalent station. An equivalent station is one that was in operation at a time that thepresent station was not, and whose location was such that records from it can reasonably be consideredequivalent with records from the present station.
REVISED RECORDS.--Because of new information, published records occasionally are found to beincorrect, and revisions are printed in later reports. Listed under this heading are all the reports inwhich revisions have been published for the station and the water years to which the revisions apply. Ifa revision did not include daily, monthly, or annual figures of discharge, that fact is noted after theyear dates as follows: “(M)” means that only the instantaneous maximum discharge was revised; “(m)” thatonly the instantaneous minimum was revised; and “(P)” that only peak discharges were revised. If thedrainage area has been revised, the report in which the most recently revised figure was first publishedis given.
GAGE.--The type of gage in current use, the datum of the current gage referred to National GeodeticVertical Datum of 1929 (see GLOSSARY), and a condensed history of the types, locations, and datums ofprevious gages are given under this heading.
REMARKS.--All periods of estimated daily-discharge record will either be identified by date in thisparagraph of the station description for water-discharge stations or flagged in the daily-dischargetable. (See next section, “Identifying Estimated Daily Discharge.”) If a REMARKS statement is used toidentify estimated record, the paragraph will begin with this information presented as the first entry.The paragraph is also used to present information relative to the accuracy of the records, to specialmethods of computation, to conditions that affect natural flow at the station and, possibly, to otherpertinent items. For reservoir stations, information is given on the dam forming the reservoir, thecapacity, outlet works and spillway, and purpose and use of the reservoir.
COOPERATION.--Records provided by a cooperating organization or obtained for the Geological Surveyby a cooperating organization are identified here.
EXTREMES FOR PERIOD OF RECORD.--Extremes may include maximum and minimum stages. The highest stagemay have been obtained from a graphic or digital recorder, a crest-stage gage, or by direct observationof a nonrecording gage. If the maximum stage did not occur on the same day as the maximum discharge orcontent, it is given separately. Similarly, the minimum is the instantaneous minimum discharge, unlessotherwise qualified, and was determined and is reported in the same manner as the maximum.
EXTREMES OUTSIDE PERIOD OF RECORD.--Included here is information concerning major floods orunusually low flows that occurred outside the stated period of record. The information may or may nothave been obtained by the U.S. Geological Survey.
EXTREMES FOR CURRENT YEAR.--Extremes given here are similar to those for the period of record.
REVISIONS.--If a critical error in published records is discovered, a revision is included in thefirst report published following discovery of the error.
Although rare, occasionally the records of a discontinued gaging station may need revision.Because, for these stations, there would be no current or, possibly, future station manuscript publishedto document the revision in a “Revised Records” entry, users of data for these stations who obtained therecord from previously published data reports may wish to contact the offices whose addresses are givenon the back of the title page of this report to determine if the published records were ever revisedafter the station was discontinued. Of course, if the data were obtained by computer retrieval, the datawould be current and there would be no need to check because any published revision of data is alwaysaccompanied by revision of the corresponding data in computer storage.
WATER RESOURCES DATA - FLORIDA, 2001
VOLUME 2A: SOUTH FLORIDA
17
Manuscript information for lake or reservoir stations differs from that for stream stations in thenature of the “Remarks” and in the inclusion of a skeleton stage-capacity table when daily contents aregiven.
Heading for AVERAGE DISCHARGE has been deleted and the information contained in this paragraph isnow presented in the tabular summaries following the discharge table or in the REMARKS paragraph, asappropriate. No changes have been made to the data presentations of lake contents.
Daily table of daily mean values
The daily table of discharge records for stream-gaging stations gives mean discharge for each dayof the water year. In the monthly summary for the table, the line headed "TOTAL" gives the sum of thedaily figures for each month; the line headed "MEAN" gives the average flow in cubic feet per secondfor the month; and the lines headed "MAX" and "MIN" give the maximum and minimum daily mean discharges,respectively, for each month. Discharge for the month also is usually expressed in cubic feet persecond per square mile (line headed "CFSM"); or in inches. (line headed "IN."); or in acre-feet (lineheaded "AC-FT"). Figures for cubic feet per second per square mile and runoff in inches or in acre-feetmay be omitted if there is extensive regulation or diversion or if the drainage area includes largenoncontributing areas. At some stations monthly and (or) yearly observed discharges are adjusted forreservoir storage or diversion, or diversion data or reservoir contents are given. These figures areidentified by a symbol and corresponding footnote.
Statistics of monthly mean data
A tabular summary of the mean (line headed "MEAN"), maximum (line headed "MAX"), and minimum (lineheaded "MIN") of monthly mean flows for each month for a designated period is provided below the meanvalues table. The water years of the first occurrence of the maximum and minimum monthly flows areprovided immediately below those figures. The designated period will be expressed as "FOR WATER YEAR_____-_____, BY WATER YEAR (WY)," and will list the first and last water years of the range of yearsselected from the PERIOD OF RECORD paragraph in the station manuscript. It will consists of all of thestation record within the specified water years, inclusive, including complete months of record forpartial water years, if any, and may coincide with the period of record for the station. The wateryears for which the statistics are computed will be consecutive, unless a break in the station recordis indicated in the manuscript.
Summary statistics
A table titled "SUMMARY STATISTIC" follows the statistics of monthly mean data tabulation. Thistable consists of four columns, with the first column containing the line headings of the statisticsbeing reported. The table provides a statistical summary of yearly, daily, and instantaneous flows,not only for the current water year but also for the previous calendar year and for a designatedperiod, as appropriate. The designated period selected, "WATER YEARS _____-_____," will consist ofall of the station record within the specified water years, inclusive, including complete months ofrecord for partial water years, if any, and may coincide with the period of record for the station.
The water years for which the statistics are computed will be consecutive, unless a break in thestation record is indicated in the manuscript.
All of the calculations for the statistical characteristics designated ANNUAL (See line headingsbelow), except for the "ANNUAL 7-DAY MINIMUM" statistics, are calculated for the designated periodusing complete water years. The other statistical characteristics may be calculated using partialwater years.
The date or water year, as appropriate, of the first occurrence of each statistics reportingextreme values of discharge is provided adjacent to the statistic. Repeated occurrences may be notedin the REMARKS paragraph of the manuscript or in footnotes. Because the designated period may not bethe same as the station period of record published in the manuscript, occasionally the dates ofoccurrence listed for the daily and instantaneous extremes in the designated-period column may not bewithin the selected water years listed in the heading. When this occurs, it will be noted in theREMARKS paragraph or in footnotes. Selected streamflow duration curve statistics and runoff data arealso given. Runoff data may be omitted if there is extensive regulation or diversion of flow in thedrainage basin.
The following summary statistics data, as appropriate, are provided with each continuous record ofdischarge. Comments to follow clarify information presented under the various line headings of thesummary statistics table.
WATER RESOURCES DATA - FLORIDA, 2001
VOLUME 2A: SOUTH FLORIDA
18
ANNUAL TOTAL.--The sum of the daily mean values of discharge for the year. At some stations theannual total discharge is adjusted for reservoir storage or diversion. The adjusted figures areidentified by a symbol and corresponding footnotes.
ANNUAL MEAN.--The arithmetic mean of the individual daily mean discharges for the year noted or forthe designated period. At some stations the yearly mean discharge is adjusted for reservoir storage ordiversion. The adjusted figures are identified by a symbol and corresponding footnotes.
HIGHEST ANNUAL MEAN.--The maximum annual mean discharge occurring for the designated period.
LOWEST ANNUAL MEAN.--The minimum annual mean discharge occurring for the designated period.
HIGHEST DAILY MEAN.--The maximum daily mean discharge for the year or for the designated period.
LOWEST DAILY MEAN.--The minimum daily mean discharge for the year or for the designated period.
ANNUAL 7-DAY MINIMUM.--The lowest mean discharge for 7 consecutive days for a calendar year or awater year. Note that most low-flow frequency analyses of annual 7-day minimum flows use a climaticyear (April 1-March 31). The data shown in the summary statistics table is the initial date of the7-day period. (This value should not be confused with the 7-day 10-year low-flow statistic).
INSTANTANEOUS PEAK FLOW.--The maximum instantaneous discharge occurring for the water year or forthe designated period. Note that secondary instantaneous peak discharges above a selected basedischarge are stored in District computer files for stations meeting certain criteria. Those dischargevalues may be obtained by writing to the District Office. (See address on back of title page of thisreport).
INSTANTANEOUS PEAK STAGE.--The maximum instantaneous stage occurring for the water year or for thedesignated period. If the dates of occurrence for the instantaneous peak flow and instantaneous peakstage differ, the REMARKS paragraph in the manuscript or a footnote may be used to provide furtherinformation.
INSTANTANEOUS LOW FLOW.--The minimum instantaneous discharge occurring for the water year or for thedesignated period.
ANNUAL RUNOFF.--Indicates the total quantity of water in runoff for a drainage area for the year.Data reports may use any of the following units of measurement in presenting annual runoff data:
Acre-foot (AC-FT) is the quantity of water required to cover 1 acre to a depth of 1 foot and is equalto 43,560 cubic feet or about 326,000 gallons or 1,233 cubic meters.
Cubic feet per second per square mile (CFSM) is the average number of cubic feet of water flowing persecond from each square mile area drained, assuming the runoff is distributed uniformly in time andarea.
Inches (INCHES) indicates the depth to which the drainage area would be covered if all of the runofffor a given time period were uniformly distributed on it.
10 PERCENT EXCEEDS.--The discharge that has been exceeded 10 percent of the time for the designatedperiod.
50 PERCENT EXCEEDS.--The discharge that has been exceeded 50 percent of the time for the designatedperiod.
90 PERCENT EXCEEDS.--The discharge that has been exceeded 90 percent of the time for the designatedperiod.
Data collected at partial-record stations follow the information for continuous-record sites. Data
WATER RESOURCES DATA - FLORIDA, 2001
VOLUME 2A: SOUTH FLORIDA
19
for partial-record discharge stations are presented in two tables. The first is a table of annualmaximum stage and discharge at crest-stage stations, and the second is a table of dischargemeasurements at low-flow partial-record stations. The tables of partial-record stations are followedby a listing of discharge measurements made at sites other than continuous-record or partial-recordstations. These measurements are generally made in times of drought or flood to give better arealcoverage to those events. Those measurements and others collected for some special reason are calledmeasurements at miscellaneous sites.
Identifying Estimated Daily Discharge
Estimated daily-discharge values published in the water-discharge tables of annual State datareports are identified either by flagging individual daily values with the letter symbol “e” andprinting a table footnote, “e Estimated,” or by listing the dates of the estimated record in theREMARKS paragraph of the station description.
Accuracy of the Records
The accuracy of streamflow records depends primarily on: (1) The stability of the stage-dischargerelation or, if the control is unstable, the frequency of discharge measurements; and (2) the accuracyof measurements of stage, measurements of discharge, and interpretation of records.
The accuracy attributed to the records is indicated under “REMARKS.” “Excellent” means that about95 percent of the daily discharges are within 5 percent of their true values; “good,” within 10percent; and “fair,” within 15 percent. Records that do not meet the criteria mentioned are rated“poor.” Different accuracies may be attributed to different parts of a given record.
Daily mean discharges in this report are given to the nearest hundredth of a cubic foot per secondfor values less than 1 ft3/s; to the nearest tenth between 1.0 and 10 ft3/s; to whole numbers between10 and 1,000 ft3/s; and to 3 significant figures for more than 1,000 ft3/s. The number of significantfigures used is based solely on the magnitude of the discharge value. The same rounding rules apply todischarges listed for partial-record stations and miscellaneous sites.
Discharge at many stations, as indicated by the monthly mean, may not reflect natural runoff dueto the effects of diversion, consumption, regulation by storage, increase or decrease in evaporationdue to artificial causes, or to other factors. For such stations, figures of cubic feet per second persquare mile and of runoff, in inches, are not published unless satisfactory adjustments can be made fordiversions, for changes in contents of reservoirs, or for other changes incident to use and control.Evaporation from a reservoir is not included in the adjustments for changes in reservoir contents,unless it is so stated. Even at those stations where adjustments are made, large errors in computedrunoff may occur if adjustments or losses are large in comparison with the observed discharge.
In March 1989, the National Water-Quality Laboratory discovered a bias in the turbidimetric methodfor sulfate analysis, indicating that values below 75 mg/L have a median positive bias of 2 mg/L abovethe true value for the period between 1982 and 1989. Sulfate values in this report have not beencorrected for this bias.
Other Records Available
Information used in the preparation of the records in this publication, such asdischarge-measurement notes, gage-height records, temperature measurements, and rating tables is onfile in the Miami Subdistrict Office of the Florida District. Also, most of the daily mean dischargesare in computer-readable form and have been analyzed statistically. Information on the availability ofthe unpublished information or on the results of statistical analyses of the published records may beobtained from the offices whose addresses are given on the back of the title page of this report.
WATER RESOURCES DATA - FLORIDA, 2001
VOLUME 2A: SOUTH FLORIDA
20
RECORDS OF SURFACE-WATER QUALITY
Records of surface-water quality ordinarily are obtained at or near stream-gaging stations becauseinterpretation of records of surface-water quality nearly always requires corresponding discharge data.Records of surface-water quality in this report may involve a variety of types of data and measurementfrequencies.
Classification of Records
Water-quality data for surface-water sites are grouped into one of three classifications. Acontinuing-record station is a site where data are collected on a regularly scheduled basis. Frequencymay be once or more times daily, weekly, monthly, or quarterly. A partial-record station is a site wherewater-quality data are collected systematically over a period of years, usually less frequently thanquarterly. A miscellaneous sampling site is a location other than a continuing or partial-record stationwhere random samples are collected to give better areal coverage to define water-quality conditions inthe river basin.
A careful distinction needs to be made between “continuing records,” as used in this report, and“continuous recordings,” which refers to a continuous graph or a series of discrete values punched atshort intervals on a paper tape. Some records of water quality, such as temperature and specificconductance, may be obtained through continuous recordings; however, because of costs, most data areobtained only monthly or less frequently.
Arrangement of Records
Water-quality records collected at a surface-water daily record station or a periodic observationstation are published immediately following that record, regardless of the frequency of samplecollection. Station number and name are the same for both records. Where a surface-water daily recordstation is not available or where the water quality differs significantly from that at the nearbysurface-water station, the continuing water-quality record is published with its own station number andname in the regular downstream-order sequence. Water-quality data for partial-record stations and formiscellaneous sampling sites appear in separate tables following the table of discharge measurements atmiscellaneous sites.
On-site Measurements and Sample Collection
In obtaining water-quality data, a major concern is assuring that the data obtained represent thequality of the water in its natural state. To assure this, certain measurements, such as watertemperature, pH, alkalinity, specific conductance, and dissolved oxygen, need to be made onsite when thesamples are taken. To assure that measurements made in the laboratory also represent the natural water,carefully prescribed procedures need to be followed in collecting the samples, in treating the samplesto prevent changes in quality pending analysis, and in shipping the samples to the laboratory.
Procedures for onsite measurements and for collecting, treating, and shipping samples are detailedin the TWRI Book 1, Chapter D2; Book 3, Chapter C2; and Book 5, Chapter A1, A3, and A4. These referencesare listed in the PUBLICATIONS ON THE TECHNIQUES OF WATER-RESOURCES INVESTIGATIONS section of thisreport. These methods are consistent with ASTM standards and generally follow ISO standards.
One sample can define adequately the water quality at a given time if the mixture of solutesthroughout the stream cross section is homogeneous. However, the concentration of solutes at differentlocations in the cross section may vary widely with different rates of water discharge, depending on thesource of material and the turbulence and mixing of the stream. Some streams must be sampled throughseveral vertical sections to obtain a representative sample needed for an accurate mean concentrationand for use in calculating load. All samples obtained for the National Stream Quality Accounting Network(see definitions) are obtained from at least several verticals. Whether samples are obtained from thecentroid of flow or from several verticals depends on flow conditions and other factors which must beevaluated by the collector.
Chemical-quality data published in this report are considered to be the most representative valuesavailable for the stations listed. The values reported represent water-quality conditions at the time ofsampling as much as possible, consistent with available sampling techniques and methods of analysis. Inthe rare case where an apparent inconsistency exists between a reported pH value and the relativeabundance of carbon dioxide species (carbonate and bicarbonate), the inconsistency is the result of aslight uptake of carbon dioxide from the air by the sample between measurement of pH in the field anddetermination of carbonate and bicarbonate in the laboratory. For stations equipped with water-qualitymonitors, the records consist of daily mean values for each constituent measured and are based upon unitvalues (hourly or 15-minute recordings).
WATER RESOURCES DATA - FLORIDA, 2001
VOLUME 2A: SOUTH FLORIDA
21
Water Temperature
Water temperatures are measured at most of the water-quality stations. In addition, watertemperatures are taken at time of discharge measurements for water-discharge stations. For stationswhere water temperatures are taken manually once or twice daily, the water temperatures are taken atabout the same time each day. Large streams have a small diurnal temperature change; shallow streamsmay have a daily range of several degrees and may follow closely the changes in air temperature. Somestreams may be affected by waste-heat discharges.
Sediment
Suspended-sediment concentrations are determined from samples collected by usingdepth-integrating samplers. Samples usually are obtained at several verticals in the cross section, ora single sample may be obtained at a fixed point and a coefficient applied to determine the meanconcentration in the cross sections.
During periods of rapidly changing flow or rapidly changing concentration, samples may have beencollected more frequently (twice daily or, in some instances, hourly). The published sedimentdischarges for days of rapidly changing flow or concentration were computed by the subdivided-daymethod (time-discharge weighted average). Therefore, for those days when the published sedimentdischarge value differs from the value computed as the product of discharge times mean concentrationtimes 0.0027, the reader can assume that the sediment discharge for that day was computed by thesubdivided-day method. For periods when no samples were collected, daily discharges of suspendedsediment were estimated on the basis of water discharge, sediment concentrations observed immediatelybefore and after the periods, and suspended-sediment loads for other periods of similar discharge.Methods used in the computation of sediment records are described in the TWRI Book 3, Chapters C1 andC3.
These methods are consistent with ASTM standards and generally follow ISO standards.
At other stations, suspended-sediment samples were collected periodically at many verticals in thestream cross section. Although data collected periodically may represent conditions only at the timeof observations, such data are useful in establishing seasonal relations between quality andstreamflow and in predicting long-term sediment-discharge characteristics of the stream. In additionto the records of suspended-sediment discharge, records of the periodic measurements of theparticle-size distribution of the suspended sediment and bed material are included for some stations.
Laboratory Measurements
Sediment samples, samples for biochemical-oxygen demand (BOD), samples for indicator bacteria,and daily samples for specific conductance are analyzed locally. All other samples are analyzed in theGeological Survey laboratory in Arvada, Colorado. Methods used in analyze sediment samples and tocompute sediment records are described in the TWRI Book 5, Chapter C1. Methods used by the U.S.Geological Survey laboratories are given in the TWRI Book 1, Chapter D2; Book 3, Chapter C2; and Book5, Chapters A1, A3, A4, and A5. These methods are consistent with ASTM standards and generally followISO standards.
WATER RESOURCES DATA - FLORIDA, 2001
VOLUME 2A: SOUTH FLORIDA
22
Data Presentation
For continuing-record stations, information pertinent to the history of station operation isprovided in descriptive headings preceding the tabular data. These descriptive headings give detailsregarding location, drainage area, period of record, type of data available, instrumentation, generalremarks, cooperation, and extremes for parameters currently measured daily. Tables of chemical,physical, biological, radiochemical data, and so forth, obtained at a frequency less than daily arepresented first. Tables of “daily values” of specific conductance, pH, water temperature, dissolvedoxygen, and suspended sediment then follow in sequence.
In the descriptive headings, if the location is identical to that of the discharge gaging station,neither the LOCATION nor the DRAINAGE AREA statements are repeated. The following information, asappropriate, is provided with each continuous-record station. Comments that follow clarify informationpresented under the various headings of the station description.
LOCATION.--See Data Presentation under “Records of Stage and Water Discharge”; same comments apply.
DRAINAGE AREA.--See Data Presentation under “Records of Stage and Water Discharge”; same commentsapply.
PERIOD OF RECORD.--This indicates the periods for which there are published water-quality recordsfor the station. The periods are shown separately for records of parameters measured daily orcontinuously and those measured less than daily. For those measured daily or continuously, periods ofrecord are given for the parameters individually.
INSTRUMENTATION.--Information on instrumentation is given only if a recording or sampling device,which may be time- or event-activated, is in operation at a station.
REMARKS.--Remarks provide added information pertinent to the collection, analysis, or computationof the records.
COOPERATION.--Records provided by a cooperating organization or obtained for the Geological Surveyby a cooperating organization are identified here.
EXTREMES.--Maximums and minimums are given only for parameters measured daily or more frequently.None are given for parameters measured weekly or less frequently, because the true maximums or minimumsmay not have been sampled. Extremes, when given, are provided for both the period of record and for thecurrent water year.
REVISIONS.--If errors in published water-quality records are discovered after publication,appropriate updates are made to the Water-Quality File in the U.S. Geological Survey’s computerized datasystem, WATSTORE, and subsequently by monthly transfer of update transactions to the U.S. EnvironmentalProtection Agency’s STORET system. Because the usual volume of updates makes it impractical to documentindividual changes in the State data- report series or elsewhere, potential users of U.S. GeologicalSurvey water-quality data are encouraged to obtain all required data from the appropriate computer fileto ensure the most recent updates.
WATER RESOURCES DATA - FLORIDA, 2001
VOLUME 2A: SOUTH FLORIDA
23
WATER-QUALITY RECORDS
Remark Codes
The following remark codes may appear with the water-quality data in this section:
PRINTED OUTPUT REMARK
E Value is estimated.
> Actual value is known to be greater than the value shown.
< Actual value is known to be less than the value shown.
M Presence of material verified, but not quantified.
N Presumptive evidence of presence of material.
U Material specifically analyzed for, but not detected.
A Value is an average.
V Analyte was detected in both the environmental sample and the associated blanks.
S Most probable value.
WATER RESOURCES DATA - FLORIDA, 2001
VOLUME 2A: SOUTH FLORIDA
24
QUALITY-CONTROL DATA
Data generated from quality-control (QC) samples are a requisite for evaluating the quality of thesampling and processing techniques as well as data from the actual samples themselves.Without QC data,environmental sample data cannot be adequately interpreted because the errors associated with the sampledata are unknown. The various types of QC samples collected by this district are described in thefollowing section. Procedures have been established for the storage of water-quality-control data withinthe USGS. These procedures allow for storage of all derived QC data and are identified so that they canbe related to corresponding environmental samples.
Blank Samples
Blank samples are collected and analyzed to ensure that environmental samples have not beencontaminated by the overall data-collection process. The blank solution used to develop specific typesof blank samples is a solution that is free of the analytes of interest. Any measured value signal ina blank sample for an analyte (a specific component measured in a chemical analysis) that was absent inthe blank solution is believed to be due to contamination. There are many types of blank samplespossible, each designed to segregate a different part of the overall data-collection process. The typesof blank samples collected in this district are:
Source solution blank – a blank solution that is transferred to a sample bottle in an area of the office laboratory with an atmosphere that is relatively clean and protected with respect to target analytes.
Ambient blank – a blank solution that is put in the same type of bottle used for an envi-ronmental sample, kept with the set of sample bottles before sample collection, and opened at the site and exposed to the ambient conditions.
Field blank – a blank solution that is subjected to all aspects of sample collection, field processing preservation, transportation, and laboratory handling as an environmental sam-ple.
Trip blank – a blank solution that is put in the same type of bottle used for an environ-mental sample and kept with the set of sample bottles before and after sample collection.
Equipment blank – a blank solution that is processed through all equipment used for col-lecting and processing an environmental sample (similar to a field blank but normally done in the more controlled conditions of the office).
Sampler blank – a blank solution that is poured or pumped through the same field sampler used for collecting an environmental sample.
Pump blank – a blank solution that is processed through the same pump-and-tubing system used for an environmental sample.
Standpipe blank – a blank solution that is poured from the containment vessel (stand-pipe) before the pump is inserted to obtain the pump blank.
Filter blank – a blank solution that is filtered in the same manner and through the same filter apparatus used for an environmental sample.
Splitter blank - a blank solution that is mixed and separated using a field splitter in the same manner and through the same apparatus used for an environmental sam-ple.
Preservation blank – a blank solution that is treated with the sampler preserva-tives used for an environmental sample.
Canister blank – a blank solution that is taken directly from a stainless steel canister just before the VOC sampler is submerged to obtain a field blank sample.
WATER RESOURCES DATA - FLORIDA, 2001
VOLUME 2A: SOUTH FLORIDA
25
Reference Samples
Reference material is a solution or material prepared by a laboratory whose composition iscertified for one or more properties so that it can be used to assess a measurement method. Samplesof reference material are submitted for analysis to ensure that an analytical method is accurate forthe known properties of the reference material. Generally, the selected reference material propertiesare similar to the environmental sample properties.
Replicate Samples
Replicate samples are a set of environmental samples collected in a manner such that the samplesare thought to be essentially identical in composition. Replicate is the general case for which aduplicate is the special case consisting of two samples. Replicate samples are collected and analyzedto establish the amount of variability in the data contributed by some part of the collection andanalytical process. There are many types of replicate samples possible, each of which may yieldslightly different results in a dynamic hydrologic setting, such as a flowing stream. The types ofreplicate samples collected in this district are:
Concurrent sample – a type of replicate sample in which the samples are collected simultaneously with two or more samplers or by using one sampler and alternating collection of samples into two or more compositing containers.
Sequential sample – a type of replicate sample in which the samples are collected one after the other, typically over a short time.
Split sample – a type of replicate sample in which a sample is split into subsamples contemporaneous in time and space.
Spike Samples
Spike samples are samples to which known quantities of a solution with one or more well-establishedanalyte concentrations have been added. These samples are analyzed to determine the extent of matrixinterference or degradation on the analyte concentration during sample processing and analysis.
Concurrent sample – a type of spike sample that is collected at the same time with the same sampling and compositing devices then spiked with the same spike solution containing lab-oratory-certified concentrations of selected analytes
Split sample – a type of spike sample in which a sample is split into subsamples con-temporaneous in time and space then spiked with the same spike solution containing labora-tory-certified concentrations of selected analytes.
RECORDS OF GROUND-WATER LEVELS
Ground-water level data from a statewide network of observation wells are published herein. Therecords include data from wells equipped with water-level recorders and data from wells where waterlevels are measured periodically.
Data Collection and Computation
Measurements of water levels are made in many types of wells under varying conditions, but themethods of measurement are standardized to the extent possible. The equipment and measuring techniquesused at each observation well ensure that measurements at each well are of consistent accuracy andreliability.
Tables of water-level data are presented by counties arranged in alphabetical order. The primeidentification number for a given well is the 15-digit number that appears in the upper left corner ofthe table.
Water-level records are obtained from direct measurements with a steel tape, pressure gage,manometer, or from the graph or punched tape of a water-level recorder. The measurements in this reportare given in feet above National Geodetic Vertical Datum of 1929 or in some tables as feet belowland-surface datum. Land-surface datum is a datum plane that is approximately at land surface at eachwell. The elevation of the land-surface datum is given in the well description. The height of themeasuring point (MP) above or below land-surface datum is given in each well description.
WATER RESOURCES DATA - FLORIDA, 2001
VOLUME 2A: SOUTH FLORIDA
26
Accuracy of Ground-Water Level Data
A number of factors affect the accuracy of the ground-water-level data published in this report.These factors can be logically separated into those that are related to ground-water-level measurementmethods (Method-Related Factors) and those that are independent of the methods.
Method-Related Factors
Water-level data are collected using a number of different methods. Each method has inherent factorsthat affect the accuracy of measured water levels.
STEEL TAPE AND CHALK -- This generally is the most accurate method of measuring the elevationdifference between a reference point and the water level in a ground-water well. When the water level ismeasured using this method, at least two separate measurements are performed. These measurements mustagree to within 0.02 ft before the average value is recorded. The precision of this method, is + 0.02ft.
PRESSURE GAGE -- Wells under artesian pressure are monitored using a mechanical pressure gage. Thesepressure gages are graduated to 0.2 ft. Gages are periodically checked using a pressure manifold tocompare gage readings over a range of known pressures. Corrections are applied to the gage readingsbased on these checks. The reported value is estimated to the nearest tenth of a foot. The precision ofthis method should be considered to be about + 0.1 ft.
FLOAT AND RECORDER -- The accuracy of data recorded using this method is affected by friction withinthe recorder system as well as friction between the float and the well casing. In large-diameter wells(6 in. or greater), where large floats are used, these effects are minimal; however in small-diameterwells (2 to 6 in.) these effects can be substantial. Friction might significantly affect the data wherewater-surface fluctuations are very small. Every effort has been made to reduce frictional effects to aminimum.
The accuracy of this method may also be affected by slippage of the float tape or wire, leaks in thefloat, or biological factors (for example, amphibians crawling on the float). The accuracy of therecorder reading is periodically verified using steel tape and chalk measurements. When the differencebetween these tape measurements and the recorded value is 0.05 ft or greater, the recorder is reset anda gage-height correction is applied to the data. Uncertainty in water levels for wells verified by steeltape measurements is generally no greater than + 0.05 ft.
PRESSURE TRANSDUCER AND RECORDER -- In wells where artesian pressure, frictional effects, or anextensive range in water levels have made float and recorder systems infeasible, pressure transducershave been installed. Transducers are selected that meet or exceed the float and recorder systemaccuracy. Water levels may be verified using either steel tape or pressure gage measurements.Uncertainty in those verified by steel-tape measurements is generally considered to be no greater than+ 0.05 ft and uncertainty for those verified using pressure gage readings is generally considered to beabout + 0.1 ft.
The type of method used to collect water-level data is identified in the INSTRUMENTATION section ofeach station manuscript.
Method-Independent Factors
Water levels are determined using a specific measuring point (MP) at each well. The elevation ofthis point for most wells published in this report was determined relative to the National GeodeticVertical Datum of 1929 (NGVD of 1929). Scientific advances in determining vertical elevations havecaused the development of the North American Vertical Datum of 1988 (NAVD of 88). The National GeodeticSurvey (NGS) has completed an extensive releveling effort that provides elevations referenced to NAVD of1988. Comparisons at specific benchmarks in Florida have indicated differences between NAVD of 88 andNGVD of 1929 of 0.50 ft or greater (Zilkoske, 1990). The U.S. Geological Survey is currently consideringhow best to utilize the newer NAVD of 1988 and yet maintain the continuity of data in south Florida.
WATER RESOURCES DATA - FLORIDA, 2001
VOLUME 2A: SOUTH FLORIDA
27
Water levels in wells open to highly transmissive aquifers may be affected by barometric pressure.The extent of this effect in a given well is called the barometric efficiency (BE). The BE is calculatedby comparing the changes in water level at a well to the change in the ambient barometric pressureexpressed as a column of water (Kruseman and Ridder, 1991). The water-level data in this publicationhave not been adjusted for barometric pressure effects.
Data Presentation
Each well record consists of two parts, the station description, the data table of water levelsobserved during the water year and possibly a graph of the water year or other selected period. Thedescription of the well is presented first through use of descriptive headings preceding the tabulardata. The comments to follow clarify information presented under the various headings of welldescription.
LOCATION.--This paragraph follows the well-identification number and reports the latitude andlongitude (given in degrees, minutes, and seconds); a landline location designation; the hydrologic-unitnumber; the distance and direction from a geographic point of reference; and the owner’s name.
AQUIFER.--This entry designates by name (if a name exists) and geologic age the aquifer(s) open tothe well.
WELL CHARACTERISTICS.--This entry describes the well in terms of depth, diameter, casing depth and/or screened interval, method of construction, use, and additional information such as casing breaks,collapsed screen, and other changes since construction.
INSTRUMENTATION.--This paragraph provides information on both the frequency of measurement and thecollection method used, allowing the user to better evaluate the reported water-level extremes byknowing whether they are based on hourly, daily, weekly, monthly, or some other frequency ofmeasurement.
DATUM.--This entry describes both the measuring point and the land-surface elevation at the well.The measuring point is described physically (such as top of collar, notch in top of casing, plug in pumpbase and so on), and in relation to land surface (such as 1.3 ft. above land-surface datum). Theelevation of the land-surface datum is described in feet above (or below) National Geodetic VerticalDatum of 1929 (NGVD of 1929); it is reported with a precision depending on the method of determination.
REMARKS.--This entry describes factors that may influence the water level in a well or themeasurement of the water level. It should identify wells that also are water quality observation wellsand may be used to acknowledge the assistance of local (non-survey) observers.
PERIOD OF RECORD.--This entry indicates the period for which there are published records for thewell. It reports the month and year of the start of publication of water-level records by the U.S.Geological Survey and the words “to current year” if the records are to be continued into the followingyear. Periods for which water-level records are available, but are not published by the GeologicalSurvey, may be noted.
EXTREMES FOR PERIOD OF RECORD.--This entry contains the highest and lowest water levels of theperiod of record, with respect to land-surface datum, and the dates of their occurrence.
A table of water levels follows the station description for each well. For wells equipped withrecorders, only abbreviated tables are published; generally, daily maximums are listed for every fifthday and at the end of the month (eom). The highest and lowest water levels of the water year and theirdates of occurrence are shown on a line below the abbreviated table. Because all values are notpublished for wells with recorders, the extremes may be values that are not listed in the table. Missingrecords are indicated by dashes in place of the water level. A hydrograph for a selected period ofrecord may follow each water-level table.
WATER RESOURCES DATA - FLORIDA, 2001
VOLUME 2A: SOUTH FLORIDA
28
RECORDS OF BULK ELECTRICAL CONDUCTIVITY
Bulk conductivity is the combined electrical conductivity of all material (including pore water)within an approximately 8 to 40 inch doughnut shaped area surrounding an induction probe (McNeill andothers, 1990). Bulk conductivity is affected by different physical and chemical properties of the mate-rial including the dissolved solids content of the pore water and lithology and porosity of the rock.PVC casings do not interfere with these measurements but for those wells where a steel or galvanizediron casing extends part way down the well, the probe can not sense the materials outside of the casing.Usually, as the probe moves down the well and out of the influence of a metallic casing, a spike is cre-ated in the data. As the probe passes through different layers of rock, the different physical proper-ties will cause conductivity values to vary. Generally, a clean sand or sandstone will produce lowerconductivity values than clay or mudstone. While the properties of the rocks or well construction willremain constant from year to year, those of the porewater may change due to saline intrusion. Conductiv-ity values from freshwater-saturated rocks are typically less than 25 mS/m, whereas conductivity valuesfrom saltwater-saturated rocks are typically greater than 67 mS/m (Hittle, 1999). Therefore, inductionlogging can be used to assess increases or decreases in the conductivity of pore waters caused by move-ment of the saltwater interface.
Data Collection and Computation
Measurements are generally made during the period of lowest aquifer water levels in April of eachyear. However, some wells may have additional logs. During periods of decreased water-levels, saltwaterintrusion into a freshwater aquifer is likely at a maximum. In wells where saltwater is detectable, thegraphic representation of data from successive years will show any vertical movement of the saltwa-ter-freshwater interface. Measuring this vertical movement of the interface is the primary use of thebulk conductivity logs published in this report. Upward movement of the interface between freshwater andsaltwater in a monitoring well indicates that saltwater intrusion is increasing in that area. Downwardmovement of the interface indicates recession of the saltwater front near the monitoring well.
In the conductivity plots of some of the wells logged for this report, the interface position can beseen as the point where low values of conductivity increase suddenly to values generally above 67 mS/m(usually near the bottom of the well). However, the interface position is not as apparent in other wellsand in some, there is no interface.
In wells selected for induction logging, a water sample may be collected and analyzed as a check onthe level of salinity. Because the bulk conductivity is a function of fluid conductivity, lithology, andporosity, the relationship between these logs and the chloride samples may not be as obvious as therelationship between fluid conductivity and chloride concentrations generally are. If the rock is notvery porous then the change in bulk conductivity caused by changes in the salinity of the pore water maybe smaller than might be expected. None the less, the long-term changes in the bulk conductivity logsare sufficient to assess upward or downward movement of the interface. To aid in interpretation of thebulk conductivity logs whenever chloride samples are collected on the same day as that log, the chlorideconcentration is shown on the plot of bulk conductivity.
The instrument used to collect data for this report is calibrated prior to each field session. Thecalibration procedure results in a calibration factor that converts raw instrument readings into cali-brated values of conductivity. When data were graphed for the 2000 annual water resources data report,offsets and amplitude differentials occurred in the calibrated values of bulk conductivity for each wellbetween successive years. Investigation revealed that the discrepancies were a function of differingcalibration factors between years. Most calibration factors differed because of temperature and humiditydifferences during calibration procedures. Calibration procedures, adapted during the 2000 water year,are designed to minimize the influence of variable temperature and humidity. Before calibrating, theinduction probe was run into a well and allowed to equilibrate in the water column. The probe was thenremoved from the well and the instrument immediately calibrated.
Factors other than variable temperature and humidity also have caused offsets and amplitude differ-entials. Because of an error while calibrating the instrument for the 1998 water year, a high-end cali-bration parameter was used that differed from other years. The differing parameter caused a data offsetat higher ends of the scale. A second factor that may have caused data offset and amplitude differen-tials occurred with data collected for the 2000 water year. Prior to logging for the 2000 water year,the instrument was updated with respect to firmware and software. After logging, it was found that thedata had been truncated at the decimal point (see Accuracy of Bulk Conductivity).
WATER RESOURCES DATA - FLORIDA, 2001
VOLUME 2A: SOUTH FLORIDA
29
Accuracy of Bulk Conductivity
There are two components that affect the quality of the induction logs published in this report:(1) vertical or depth accuracy and (2) accuracy and precision of measured bulk conductivity. As indi-cated in the preceding section, the vertical accuracy which affects the interface position is the mostcritical factor in this monitoring effort. Therefore, as long as the interface is clearly indicated inthe logs of bulk conductivity, the accuracy with which its depth can be determined is the primary com-ponent of interest. A quality control program sets the velocity of the probe at 12 feet per minutewhile logging. Before logging begins, a spot on the probe, 3.32 feet above the sensing head, is alignedwith the measuring point of the well. Wherever possible, the data that was recorded as the probe wasmoved up the well was used to produce the plots for this report. Depth values between successive wateryears were adjusted, if needed, to coincide at explicitly identifiable conductivity peaks recordedfrom an upper part of the well. Depth values are interpolated to the nearest tenth of a foot. The pre-cision of depth determinations using this reporting method should be considered to be about +0.1 foot.
The accuracy and precision of measured bulk conductivity are a function of both the inherent accu-racy of the induction probe and its calibration. The inherent precision of the probe is considered bythe manufacturer to be +5 percent of the full scale. The induction probe was calibrated to a full scaleof 1,000 mS/m. This translates into a precision of + 50 mS/m at full scale. Analysis indicated that theoffsets caused by the effects of temperature and humidity on calibration were well within this range.
Accuracy of data collected during the 2000 water year may have been affected by the firmware orsoftware update in December, 1999. The data collected using this new software and firmware was consid-erably offset when compared to previous induction logs. In addition, the final values were truncatedat the decimal point, whereas those collected prior to the update were recorded to the thousandths dec-imal place. These final values are the result of a multiplication of the raw data from the instrumentand a calibration factor. It is unknown whether or not the raw values were truncated at the decimalpoint. If so, the resulting error could be on the order of 5 mS/m too low. Because the offsets datafrom the 2000 water year is often 5 mS/m lower than the data from other years, truncation of the rawdata is probably the explanation.
Data Presentation
Records of conductivity are published individually on the page immediately following the wellmanuscript. Data for conductivity are identified by well number. Each record consists of a singlegraph representing conductivity, a lithologic log, and a brief explanation.
WATER RESOURCES DATA - FLORIDA, 2001
VOLUME 2A: SOUTH FLORIDA
30
RECORDS OF GROUND-WATER QUALITY
Records of ground-water quality in this report differ from other types of records in that, for mostsampling sites, they consist of only one set of measurements for the water year. The quality of groundwater ordinarily changes slowly; therefore, for most general purposes, one annual sampling, or only afew samples taken at infrequent intervals during the year, is sufficient. Frequent measurement of thesame constituents is not necessary unless one is concerned with a particular problem, such as monitoringfor trends in nitrate concentration. In the special cases where the quality of ground water may changemore rapidly, more frequent measurements are made to identify the nature of the changes.
Data Collection and Computation
The records of ground-water quality in this report were obtained mostly as a part of specialstudies in specific areas. Consequently, a number of chemical analyses are presented for some countiesbut none are presented for others. As a result, the records for this year, by themselves, do not providea balanced view of ground-water quality in the report area. Such a view can be attained only byconsidering records for this year in context with similar records obtained for these and other countiesin earlier years.
Most methods for collecting and analyzing water samples are described in the U.S. Geological SurveyTWRI publications referred to in the "On-site Measurements and Sample Collection" and the "LaboratoryMeasurements" sections in this data report. In addition, the TWRI Book 1, Chapter D2, describesguidelines for the collection and field analysis of ground-water samples for selected unstableconstituents.
The values reported in this report represent water-quality conditions at the time of sampling asmuch as possible, consistent with available sampling techniques and methods of analysis. These methodsare consistent with ASTM standards and generally follow ISO standards. All samples were obtained bytrained personnel. The wells sampled were pumped long enough to assure that the water collected camedirectly from the aquifer and had not stood for a long time in the well casing where it would have beenexposed to the atmosphere and to the material, possibly metal, comprising the casings.
Data Presentation
The records of ground-water quality are published immediately following the ground-water-levelrecords of each county. Data for quality of ground water are identified by well number. The primeidentification number for wells sampled is the 15-digit number derived from the latitude-longitudelocations. The Remark Codes listed for surface-water-quality records are also applicable toground-water-quality records.
ACCESS TO USGS WATER DATA
The USGS provides near real-time stage and discharge data for many of the gaging stations equippedwith the necessary telemetry and historic daily-mean and peak-flow discharge data for most current ordiscontinued gaging stations through the world wide web (WWW). These data may be accessed at:
http://water.usgs.gov
Some water-quality and ground-water data also are available through the WWW. In addition, data canbe provided in various machine-readable formats on magnetic tape or 3-1/2 inch floppy disk. Informationabout the availability of specific types of data products, and user charges, can be obtained locallyfrom each of the Water Resources Division District Offices (See address on the back of the title page).
WATER RESOURCES DATA - FLORIDA, 2001
VOLUME 2A: SOUTH FLORIDA
31
DEFINITION OF TERMS
Specialized technical terms related to streamflow, water-quality, and other hydrologic data, as usedin this report, are defined below. Terms such as algae, water level, precipitation are used in theircommon everyday meanings, definitions of which are given in standard dictionaries. Not all terms definedin this alphabetical list apply to every State. See also table for converting English units toInternational System (SI) Units on the inside of the back cover.
Acid neutralizing capacity (ANC) is the equivalent sum of all bases or base-producing materials, solutes plus particulates, in an aqueous system that can be titrated with acid to an equivalence point. This term designates titration of an “unfiltered” sample (formerly reported as alka-linity).
Acre-foot (AC-FT, acre-ft) is a unit of volume, commonly used to measure quantities of water used or stored, equivalent to the volume of water required to cover 1 acre to a depth of 1 foot and equivalent to 43,560 cubic feet, 325,851 gallons, or 1,233 cubic meters. (See also “Annual runoff”)
Adenosine triphosphate (ATP) is an organic, phos-phate-rich, compound important in the transfer of energy in organisms. Its central role in living cells makes ATP an excellent indicator of the presence of living material in water. A measure-ment of ATP therefore provides a sensitive and rapid estimate of biomass. ATP is reported in micrograms per liter.
Algal growth potential (AGP) is the maximum algal dry weight biomass that can be produced in a nat-ural water sample under standardized laboratory conditions. The growth potential is the algal biomass present at stationary phase and is expressed as milligrams dry weight of algae pro-duced per liter of sample.
Alkalinity is the capacity of solutes in an aqueous system to neutralize acid. This term designates titration of a “filtered” sample.
Annual runoff is the total quantity of water that is discharged (“runs off”) from a drainage basin in a year. Data reports may present annual runoff data as volumes in acre-feet, as discharges per unit of drainage area in cubic feet per second per square mile, or as depths of water on the drainage basin in inches.
Annual 7-day minimum is the lowest mean value for any 7-consecutive-day period in a year. Annual 7-day minimum values are reported herein for the calendar year and the water year (October 1 to September 30). Most low-flow frequency analyses use a climatic year (April 1-March 31), which tends to prevent the low-flow period from being artificially split between adjacent years. The date shown in the summary statistics table is the initial date of the 7-day period. (This value should not be confused with the 7-day 10-year low-flow statistic.)
Aroclor is the registered trademark for a group of polychlorinated biphenyls that were manufactured by the Monsanto Company prior to 1976. Aroclors are assigned specific 4-digit reference numbers dependent upon molecular type and degree of sub-
stitution of the biphenyl ring hydrogen atoms by chlorine atoms. The first two digits of a num-bered aroclor represent the molecular type and the last two digits represent the weight percent of the hydrogen substituted chlorine.
Artificial substrate is a device that is purposely placed in a stream or lake for colonization of organisms. The artificial substrate simplifies the community structure by standardizing the sub-strate from which each sample is taken. Examples of artificial substrates are basket samplers (made of wire cages filled with clean streamside rocks) and multiplate samplers (made of hard-board) for benthic organism collection, and plexiglass strips for periphyton collection. (See also “Substrate”)
Ash mass is the mass or amount of residue present after the residue from the dry mass determination has been ashed in a muffle furnace at a tempera-
ture of 500 °C for 1 hour. Ash mass of zooplankton and phytoplankton is expressed in grams per cubic
meter (g/m3), and periphyton and benthic organ-
isms in grams per square meter (g/m2). (See also “Biomass”)
Bacteria are microscopic unicellular organisims, typically spherical, rodlike, or spiral and threadlike in shape, often clumped into colonies. Some bacteria cause disease, while others perform an essential role in nature in the recycling of materials; for example, by decomposing organic matter into a form available for reuse by plants.
Base discharge (for peak discharge) is a discharge value, determined for selected stations, above which peak discharge data are published. The base discharge at each station is selected so that an average of about three peaks per year will be pub-lished.
Base flow is sustained flow of a stream in the absence of direct runoff. It includes natural and human-induced streamflows. Natural base flow is sustained largely by ground-water discharge.
Bedload is material in transport that is supported primarily by the streambed. In this report, bed-load is considered to consist of particles in transit from the bed to an elevation equal to the top of the bedload sampler nozzle (ranging from 0.25 to 0.5 ft) that are retained in the bedload sampler. A sample collected with a pressure-dif-ferential bedload sampler may also contain a com-ponent of the suspended load.
Bedload discharge (tons per day) is rate of sedi-ment moving as bedload, reported as dry weight, that passes through a cross section in a given time. NOTE: Bedload discharge values in this report may include a component of the suspended
WATER RESOURCES DATA - FLORIDA, 2001
VOLUME 2A: SOUTH FLORIDA
32
sediment discharge. A correction may be necessary when computing the total sediment discharge by summing the bedload discharge and the sus-pended-sediment discharge. (See also “Bedload” and “Sediment”)
Bed material is the sediment mixture of which a streambed, lake, pond, reservoir, or estuary bot-tom is composed. (See also “Bedload” and “Sedi-ment”)
Benthic organisms are the group of organisms inhab-iting the bottom of an aquatic environment. They include a number of types of organisms, such as bacteria, fungi, insect larvae and nymphs, snails, clams, and crayfish. They are useful as indicators of water quality.
Biochemical oxygen demand (BOD) is a measure of the quantity of dissolved oxygen, in milligrams per liter, necessary for the decomposition of organic matter by microorganisms, such as bacteria.
Biomass is the amount of living matter present at any given time, expressed as mass per unit area or volume of habitat.
Biomass pigment ratio is an indicator of the total proportion of periphyton which are autotrophic (plants). This is also called the Autotrophic Index.
Blue-green algae (Cyanophyta) are a group of phy-toplankton organisms having a blue pigment, in addition to the green pigment called chlorophyll. Blue-green algae often cause nuisance conditions in water. Concentrations are expressed as a num-ber of cells per milliliter (cells/mL) of sample. (See also “Phytoplankton”)
Bottom material (See “Bed material”)
Bulk conductivity is the combined electrical con-ductivity of all material (including pore water) within an approximately 8 to 40 inch doughnut shaped area surrounding an induction probe (McNeill and others, 1990). Bulk conductivity is affected by different physical and chemical prop-erties of the material including the dissolved solids content of the pore water and lithology and porosity of the rock.
Cells/volume refers to the number of cells of any organism that is counted by using a microscope and grid or counting cell. Many planktonic organ-isms are multicelled and are counted according to the number of contained cells per sample volume, and are generally reported as cells or units per milliliter (mL) or liter (L).
Cells volume (biovolume) determination is one of several common methods used to estimate biomass of algae in aquatic systems. Cell members of algae are frequently used in aquatic surveys as an indicator of algal production. However, cell numbers alone cannot represent true biomass because of considerable cell-size variation among
the algal species. Cell volume (µm3) is determined by obtaining critical cell measurements on cell dimensions (for example, length, width, height, or radius) for 20 to 50 cells of each important species to obtain an average biovolume per cell. Cells are categorized according to the correspon-dence of their cellular shape to the nearest geo-
metric solid or combinations of simple solids (for example, spheres, cones, or cylinders). Rep-resentative formulae used to compute biovolume are as follows:
sphere 4/3 πr3 cone 1/3 πr3h cylinder πr3h.
pi is the ratio of the circumference to the diam-eter of a circle; pi = 3.14159…From cell volume, total algal biomass expressed
as biovolume (µm3/mL) is thus determined by mul-tiplying the number of cells of a given species by its average cell volume and then summing these volumes over all species.
Cfs-day (See “Cubic foot per second-day”)
Chemical oxygen demand (COD) is a measure of the chemically oxidizable material in the water and furnishes an approximation of the amount of organic and reducing material present. The deter-mined value may correlate with BOD or with car-bonaceous organic pollution from sewage or industrial wastes. [See also “Biochemical oxygen demand (BOD)”]
Clostridium perfringens (C. perfringens) is a spore-forming bacterium that is common in the feces of human and other warm-blooded animals. Clostridial spores are being used experimentally as an indicator of past fecal contamination and presence of microorganisms that are resistant to disinfection and environmental stresses. (See also “Bacteria”)
Coliphages are viruses that infect and replicate in coliform bacteria. They are indicative of sewage contamination of waters and of the survival and transport of viruses in the environment.
Color unit is produced by 1 milligram per liter of platinum in the form of the chloroplatinate ion. Color is expressed in units of the plati-num-cobalt scale.
Confined aquifer is a term used to describe an aquifer containing water between two relatively impermeable boundaries. The water level in a well tapping a confined aquifer stands above the top of the confined aquifer and can be higher or lower than the water table that may be present in the material above it. In some cases, the water level can rise above the ground surface, yielding a flowing well.
Contents is the volume of water in a reservoir or lake. Unless otherwise indicated, volume is com-puted on the basis of a level pool and does not include bank storage.
Continuous-record station is a site where data are collected with sufficient frequency to define daily mean values and variations within a day.
Control designates a feature in the channel down-stream from a gaging station that physically influences the water-surface elevation and thereby determines the stage-discharge relation at the gage. This feature may be a constriction of the channel, a bedrock outcrop, a gravel bar, an artificial structure, or a uniform cross section over a long reach of the channel.
Control structure as used in this report is a structure on a stream or canal that is used to
WATER RESOURCES DATA - FLORIDA, 2001
VOLUME 2A: SOUTH FLORIDA
33
regulate the flow or stage of the stream or to prevent the intrusion of saltwater.
Cubic foot per second (CFS, ft3/s) is the rate of discharge representing a volume of 1 cubic foot passing a given point in 1 second. It is equiva-lent to approximately 7.48 gallons per second or approximately 449 gallons per minute, or 0.02832 cubic meters per second. The term “second-feet” sometimes is used synonymously with “cubic feet per second” but is now obsolete.
Cubic foot per second-day (CFS-DAY, Cfs-day, [(ft3/s)/d]) is the volume of water represented by a flow of 1 cubic foot per second for 24 hours. It is equivalent to 86,400 cubic feet, 1.98347 acre-feet, 646,317 gallons, or 2,446.6 cubic meters. The daily-mean discharges reported in the daily-value data tables are numerically equal to the daily volumes in cfs-days, and the totals also represent volumes in cfs-days.
Cubic foot per second per square mile [CFSM, (ft3/
s)/mi2] is the average number of cubic feet of water flowing per second from each square mile of area drained, assuming the runoff is distributed uniformly in time and area. (See also “Annual runoff”)
Daily mean suspended-sediment concentration is the time-weighted concentration of suspended sediment passing a stream cross section during a 24-hour day. (See also “Mean concentration of suspended sediment,” “Sediment,” and “Suspended-sediment concentration”)
Daily-record station is a site where data are col-lected with sufficient frequency to develop a record of one or more data values per day. The frequency of data collection can range from con-tinuous recording to periodic sample or data col-lection on a daily or near-daily basis.
Data Collection Platform (DCP) is an electronic instrument that collects, processes, and stores data from various sensors, and transmits the data by satellite data relay, line-of-sight radio, and/or landline telemetry.
Data logger is a microprocessor-based data acquisi-tion system designed specifically to acquire, process, and store data. Data are usually down-loaded from onsite data loggers for entry into office data systems.
Datum is a surface or point relative to which mea-surements of height and/or horizontal position are reported. A vertical datum is a horizontal surface used as the zero point for measurements of gage height, stage, or elevation; a horizontal datum is a reference for positions given in terms of latitude-longitude, State Plane coordinates, or UTM coordinates. (See also “Gage datum,” “Land-surface datum,” “National Geodetic Vertical Datum of 1929,” and “North American Vertical Datum of 1988”)
Diatoms are the unicellular or colonial algae hav-ing a siliceous shell. Their concentrations are expressed as number of cells per milliliter (cells/mL) of sample. (See also “Phytoplankton”)
Diel is of or pertaining to a 24-hour period of time; a regular daily cycle.
Discharge, or flow, is the rate that matter passes through a cross section of a stream channel or other water body per unit of time. The term com-monly refers to the volume of water (including, unless otherwise stated, any sediments or other constituents suspended or dissolved in the water) that passes a cross section in a stream channel, canal, pipeline, etc., within a given period of time (cubic feet per second). Discharge also can apply to the rate at which constituents such as suspended sediment, bedload, and dissolved or suspended chemical constituents, pass through a cross section, in which cases the quantity is expressed as the mass of constituent that passes the cross section in a given period of time (tons per day).
Dissolved refers to that material in a representa-tive water sample that passes through a 0.45-micrometer membrane filter. This is a conve-nient operational definition used by Federal and State agencies that collect water-quality data. Determinations of “dissolved” constituent concen-trations are made on sample water that has been filtered.
Dissolved oxygen (DO) is the molecular oxygen (oxy-gen gas) dissolved in water. The concentration in water is a function of atmospheric pressure, tem-perature, and dissolved-solids concentration of the water. The ability of water to retain oxygen decreases with increasing temperature or dis-solved-solids concentration. Photosynthesis and respiration by plants commonly cause diurnal variations in dissolved-oxygen concentration in water from some streams.
Dissolved-solids concentration in water is the quantity of dissolved material in a sample of water. It is determined either analytically by the “residue-on-evaporation” method, or mathemat-ically by totaling the concentrations of individ-ual constituents reported in a comprehensive chemical analysis. During the analytical determi-nation, the bicarbonate (generally a major dis-solved component of water) is converted to carbonate. In the mathematical calculation, the bicarbonate value, in milligrams per liter, is multiplied by 0.4926 to convert it to carbonate. Alternatively, alkalinity concentration (as mg/L CaCO3) can be converted to carbonate concentra-
tion by multiplying by 0.60.
Diversity index (H) (Shannon Index) is a numerical expression of evenness of distribution of aquatic organisms. The formula for diversity index is:
where ni is the number of individuals per taxon, n
is the total number of individuals, and s is the total number of taxa in the sample of the commu-nity. Index values range from zero, when all the organisms in the sample are the same, to some pos-itive number, when some or all of the organisms in the sample are different.
dni
n----log2
ni
n----
i 1≈
s
∑–=
WATER RESOURCES DATA - FLORIDA, 2001
VOLUME 2A: SOUTH FLORIDA
34
Drainage area of a stream at a specific location is that area upstream from the location, measured in a horizontal plane, that has a common outlet at the site for its surface runoff from precipita-tion that normally drains by gravity into a stream. Drainage areas given herein include all closed basins, or noncontributing areas, within the area unless otherwise specified.
Drainage basin is a part of the Earth’s surface that contains a drainage system with a common outlet for its surface runoff. (See “Drainage area”)
Dry mass refers to the mass of residue present after drying in an oven at 105 °C, until the mass remains unchanged. This mass represents the total organic matter, ash and sediment, in the sample. Dry-mass values are expressed in the same units as ash mass. (See also “Ash mass,” “Biomass,” and “Wet mass”)
Dry weight refers to the weight of animal tissue
after it has been dried in an oven at 65 °C until a constant weight is achieved. Dry weight repre-sents total organic and inorganic matter in the tissue. (See also “Wet weight”)
Enterococcus bacteria are commonly found in the feces of humans and other warm-blooded animals. Although some strains are ubiquitous and not related to fecal pollution, the presence of enterococci in water is an indication of fecal pollution and the possible presence of enteric pathogens. Enterococcus bacteria are those bacte-ria that produce pink to red colonies with black or reddish-brown precipitate after incubation at
41 °C on mE agar and subsequent transfer to EIA medium. Enterococci include Streptococcus feaca-lis, Streptococcus feacium, Streptococcus avium, and their variants. (See also “Bacteria”)
EPT Index is the total number of distinct taxa within the insect orders Ephemeroptera, Plecop-tera, and Trichoptera. This index summarizes the taxa richness within the aquatic insects that are generally considered pollution sensitive, the index usually decreases with pollution.
Escherichia coli (E. coli) are bacteria present in the intestine and feces of warm-blooded animals. E. coli are a member species of the fecal coliform group of indicator bacteria. In the laboratory, they are defined as those bacteria that produce yellow or yellow-brown colonies on a filter pad saturated with urea substrate broth after primary culturing for 22 to 24 hours at 44.5 °C on mTEC medium. Their concentrations are expressed as number of colonies per 100 mL of sample. (See also “Bacteria”)
Estimated (E) value of a concentration is reported when an analyte is detected and all criteria for a positive result are met. If the concentration is less than the method detection limit (MDL), an ‘E’ code will be reported with the value. If the analyte is qualitatively identified as present, but the quantitative determination is substan-tially more uncertain, the National Water Quality Laboratory will identify the result with an ‘E’ code even though the measured value is greater than the MDL. A value reported with an ‘E’ code
should be used with caution. When no analyte is detected in a sample, the default reporting value is the MDL preceded by a less than sign (<).
Euglenoids (Euglenophyta) are a group of algae that are usually free-swimming and rarely creeping. They have the ability to grow either photosynthetically in the light or heterotrophi-cally in the dark. (See also “Phytoplankton”)
Extractable organic halides (EOX) are organic com-pounds that contain halogen atoms such as chlo-rine. These organic compounds are semi-volatile and extractable by ethyl acetate from air-dried streambed sediments. The ethyl acetate extract is combusted, and the concentration is determined by microcoulometric determination of the halides formed. The concentration is reported as micro-grams of chlorine per gram of the dry weight of the streambed sediments.
Fecal coliform bacteria are present in the intes-tine or feces of warm-blooded animals. They are often used as indicators of the sanitary quality of the water. In the laboratory, they are defined as all organisms that produce blue colonies within 24 hours when incubated at 44.5 °C plus or minus 0.2 °C on M-FC medium (nutrient medium for bacterial growth). Their concentrations are expressed as number of colonies per 100 mL of sam-ple. (See also “Bacteria”)
Fecal streptococcal bacteria are present in the intestine of warm-blooded animals and are ubiqui-tous in the environment. They are characterized as gram-positive, cocci bacteria that are capable of growth in brain-heart infusion broth. In the laboratory, they are defined as all the organisms that produce red or pink colonies within 48 hours at 35 °C plus or minus 1.0 °C on KF-streptococcus medium (nutrient medium for bacterial growth). Their concentrations are expressed as number of colonies per 100 mL of sample. (See also “Bacte-ria”)
Fire algae (Pyrrhophyta) are free-swimming unicells characterized by a red pigment spot. (See also “Phytoplankton”)
Flow-duration percentiles are values on a scale of 100 that indicate the percentage of time for which a flow is not exceeded. For example, the 90th percentile of river flow is greater than or equal to 90 percent of all recorded flow rates.
Gage datum is a horizontal surface used as a zero point for measurement of stage or gage height. This surface usually is located slightly below the lowest point of the stream bottom such that the gage height is usually slightly larger than the maximum depth of water. Because the gage datum itself is not an actual physical object, the datum usually is defined by specifying the elevations of permanent reference marks such as bridge abutments and survey monuments, and the gage is set to agree with the reference marks. Gage datum is a local datum that is maintained independently of any National geodetic datum. However, if the elevation of the gage datum rela-tive to the National datum (North American Verti-cal Datum of 1988 or National Geodetic Vertical Datum of 1929) has been determined, then the gage
WATER RESOURCES DATA - FLORIDA, 2001
VOLUME 2A: SOUTH FLORIDA
35
readings can be converted to elevations above the National datum by adding the elevation of the gage datum to the gage reading.
Gage height (G.H.) is the water-surface elevation, in feet above the gage datum. If the water surface is below the gage datum, the gage height is nega-tive. Gage height is often used interchangeably with the more general term “stage,” although gage height is more appropriate when used in reference to a reading on a gage.
Gage values are values that are recorded, transmit-ted and/or computed from a gaging station. Gage values typically are collected at 5-, 15-, or 30-minute intervals.
Gaging station is a site on a stream, canal, lake, or reservoir where systematic observations of stage, discharge, or other hydrologic data are obtained. When used in connection with a dis-charge record, the term is applied only to those gaging stations where a continuous record of dis-charge is computed.
Gas chromatography/flame ionization detector (GC/FID) is a laboratory analytical method used as a screening technique for semivolatile organic com-pounds that are extractable from water in methyl-ene chloride.
Green algae have chlorophyll pigments similar in color to those of higher green plants. Some forms produce algae mats or floating “moss” in lakes. Their concentrations are expressed as number of cells per milliliter (cells/mL) of sample. (See also “Phytoplankton”)
Habitat quality index is the qualitative descrip-tion (level 1) of instream habitat and riparian conditions surrounding the reach sampled. Scores range from 0 to 100 percent with higher scores indicative of desirable habitat conditions for aquatic life. Index only applicable to wadable streams.
Hardness of water is a physical-chemical character-istic that is commonly recognized by the increased quantity of soap required to produce lather. It is computed as the sum of equivalents of polyvalent cations (primarily calcium and mag-nesium) and is expressed as the equivalent con-centration of calcium carbonate (CaCO3).
High tide is the maximum height reached by each rising tide. The high-high and low-high tides are the higher and lower of the two high tides, respectively, of each tidal day. See NOAA web site: http://www.co-ops.nos.noaa.gov/tideglos.html
Hilsenhoff’s Biotic Index (HBI) is an indicator of organic pollution which uses tolerance values to weight taxa abundances; usually increases with pollution. It is calculated as follows:
where n is the number of individuals of each taxon, a is the tolerance value of each taxon, and N is the total number of organisms in the sample.
Horizontal datum (See “Datum”)
Hydrologic benchmark station is one that provides hydrologic data for a basin in which the hydro-logic regimen will likely be governed solely by natural conditions. Data collected at a benchmark station may be used to separate effects of natu-ral from human-induced changes in other basins that have been developed and in which the physi-ography, climate, and geology are similar to those in the undeveloped benchmark basin.
Hydrologic index stations referred to in this report are four continuous-record gaging stations that have been selected as representative of streamflow patterns for their respective regions. Station locations are shown on index maps.
Hydrologic unit is a geographic area representing part or all of a surface drainage basin or dis-tinct hydrologic feature as defined by the former Office of Water Data Coordination and delineated on the State Hydrologic Unit Maps by the USGS. Each hydrologic unit is identified by an 8-digit number.
Inch (IN., in.), as used in this report, refers to the depth to which the drainage area would be cov-ered with water if all of the runoff for a given time period were uniformly distributed on it. (See also “Annual runoff”)
Instantaneous discharge is the discharge at a par-ticular instant of time. (See also “Discharge”)
Laboratory Reporting Level (LRL) is generally equal to twice the yearly determined long-term method detection level (LT-MDL). The LRL controls false negative error. The probability of falsely reporting a non-detection for a sample that con-tained an analyte at a concentration equal to or greater than the LRL is predicted to be less than or equal to 1 percent. The value of the LRL will be reported with a “less than” (<) remark code for samples in which the analyte was not detected. The National Water Quality Laboratory collects quality-control data from selected analytical methods on a continuing basis to determine LT-MDLs and to establish LRLs. These values are reevaluated annually based on the most current quality-control data and may, therefore, change. [Note: In several previous NWQL documents (Connor and others, 1998; NWQL Technical Memorandum 98.07, 1998), the LRL was called the non-detec-tion value or NDV—a term that is no longer used.)
Land-surface datum (lsd) is a datum plane that is approximately at land surface at each ground-water observation well.
Light-attenuation coefficient, also known as the extinction coefficient, is a measure of water clarity. Light is attenuated according to the Lambert-Beer equation
,
where Io is the source light intensity, I is the
light intensity at length L (in meters) from the
source, λ is the light-attenuation coefficient, and e is the base of the natural logarithm. The light attenuation coefficient is defined as
.
HBI sumn( ) a( )
N----------------=
I IoeλL–
=
λ 1L---loge
IIo----–=
WATER RESOURCES DATA - FLORIDA, 2001
VOLUME 2A: SOUTH FLORIDA
36
Lipid is any one of a family of compounds that are insoluble in water and that make up one of the principal components of living cells. Lipids include fats, oils, waxes, and steroids. Many environmental contaminants such as organochlorine pesticides are lipophilic.
Long-Term Method Detection Level (LT–MDL) is a detection level derived by determining the stan-dard deviation of a minimum of 24 method detec-tion limit (MDL) spike sample measurements over an extended period of time. LT–MDL data are col-lected on a continuous basis to assess year-to-year variations in the LT–MDL. The LT–MDL controls false positive error. The chance of falsely reporting a concentration at or greater than the LT–MDL for a sample that did not contain the analyte is predicted to be less than or equal to 1 percent.
Low tide is the minimum height reached by each falling tide. The high-low and low-low tides are the higher and lower of the two low tides, respec-tively, of each tidal day. See NOAA web site: http://www.co-ops.nos.noaa.gov/tideglos.html
Macrophytes are the macroscopic plants in the aquatic environment. The most common macrophytes are the rooted vascular plants that are usually arranged in zones in aquatic ecosystems and restricted in the area by the extent of illumina-tion through the water and sediment deposition along the shoreline.
Mean concentration of suspended sediment (Daily mean suspended-sediment concentration) is the time-weighted concentration of suspended sediment passing a stream cross section during a given time period. (See also “Daily mean suspended-sed-iment concentration” and “Suspended-sediment con-centration”)
Mean discharge (MEAN) is the arithmetic mean of individual daily mean discharges during a spe-cific period. (See also “Discharge”)
Mean high or low tide is the average of all high or low tides, respectively, over a specific period.
Mean sea level is a local tidal datum. It is the arithmetic mean of hourly heights observed over the National Tidal Datum Epoch. Shorter series are specified in the name; for example, monthly mean sea level and yearly mean sea level. In order that they may be recovered when needed, such datums are referenced to fixed points known as benchmarks. (See also “Datum”)
Measuring point (MP) is an arbitrary permanent ref-erence point from which the distance to water surface in a well is measured to obtain water level.
Membrane filter is a thin microporous material of specific pore size used to filter bacteria, algae, and other very small particles from water.
Metamorphic stage refers to the stage of develop-ment that an organism exhibits during its trans-formation from an immature form to an adult form. This developmental process exists for most insects, and the degree of difference from the immature stage to the adult form varies from rel-atively slight to pronounced, with many interme-
diates. Examples of metamorphic stages of insects are egg-larva-adult or egg-nymph-adult.
Method Detection Limit (MDL) is the minimum concen-tration of a substance that can be measured and reported with 99-percent confidence that the ana-lyte concentration is greater than zero. It is determined from the analysis of a sample in a given matrix containing the analyte. At the MDL concentration, the risk of a false positive is predicted to be less than or equal to 1 percent.
Methylene blue active substances (MBAS) are appar-ent detergents. The determination depends on the formation of a blue color when methylene blue dye reacts with synthetic anionic detergent com-pounds.
Micrograms per gram (UG/G, µg/g) is a unit expressing the concentration of a chemical constituent as the mass (micrograms) of the element per unit mass (gram) of material analyzed.
Micrograms per kilogram (UG/KG, µg/kg) is a unit expressing the concentration of a chemical con-stituent as the mass (micrograms) of the constit-uent per unit mass (kilogram) of the material analyzed. One microgram per kilogram is equiva-lent to 1 part per billion.
Micrograms per liter (UG/L, µg/L) is a unit expressing the concentration of chemical constituents in water as mass (micrograms) of constituent per unit volume (liter) of water. One thousand micro-grams per liter is equivalent to 1 milligram per liter. One microgram per liter is equivalent to 1 part per billion.
Microsiemens per centimeter (US/CM, µS/cm) is a unit expressing the amount of electrical conductivity of a solution as measured between opposite faces of a centimeter cube of solution at a specified temperature. Siemens is the International System of Units nomenclature. It is synonymous with mhos and is the reciprocal of resistance in ohms.
Milligrams per liter (MG/L, mg/L) is a unit for expressing the concentration of chemical constit-uents in water as the mass (milligrams) of con-stituent per unit volume (liter) of water. Concentration of suspended sediment also is expressed in mg/L and is based on the mass of dry sediment per liter of water-sediment mixture.
Minimum Reporting Level (MRL) is the smallest mea-sured concentration of a constituent that may be reliably reported by using a given analytical method (Timme, 1995).
Miscellaneous site, miscellaneous station, or mis-cellaneous sampling site is a site where stream-flow, sediment, and/or water-quality data or water-quality or sediment samples are collected once, or more often on a random or discontinuous basis to provide better areal coverage for defin-ing hydrologic and water-quality conditions over a broad area in a river basin.
Most probable number (MPN) is an index of the num-ber of coliform bacteria that, more probably than any other number, would give the results shown by the laboratory examination; it is not an actual
WATER RESOURCES DATA - FLORIDA, 2001
VOLUME 2A: SOUTH FLORIDA
37
enumeration. MPN is determined from the distribu-tion of gas-positive cultures among multiple inoc-ulated tubes.
Multiple-plate samplers are artificial substrates of known surface area used for obtaining benthic invertebrate samples. They consist of a series of spaced, hardboard plates on an eyebolt.
Nanograms per liter (NG/L, ng/L) is a unit express-ing the concentration of chemical constituents in solution as mass (nanograms) of solute per unit volume (liter) of water. One million nanograms per liter is equivalent to 1 milligram per liter.
National Geodetic Vertical Datum of 1929 (NGVD of 1929) is a fixed reference adopted as a standard geodetic datum for elevations determined by level-ing. It was formerly called “Sea Level Datum of 1929” or “mean sea level.” Although the datum was derived from the mean sea level at 26 tide sta-tions, it does not necessarily represent local mean sea level at any particular place. See NOAA web site: http://www.ngs.noaa.gov/faq.shtml#WhatVD29VD88 (See “North American Ver-tical Datum of 1988”)
Natural substrate refers to any naturally occurring immersed or submersed solid surface, such as a rock or tree, upon which an organism lives. (See also “Substrate”)
Nekton are the consumers in the aquatic environment and consist of large free-swimming organisms that are capable of sustained, directed mobility.
Nephelometric turbidity unit (NTU) is the measure-ment for reporting turbidity that is based on use of a standard suspension of Formazin. Turbidity measured in NTU uses nephelometric methods that depend on passing specific light of a specific wavelength through the sample.
North American Vertical Datum of 1988 (NAVD 1988) is a fixed reference adopted as the official civilian vertical datum for elevations determined by Federal surveying and mapping activities in the U.S. This datum was established in 1991 by mini-mum-constraint adjustment of the Canadian, Mexi-can, and U.S. first-order terrestrial leveling networks.
Open or screened interval is the length of unscreened opening or of well screen through which water enters a well, in feet below land surface.
Organic carbon (OC) is a measure of organic matter present in aqueous solution, suspension, or bottom sediments. May be reported as dissolved organic carbon (DOC), particulate organic carbon (POC), or total organic carbon (TOC).
Organic mass or volatile mass of the living sub-stance is the difference between the dry mass and ash mass and represents the actual mass of the living matter. Organic mass is expressed in the same units as for ash mass and dry mass. (See also “Ash mass,” “Biomass,” and “Dry mass”)
Organism count/area refers to the number of organ-isms collected and enumerated in a sample and adjusted to the number per area habitat, usually
square meter (m2), acre, or hectare. Periphyton,
benthic organisms, and macrophytes are expressed in these terms.
Organism count/volume refers to the number of organisms collected and enumerated in a sample and adjusted to the number per sample volume, usually milliliter (mL) or liter (L). Numbers of plank-tonic organisms can be expressed in these terms.
Organochlorine compounds are any chemicals that contain carbon and chlorine. Organochlorine com-pounds that are important in investigations of water, sediment, and biological quality include certain pesticides and industrial compounds.
Parameter Code is a 5-digit number used in the USGS computerized data system, National Water Informa-tion System (NWIS), to uniquely identify a spe-cific constituent or property.
Partial-record station is a site where discrete measurements of one or more hydrologic parameters are obtained over a period of time without contin-uous data being recorded or computed. A common example is a crest-stage gage partial-record sta-tion at which only peak stages and flows are recorded.
Particle size is the diameter, in millimeters (mm), of a particle determined by sieve or sedimentation methods. The sedimentation method utilizes the principle of Stokes Law to calculate sediment par-ticle sizes. Sedimentation methods (pipet, bot-tom-withdrawal tube, visual-accumulation tube, Sedigraph) determine fall diameter of particles in either distilled water (chemically dispersed) or in native water (the river water at the time and point of sampling).
Particle-size classification, as used in this report, agrees with the recommendation made by the American Geophysical Union Subcommittee on Sedi-ment Terminology. The classification is as fol-lows:
The particle-size distributions given in this report are not necessarily representative of all particles in transport in the stream. Most of the organic matter is removed, and the sample is sub-jected to mechanical and chemical dispersion before analysis in distilled water. Chemical dis-persion is not used for native water analysis.
Peak flow (peak stage) is an instantaneous local maximum value in the continuous time series of streamflows or stages, preceded by a period of increasing values and followed by a period of decreasing values. Several peak values ordinarily occur in a year. The maximum peak value in a year is called the annual peak; peaks lower than the annual peak are called secondary peaks. Occasion-ally, the annual peak may not be the maximum value for the year; in such cases, the maximum value
WATER RESOURCES DATA - FLORIDA, 2001
VOLUME 2A: SOUTH FLORIDA
38
occurs at midnight at the beginning or end of the year, on the recession from or rise toward a higher peak in the adjoining year. If values are recorded at a discrete series of times, the peak recorded value may be taken as an approximation to the true peak, which may occur between the recording instants. If the values are recorded with finite precision, a sequence of equal recorded values may occur at the peak; in this case, the first value is taken as the peak.
Percent composition or percent of total is a unit for expressing the ratio of a particular part of a sample or population to the total sample or popu-lation, in terms of types, numbers, weight, mass, or volume.
Percent shading is determined by using a clinometer to estimate left and right bank shading. The val-ues are added together and divided by 180 to determine percent shading relative to a horizon-tal surface.
Periodic-record station is a site where stage, dis-charge, sediment, chemical, physical, or other hydrologic measurements are made one or more times during a year, but at a frequency insuffi-cient to develop a daily record.
Periphyton is the assemblage of microorganisms attached to and living upon submerged solid sur-faces. While primarily consisting of algae, they also include bacteria, fungi, protozoa, rotifers, and other small organisms. Periphyton are useful indicators of water quality.
Pesticides are chemical compounds used to control undesirable organisms. Major categories of pesti-cides include insecticides, miticides, fungi-cides, herbicides, and rodenticides.
pH of water is the negative logarithm of the hydro-gen-ion activity. Solutions with pH less than 7 are termed “acidic,” and solutions with a pH greater than 7 are termed “basic.” Solutions with a pH of 7 are neutral. The presence and concentra-tion of many dissolved chemical constituents found in water are, in part, influenced by the hydrogen-ion activity of water. Biological pro-cesses including growth, distribution of organ-isms, and toxicity of the water to organisms are also influenced, in part, by the hydrogen-ion activity of water.
Phytoplankton is the plant part of the plankton. They are usually microscopic, and their movement is subject to the water currents. Phytoplankton growth is dependent upon solar radiation and nutrient substances. Because they are able to incorporate as well as release materials to the surrounding water, the phytoplankton have a pro-found effect upon the quality of the water. They are the primary food producers in the aquatic environment and are commonly known as algae. (See also “Plankton”)
Picocurie (PC, pCi) is one trillionth (1 x 10-12) of the amount of radioactive nuclide represented by a curie (Ci). A curie is the quantity of radioac-
tive nuclide that yields 3.7 x 10¹⁰ radioactive disintegrations per second (dps). A picocurie
yields 0.037 dps, or 2.22 dpm (disintegrations per minute).
Plankton is the community of suspended, floating, or weakly swimming organisms that live in the open water of lakes and rivers. Concentrations are expressed as a number of cells per milliliter (cells/mL of sample).
Polychlorinated biphenyls (PCBs) are industrial chemicals that are mixtures of chlorinated biphe-nyl compounds having various percentages of chlo-rine. They are similar in structure to organochlorine insecticides.
Polychlorinated naphthalenes (PCNs) are industrial chemicals that are mixtures of chlorinated naph-thalene compounds. They have properties and applications similar to polychlorinated biphenyls (PCBs) and have been identified in commercial PCB preparations.
Primary productivity is a measure of the rate at which new organic matter is formed and accumu-lated through photosynthetic and chemosynthetic activity of producer organisms (chiefly, green plants). The rate of primary production is esti-mated by measuring the amount of oxygen released (oxygen method) or the amount of carbon assimi-lated (carbon method) by the plants.
Primary productivity (carbon method) is expressed as milligrams of carbon per area per unit time [mg C/(m2/time)] for periphyton and macrophytes or per volume [mg C/(m3/time)] for phytoplankton. Carbon method defines the amount of carbon dioxide con-sumed as measured by radioactive carbon (car-bon-14). The carbon-14 method is of greater sen-sitivity than the oxygen light and dark bottle method and is preferred for use in unenriched waters. Unit time may be either the hour or day, depending on the incubation period. (See also “Primary productivity”)
Primary productivity (oxygen method) is expressed as milligrams of oxygen per area per unit time [mg O/(m2/time)] for periphyton and macrophytes or per volume [mg O/(m3/time)] for phytoplankton. Oxygen method defines production and respiration rates as estimated from changes in the measured dis-solved-oxygen concentration. The oxygen light and dark bottle method is preferred if the rate of primary production is sufficient for accurate measurements to be made within 24 hours. Unit time may be either the hour or day, depending on the incubation period. (See also “Primary produc-tivity”)
Radioisotopes are isotopic forms of an element that exhibit radioactivity. Isotopes are varieties of a chemical element that differ in atomic weight, but are very nearly alike in chemical properties. The difference arises because the atoms of the isotopic forms of an element differ in the number of neutrons in the nucleus; for example, ordinary chlorine is a mixture of isotopes having atomic weights of 35 and 37, and the natural mixture has an atomic weight of about 35.453. Many of the ele-ments similarly exist as mixtures of isotopes, and a great many new isotopes have been produced in the operation of nuclear devices such as the
WATER RESOURCES DATA - FLORIDA, 2001
VOLUME 2A: SOUTH FLORIDA
39
cyclotron. There are 275 isotopes of the 81 sta-ble elements, in addition to more than 800 radio-active isotopes.
Recoverable from bed (bottom) material is the amount of a given constituent that is in solution after a representative sample of bottom material has been digested by a method (usually using an acid or mixture of acids) that results in disso-lution of readily soluble substances. Complete dissolution of all bottom material is not achieved by the digestion treatment and thus the determination represents less than the total amount (that is, less than 95 percent) of the con-stituent in the sample. To achieve comparability of analytical data, equivalent digestion proce-dures would be required of all laboratories per-forming such analyses because different digestion procedures are likely to produce different ana-lytical results. (See also “Bed material”)
Recurrence interval, also referred to as return period, is the average time, usually expressed in years, between occurrences of hydrologic events of a specified type (such as exceedances of a specified high flow or non-exceedance of a speci-fied low flow). The terms “return period” and “recurrence interval” do not imply regular cyclic occurrence. The actual times between occurrences vary randomly, with most of the times being less than the average and a few being substantially greater than the average. For example, the 100-year flood is the flow rate that is exceeded by the annual maximum peak flow at intervals whose average length is 100 years (that is, once in 100 years, on average); almost two-thirds of all exceedances of the 100-year flood occur less than 100 years after the previous exceedance, half occur less than 70 years after the previous exceedance, and about one-eighth occur more than 200 years after the previous exceedance. Simi-larly, the 7-day 10-year low flow (7Q10) is the
flow rate below which the annual minimum 7-day-mean flow dips at intervals whose average length is 10 years (that is, once in 10 years, on average); almost two-thirds of the non-exceed-ances of the 7Q10 occur less than 10 years after
the previous non-exceedance, half occur less than 7 years after, and about one-eighth occur more than 20 years after the previous non-exceedance. The recurrence interval for annual events is the reciprocal of the annual probability of occur-rence. Thus, the 100-year flood has a 1-percent chance of being exceeded by the maximum peak flow in any year, and there is a 10-percent chance in any year that the annual minimum 7-day-mean flow will be less than the 7Q10.
Replicate samples are a group of samples collected in a manner such that the samples are thought to be essentially identical in composition.
Return period (See “Recurrence interval”)
River mileage is the curvilinear distance, in miles, measured upstream from the mouth along the meandering path of a stream channel in accordance with Bulletin No. 14 (October 1968) of the Water Resources Council, and typically used to denote location along a river.
Runoff is the quantity of water that is discharged (“runs off”) from a drainage basin in a given time period. Runoff data may be presented as volumes in acre-feet, as mean discharges per unit of drainage area in cubic feet per second per square mile, or as depths of water on the drainage basin in inches. (See also “Annual runoff”)
Sea level, as used in this report, refers to one of the two commonly used national vertical datums, (NGVD 1929 or NAVD 1988). See separate entries for definitions of these datums. See conversion of units page (inside back cover) for identifica-tion of the datum used in this report.
Sediment is solid material that originates mostly from disintegrated rocks; when transported by, suspended in, or deposited from water, it is referred to as “fluvial sediment.” Sediment includes chemical and biochemical precipitates and decomposed organic material, such as humus. The quantity, characteristics, and cause of the occurrence of sediment in streams are influenced by environmental and land-use factors. Some major factors are topography, soil characteristics, land cover, and depth and intensity of pre-cipitation.
Seven-day 10-year low flow (7Q10) is the discharge below which the annual 7-day minimum flow falls in 1 year out of 10 on the long-run average. The recurrence interval of the 7Q10 is 10 years; the chance that the annual 7-day minimum flow will be less than the 7Q10 is 10 percent in any given year. (See also “Recurrence interval” and “Annual 7-day minimum”)
Sodium adsorption ratio (SAR) is the expression of relative activity of sodium ions in exchange reactions within soil and is an index of sodium or alkali hazard to the soil. Sodium hazard in water is an index that can be used to evaluate the suit-ability of water for irrigating crops.
Specific electrical conductance (conductivity) is a measure of the capacity of water (or other media) to conduct an electrical current. It is expressed
in microsiemens per centimeter at 25 °C. Specific
electrical conductance is a function of the types and quantity of dissolved substances in water and can be used for approximating the dissolved-solids content of the water. Commonly, the con-centration of dissolved solids (in milligrams per liter) is from 55 to 75 percent of the specific conductance (in microsiemens). This relation is not constant from stream to stream, and it may vary in the same source with changes in the compo-sition of the water.
Stable isotope ratio (per MIL/MIL) is a unit expressing the ratio of the abundance of two radioactive isotopes. Isotope ratios are used in hydrologic studies to determine the age or source of specific waters, to evaluate mixing of differ-ent waters, as an aid in determining reaction rates, and other chemical or hydrologic pro-cesses.
Stage (See “Gage height”)
Stage-discharge relation is the relation between the water-surface elevation, termed stage (gage
WATER RESOURCES DATA - FLORIDA, 2001
VOLUME 2A: SOUTH FLORIDA
40
height), and the volume of water flowing in a channel per unit time.
Streamflow is the discharge that occurs in a natu-ral channel. Although the term “discharge” can be applied to the flow of a canal, the word “stream-flow” uniquely describes the discharge in a sur-face stream course. The term “streamflow” is more general than “runoff” as streamflow may be applied to discharge whether or not it is affected by diversion or regulation.
Substrate is the physical surface upon which an organism lives.
Substrate Embeddedness Class is a visual estimate of riffle streambed substrate larger than gravel that is surrounded or covered by fine sediment (<2mm, sand or finer). Below are the class cate-gories expressed as percent covered by fine sedi-ment:
0 < no gravel or larger substrate1 > 75%2 51-75% 4 5-25%3 26-50% 5 < 5%
Surface area of a lake is that area (acres) encom-passed by the boundary of the lake as shown on USGS topographic maps, or other available maps or photographs. Because surface area changes with lake stage, surface areas listed in this report represent those determined for the stage at the time the maps or photographs were obtained.
Surficial bed material is the upper surface (0.1 to 0.2 ft) of the bed material such as that material which is sampled using U.S. Series Bed-Material Samplers.
Suspended (as used in tables of chemical analyses) refers to the amount (concentration) of undis-solved material in a water-sediment mixture. It is operationally defined as the material retained on a 0.45-micrometer filter.
Suspended, recoverable is the amount of a given constituent that is in solution after the part of a representative suspended water-sediment sample that is retained on a 0.45-micrometer membrane filter has been digested by a method (usually using a dilute acid solution) that results in dissolution of only readily soluble substances. Complete dissolution of all the particulate mat-ter is not achieved by the digestion treatment and thus the determination represents something less than the “total” amount (that is, less than 95 percent) of the constituent present in the sample. To achieve comparability of analytical data, equivalent digestion procedures are required of all laboratories performing such analyses because different digestion procedures are likely to produce different analytical results. Determinations of “suspended, recover-able” constituents are made either by directly analyzing the suspended material collected on the filter or, more commonly, by difference, based on determinations of (1) dissolved and (2) total recoverable concentrations of the constituent. (See also “Suspended”)
Suspended sediment is the sediment maintained in suspension by the upward components of turbulent
currents or that exists in suspension as a col-loid. (See also “Sediment”)
Suspended-sediment concentration is the veloc-ity-weighted concentration of suspended sediment in the sampled zone (from the water surface to a point approximately 0.3 ft above the bed) expressed as milligrams of dry sediment per liter of water-sediment mixture (mg/L). The analytical technique uses the mass of all of the sediment and the net weight of the water-sediment mixture in a sample to compute the suspended-sediment concen-tration. (See also “Sediment” and “Suspended sed-iment”)
Suspended-sediment discharge (tons/day) is the rate of sediment transport, as measured by dry mass or volume, that passes a cross section in a given time. It is calculated in units of tons per day as follows: concentration (mg/L) x discharge (ft3/s) x 0.0027. (See also “Sediment,” “Suspended sediment,” and “Suspended-sediment concentration”)
Suspended-sediment load is a general term that refers to a given characteristic of the material in suspension that passes a point during a speci-fied period of time. The term needs to be quali-fied, such as “annual suspended-sediment load” or “sand-size suspended-sediment load,” and so on. It is not synonymous with either suspended-sedi-ment discharge or concentration. (See also “Sedi-ment”)
Suspended, total is the total amount of a given constituent in the part of a water-sediment sam-ple that is retained on a 0.45-micrometer mem-brane filter. This term is used only when the analytical procedure assures measurement of at least 95 percent of the constituent determined. Knowledge of the expected form of the constituent in the sample, as well as the analytical method-ology used, is required to determine when the results should be reported as “suspended, total.” Determinations of “suspended, total” constituents are made either by directly analyzing portions of the suspended material collected on the filter or, more commonly, by difference, based on deter-minations of (1) dissolved and (2) total concen-trations of the constituent. (See also “Suspended”)
Suspended solids, total residue at 105 °C concen-tration is the concentration of inorganic and organic material retained on a filter, expressed as milligrams of dry material per liter of water (mg/L). An aliquot of the sample is used for this analysis.
Synoptic studies are short-term investigations of specific water-quality conditions during selected seasonal or hydrologic periods to provide improved spatial resolution for critical water-quality conditions. For the period and con-ditions sampled, they assess the spatial distri-bution of selected water-quality conditions in relation to causative factors, such as land use and contaminant sources.
Taxa richness is the total number of distinct spe-cies or groups and usually decreases with pollu-tion. (See also “Percent Shading”)
WATER RESOURCES DATA - FLORIDA, 2001
VOLUME 2A: SOUTH FLORIDA
41
Taxonomy is the division of biology concerned with the classification and naming of organisms. The classification of organisms is based upon a hier-archical scheme beginning with Kingdom and ending with Species at the base. The higher the classi-fication level, the fewer features the organisms have in common. For example, the taxonomy of a particular mayfly, Hexagenia limbata, is the fol-lowing:
cies is less than 20 °C or spawning temperature preference less than 16 °C and native distribu-tion is considered to be predominantly north of 45° N. latitude.
Warm – preferred water temperatures for the spe-cies is greater than 20 °C or spawning tempera-ture preference greater than 16 °C and native distribution is considered to be predominantly south of 45° N. latitude.
Cool – intermediate between cold and warm water temperature preferences.
Thermograph is an instrument that continuously records variations of temperature on a chart. The more general term “temperature recorder’ is used in the table descriptions and refers to any instrument that records temperature whether on a chart, a tape, or any other medium.
Time-weighted average is computed by multiplying the number of days in the sampling period by the concentrations of individual constituents for the corresponding period and dividing the sum of the products by the total number of days. A time-weighted average represents the composition of water resulting from the mixing of flow pro-portionally to the duration of the concentration.
Tons per acre-foot (T/acre-ft) is the dry mass (tons) of a constituent per unit volume (acre-foot) of water. It is computed by multiply-ing the concentration of the constituent, in mil-ligrams per liter, by 0.00136.
Tons per day (T/DAY, tons/d) is a common chemical or sediment discharge unit. It is the quantity of a substance in solution, in suspension, or as bed-load that passes a stream section during a 24-hour period. It is equivalent to 2,000 pounds per day, or 0.9072 metric tons per day.
Total is the amount of a given constituent in a representative whole-water (unfiltered) sample, regardless of the constituent’s physical or chem-ical form. This term is used only when the analyt-ical procedure assures measurement of at least 95 percent of the constituent present in both the dissolved and suspended phases of the sample. A knowledge of the expected form of the constituent in the sample, as well as the analytical method-ology used, is required to judge when the results
should be reported as “total.” (Note that the word “total” does double duty here, indicating both that the sample consists of a water-sus-pended sediment mixture and that the analytical method determined at least 95 percent of the con-stituent in the sample.)
Total coliform bacteria are a particular group of bacteria that are used as indicators of possible sewage pollution. This group includes coliforms that inhabit the intestine of warm-blooded ani-mals and those that inhabit soils. They are char-acterized as aerobic or facultative anaerobic, gram-negative, nonspore-forming, rod-shaped bac-teria that ferment lactose with gas formation within 48 hours at 35 °C. In the laboratory, these bacteria are defined as all the organisms that produce colonies with a golden-green metallic sheen within 24 hours when incubated at 35 °C plus or minus 1.0 °C on M-Endo medium (nutrient medium for bacterial growth). Their concentrations are expressed as number of colonies per 100 mL of sam-ple. (See also “Bacteria”)
Total discharge is the quantity of a given constit-uent, measured as dry mass or volume, that passes a stream cross section per unit of time. When referring to constituents other than water, this term needs to be qualified, such as “total sedi-ment discharge,” “total chloride discharge,” and so on.
Total in bottom material is the amount of a given constituent in a representative sample of bottom material. This term is used only when the analyt-ical procedure assures measurement of at least 95 percent of the constituent determined. A knowl-edge of the expected form of the constituent in the sample, as well as the analytical methodology used, is required to judge when the results should be reported as “total in bottom material.”
Total length (fish) is the straight-line distance from the anterior point of a fish specimen’s snout, with the mouth closed, to the posterior end of the caudal (tail) fin, with the lobes of the caudal fin squeezed together.
Total load refers to all of a constituent in trans-port. When referring to sediment, it includes suspended load plus bed load.
Total organism count is the number of organisms collected and enumerated in any particular sam-ple. (See also “Organism count/volume.”)
Total recoverable is the amount of a given constit-uent in a whole-water sample after a sample has been digested by a method (usually using a dilute acid solution) that results in dissolution of only readily soluble substances. Complete disso-lution of all particulate matter is not achieved by the digestion treatment, and thus the determi-nation represents something less than the “total” amount (that is, less than 95 percent) of the constituent present in the dissolved and sus-pended phases of the sample. To achieve compara-bility of analytical data for whole-water samples, equivalent digestion procedures are required of all laboratories performing such analyses because different digestion procedures may produce different analytical results.
WATER RESOURCES DATA - FLORIDA, 2001
VOLUME 2A: SOUTH FLORIDA
42
Total sediment discharge is the mass of suspended-sediment plus bed-load transport, measured as dry weight, that passes a cross section in a given time. It is a rate and is reported as tons per day. (See also “Sediment,” “Suspended sediment,” “Suspended-Sediment Concentration,” “Bedload,” and “Bedload discharge”)
Total sediment load or total load is the sediment in transport as bedload and suspended-sediment load. The term may be qualified, such as “annual suspended-sediment load” or “sand-size sus-pended-sediment load,” and so on. It differs from total sediment discharge in that load refers to the material whereas discharge refers to the quantity of material, expressed in units of mass per unit time. (See also “Sediment,” “Sus-pended-Sediment Load,” and “Total load”)
Herbivore – diet composed predominantly of plant material.
Invertivore – diet composed predominantly of invertebrates.
Omnivore – diet composed of at least 25-percent plant and 25-percent animal material.
Piscivore – diet composed predominantly of fish.
Turbidity is the reduction in the transparency of a solution due to the presence of suspended and some dissolved substances. The measurement tech-nique records the collective optical properties of the solution that cause light to be scattered and attenuated rather than transmitted in straight lines; the higher the intensity of scat-tered or attenuated light, the higher the value of the turbidity. Turbidity is expressed in nephelometric turbidity units (NTU). Depending on the method used, the turbidity units as NTU can be defined as the intensity of light of a specified wavelength scattered or attenuated by suspended particles or absorbed at a method specified angle, usually 90 degrees, from the path of the incident light. Currently approved methods for the measurement of turbidity in the USGS include those that conform to EPA Method 180.1, ASTM D1889-00, and ISO 7027. Measurements of turbidity by these different methods and different instru-ments are unlikely to yield equivalent values. Consequently, the method of measurement and type of instrument used to derive turbidity records should be included in the “REMARKS” column of the Annual Data Report.
Ultraviolet (UV) absorbance (absorption) at 254 or 280 nanometers is a measure of the aggregate con-centration of the mixture of UV absorbing organic materials dissolved in the analyzed water, such as lignin, tannin, humic substances, and various aromatic compounds. UV absorb-ance (absorption) at 254 or 280 nanometers is measured in UV absorption units per centimeter of pathlength of UV light through a sample.
Vertical datum (See “Datum”)
Volatile organic compounds (VOCs) are organic com-pounds that can be isolated from the water phase of a sample by purging the water sample with inert
gas, such as helium, and subsequently analyzed by gas chromatography. Many VOCs are human-made chemicals that are used and produced in the manu-facture of paints, adhesives, petroleum products, pharmaceuticals, and refrigerants. They are often components of fuels, solvents, hydraulic fluids, paint thinners, and dry cleaning agents commonly used in urban settings. VOC contamination of drinking-water supplies is a human health concern because many are toxic and are known or suspected human carcinogens (U.S. Environmental Protection Agency, 1996).
Water table is the level in the saturated zone at which the pressure is equal to the atmospheric pressure.
Water-table aquifer is an unconfined aquifer within which is found the water table.
Water year in USGS reports dealing with sur-face-water supply is the 12-month period October 1 through September 30. The water year is desig-nated by the calendar year in which it ends and which includes 9 of the 12 months. Thus, the year ending September 30, 2001, is called the “2001 water year.”
WDR is used as an abbreviation for “Water-Data Report” in the REVISED RECORDS paragraph to refer to State annual hydrologic-data reports. (WRD was used as an abbreviation for “Water-Resources Data” in reports published prior to 1976.)
Weighted average is used in this report to indicate discharge-weighted average. It is computed by multiplying the discharge for a sampling period by the concentrations of individual constituents for the corresponding period and dividing the sum of the products by the sum of the discharges. A discharge-weighted average approximates the com-position of water that would be found in a reser-voir containing all the water passing a given location during the water year after thorough mixing in the reservoir.
Wet mass is the mass of living matter plus con-tained water. (See also “Biomass” and “Dry mass”)
Wet weight refers to the weight of animal tissue or other substance including its contained water. (See also “Dry weight”)
WSP is used as an acronym for “Water-Supply Paper” in reference to previously published reports.
Zooplankton is the animal part of the plankton. Zooplankton are capable of extensive movements within the water column and are often large enough to be seen with the unaided eye. Zooplank-ton are secondary consumers feeding upon bacte-ria, phytoplankton, and detritus. Because they are the grazers in the aquatic environment, the zooplankton are a vital part of the aquatic food web. The zooplankton community is dominated by small crustaceans and rotifers. (See also “Plank-ton”)
WATER RESOURCES DATA - FLORIDA, 2001
VOLUME 2A: SOUTH FLORIDA
43
TECHNIQUES OF WATER-RESOURCES INVESTIGATIONS OF THE U.S. GEOLOGICAL SURVEY
The U.S.G.S. publishes a series of manuals describing procedures for planning and conductingspecialized work in water-resources investigations. The material is grouped under major subjectheadings called books and is further divided into sections and chapters. For example, section A of book3 (Applications of Hydraulics) pertains to surface water. The chapter, the unit of publication, islimited to a narrow field of subject matter. This format permits flexibility in revision andpublication as the need arises.
The reports listed below are for sale by the U.S.G.S., Information Services, Box 25286, FederalCenter, Denver, Colorado 80225 (authorized agent of the Superintendent of Documents, GovernmentPrinting Office). Prepayment is required. Remittance should be made in the form of a check or moneyorder payable to the “U.S. Geological Survey.” Prices are not included because they are subject tochange. Current prices can be obtained by writing to the above address. When ordering or inquiringabout prices for any of these publications, please give the title, book number, chapter number, andmention the “U.S. Geological Survey Techniques of Water-Resources Investigations.”
Book 1. Collection of Water Data by Direct Measurement
Section D. Water Quality
1-D1. Water temperature—influential factors, field measurement, and data presentation, by H.H. Stevens, Jr., J.F. Ficke, and G.F. Smoot: USGS–TWRI book 1, chap. D1. 1975. 65 p.
1-D2. Guidelines for collection and field analysis of ground-water samples for selected unstable constituents, by W.W. Wood: USGS–TWRI book 1, chap. D2. 1976. 24 p.
Book 2. Collection of Environmental Data
Section D. Surface Geophysical Methods
2-D1. Application of surface geophysics to ground-water investigations, by A.A.R. Zohdy, G.P. Eaton, and D.R. Mabey: USGS–TWRI book 2, chap. D1. 1974. 116 p.
2-D2. Application of seismic-refraction techniques to hydrologic studies, by F.P. Haeni: USGS–TWRI book 2, chap. D2. 1988. 86 p.
Section E. Subsurface Geophysical Methods
2-E1. Application of borehole geophysics to water-resources investigations, by W.S. Keys and L.M. MacCary: USGS–TWRI book 2, chap. E1. 1971. 126 p.
2-E2. Borehole geophysics applied to ground-water investigations, by W.S. Keys: USGS–TWRI book 2, chap. E2. 1990. 150 p.
Section F. Drilling and Sampling Methods
2-F1. Application of drilling, coring, and sampling techniques to test holes and wells, by Eugene Shuter and W.E. Teasdale: USGS–TWRI book 2, chap. F1. 1989. 97 p.
Book 3. Applications of Hydraulics
Section A. Surface-Water Techniques
3-A1. General field and office procedures for indirect discharge measurements, by M.A. Benson and Tate Dalrymple: USGS–TWRI book 3, chap. A1. 1967. 30 p.
3-A2. Measurement of peak discharge by the slope-area method, by Tate Dalrymple and M.A. Benson: USGS–TWRI book 3, chap. A2. 1967. 12 p.
3-A3. Measurement of peak discharge at culverts by indirect methods, by G.L. Bodhaine: USGS–TWRI book 3, chap. A3. 1968. 60 p.
3-A4. Measurement of peak discharge at width contractions by indirect methods, by H.F. Matthai: USGS-TWRI book 3, chap. A4. 1967. 44 p.
3-A5. Measurement of peak discharge at dams by indirect methods, by Harry Hulsing: USGS–TWRI book 3. chap. A5. 1967. 29 p.
3-A6. General procedure for gaging streams, by R.W. Carter and Jacob Davidian: USGS–TWRI book 3, chap. A6. 1968. 13 p.
WATER RESOURCES DATA - FLORIDA, 2001
VOLUME 2A: SOUTH FLORIDA
44
3-A7. Stage measurement at gaging stations, by T.J. Buchanan and W.P. Somers: USGS–TWRI book 3, chap. A7. 1968. 28 p.
3-A8. Discharge measurements at gaging stations, by T.J. Buchanan and W.P. Somers: USGS–TWRI book 3, chap. A8. 1969. 65 p.
3-A9. Measurement of time of travel in streams by dye tracing, by F.A. Kilpatrick and J.F. Wilson, Jr.:
3-Al0. Discharge ratings at gaging stations, by E.J. Kennedy: USGS–TWRI book 3, chap. A10. 1984. 59 p.
3-A11. Measurement of discharge by the moving-boat method, by G.F. Smoot and C.E. Novak: USGS–TWRI book 3, chap. A11. 1969. 22 p.
3-A12. Fluorometric procedures for dye tracing, Revised, by J.F. Wilson, Jr., E.D. Cobb, and F.A. Kilpatrick: USGS–TWRI book 3, chap. A12. 1986. 34 p.
3-A13. Computation of continuous records of streamflow, by E.J. Kennedy: USGS–TWRI book 3, chap. A13. 1983. 53 p.
3-A14. Use of flumes in measuring discharge, by F.A. Kilpatrick and V.R. Schneider: USGS–TWRI book 3, chap. A14. 1983. 46 p.
3-A15. Computation of water-surface profiles in open channels, by Jacob Davidian: USGS–TWRI book 3, chap. A15. 1984. 48 p.
3-A16. Measurement of discharge using tracers, by F.A. Kilpatrick and E.D. Cobb: USGS–TWRI book 3, chap. A16. 1985. 52 p.
3-A17. Acoustic velocity meter systems, by Antonius Laenen: USGS–TWRI book 3, chap. A17. 1985. 38 p.
3-A18. Determination of stream reaeration coefficients by use of tracers, by F.A. Kilpatrick, R.E. Rathbun, Nobuhiro Yotsukura, G.W. Parker, and L.L. DeLong: USGS–TWRI book 3, chap. A18. 1989. 52 p.
3-A19. Levels at streamflow gaging stations, by E.J. Kennedy: USGS–TWRI book 3, chap. A19. 1990. 31 p.
3-A20. Simulation of soluble waste transport and buildup in surface waters using tracers, by F.A. Kilpatrick: USGS–TWRI book 3, chap. A20. 1993. 38 p.
3-A21. Stream-gaging cableways, by C. Russell Wagner: USGS–TWRI book 3, chap. A21. 1995. 56 p.
Section B. Ground-Water Techniques
3-B1. Aquifer-test design, observation, and data analysis, by R.W. Stallman: USGS–TWRI book 3, chap. B1. 1971. 26 p.
3-B2. Introduction to ground-water hydraulics, a programed text for self-instruction, by G.D. Bennett: USGS–TWRI book 3, chap. B2. 1976. 172 p.
3-B3. Type curves for selected problems of flow to wells in confined aquifers, by J.E. Reed: USGS–TWRI book 3, chap. B3. 1980. 106 p.
3-B4. Regression modeling of ground-water flow, by R.L. Cooley and R.L. Naff: USGS–TWRI book 3, chap. B4. 1990. 232 p.
3-B4. Supplement 1. Regression modeling of ground-water flow --Modifications to the computer code for nonlinear regression solution of steady-state ground-water flow problems, by R.L. Cooley: USGS–TWRI book 3, chap. B4. 1993. 8 p.
3-B5. Definition of boundary and initial conditions in the analysis of saturated ground-water flow systems—An introduction, by O.L. Franke, T.E. Reilly, and G.D. Bennett: USGS–TWRI book 3, chap. B5. 1987. 15 p.
3-B6. The principle of superposition and its application in ground-water hydraulics, by T.E. Reilly, O.L. Franke, and G.D. Bennett: USGS–TWRI book 3, chap. B6. 1987. 28 p.
WATER RESOURCES DATA - FLORIDA, 2001
VOLUME 2A: SOUTH FLORIDA
45
3-B7. Analytical solutions for one-, two-, and three-dimensional solute transport in ground-water systems with uniform flow, by E.J. Wexler: USGS–TWRI book 3, chap. B7. 1992. 190 p.
3-B8. System and boundary conceptualization in ground-water flow simulation, by T.E. Reilly: USGS–TWRI book 3, chap. B8. 2001. 29 p.
Section C. Sedimentation and Erosion Techniques
3-C1. Fluvial sediment concepts, by H.P. Guy: USGS–TWRI book 3, chap. C1. 1970. 55 p.
3-C2. Field methods for measurement of fluvial sediment, by T.K. Edwards and G.D. Glysson: USGS–TWRI book 3, chap. C2. 1999. 89 p.
3-C3. Computation of fluvial-sediment discharge, by George Porterfield: USGS–TWRI book 3, chap. C3. 1972. 66 p.
Book 4. Hydrologic Analysis and Interpretation
Section A. Statistical Analysis
4-A1. Some statistical tools in hydrology, by H.C. Riggs: USGS–TWRI book 4, chap. A1. 1968. 39 p.
4-A2. Frequency curves, by H.C. Riggs: USGS–TWRI book 4, chap. A2. 1968. 15 p.
Section B. Surface Water
4-B1. Low-flow investigations, by H.C. Riggs: USGS–TWRI book 4, chap. B1. 1972. 18 p.
4-B2. Storage analyses for water supply, by H.C. Riggs and C.H. Hardison: USGS–TWRI book 4, chap. B2. 1973. 20 p.
4-B3. Regional analyses of streamflow characteristics, by H.C. Riggs: USGS–TWRI book 4, chap. B3. 1973. 15 p.
Section D. Interrelated Phases of the Hydrologic Cycle
4-D1. Computation of rate and volume of stream depletion by wells, by C.T. Jenkins: USGS–TWRI book 4, chap. D1. 1970. 17 p.
Book 5. Laboratory Analysis
Section A. Water Analysis
5-A1. Methods for determination of inorganic substances in water and fluvial sediments, by M.J. Fishman and L.C. Friedman, editors: USGS–TWRI book 5, chap. A1. 1989. 545 p.
5-A2. Determination of minor elements in water by emission spectroscopy, by P.R. Barnett and E.C. Mallory, Jr.: USGS–TWRI book 5, chap. A2. 1971. 31 p.
5-A3. Methods for the determination of organic substances in water and fluvial sediments, edited by R.L. Wershaw, M.J. Fishman, R.R. Grabbe, and L.E. Lowe: USGS–TWRI book 5, chap. A3. 1987. 80 p.
5-A4. Methods for collection and analysis of aquatic biological and microbiological samples, by L.J. Britton and P.E. Greeson, editors: USGS–TWRI book 5, chap. A4. 1989. 363 p.
5-A5. Methods for determination of radioactive substances in water and fluvial sediments, by L.L. Thatcher, V.J. Janzer, and K.W. Edwards: USGS–TWRI book 5, chap. A5. 1977. 95 p.
5-A6. Quality assurance practices for the chemical and biological analyses of water and fluvial sediments, by L.C. Friedman and D.E. Erdmann: USGS–TWRI book 5, chap. A6. 1982. 181 p.
Section C. Sediment Analysis
5-C1. Laboratory theory and methods for sediment analysis, by H.P. Guy: USGS–TWRI book 5, chap. C1. 1969. 58 p.
WATER RESOURCES DATA - FLORIDA, 2001
VOLUME 2A: SOUTH FLORIDA
46
Book 6. Modeling Techniques
Section A. Ground Water
6-A1. A modular three-dimensional finite-difference ground-water flow model, by M.G. McDonald and A.W. Harbaugh: USGS–TWRI book 6, chap. A1. 1988. 586 p.
6-A2. Documentation of a computer program to simulate aquifer-system compaction using the modular finite-difference ground-water flow model, by S.A. Leake and D.E. Prudic: USGS–TWRI book 6, chap. A2. 1991. 68 p.
6-A3. A modular finite-element model (MODFE) for areal and axisymmetric ground-water-flow problems, Part 1: Model Description and User’s Manual, by L.J. Torak: USGS–TWRI book 6, chap. A3. 1993. 136 p.
6-A4. A modular finite-element model (MODFE) for areal and axisymmetric ground-water-flow problems, Part 2: Derivation of finite-element equations and comparisons with analytical solutions, by R.L. Cooley: USGS–TWRI book 6, chap. A4. 1992. 108 p.
6-A5. A modular finite-element model (MODFE) for areal and axisymmetric ground-water-flow problems, Part 3: Design philosophy and programming details, by L.J. Torak: USGS–TWRI book 6, chap. A5, 1993. 243 p.
6-A6. A coupled surface-water and ground-water flow model (MODBRANCH) for simulation of stream-aquifer interaction, by Eric D. Swain and Eliezer J. Wexler: USGS–TWRI book 6, chap. A5,1996. 125 p.
Book 7. Automated Data Processing and Computations
Section C. Computer Programs
7-C1. Finite difference model for aquifer simulation in two dimensions with results of numerical experiments, by P.C. Trescott, G.F. Pinder, and S.P. Larson: USGS–TWRI book 7, chap. C1. 1976. 116 p.
7-C2. Computer model of two-dimensional solute transport and dispersion in ground water, by L.F. Konikow and J.D. Bredehoeft: USGS–TWRI book 7, chap. C2. 1978. 90 p.
7-C3. A model for simulation of flow in singular and interconnected channels, by R.W. Schaffranek, R.A. Baltzer, and D.E. Goldberg: USGS–TWRI book 7, chap. C3. 1981. 110 p.
Book 8. Instrumentation
Section A. Instruments for Measurement of Water Level
8-A1. Methods of measuring water levels in deep wells, by M.S. Garber and F.C. Koopman: USGS–TWRI book 8, chap. A1. 1968. 23 p.
8-A2. Installation and service manual for U.S. Geological Survey manometers, by J.D. Craig: USGS–TWRI book 8, chap. A2. 1983. 57 p.
Section B. Instruments for Measurement of Discharge
8-B2. Calibration and maintenance of vertical-axis type current meters, by G.F. Smoot and C.E. Novak: USGS–TWRI book 8, chap. B2. 1968. 15 p.
Book 9. Handbooks for Water-Resources Investigations
Section A. National Field Manual for the Collection of Water-Quality Data
9-A1. National Field Manual for the Collection of Water-Quality Data: Preparations for Water Sampling, by F.D. Wilde, D.B. Radtke, Jacob Gibs, and R.T. Iwatsubo: USGS–TWRI book 9, chap. A1. 1998. 47 p.
9-A2. National Field Manual for the Collection of Water-Quality Data: Selection of Equipment for Water Sampling, edited by F.D. Wilde, D.B. Radtke, Jacob Gibs, and R.T. Iwatsubo: USGS–TWRI book 9, chap. A2. 1998. 94 p.
WATER RESOURCES DATA - FLORIDA, 2001
VOLUME 2A: SOUTH FLORIDA
47
9-A3. National Field Manual for the Collection of Water-Quality Data: Cleaning of Equipment for Water Sampling, edited by F.D. Wilde, D.B. Radtke, Jacob Gibs, and R.T. Iwatsubo: USGS–TWRI book 9, chap. A3. 1998. 75 p.
9-A4. National Field Manual for the Collection of Water-Quality Data: Collection of Water Samples, edited by F.D. Wilde, D.B. Radtke, Jacob Gibs, and R.T. Iwatsubo: USGS–TWRI book 9, chap. A4. 1999. 156 p.
9-A5. National Field Manual for the Collection of Water-Quality Data: Processing of Water Samples, edited by F.D. Wilde, D.B. Radtke, Jacob Gibs, and R.T. Iwatsubo: USGS–TWRI book 9, chap. A5. 1999, 149 p.
9-A6. National Field Manual for the Collection of Water-Quality Data: Field Measurements, edited by F.D. Wilde and D.B. Radtke: USGS–TWRI book 9, chap. A6. 1998. Variously paginated.
9-A7. National Field Manual for the Collection of Water-Quality Data: Biological Indicators, edited by D.N. Myers and F.D. Wilde: USGS–TWRI book 9, chap. A7. 1997 and 1999. Variously paginated.
9-A8. National Field Manual for the Collection of Water-Quality Data: Bottom-material samples, by D.B. Radtke: USGS–TWRI book 9, chap. A8. 1998. 48 p.
9-A9. National Field Manual for the Collection of Water-Quality Data: Safety in Field Activities, by S.L. Lane and R.G. Fay: USGS–TWRI book 9, chap. A9. 1998. 60 p.
WATER RESOURCES DATA - FLORIDA, 2001
VOLUME 2A: SOUTH FLORIDA
48
SELECTED REFERENCES
American Public Health Association, and others, 1965, Standard methods for the examination of waterand waste-water, 12th edition: American Public Health Association, New York, 769 p.
California State Water Quality Control Board, 1963, Water quality criteria; Pub. 3-A, 226 p.
Conover, C.S., and Leach, S.D., 1975, River basin and hydrologic unit map of Florida: Florida Bureauof Geology Map Series 72.
Ellis, M.M., Westfall, B.A., and Ellis, M.D., 1946, Determination of water quality, U.S. Fish andWildlife Reserve Report 9, 122 p.
Florida Department of Environmental Regulation, 1983, Water quality standards: Chapter 17-3 inFlorida Administrative Code.
-----1984, Public drinking water systems: Chapter 17-22 in Florida Administrative Code.
Hem, J.D., 1970, Study and interpretations of the chemical characteristics of natural water: U.S.Geological Survey Water-Supply Paper 1473, second edition, 363 p.
Hittle, Clinton, D.,1999, Delineation of saltwater intrusion in the Surficial Aquifer System ineastern Palm Beach, Martin, and St.Lucie counties, Florida, 1997-1998: U.S. Geological SurveyWater-Resources Investigations Report 99-4214, Sheet in pocket.
Kirkor, Teodor, 1951, Protecting public waters from pollution in the USSR: Sewage Works Journal, v.23, p. 938.
Langbein, W.B., and Iseri, K.T., 1960, General introduction and hydrologic definitions: U.S.Geological Survey Water-Supply Paper 1541-A, 29 p.
Maier, F.J., 1950, Fluoridation of public water supplies: Journal of the American Water WorksAssociation, v. 42, pt. 1, p. 1120-1132.
Maxcy, K.F., 1950, Report on the relation of nitrite concentrations in well waters to the occurrenceof methemoglobinemia: National Research Council, Sanitary Engineering and Environment Bulletin,Appendix D, 271 p.
McNeill, J.D., Bosnar, M.,and Snelgrove, F.B., 1990, Resolution of an electronic boreholeconductivity logger for geotechnical and ground water applications, Technical note TN-25: GeonicsLimited, Mississauga, Ontario, Canada, 28 p.
Paynter, O.E., 1960, The chronic toxicity of dodecylbenzene sodium sulfonate: U.S. Public HealthConference on Physiological Aspects of Water Quality Proc., Washington, D.C., Sept. 8-9, 1960, 175-179p.
Rose, Arthur and Elizabeth, 1966, The condensed chemical dictionary: Reinhold PublishingCorporation, New York, 7th ed., 285 p.
Swenson, H.A., and Baldwin, H.L., 1965, A primer on water quality: Washington, U.S. GovernmentPrinting Office, 27 p.
U.S. Environmental Protection Agency, 1975, National interim primary drinking water regulations:Federal Register, v. 40, no. 51, March 14, p. 11990-11998.
-----1976 (1977), Quality criteria for water: U.S. Government Printing Office, 256 p.
---- 1977, National secondary drinking water regulations: Federal Register, v. 42, no. 62, March 31,1977, p. 17143-17146.
Public Health Service, 1962, Drinking water standards: U.S. Department of Health, Education, andWelfare, Public Health Service: Pub. no. 956.
Wayman, C.H., Robertson, J.B., and Page, H.G., 1962, Foaming characteristics of synthetic detergentsolutions: U.S. Geological Survey Professional Paper 450D, art. 178, D198 p.
WATER RESOURCES DATA - FLORIDA, 2001
VOLUME 2A: SOUTH FLORIDA
49
STAGE, DISCHARGE, AND WATER QUALITY OF STREAM
WATER RESOURCES DATA - FLORIDA, 2001
VOLUME 2A: SOUTH FLORIDA
50
Figure 4. Location of gaging stations in the portion of the Everglades and the southeastern coastal area north of latitude 26 degrees.
51 EVERGLADES AND SOUTHEASTERN COASTAL AREA
02276870 ST. LUCIE CANAL AT LAKE OKEECHOBEE, FL
LOCATION.-- Lat 26°59'00", long 80°03'70", in sec.22, T.40 S., R.37 E., Martin County, Hydrologic Unit 03090202, 0.5 mi downstream of control structure 308, directly beneath the U.S. Highway 441 overpass, just north of U.S. Highway 76 and 24 mi upstream of control structure 80.DRAINAGE AREA.--Indeterminate.PERIOD OF RECORD.--April 1931 to September 1952, October 1981 to current year. Prior to October 1946, published as St. Lucie Canal at lock 1, at Lake Okeechobee. Previously published as station number 02276500. All published data stored under current station number. Canal stage previously published under 02276871 has been moved to the current station number 02276870 for publication. Lake and canal stage at Lock Structure S-308 discontinued September 30, 1998.REVISED RECORD.--WDR FL-00-2A:1999GAGE.--Satellite data collection platform with water-stage shaft encoder and acoustic velocity meter until October 19, 2001, when it was removed. Satellite data collection platform with water-stage shaft encoder and acoustic doppler velocity meter installed May 17, 2001. The acoustic velocity meter and acoustic doppler velocity meter were run in tandem for the period of May 17, 2001 to October 19, 2001. This acoustic velocity meter station is located 0.5 mi downstream of S-308 and is stored under 02276877 in the files of the U.S. Geological Survey. Datum of gage is National Geodetic Vertical Datum of 1929 (U.S. Army Corps of Engineers bench mark). Prior to January 17, 1934, staff gage at site 0.4 mi downstream at different datum. January 17, 1934 to March 15, 1951, water-stage recorder at site 0.8 mi downstream at datum 1.56 ft lower. March 16, 1951, to September 1952, water-stage recorder at bridge on U.S. Highway 441 at present datum. January 17, 1934, to September 1952, auxiliary water-stage recorder 10.9 mi downstream. Prior to April 24, 1992, canal stage data obtained with digital water level recorder. August 1, 1986 to June 20, 1989, electromagnetic velocity meter and canal stage recorder 1200 ft downstream of S-308. April 4, 1992 satellite data collection platform installed at S-308 for lake and canal stages. May 1994, satellite data collection platform with water-stage shaft encoder for canal stage and acoustic velocity meter with cross path installed 0.5 mi downstream of S-308. This data was not used until October 1, 1996, to determine the discharge from S-308. The discharge is computed under station number 02276877, then stored under 02276870 for publication. Prior to October 1, 1998, satellite data collection platform with water-stage shaft encoders for lake and canal stages in control house of S-308.REMARKS.--Records are poor. Flow regulated by control structure 308 gates and lock at Lake Okeechobee. Flow frequently reversed during and after periods of heavy rainfall by pumpage into the canal from agricultural lands in the Everglades (negative figures indicate reverse flow towards Lake Okeechobee). Discharge computed from relations between discharge, head, gate openings, and slope prior to October 1, 1996. Flow is determined by relationship between the mean cross-sectional velocity and an average index line velocity (from the cross path index line velocities) measured with the acoustic velocity meter, from October 1, 1996 to August 13, 2001, acoustic doppler velocity meter, August 14, 2001 to present. Extreme lake stages for the current year no longer published due to the discontinuation of the U.S. Geological Survey equipment at S-308.COOPERATION.--Canal stage record provided by U.S. Army Corps of Engineers.ANNUAL MEAN and ANNUAL RUNOFF (AC-FT) SUMMARY STATISTICS.--Figures represent 35 complete water years of discharge (1932-52, 1982-88, 1990, 1993-1996, 1999-2000).EXTREME LAKE STAGES FOR PERIOD OF RECORD (1931-1998).--Maximum gage height, 19.63 ft Mar. 9, 1998; minimum, 9.63 ft June 22, 1990.EXTREME CANAL STAGES FOR PERIOD OF RECORD.--Maximum gage height, 18.23 ft Mar. 29, 1998 minimum, 8.66 ft May. 22, 2001.EXTREME CANAL STAGES FOR CURRENT YEAR.--Maximum gage height, 15.03 ft Sept. 30; minimum, 8.66 ft May. 22.
SUMMARY STATISTICS FOR 2000 CALENDAR YEAR FOR 2001 WATER YEAR WATER YEARS 1931 - 2001 ANNUAL TOTAL 81355.5 ANNUAL MEAN 222 921 HIGHEST ANNUAL MEAN 3511 1948 LOWEST ANNUAL MEAN -49.6 1986 HIGHEST DAILY MEAN 2860 Apr 27 570 Nov 9 8150 Feb 26 1983 LOWEST DAILY MEAN -1170 Aug 7 -2710 Sep 14 -4280 Sep 14 1985 ANNUAL SEVEN-DAY MINIMUM -757 Oct 4 -1270 Sep 14 -2980 Aug 7 1985 ANNUAL RUNOFF (AC-FT) 161400 667600 10 PERCENT EXCEEDS 746 295 3640 50 PERCENT EXCEEDS 67 -9.5 158 90 PERCENT EXCEEDS -299 -612 -.22 e Estimated
The period of record statistics were computed from complete water year's of record. See the annual mean and annual runoff (ac-ft) summary statistics section of the manuscript.
53 EVERGLADES AND SOUTHEASTERN COASTAL AREA
02277000 ST. LUCIE CANAL AT LOCK, NEAR STUART, FL
LOCATION.--Lat 27°06'39", long 80°17'06", in Hanson Grant, T.39 S., R.41 E., Martin County, Hydrologic Unit 03090202, at upstream end of the north lock wall, 6.3 mi southwest of Stuart. No section could be determined from existing maps.DRAINAGE AREA.--Indeterminate.PERIOD OF RECORD.--October 1952 to current year. Gage height records collected at same site since December 1924 are contained in files of the South Florida Water Management District and U.S. Army Corps of Engineers. Discharge published prior to October 1, 1987, provided by the U.S. Army Corps of Engineers. U.S. Geological Survey started collection of upstream and downstream stages October 1, 1987, and publication of discharge computed by the U.S. Geological Survey.REVISED RECORDS.--WDR FL-80-2A:1978-1979. WDR FL-96-2A:1988-1989, 1991-1996.GAGE.--U.S. Army Corps of Engineers owned and operated satellite data collection platform with water-stage shaft encoders for upstream and downstream stages. Datum of gage is National Geodetic Vertical Datum of 1929 (U.S. Army Corps of Engineers bench mark). Prior to November 3, 1948, nonrecording gage at same site and at various datums. September 5, 1952, to January 1, 1955, auxiliary water-stage recorder at Arundel Bridge, 1.9 mi upstream, NGVD. U.S. Geological Survey satellite data collection platform installed January 13, 1995, was discontinued October 30, 1998. Digital water-stage recorders removed February 13, 1995.REMARKS.--Records are poor. Flow regulated by lock near Stuart. Leakage and lockage estimated as 35 cfs daily. No period of record extremes shown for stage since stage was not collected by U.S. Geological Survey prior to October 1, 1987.COOPERATION.--Stage, gate-opening record and lock operation provided by U.S. Army Corps of Engineers.ANNUAL MEAN and ANNUAL RUNOFF (AC-FT) SUMMARY STATISTICS.--Figures represent 44 complete water years of discharge (1953-94, 1998-2001).EXTREMES UPSTREAM STAGES FOR PERIOD OF RECORD SINCE OCTOBER 1, 1987.--Maximum gage height 17.88 ft Oct. Nov. 5, 1998; minimum, 8.63 ft May 11, 2001. Historical stage records are not available in the files of the U.S. Geological Survey prior to October 1, 1987.EXTREME UPSTREAM STAGES FOR CURRENT YEAR.--Maximum gage height 15.27 ft Sept. 30; minimum, 8.63 ft May 11. EXTREME DOWNSTREAM STAGES SINCE OCTOBER 1, 1987.--Maximum gage height 7.29 ft Oct. 17, 1995; minimum, -1.71 ft Mar. 13, 1993.EXTREME DOWNSTREAM STAGES FOR CURRENT YEAR.--Maximum gage height 3.18 ft Sept. 16; minimum, -1.06 ft Mar 5.
SUMMARY STATISTICS FOR 2000 CALENDAR YEAR FOR 2001 WATER YEAR WATER YEARS 1953 - 2001 ANNUAL TOTAL 86020 12775 ANNUAL MEAN 235 35.0 740 HIGHEST ANNUAL MEAN 4152 1954 LOWEST ANNUAL MEAN 10.0 1962 HIGHEST DAILY MEAN 2570 Apr 29 35 Oct 1 11500 Mar 26 1970 LOWEST DAILY MEAN 35 Jan 5 35 Oct 1 4.0 May 3 1976 ANNUAL SEVEN-DAY MINIMUM 35 Feb 1 35 Oct 1 4.0 May 3 1976 ANNUAL RUNOFF (AC-FT) 170600 25340 536300 10 PERCENT EXCEEDS 670 35 2480 50 PERCENT EXCEEDS 35 35 30 90 PERCENT EXCEEDS 35 35 10
The period of record statistics were computed from complete water year's of record. See the annual mean and annual runoff (ac-ft) summary statistics section of the manuscript.
56 EVERGLADES AND SOUTHEASTERN COASTAL AREA
270022080094600 KITCHINGS CREEK NEAR HOBE SOUND, FL
LOCATION.--Lat 27°00'57", long 80°09'10", in SE 1⁄4 SE 1⁄4 SE
1⁄4 sec.5, T.40 S., R.42 E., Martin County, Hydrologic Unit 03090202, in Jonathan Dickinson State Park, near left bank on foot bridge, 1.75 mi upstream from mouth, 2.1 mi south of State Road 707, and 3.25 mi southwest of Hobe Sound.DRAINAGE AREA.--Indeterminate.PERIOD OF RECORD.--December 1979 to March 1982, October 1984 to current year.GAGE.--Water-stage and collector tube rain gage recorders. Rainfall data is available in the files of the U.S. Geological Survey. Elevation of gage is 6 ft above National Geodetic Vertical Datum of 1929, from topographic map.REMARKS.--Estimated record are good. Discharge below 5 cfs are fair - poor. Discharge from 5 - 150 cfs are good. Discharge above 150 cfs are fair - poor.ANNUAL MEAN and ANNUAL RUNOFF (AC-FT) SUMMARY STATISTICS.--Figures represent 16 complete water years of discharge (1981, 1985-88, 1990, 1992-2001).EXTREME STAGES FOR CURRENT YEAR.--Maximum gage height 7.18 ft (estimated) Aug. 2; minimum 1.49 ft May 19, 20.
SUMMARY STATISTICS FOR 2000 CALENDAR YEAR FOR 2001 WATER YEAR WATER YEARS 1980 - 2001 ANNUAL TOTAL 1367.33 8156.58 ANNUAL MEAN 3.74 22.3 18.3 HIGHEST ANNUAL MEAN 39.9 1995 LOWEST ANNUAL MEAN .99 1990 HIGHEST DAILY MEAN 115 Oct 4 297 Aug 3 1230 Oct 18 1995 LOWEST DAILY MEAN .21 Jun 21 .17 May 12 .01 Jun 5 1989 ANNUAL SEVEN-DAY MINIMUM .22 Jun 20 .17 May 15 .05 May 30 1989 MAXIMUM PEAK FLOW 309 Aug 2 1800 Oct 17 1995 MAXIMUM PEAK STAGE 8.70 Aug 2 11.00 Oct 17 1995 INSTANTANEOUS LOW FLOW .16 May 19 .00 Jun 1 1989 ANNUAL RUNOFF (AC-FT) 2710 16180 13270 10 PERCENT EXCEEDS 5.6 83 48 50 PERCENT EXCEEDS 1.4 1.3 3.9 90 PERCENT EXCEEDS .41 .23 .36 e Estimated
The period of record statistics were computed from complete water year's of record. See the annual mean and annual runoff (ac-ft) summary statistics section of the manuscript.
58 EVERGLADES AND SOUTHEASTERN COASTAL AREA
02277600 LOXAHATCHEE RIVER NEAR JUPITER, FL
LOCATION.--Lat 26°56'20", long 80°10'31", in NE 1⁄4 SE 1⁄4 NE
1⁄4 sec.6, T.41 S., R.42 E., Palm Beach County, Hydrologic Unit 03090202, near left bank, 0.2 mi downstream from State Road 706, 1.3 mi upstream from Floridás Turnpike and 5.2 mi west of Jupiter.DRAINAGE AREA.--Indeterminate.PERIOD OF RECORD.--April 1971 to current year.GAGE.--Water-stage recorder. Datum of gage is National Geodetic Vertical Datum of 1929.REMARKS.--Records good to fair above 40 cfs, and fair to poor below 40 cfs. Flow is augmented by diversion from C-18 canal 2.0 mi upstream from the gage. High-water flow can be diverted into C-18 canal by backflow through the structure. Discharge for the 1991 water year could not be published due to the loss of the original records.ANNUAL MEAN and ANNUAL RUNOFF (AC-FT) SUMMARY STATISTICS.--Figures represent 29 complete water years of discharge (1972-90,1992-2001).EXTREME STAGES FOR PERIOD OF RECORD.--Maximum gage height, 16.39 ft Oct. 18, 1995; minimum, 7.55 ft May 16, 17, 18, 2001.EXTREME STAGES FOR CURRENT YEAR.--Maximum gage height, 14.05 ft Aug. 2; minimum, 7.55 ft May 16, 17, 18.
SUMMARY STATISTICS FOR 2000 CALENDAR YEAR FOR 2001 WATER YEAR WATER YEARS 1971 - 2001 ANNUAL TOTAL 18590.6 30245.0 ANNUAL MEAN 50.8 82.9 82.7 HIGHEST ANNUAL MEAN 172 1993 LOWEST ANNUAL MEAN 24.2 1975 HIGHEST DAILY MEAN 300 Oct 4 531 Sep 13 2150 Oct 18 1995 LOWEST DAILY MEAN 5.8 Jun 18 2.0 May 17 .00 May 4 1974 ANNUAL SEVEN-DAY MINIMUM 7.4 Jun 15 2.6 May 15 .16 May 2 1974 MAXIMUM PEAK FLOW 633 Aug 2 2660 Oct 18 1995 MAXIMUM PEAK STAGE 14.05 Aug 2 16.39 Oct 18 1995 INSTANTANEOUS LOW FLOW .06 May 16 .00 May 4 1974 ANNUAL RUNOFF (AC-FT) 36870 59990 59930 10 PERCENT EXCEEDS 81 200 171 50 PERCENT EXCEEDS 44 53 61 90 PERCENT EXCEEDS 15 13 15 e Estimated
The period of record statistics were computed from complete water year's of record. See the annual mean and annual runoff (ac-ft) summary statistics section of the manuscript.
60
Figure 5. Typical flow patterns at Lake Okeechobee Control Structure.
61 EVERGLADES AND SOUTHEASTERN COASTAL AREA
02278000 WEST PALM BEACH CANAL AT S-352, AT CANAL POINT, FL
LOCATION.--Lat 26°51'05", long 80°37'55", in NE 1⁄4 sec.33, T.41 S., R.37 E., Palm Beach County, Hydrologic Unit 03090202, in the instrumentation house of gate structure 352 at Lake Okeechobee, 200 ft upstream from bridge on U.S. Highway 441 at Canal Point.DRAINAGE AREA.--Indeterminate.PERIOD OF RECORD.--November 1940 to current year.GAGE.--Satellite data collection platform with water-stage shaft encoders. Datum of gage is National Geodetic Vertical Datum of 1929 (U.S. Army Corps of Engineers bench mark). Prior to January 14, 1954, nonrecording lake gage at site 550 ft downstream at same datum. January 14, 1954 to February 24, 1956, lake water-stage recorder, and February 25, 1956, to September 30, 1967, canal water-stage and deflection vane recorders all at present site and datum. May 1940, auxiliary water-stage recorder at old lock, 700 ft downstream from gate structures replaced on May 1, 1995, by data collection platform at structure. August 1986 to December 1989, electromagnetic velocity meter. Digital water-stage recorder removed and satellite data collection platform installed January 14, 1992.REMARKS.--Records are fair except for estimated daily discharges, which are poor. Flow regulated at station by operation of gates. Flow was occasionally reversed after periods of considerable rainfall because of downstream natural drainage and pumpage from agricultural lands in the Everglades (negative figures indicate flow reversed), since vertical lift gates replaced HGS-5, reverse flow is not expected. Discharge computed from relations between discharge, head, and gate openings at gate structure S-352. Discharge and lake gage height formerly published as West Palm Beach Canal at HGS-5, at Canal Point. Canal gage height prior to 1997 water year, formerly published as West Palm Beach Canal below S-352, at Canal Point under 02278002.COOPERATION.--Gate record provided by South Florida Water Management District.ANNUAL MEAN and ANNUAL RUNOFF (AC-FT) SUMMARY STATISTICS.--Figures represent 57 complete water years of discharge (1941-89, 1992-97, 1999-2000).EXTREME LAKE STAGES FOR PERIOD OF RECORD.--Maximum gage height, 19.48 ft Mar. 9, 1998; minimum observed, 8.33 ft May 22, 2001.EXTREME LAKE STAGES FOR CURRENT YEAR.--Maximum gage height, 14.43 ft Sept. 30; minimum, 8.33 ft May 22.EXTREME CANAL STAGES FOR PERIOD OF RECORD.--Maximum gage height, 18.70 ft Oct. 12, 1947; minimum, 6.90 ft observed, Oct. 28, 1981.EXTREME CANAL STAGES FOR CURRENT YEAR.--Maximum gage height, 12.90 ft Oct. 5; minimum 7.51 ft May 3.
SUMMARY STATISTICS FOR 2000 CALENDAR YEAR FOR 2001 WATER YEAR WATER YEARS 1940 - 2001 ANNUAL TOTAL 88583.00 ANNUAL MEAN 242 164 HIGHEST ANNUAL MEAN 374 1961 LOWEST ANNUAL MEAN -20.8 1962 HIGHEST DAILY MEAN 931 May 4 787 Mar 9 1610 Oct 2 1959 LOWEST DAILY MEAN -66 Oct 5 -66 Oct 5 -1760 Jun 15 1942 ANNUAL SEVEN-DAY MINIMUM -9.4 Sep 29 -9.4 Oct 1 -1640 Jun 11 1942 ANNUAL RUNOFF (AC-FT) 175700 118800 10 PERCENT EXCEEDS 714 400 536 50 PERCENT EXCEEDS 52 .00 40 90 PERCENT EXCEEDS .00 .00 .00 e Estimated
The period of record statistics were computed from complete water year's of record. See the annual mean and annual runoff (ac-ft) summary statistics section of the manuscript.
64 EVERGLADES AND SOUTHEASTERN COASTAL AREA
265501080364900 LEVEE 8 CANAL NEAR CANAL POINT, FL
LOCATION.--Lat 26°55'01", long 80°36'49", in SE 1⁄4 sec.10, T.41S., R.37 E., Palm Beach County, Hydrologic Unit 03090202, on west side of U.S. Highway 441 bridge, 3.6 mi northeast of Canal Point, and 4.8 mi south of Port Mayaca, at Sand Cut.DRAINAGE AREA.--Indeterminate.PERIOD OF RECORD.--August 1976 to current year.GAGE.--Satellite data collection platform with water-stage shaft encoder and acoustic velocity meter. Datum of gage is National Geodetic Vertical Datum of 1929.REMARKS.--Records are poor. Flow regulated by gated structure at Lake Okeechobee. Flow reverses during and after periods of heavy rainfall because of pumpage into the canal from agricultural lands in the Everglades (negative figures indicate flow towards Lake Okeechobee).ANNUAL MEAN and ANNUAL RUNOFF (AC-FT) SUMMARY STATISTICS.--Figures represent 17 complete water years of discharge (1977-89, 1995, 1997-99).EXTREME STAGES FOR PERIOD OF RECORD.--Maximum gage height, 19.39 ft Oct. 19, 1995; minimum, 8.57 ft May 21, 2001 (estimated).EXTREME STAGES FOR CURRENT YEAR.--Maximum gage height, 15.13 ft Sept. 30; minimum, 8.57 ft May 21 (estimated).
SUMMARY STATISTICS FOR 2000 CALENDAR YEAR FOR 2001 WATER YEAR WATER YEARS 1976 - 2001 ANNUAL TOTAL -11526.21 ANNUAL MEAN -31.5 .33 HIGHEST ANNUAL MEAN 125 1989 LOWEST ANNUAL MEAN -126 1997 HIGHEST DAILY MEAN 494 Mar 2 92 Mar 5 766 Apr 25 1983 LOWEST DAILY MEAN -929 Oct 7 -929 Oct 7 -1400 Sep 30 1992 ANNUAL SEVEN-DAY MINIMUM -799 Oct 4 -805 Sep 13 -1160 Sep 29 1992 ANNUAL RUNOFF (AC-FT) -22860 238 10 PERCENT EXCEEDS 307 12 210 50 PERCENT EXCEEDS -22 -58 .00 90 PERCENT EXCEEDS -420 -630 -253 e Estimated
The period of record statistics were computed from complete water year's of record. See the annual mean and annual runoff (ac-ft) summary statistics section of the manuscript.
66 EVERGLADES AND SOUTHEASTERN COASTAL AREA
02278450 WEST PALM BEACH CANAL ABOVE S-5A, NEAR LOXAHATCHEE, FL
LOCATION.--Lat 26°41'05", long 80°22'15", in SW 1⁄4 sec.32, T.43 S., R.43 E., Palm Beach County, Hydrologic Unit 03090202, near south bank, 500 ft upstream from pump station S-5A, 0.3 mi upstream from Levee 8 Canal, 1.1 mi downstream from bridge on U.S. Highway 441 and Cross Canal, and 6 mi west of Loxahatchee.DRAINAGE AREA.--Indeterminate.PERIOD OF RECORD.--October 1957 to current year.REVISED RECORDS.--WDR FL-93-2A:1983.GAGE.--Electronic data logger for the conservation area, satellite data collection platforms with water-stage shaft encoders for Levee 8 Canal and West Palm Beach Canal. Datum of gage is National Geodetic Vertical Datum of 1929 (South Florida Water Management District bench mark). Prior to September 30, 1967, deflection vane recorder at same site and auxiliary water-stage recorder at control structure 5A-W, 0.3 mi downstream. Prior to October 1981, all gages at datum 0.24 ft higher.REMARKS.--Records fair, except for estimated daily discharges, which are poor. Flow regulated primarily by pumpage at S-5A and to a lesser extent by operation of control structure 5A-W. Major regulation above the station occurs in Cross Canal, 1.5 mi upstream, and at Lake Okeechobee, 20 mi upstream. Discharge is the difference between pumpage at S-5A and gate discharge at S-5A-W. Negative figures indicate flow to the west. See records on Diversions to Conservation Area No. 1 at S-5A, near Loxahatchee (station 02278500; pump station S-5A, upper), for table of daily gage height and extremes for period of record. Starting in water year 2001, negative discharge from control structure S-5A-W is considered estimated due to updated information provided to the U.S. Geological Survey, about the site. Prior negative discharges are not marked estimated in the files or databases of U.S. Geological Survey. Estimated discharge does not necessarily indicate negative discharge through control structure S-5A-W.COOPERATION.--Gate-opening, pump records and supplemental stage data provided by South Florida Water Management District.ANNUAL MEAN and ANNUAL RUNOFF (AC-FT) SUMMARY STATISTICS.--Figures represent 44 complete water years of discharge (1958-2001).
SUMMARY STATISTICS FOR 2000 CALENDAR YEAR FOR 2001 WATER YEAR WATER YEARS 1958 - 2001 ANNUAL TOTAL 122877.30 113088.70 ANNUAL MEAN 336 310 398 HIGHEST ANNUAL MEAN 716 1960 LOWEST ANNUAL MEAN 150 1990 HIGHEST DAILY MEAN 4500 Oct 6 4500 Oct 6 5230 Mar 27 1970 LOWEST DAILY MEAN -507 Nov 4 -507 Nov 4 -967 Jun 3 1991 ANNUAL SEVEN-DAY MINIMUM -405 Oct 30 -405 Oct 30 -624 Jun 6 1984 ANNUAL RUNOFF (AC-FT) 243700 224300 288400 10 PERCENT EXCEEDS 772 1300 1340 50 PERCENT EXCEEDS .00 .00 114 90 PERCENT EXCEEDS .00 -6.5 -61 e Estimated
The period of record statistics were computed from complete water year's of record. See the annual mean and annual runoff (ac-ft) summary statistics section of the manuscript.
67
Figure 6. South Florida Water Management District, Structure 5 Complex.
68 EVERGLADES AND SOUTHEASTERN COASTAL AREA
02278500 DIVERSIONS TO CONSERVATION AREA N0. 1 AT S-5A AND S-5A-S, NEAR LOXAHATCHEE, FL
LOCATION.--Lat 26°41'00", long 80°22'10", in SW 1⁄4 sec.32, T.43 S., R.40 E., Palm Beach County, Hydrologic Unit 03090202, at pump station S-5A, 1.5 mi downstream from Cross Canal, and 6 mi west of Loxahatchee.DRAINAGE AREA.--Indeterminate.PERIOD OF RECORD.--October 1957 to current year. Records of gage heights prior to October 1961 are available in files of the U.S. Geological Survey.GAGE.--Electronic data logger for the conservation area, satellite data collection platforms with water-stage shaft encoders for Levee 8 Canal and West Palm Beach Canal. Datum of gage is National Geodetic Vertical Datum of 1929 (South Florida Water Management District bench mark). Prior to September 30, 1967, auxiliary deflection vane recorder 500 ft upstream and in Levee 8 Canal, and auxiliary water-stage recorder upstream from S-5A-W and downstream from S-5A-E. Prior to October 1981, all gages at datum 0.24 ft higher.REMARKS.--Records fair, except for estimated daily discharges, which are poor. Normal flow is considered as that to the south into Conservation Area No.1. Flow is controlled by S-5A pumpage, siphoning, gate operation of S-5A-S, and regulation of Cross Canal, 1.5 mi upstream, and gate structure S-352, 20 mi upstream. Negative figures indicate releases from gate S-5A-S when stage in the conservation area is higher than stage in Levee 8 Canal. The discharge is summation of S-5A pumpage, siphoning and S-5A-S gate flow. Stage determined from either of 2 sources, digital recorder at 02278500 or DCP stage from 02278520 station. Digital recorder discontinued on January 14, 1999.COOPERATION.--Gate-opening, pump records and supplemental stage record provided by South Florida Water Management District.ANNUAL MEAN and ANNUAL RUNOFF (AC-FT) SUMMARY STATISTICS.--Figures represent 44 complete water years of discharge (1958-2001).EXTREME STAGES FOR PERIOD OF RECORD.--Maximum gage height, 14.26 ft present datum, Oct. 3, 1957; minimum, 6.86 ft Oct. 28, 1981.EXTREME STAGES FOR CURRENT YEAR.--Maximum gage height, 12.14 ft Oct. 5; minimum, 7.36 ft May 3.
SUMMARY STATISTICS FOR 2000 CALENDAR YEAR FOR 2001 WATER YEAR WATER YEARS 1958 - 2001 ANNUAL TOTAL 116220.10 103831.00 ANNUAL MEAN 318 284 373 HIGHEST ANNUAL MEAN 660 1966 LOWEST ANNUAL MEAN 111 1971 HIGHEST DAILY MEAN 4500 Oct 6 4500 Oct 6 7040 Mar 28 1970 LOWEST DAILY MEAN -713 Oct 31 -713 Oct 31 -2200 Apr 27 1982 ANNUAL SEVEN-DAY MINIMUM -612 Oct 29 -612 Oct 29 -1570 Nov 23 1991 ANNUAL RUNOFF (AC-FT) 230500 205900 270100 10 PERCENT EXCEEDS 776 1330 1480 50 PERCENT EXCEEDS 172 .00 .00 90 PERCENT EXCEEDS -238 -284 -75 e Estimated
The period of record statistics were computed from complete water year's of record. See the annual mean and annual runoff (ac-ft) summary statistics section of the manuscript.
70 EVERGLADES AND SOUTHEASTERN COASTAL AREA
02278501 CONSERVATION AREA NO. 1 BELOW S-5 COMPLEX, NEAR LOXAHATCHEE, FL
LOCATION.--Lat 26°41'00", long 80°22'10", in SW 1⁄4 sec.32, T.43 S., R.40 E., Palm Beach County, Hydrologic Unit 03090202, at pump station S-5A, 1.5 mi downstream from Cross Canal, and 6 mi west of Loxahatchee.DRAINAGE AREA.--Indeterminate.PERIOD OF RECORD.--January 1955 to current year (gage heights only).GAGE.--Electronic data logger. Datum of gage is National Geodetic Vertical Datum of 1929 (South Florida Water Management District bench marks). Prior to October 1981, at datum 0.24 ft higher.REMARKS.--Gage records water level in Conservation Area No. 1 at structure 5 complex. Stage is affected by pumping at S-5A and S-6 and the operation of gated-control structures in levees 39 and 40. Discharge for S-5A-S is stored under this station number in the U.S. Geological Survey's database starting 1991 water year. Records of gage height prior to October 1967 are available from the files of the U.S. Geological Survey.COOPERATION.-- Supplemental stage record provided by South Florida Water Management District.EXTREME STAGES FOR PERIOD OF RECORD.--Maximum gage height, 18.93 ft Oct. 18 1999; minimum, 8.26 ft present datum, Apr. 20, 24, 1956.EXTREME STAGES FOR CURRENT YEAR.--Maximum gage height, 18.47 ft Oct. 5; minimum, 10.26 ft June 23.
02278550 LEVEE 8 CANAL AT WEST PALM BEACH CANAL NEAR LOXAHATCHEE, FL
LOCATION.--Lat 26°41'05", long 80°21'35", in SE 1⁄4 sec.32, T.43 S., R.40 E., Palm Beach County, Hydrologic Unit 03090202, 37 mi east of Belle Glade on U.S. Highway 441, 21 mi southeast of Canal Point on U.S. Highway 98 and 6 mi west of Loxahatchee.DRAINAGE AREA.--Indeterminate.PERIOD OF RECORD.--October 1957 to current year.REVISED RECORDS.--WDR FL-84-2A:1982, (revised maximum negative discharge).GAGE.--Satellite data collection platforms with water-stage shaft encoders for Levee 8 Canal and West Palm Beach Canal west of Levee 8 Canal, Moscad RF Data/Telemetry system operated by South Florida Water Management District for West Palm Beach Canal east of Levee 8 Canal, electronic data logger for Conservation area. Datum of gage is National Geodetic Vertical Datum of 1929 (South Florida Water Management District bench mark).REMARKS.--Records fair, except estimated daily discharges, which are poor. Flow regulated by operation of S-5A-E, S-5A-S, and S-5A-W, just downstream and pumpage at S-5A. Gate operation and pumpage occasionally reverses the flow (negative figures indicate flow reversed). Discharge is summation of flows at S-5A-E, S-5A-S, and S-5A-W. Discharge computed from relation between discharge, head, and gate openings. Records of gage heights prior to October 1961, are available in files of the U.S. Geological Survey, (USGS). Prior to September 30, 1967, deflection vane recorder at upstream side in center of span of bridge on U.S. Highway 441, 50 ft upstream from mouth and West Palm Beach Canal. Prior to October 1981, all gages at datum 0.24 ft higher. Satellite data collection platform with acoustic velocity meter installed April 11, 1991, at same location of satellite data collection platform, removed October, 1993. Starting in the water year 2001, negative discharge from control structure S-5A-W and S-5A-E is considered estimated due to updated information, provided to USGS about the site. Prior negative discharges are not marked estimated in the files or data bases of USGS. Estimated discharge does not necessarily indicate negative discharges through these control structures.COOPERATION.--Gate-opening record and supplemental stage record provided by South Florida Water Management District.ANNUAL MEAN and ANNUAL RUNOFF (AC-FT) SUMMARY STATISTICS.--Figures represent 41 complete water years of discharge (1958-89, 1991-92, 1994-98, 2000-01).EXTREME STAGES FOR PERIOD OF RECORD.--Maximum gage height, 19.58 ft present datum, Oct. 18, 1995, from flood mark; minimum, 8.29 ft present datum, Mar. 17, 1969.EXTREME STAGES FOR CURRENT YEAR.--Maximum gage height, 17.99 ft Aug. 6; minimum, 9.43 ft May 14.
SUMMARY STATISTICS FOR 2000 CALENDAR YEAR FOR 2001 WATER YEAR WATER YEARS 1958 - 2001 ANNUAL TOTAL 14701.70 -6687.10 ANNUAL MEAN 40.2 -18.3 140 HIGHEST ANNUAL MEAN 453 1970 LOWEST ANNUAL MEAN -76.7 1977 HIGHEST DAILY MEAN 562 Mar 2 396 Aug 7 3130 Oct 23 1995 LOWEST DAILY MEAN -438 Aug 29 -370 Oct 26 -2540 Apr 27 1982 ANNUAL SEVEN-DAY MINIMUM -314 Oct 24 -351 Aug 31 -1700 Nov 27 1991 ANNUAL RUNOFF (AC-FT) 29160 -13260 101100 10 PERCENT EXCEEDS 356 150 436 50 PERCENT EXCEEDS .00 -.90 69 90 PERCENT EXCEEDS -172 -258 -111 e Estimated
The period of record statistics were computed from complete water year's of record. See the annual mean and annual runoff (ac-ft) summary statistics section of the manuscript.
73 EVERGLADES AND SOUTHEASTERN COASTAL AREA
02278600 WEST PALM BEACH CANAL BELOW S-5A-E, NEAR LOXAHATCHEE, FL
LOCATION.--Lat 26°41'05", long 80°21'50", in SE 1⁄4 sec.32, T.43 S., R.40 E., Palm Beach County, Hydrologic Unit 03090202, near left bank, 350 ft downstream from control structure 5A-E, and 6 mi west of Loxahatchee.DRAINAGE AREA.--Indeterminate.PERIOD OF RECORD.--September 1955 to current year. Monthly discharge only for September 1955, published in WSP 1724. Records of gage heights prior to October 1961, are available in files of the U.S. Geological Survey.GAGE.--Satellite data collection platform with water-stage shaft encoder for Levee 8 Canal, South Florida Water Management District CR 10 RFdata/telemetry system for West Palm Beach Canal east of Levee 8 Canal. Datum of gage is National Geodetic Vertical Datum of 1929 (South Florida Water Management District bench mark). Auxiliary water-stage recorder on West Palm Beach Canal 100 ft east from S-5A-E discontinued on January 14, 1999. Prior to October 1981 all gages at datum 0.24 ft higher.REMARKS.--Records fair. Normal flow to east regulated at S-5A-E for irrigation and drainage. Flow diverted upstream from station through S-5A-S and by pumpage at S-5A. Flow materially affected by regulation of Cross Canal 1.5 mi upstream and gate structure S-352, 20 mi upstream. Negative figures indicate flow to the west. Discharge computed from relations between discharge, head, and gate openings at S-5A-E. Acoustic velocity meter installed May 1, 1991, along with satellite data collection platform. Acoustic velocity meter removed September 30, 1993. No discharge was computed using the acoustic velocity meter record. Starting in water year 2001, negative discharge is considered estimated, due to updated information provided to the U.S. Geological Survey, (USGS), about the site. Prior negative discharges are not marked estimated in the files or databases of USGS.COOPERATION.--Gate-opening record provided by South Florida Water Management District.ANNUAL MEAN and ANNUAL RUNOFF (AC-FT) SUMMARY STATISTICS.--Figures represent 43 complete water years of discharge (1956-89, 1991-92, 1994-98, 2000-01).EXTREME STAGES FOR PERIOD OF RECORD.--Maximum gage height, 17.34 ft present datum, Oct. 16, 1999; minimum, 6.24 ft present datum, Sept. 9, 1965.EXTREME STAGES FOR CURRENT YEAR.--Maximum gage height, 15.78 ft Oct. 4; minimum, 7.08 ft May 17.
SUMMARY STATISTICS FOR 2000 CALENDAR YEAR FOR 2001 WATER YEAR WATER YEARS 1956 - 2001 ANNUAL TOTAL 21367.10 2573.70 ANNUAL MEAN 58.4 7.05 165 HIGHEST ANNUAL MEAN 573 1961 LOWEST ANNUAL MEAN 1.43 1991 HIGHEST DAILY MEAN 585 Jan 2 396 Aug 7 1630 Jul 8 1992 LOWEST DAILY MEAN -38 Oct 4 -61 Jun 28 -930 Mar 29 1982 ANNUAL SEVEN-DAY MINIMUM -5.4 Sep 28 -8.7 Jun 22 -566 May 28 1982 ANNUAL RUNOFF (AC-FT) 42380 5100 119500 10 PERCENT EXCEEDS 191 .00 526 50 PERCENT EXCEEDS .00 .00 35 90 PERCENT EXCEEDS .00 .00 .00 e Estimated
The period of record statistics were computed from complete water year's of record. See the annual mean and annual runoff (ac-ft) summary statistics section of the manuscript.
75 EVERGLADES AND SOUTHEASTERN COASTAL AREA
02279000 WEST PALM BEACH CANAL AT WEST PALM BEACH, FL
LOCATION.--Lat 26°38'40", long 80°03'22", in NW 1⁄4 sec.15, T.44 S., R.34 E., Palm Beach County, Hydrologic Unit 03090202, on left bank in concrete control house north of control structure, 200 ft downstream from bridge on U.S. Highway 1, and 4.9 mi south of courthouse in West Palm Beach.DRAINAGE AREA.--Indeterminate.PERIOD OF RECORD.--November 1939 to current year. Records of gage heights prior to October 1961 are available in files of the U.S. Geological Survey.REVISED RECORDS.--WDR FL-91-2A:1986-89.GAGE.--Electronic data logger with shaft encoders for upstream and downstream stages, electronic data logger for 3 gate recorders. Prior to September 23, 1999, digital gate recorders. Prior to November 17, 1999, digital water-stage recorders upstream and downstream. Datum of gage is National Geodetic Vertical Datum of 1929 (State Department of Transportation bench mark). Prior to May 1, 1984, digital upstream stage recorder, and gate-opening indicator at site 200 ft upstream at same datum. Prior to April 26, 1940, nonrecording gage, April 26, 1940 to December 20, 1949, water-stage recorder, at same site at datum 0.25 ft higher, and December 20, 1949 to June 3, 1959, at same site and present datum. June 3, 1959 to September 30, 1985, water-stage and deflection vane recorder at site 800 ft upstream at present datum.REMARKS.-- Records are poor. Flow regulated by operation of control structure. Since January 1954, flow affected by control structures 20 mi upstream. Discharge computed from relations between discharge,head and gate openings.COOPERATION.--Gate-operation record provided by South Florida Water Management District.ANNUAL MEAN and ANNUAL RUNOFF (AC-FT) SUMMARY STATISTICS.--Figures represent 54 complete water years of discharge (1941-84, 1986-90, 1993-94, 1998-99, 2001).EXTREME UPSTREAM STAGES FOR PERIOD OF RECORD.--Maximum gage height, 10.89 ft Oct. 13, 1947, present datum; minimum, 2.85 ft Dec. 3, 1953, Oct. 9, 1963, and Sept. 9, 1964.EXTREME UPSTREAM STAGES FOR CURRENT YEAR.--Maximum gage height, 9.27 ft Nov 25; minimum, 6.89 ft Mar. 20.EXTREME DOWNSTREAM STAGES FOR CURRENT YEAR.--Maximum gage height, 3.88 ft Sept. 16; minimum, -1.75 ft Feb. 8.
SUMMARY STATISTICS FOR 2000 CALENDAR YEAR FOR 2001 WATER YEAR WATER YEARS 1940 - 2001 ANNUAL TOTAL 102555.00 160169.40 ANNUAL MEAN 280 439 670 HIGHEST ANNUAL MEAN 1542 1947 LOWEST ANNUAL MEAN 129 1989 HIGHEST DAILY MEAN 3040 Nov 25 4860 Sep 14 5950 Oct 18 1999 LOWEST DAILY MEAN .00 Jan 20 .00 Oct 20 .00 May 2 1984 ANNUAL SEVEN-DAY MINIMUM .00 Feb 29 .00 Nov 1 .00 May 8 1984 ANNUAL RUNOFF (AC-FT) 203400 317700 485300 10 PERCENT EXCEEDS 815 1400 1450 50 PERCENT EXCEEDS 72 22 516 90 PERCENT EXCEEDS .00 .00 10 e Estimated
The period of record statistics were computed from complete water year's of record. See the annual mean and annual runoff (ac-ft) summary statistics section of the manuscript.
78 EVERGLADES AND SOUTHEASTERN COASTAL AREA
264514080550700 INDUSTRIAL CANAL AT CLEWISTON, FL
LOCATION.--Lat 26°45'14", long 80°55'07", in NW 1⁄4 sec.14, T.43 S., R.34 E., Hendry County, Hydrologic Unit 03090202, on concrete wall inside lock chamber of structure S-310 (HGS-2) in Okeechobee Waterway, and 0.8 mi north of U.S. Highway 27 nearClewiston.DRAINAGE AREA.--Indeterminate.PERIOD OF RECORD.--August 1976 to September 1979, October 1979 to September 1981 (gage heights only), October 1982 to current year.GAGE.--Satellite data collection platform with water-stage shaft encoder and acoustic doppler velocity meter. Datum of gage is National Geodetic Vertical Datum of 1929. Prior to October 1979, at datum 0.24 ft lower. Prior to April 19, 2001, acoustic velocity meter at same site and datum. Prior to October 19, 1992, water-stage recorder and electromagnetic velocity meter at site. Prior to October 1982, water-stage recorder 0.4 mi downstream of S-310 (HGS-2) on south side of U.S. Highway 27 bridge. August 1976 to September 1979, deflection velocity meter recorder on south side of U.S. Highway 27 bridge.REMARKS.--Records are poor. Flow regulated by hurricane gate at Lake Okeechobee. Prior to October 19, 1992, electromagnetic velocity meter at site.ANNUAL MEAN and ANNUAL RUNOFF (AC-FT) SUMMARY STATISTICS.--Figures represent 10 complete water years of discharge (1977-79, 1983-87, 1990, 1994).EXTREME STAGES FOR PERIOD OF RECORD.--Maximum gage height, 19.17 ft Mar. 7, 1983; minimum, 8.73 ft May 23, 2001.EXTREME STAGES FOR CURRENT YEAR.--Maximum gage height, 14.80 ft Sept. 30; minimum, 8.73 ft May 23.
SUMMARY STATISTICS FOR 2000 CALENDAR YEAR FOR 2001 WATER YEAR WATER YEARS 1976 - 2001 ANNUAL MEAN 59.7 HIGHEST ANNUAL MEAN 232 1987 LOWEST ANNUAL MEAN -30.2 1978 HIGHEST DAILY MEAN 374 May 25 306 Nov 7 740 Feb 24 1989 LOWEST DAILY MEAN -515 Sep 18 -534 Sep 14 -1400 Jul 4 1984 ANNUAL SEVEN-DAY MINIMUM -257 Sep 17 -303 Sep 10 -455 Jun 26 1992 ANNUAL RUNOFF (AC-FT) 43230 10 PERCENT EXCEEDS 242 126 242 50 PERCENT EXCEEDS 57 8.2 21 90 PERCENT EXCEEDS -50 -44 -77 e Estimated
The period of record statistics were computed from complete water year's of record. See the annual mean and annual runoff (ac-ft) summary statistics section of the manuscript.
80 EVERGLADES AND SOUTHEASTERN COASTAL AREA
02280500 HILLSBORO CANAL BELOW S-351, NEAR SOUTH BAY, FL
LOCATION.--Lat 26°42'00", long 80°42'45", in SW 1⁄4 sec.35, T.43 S., R.36 E., Palm Beach County, Hydrologic Unit 03090202, acoustic velocity meter located approximately 1,800 ft downstream from S-351 and pump station 2 at Lake Okeechobee, and 2.5 mi north of South Bay, along the south bank of Hillsboro Canal.DRAINAGE AREA.--Indeterminate.PERIOD OF RECORD.--March 1957 to current year.REVISED RECORDS.--WDR FL-92-2A:1991.GAGE.--Satellite data collection platform with water-stage shaft encoder and acoustic velocity meter. Prior to October 1, 1986, water-stage recorder at pump station 2 used for gage heights at this station. Prior to August 1982, deflection meter. Prior to April 1993 water year electromagnetic velocity meter and digital water-stage recorder. Satellite data collection platform with water-stage shaft encoder and acoustic velocity meter installed December 1990. Datum of gage is National Geodetic Vertical Datum of 1929 (U.S. Army Corps of Engineers bench mark).REMARKS.--Records poor. Flow regulated by vertical lift gates and pump station at Lake Okeechobee. Flow frequently reversed during and after periods of heavy rainfall by pumpage into the canal from agricultural lands in the Everglades, by the operation of pump station 2, or by gravity flow through gates during periods of negative head (negative figures indicate flow reversed). Discharge computed from continuous velocity record obtained from acoustic velocity meter.ANNUAL MEAN and ANNUAL RUNOFF (AC-FT) SUMMARY STATISTICS.--Figures represent 40 complete water years of discharge (1958-88, 1991-95, 1997-98, 2000-01).EXTREME STAGES FOR PERIOD OF RECORD.--Maximum gage height, 14.09 ft Sept. 28, 1962; minimum, 6.98 ft Oct. 28, 1981.EXTREME STAGES FOR CURRENT YEAR.--Maximum gage height, 13.27 ft Sept. 29, (estimated); minimum, 7.64 ft May 3.
SUMMARY STATISTICS FOR 2000 CALENDAR YEAR FOR 2001 WATER YEAR WATER YEARS 1957 - 2001 ANNUAL TOTAL 91673.80 24908.40 ANNUAL MEAN 250 68.2 15.0 HIGHEST ANNUAL MEAN 288 2000 LOWEST ANNUAL MEAN -207 1960 HIGHEST DAILY MEAN 881 May 20 394 Mar 9 1210 Apr 27 1999 LOWEST DAILY MEAN -1240 Oct 5 -1240 Oct 5 -1720 Aug 19 1981 ANNUAL SEVEN-DAY MINIMUM -537 Oct 2 -722 Aug 2 -1190 Aug 17 1981 ANNUAL RUNOFF (AC-FT) 181800 49410 10860 10 PERCENT EXCEEDS 638 314 373 50 PERCENT EXCEEDS 236 124 29 90 PERCENT EXCEEDS -43 -338 -333 e Estimated
The period of record statistics were computed from complete water year's of record. See the annual mean and annual runoff (ac-ft) summary statistics section of the manuscript.
82 EVERGLADES AND SOUTHEASTERN COASTAL AREA
02281200 HILLSBORO CANAL AT S-6, NEAR SHAWANO, FL
LOCATION.--Lat 26°28'18", long 80°26'46", in NE 1⁄4 sec.4, T.46 S., R.39 E., Palm Beach County, Hydrologic Unit 03090202, at pump station 6, and 7 mi southeast of Shawano.DRAINAGE AREA.--Indeterminate.PERIOD OF RECORD.--October 1957 to September 1968 (gage heights and discharge). October 1968 to September 1981 (discharge), October 1990 to current year.GAGE.--Satellite data collection platform with water-stage shaft encoder and acoustic velocity meter until January 30, 2002, when it was removed. Satellite data collection platform with water-stage shaft encoder and acoustic doppler velocity meter installed August 10, 2001. The acoustic velocity meter and acoustic doppler velocity meter were run in tandem for the period of August 10, 2001 to January 30, 2002. Dual water-stage recorder from 1968 to 1981 at S-6. Datum of gage is National Geodetic Vertical Datum of 1929 (U.S. Army Corps of Engineers bench mark). Prior to October 1, 1959, at datum 0.44 ft lower.REMARKS.--Records poor. Flow regulated by pumpage at S-6, by Structure 351 and pump station 2 at Lake Okeechobee and by drainage and irrigation pumps upstream. Records include flow from Levee 6 Canal since March 15, 1966. Discharge is the summation of pumpage and siphoning at S-6. Negative flow indicates flow to the north due to siphoning at S-6. Acoustic velocity meter system began operation October 1990, on both S-6 and L-6 canals. After October 1, 1999, total discharge represents S-6 canal flow. Everglades Construction Project for Storm Treatment Area 2 (STA2) had a permanent effect on L-6 canal. Flow from L-6 canal into Hillsboro canal main channel was plugged in August 1999, approximately 0.25 mi upstream of L-6 cross-section for the diversion of flow into STA2. L-6 acoustic velocity meter was discontinued on September 30, 1999. From October 1990 to September 1999, total discharge is computed by the sum of S-6 and L-6 discharges from relations between stage vs area and line velocity vs mean velocity index ratings.COOPERATION.--Records furnished by South Florida Water Management District October 1968 to September 1981. Prior to October 1968, pump records furnished by South Florida Water Management District, and records computed by U.S. Geological Survey. After reestablishment in the 1991 water year, records computed by U.S. Geological Survey.ANNUAL MEAN and ANNUAL RUNOFF (AC-FT) SUMMARY STATISTICS.--Figures represent 26 complete water years of discharge (1958-81, 1998, 2001).EXTREME STAGES FOR PERIOD OF RECORD.--Maximum gage height, 14.74 ft Dec. 25, 1958; minimum, 7.35 ft May 14, 1959.EXTREME STAGES FOR CURRENT YEAR.--Maximum gage height, 12.64 ft Mar. 30; minimum, 7.79 ft May 3.
SUMMARY STATISTICS FOR 2000 CALENDAR YEAR FOR 2001 WATER YEAR WATER YEARS 1958 - 2001 ANNUAL TOTAL 75627.00 ANNUAL MEAN 207 227 HIGHEST ANNUAL MEAN 597 1998 LOWEST ANNUAL MEAN 68.1 1962 HIGHEST DAILY MEAN 2920 Oct 5 2920 Oct 5 4480 May 1 1998 LOWEST DAILY MEAN .00 Jan 22 .00 Oct 17 -673 Apr 16 1991 ANNUAL SEVEN-DAY MINIMUM .00 Feb 12 .00 Oct 17 -407 Jun 12 1980 ANNUAL RUNOFF (AC-FT) 150000 164300 10 PERCENT EXCEEDS 736 835 993 50 PERCENT EXCEEDS .00 .00 .00 90 PERCENT EXCEEDS .00 .00 .00 e Estimated
The period of record statistics were computed from complete water year's of record. See the annual mean and annual runoff (ac-ft) summary statistics section of the manuscript.
84 EVERGLADES AND SOUTHEASTERN COASTAL AREA
02281400 HILLSBORO CANAL NEAR MARGATE, FL
LOCATION.--Lat 26°19'48", long 80°12'45", in NW 1⁄4 sec.36, T.47 S., R.41 E., Broward County, Hydrologic Unit 03090202, on north side of Hillsboro Road, 0.7 mi west of U.S. Highway 441, and 5.1 mi north of Margate.DRAINAGE AREA.--Indeterminate.PERIOD OF RECORD.--December 1975 to current year.REVISED RECORDS.--WDR FL-99-2A:1998GAGE.--Electronic data logger with water-stage shaft encoder and acoustic doppler velocity meter with cellular phone/radio telemetry provided by South Florida Water Management District starting September, 1999. Digital water-stage recorder removed September 27, 1999. Electromagnetic velocity meter prior to October 1, 1999. Datum of gage is National Geodetic Vertical Datum of 1929.REMARKS.--Records are fair. Flow affected by regulation downstream and upstream storage releases at control structures S-39 and S39A.ANNUAL MEAN and ANNUAL RUNOFF (AC-FT) SUMMARY STATISTICS.--Figures represent 18 complete water years of discharge (1977-89, 1996, 1998-2001).EXTREME STAGES FOR PERIOD OF RECORD.--Maximum gage height, 12.88 ft Apr. 25, 1979; minimum, 4.15 ft May 20, 1978.EXTREME STAGES FOR CURRENT YEAR.--Maximum gage height, 10.20 ft Sept. 29; minimum, 5.08 ft Mar. 14.
SUMMARY STATISTICS FOR 2000 CALENDAR YEAR FOR 2001 WATER YEAR WATER YEARS 1976 - 2001 ANNUAL TOTAL 77190 46265.0 ANNUAL MEAN 211 127 221 HIGHEST ANNUAL MEAN 351 2000 LOWEST ANNUAL MEAN 103 1977 HIGHEST DAILY MEAN 1070 Oct 4 1070 Oct 4 1300 Oct 18 1999 LOWEST DAILY MEAN 48 Jun 1 -7.0 Mar 30 -247 Apr 25 1979 ANNUAL SEVEN-DAY MINIMUM 56 Jun 25 31 May 31 -45 Nov 17 1976 ANNUAL RUNOFF (AC-FT) 153100 91770 160300 10 PERCENT EXCEEDS 654 237 500 50 PERCENT EXCEEDS 115 80 133 90 PERCENT EXCEEDS 64 44 37 e Estimated
The period of record statistics were computed from complete water year's of record. See the annual mean and annual runoff (ac-ft) summary statistics section of the manuscript.
86 EVERGLADES AND SOUTHEASTERN COASTAL AREA
02282700 MIDDLE RIVER CANAL AT S-36, NEAR FORT LAUDERDALE, FL
LOCATION.--Lat 26°10'22", long 80°10'47", in NW 1⁄4 sec.20, T.49 S., R.42 E., Broward County, Hydrologic Unit 03090202, 20 ft from south bank, 120 ft upstream from salinity-control structure S-36, 1.5 mi east of bridge on U.S. Highway 441, and 5 mi west of Fort Lauderdale.DRAINAGE AREA.--Indeterminate.PERIOD OF RECORD.--October 1955 to September 1961 (gage heights only), October 1961 to current year.GAGE.--Electronic data logger with water-stage shaft encoder for upstream and downstream. Electronic data logger for gate opening. Datum of gage is National Geodetic Vertical Datum of 1929. Prior to October 1, 1993, both upstream and downstream gage heights at datum, 0.214 ft higher. Discharge not affected by the change in datum. Electromagnetic velocity meter and deflection vane recorder at same site prior to October 1, 1985.REMARKS.--Records fair except for estimated daily discharges, which are poor. Flow is at times affected by tide and occasionally reversed. Flow is regulated by operation of salinity-control structure 36. Discharge computed from the relationship of gate opening versus head difference. Records of gage heights prior to October 1961 are available in files of the U.S. Geological Survey.COOPERATION.--Gage height and S-36 gate-operation records provided by South Florida Water Management District upon request.ANNUAL MEAN and ANNUAL RUNOFF (AC-FT) SUMMARY STATISTICS.--Figures represent 33 complete water years of discharge (1962-90, 1998-2001).EXTREME UPSTREAM STAGES FOR PERIOD OF RECORD.--Maximum gage height, 7.38 ft Dec. 27, 1958; minimum, -0.53 ft June 28, 1958.EXTREME UPSTREAM STAGES FOR CURRENT YEAR.--Maximum gage height, 5.41 ft Dec 10; minimum, 1.59 ft Sept. 15.EXTREME DOWNSTREAM STAGES FOR CURRENT YEAR.--Maximum gage height, 4.07 ft Oct. 3; minimum, -0.96 ft Feb. 6.
SUMMARY STATISTICS FOR 2000 CALENDAR YEAR FOR 2001 WATER YEAR WATER YEARS 1962 - 2001 ANNUAL TOTAL 20333.00 16382.80 ANNUAL MEAN 55.6 44.9 61.5 HIGHEST ANNUAL MEAN 197 1983 LOWEST ANNUAL MEAN 1.44 1971 HIGHEST DAILY MEAN 620 Oct 5 653 Sep 13 1490 Apr 25 1979 LOWEST DAILY MEAN .00 Jan 2 .00 Oct 15 -402 Sep 6 1997 ANNUAL SEVEN-DAY MINIMUM .00 Mar 31 .00 Oct 21 -53 Oct 21 1999 ANNUAL RUNOFF (AC-FT) 40330 32500 44530 10 PERCENT EXCEEDS 148 147 206 50 PERCENT EXCEEDS .00 .00 .00 90 PERCENT EXCEEDS .00 .00 .00 e Estimated
The period of record statistics were computed from complete water year's of record. See the annual mean and annual runoff (ac-ft) summary statistics section of the manuscript.
89 EVERGLADES AND SOUTHEASTERN COASTAL AREA
02283200 PLANTATION ROAD CANAL AT S-33, NEAR FORT LAUDERDALE, FL
LOCATION.--Lat 26°08'05", long 80°11'42", in SW 1⁄4 sec.31, T.49 S., R.42 E., Broward County, Hydrologic Unit 03090202, 15 ft streamward from left bank, 130 ft upstream from salinity-control structure 33, 0.5 mi east of bridge on U.S. Highway 441, 3 mi above mouth, and 4 mi west of Fort Lauderdale.DRAINAGE AREA.--Indeterminate.PERIOD OF RECORD.--October 1955 to February 1962 (gage heights only), March 1962 to current year.GAGE.--Water-stage recorders upstream and downstream and gate-opening recorder. Datum of gage is National Geodetic Vertical Datum of 1929 (U.S. Army Corps of Engineers bench mark).REMARKS.--Records are fair except for estimated daily dischages, which are poor. Flow is at times affected by tide and is occasionally reversed. Flow is regulated by operation of salinity-control structure 33. Records of gage heights prior to October 1961 are available in files of the U.S. Geological Survey.ANNUAL MEAN and ANNUAL RUNOFF (AC-FT) SUMMARY STATISTICS.--Figures represent 31 complete water years of discharge (1963-86,1988-89, 1993, 1998-2001).EXTREME UPSTREAM STAGES FOR PERIOD OF RECORD.--Maximum gage height, 6.27 ft Oct. 15, 1999; minimum, -0.82 ft Mar. 4, 1958.EXTREME UPSTREAM STAGES FOR CURRENT YEAR.--Maximum gage height, 4.56 ft Oct. 3; minimum, 1.64 ft Sept. 16.EXTREME DOWNSTREAM STAGES FOR CURRENT YEAR.--Maximum gage height, 4.25 ft Oct. 3; minimum, -1.12 ft Feb. 6.
SUMMARY STATISTICS FOR 2000 CALENDAR YEAR FOR 2001 WATER YEAR WATER YEARS 1962 - 2001 ANNUAL TOTAL 1009.00 2290.10 ANNUAL MEAN 2.76 6.27 17.6 HIGHEST ANNUAL MEAN 40.1 1969 LOWEST ANNUAL MEAN .99 1971 HIGHEST DAILY MEAN 179 Oct 4 179 Oct 4 748 Jul 3 1988 LOWEST DAILY MEAN .00 Jan 1 -2.4 Sep 18 -77 Oct 19 1996 ANNUAL SEVEN-DAY MINIMUM .00 Jan 1 -.34 Sep 18 -28 Oct 17 1996 ANNUAL RUNOFF (AC-FT) 2000 4540 12730 10 PERCENT EXCEEDS .00 17 46 50 PERCENT EXCEEDS .00 .00 .00 90 PERCENT EXCEEDS .00 .00 .00 e Estimated
The period of record statistics were computed from complete water year's of record. See the annual mean and annual runoff (ac-ft) summary statistics section of the manuscript.
92 EVERGLADES AND SOUTHEASTERN COASTAL AREA
02283498 NORTH NEW RIVER CANAL AT S-2 AND S-351, NEAR SOUTH BAY, FL
LOCATION.--Lat 26°42'00", long 80°42'55", in SW 1⁄4 sec.35, T.43 S., R.36 E., Palm Beach County, Hydrologic Unit 03090202, at pump station 2 and gate structure S-351, 500 ft upstream from Hillsboro Canal, and 2.7 mi north of South Bay.DRAINAGE AREA.--Indeterminate.PERIOD OF RECORD.--February 1957 to September 1967 (gage heights only), October 1967 to current year.REVISED RECORDS.--WDR FL-77-2A:1974; WDR FL-93-2A:1989, 1992.GAGE.--Satellite data collection platform with water-stage shaft encoders for lake and canal stages in pump station 2; potentiometer-gage recorders on hydraulic ram of each gate, and pump tachometer. Datum of gage is National Geodetic Vertical Datum of 1929 (U.S. Army Corps of Engineers bench mark). Prior to January 18, 1965, water-stage recorder at site 1,600 ft downstream at same datum. Electromagnetic velocity meter and digital recorder in lock chamber installed in 1981 water year were removed October 1986. Prior to September 8, 1988, digital lake water-stage recorder in control house of lock. Prior to February 21, 1992, digital lake and canal water-stage recorders, and A-35 graphic recorder.REMARKS.--Records are fair except for estimated daily discharges, which are poor. Flow regulated by gates and pump station at Lake Okeechobee. Discharge is summation of S-351 flow, S-2 pumpage and siphoning. Flow frequently reversed during and after periods of heavy rainfall by pumpage into the canal from agricultural lands in the Everglades, by the operation of pump station No. 2 (negative figures indicate flow reversed) and by gravity flow through gates during periods of negative head. Discharge computed from relations between head, gate openings, pump tachometer, submergence, and discharge coefficient. Lake stage published under 02283498. Formerly published as North New River Canal at S-2 and HGS-4, near South Bay. Records of gage heights prior to October 1967 are available in files of the U.S. Geological Survey. Extreme stages for period of record for lake gage height are not listed because of the unavailability of historical files.COOPERATION.--Lake and canal stages, S-2 pump record and S-351 gate-operation record provided by South Florida Water Management District.ANNUAL MEAN and ANNUAL RUNOFF (AC-FT) SUMMARY STATISTICS.--Figures represent 34 water years of discharge (1968-2001).EXTREME CANAL STAGES FOR PERIOD OF RECORD.--Maximum gage height, 14.09 ft Sept. 28, 1962; minimum, 6.98 ft Oct. 28, 1981.EXTREME LAKE STAGES FOR CURRENT YEAR.-- Maximum gage height, 14.73 ft Sept. 30; minimum, 8.72 ft (estimated) May 31.EXTREME CANAL STAGES FOR CURRENT YEAR.--Maximum gage height, 13.29 ft Sept. 29; minimum, 7.64 ft (estimated) May 3.
SUMMARY STATISTICS FOR 2000 CALENDAR YEAR FOR 2001 WATER YEAR WATER YEARS 1968 - ANNUAL TOTAL 119546.90 -72399.80 ANNUAL MEAN 327 -198 154 HIGHEST ANNUAL MEAN 715 LOWEST ANNUAL MEAN -296 HIGHEST DAILY MEAN 2050 May 6 1060 Mar 9 3440 Mar 15 LOWEST DAILY MEAN -4030 Oct 5 -4030 Oct 5 -4030 Oct 5 ANNUAL SEVEN-DAY MINIMUM -1790 Oct 2 -2150 Jul 29 -3190 Aug 17 ANNUAL RUNOFF (AC-FT) 237100 -143600 111300 10 PERCENT EXCEEDS 1300 483 1130 50 PERCENT EXCEEDS .00 .00 .00 90 PERCENT EXCEEDS .00 -1450 -600 e Estimated
The period of record statistics were computed from complete water year's of record. See the annual mean and annual runoff (ac-ft) summary statistics section of the manuscript.
95 EVERGLADES AND SOUTHEASTERN COASTAL AREA
02283500 NORTH NEW RIVER CANAL BELOW S-351, NEAR SOUTH BAY, FL
LOCATION.--Lat 26°41'50", long 80°42'50", in SW 1⁄4 sec.35, T.43 S., R.36 E., Palm Beach County, Hydrologic Unit 03090202, 30 ft from west bank, 800 ft downstream from Hillsboro Canal, 1,600 ft downstream from gate structure S-351 and pump station 2 at Lake Okeechobee, and 2.5 mi north of South Bay.DRAINAGE AREA.--Indeterminate.PERIOD OF RECORD.--February 1957 to current year. Records of gage heights prior to October 1961 are available in files of the U.S. Geological Survey.REVISED RECORD.--WDR FL-77-2A:1974, 1975; WDR FL-92-2A:1991; WDR FL-93-2A:1977, 1985.GAGE.--Satellite data collection platform with water-stage shaft encoder and acoustic velocity meter. Prior to October 1, 1986, water-stage recorder at pump station 2 used for gage heights at this station. Datum of gage is National Geodetic Vertical Datum of 1929 (U.S. Army Corps of Engineers bench mark). Prior to January 18, 1954, water-stage and deflection-meter recorder at site 1,600 ft downstream at same datum. January 19, 1965 to September 30, 1967, deflection-meter recorder at site 1,600 ft downstream. Satellite data collection platform collecting stage and velocity data was installed November 29, 1990.REMARKS.--Records poor. Flow regulated by S-351 gate and pump station at Lake Okeechobee. Flow occasionally reversed during and after periods of heavy rainfall by pumpage into the canal from agricultural lands in the Everglades by pumping at structure 2 or by gravity flow through gates during periods of negative heads (negative figures indicate flow reversed). Discharge was the difference in flow between North New River Canal at S-2 and S-351 and Hillsboro Canal below S-351 October 1967 to June 9, 1987.ANNUAL MEAN and ANNUAL RUNOFF (AC-FT) SUMMARY STATISTICS.--Figures represent 41 complete water years of discharge (1958-95,1997-98, 2000).EXTREME STAGES FOR PERIOD OF RECORD.--Maximum gage height, 14.09 ft Sept. 28, 1962; minimum, 6.98 ft observed Oct. 28, 1981.EXTREME STAGES FOR CURRENT YEAR.--Maximum gage height, 13.27 ft Sept. 29; minimum, 7.64 ft May 3.
SUMMARY STATISTICS FOR 2000 CALENDAR YEAR FOR 2001 WATER YEAR WATER YEARS 1957 - 2001 ANNUAL MEAN 110 HIGHEST ANNUAL MEAN 501 1992 LOWEST ANNUAL MEAN -232 1982 HIGHEST DAILY MEAN 1300 May 13 554 Mar 9 2920 Mar 13 1985 LOWEST DAILY MEAN -2440 Oct 5 -2440 Oct 5 -3460 Jun 25 1982 ANNUAL SEVEN-DAY MINIMUM -1180 Oct 4 -1610 Sep 9 -2720 Jun 18 1959 ANNUAL RUNOFF (AC-FT) 79850 10 PERCENT EXCEEDS 740 277 697 50 PERCENT EXCEEDS 37 -92 112 90 PERCENT EXCEEDS -262 -1020 -430 e Estimated
The period of record statistics were computed from complete water year's of record. See the annual mean and annual runoff (ac-ft) summary statistics section of the manuscript.
97 EVERGLADES AND SOUTHEASTERN COASTAL AREA
263180080205001 SITE 7 IN CONSERVATION AREA NO. 1 NEAR SHAWANO, FL
LOCATION.--Lat 26°31'10", long 80°20'50", in T.45 S., R.40 E., Palm Beach County, Hydrologic Unit 03090202, in Loxahatchee Wildlife Refuge (Arthur R. Marshall Park). Township and range approximated from topographic map for which most section lines are not delineated, unable to determine section.DRAINAGE AREA.--Indeterminate.PERIOD OF RECORD.--July 1991 to current year.GAGE.--Satellite data collection platform with water-stage shaft encoder and a tipping bucket rain gage. Datum of gage is National Geodetic Vertical Datum of 1929.REMARKS.--Land-surface datum is 15 ft above National Geodetic Vertical datum of 1929. Station is one of several located in Conservation Area No. 1. Rainfall is not published, but is available in files of the U.S. Geological Survey. Gage is capable of recording water levels below land-surface datum.COOPERATION.--U.S. Army Corps of Engineers.EXTREME STAGES FOR PERIOD OF RECORD.--Maximum gage height, 18.22 ft Nov. 17, 18, 1994; minimum, 14.85 ft May 22, 2001.EXTREME STAGES FOR CURRENT YEAR.--Maximum gage height, 17.57 ft Oct. 11; minimum, 14.85 ft May 22.
263050080145001 SITE 8T IN CONSERVATION AREA NO. 1 NEAR BOYNTON BEACH, FL
LOCATION.--Lat 26°30'50", long 80°14'50", in T.41 S., R.41 E., Palm Beach County, Hydrologic Unit 03090202, in Loxahatchee Wildlife Refuge (Arthur R. Marshall Park). Township and range approximated from topographic map for which most section lines are not delineated, unable to determine section.DRAINAGE AREA.--Indeterminate.PERIOD OF RECORD.--July 1991 to current year.GAGE.--Satellite data collection platform with water-stage shaft encoder and tipping bucket rain gage. Datum of gage is National Geodetic Vertical Datum of 1929.REMARKS.--Land-surface datum is 15 ft above National Geodetic Vertical datum of 1929. Station is one of several located in Conservation Area No. 1. Rainfall record is not published, but available in files of the U.S. Geological Survey. Gage is capable of recording water levels below land-surface datum.COOPERATION.--U.S. Army Corps of Engineers.EXTREME STAGES FOR PERIOD OF RECORD.--Maximum gage height, 18.11 ft Nov. 17, 1994; minimum, 13.91 ft May 21, 22, 2001.EXTREME STAGES FOR CURRENT YEAR.--Maximum gage height, 17.53 ft Oct. 7; minimum, 13.91 ft May 21, 22.
263000080120001 SITE 8C NEAR L-40 IN CONSERVATION AREA 1 NEAR BOYNTON BEACH, FL
LOCATION.--Lat 26°29'57", long 80°13'20"(corrected), T.46 S., R.41 E., Palm Beach County, Hydrologic Unit 03090202, 20 ft west of L-40 near Loxahatchee Wildlife Refuge (Arthur R. Marshall Park). Township and range approximated from topographic map for which most section lines are not delineated, unable to determine section.DRAINAGE AREA.--Indeterminate.PERIOD OF RECORD.--April 1991 to current year.GAGE.--Satellite data collection platform with water-stage shaft encoder and tipping bucket rain gage. Datum of gage is National Geodetic Vertical Datum of 1929.REMARKS.--Station is one of several located in Conservation Area No. 1. Rainfall data is not published, but available in files of the U.S. Geological Survey.COOPERATION.--U.S. Army Corps of Engineers.EXTREME STAGES FOR PERIOD OF RECORD.--Maximum gage height, 18.21 ft Oct. 16, 1999; minimum, 12.02 ft May 22, 2001.EXTREME STAGES FOR CURRENT YEAR.--Maximum gage height, 17.64 ft Oct. 7, 15, 16; minimum, 12.02 ft May 22.
262750080175001 SITE 9 IN CONSERVATION AREA NO. 1, NEAR BOYNTON BEACH, FL
LOCATION.--Lat 26°27'50", long 80°17'50", in T.50 S., R.40 E., Palm Beach County, Hydrologic Unit 03090202, in Loxahatchee Wildlife Refuge (Arthur R. Marshall Park). Township and range approximated from topographic map for which most section lines are not delineated, unable to determine section.DRAINAGE AREA.--Indeterminate.PERIOD OF RECORD.--July 1991 to current year.REVISED RECORDS.--WDR FL-97-2A:1997.GAGE.--Satellite data collection platform with water-stage shaft encoder and tipping rain gage. Datum of gage is National Geodetic Vertical Datum of 1929.REMARKS.--Land-surface datum is 15 ft above national Geodetic Vertical Datum of 1929. Station is one of several located in Conservation Area No. 1. Rainfall data is not published, but available in files of the U.S. Geological Survey. Gage is capable of recording water levels below land-surface datum.COOPERATION.--U.S. Army Corps of Engineers.EXTREME STAGES FOR PERIOD OF RECORD.--Maximum gage height, 18.02 ft Oct. 15, 1999; minimum, 14.97 ft May 22, 2001.EXTREME STAGES FOR CURRENT YEAR.--Maximum gage height, 17.43 ft Oct. 15-17; minimum, 14.97 ft May 22.
262358080055700 E-4 CANAL AT CLINT-MOORE ROAD, BOCA RATON, FL
LOCATION.--Lat 26°23'58", long 80°05'57", in NE 1⁄4 NE 1⁄4 NW
1⁄4 sec.6, T.47 S., R.43 E., Palm Beach County, Hydrologic Unit 03090202, 0.6 mi west on Clint-Moore Road from U.S. Interstate 95 overpass in Boca Raton.DRAINAGE AREA.--Indeterminate.PERIOD OF RECORD.--March 1982 to current year.GAGE.--Electronic data logger. Digital water-level recorder prior to May 24, 1999. Datum of gage is National Geodetic Vertical Datum of 1929.REMARKS.--Station is part of a canal system operated and controlled by Lake Worth Drainage District.EXTREME STAGES FOR PERIOD OF RECORD.--Maximum gage height, 7.52 ft Oct. 15, 1999; minimum, 2.33 ft May 14-16, 1989.EXTREME STAGES FOR CURRENT YEAR.--Maximum gage height, 6.04 ft Sept. 29; minimum, 4.05 ft May 20.
262337080074800 E-3 CANAL AT 51ST STREET, BOCA RATON, FL
LOCATION.--Lat 26°23'37", long 80°07'48", in NE 1⁄4 NE 1⁄4 NW
1⁄4 sec.11, T.47 S., R.42 E., Palm Beach County, Hydrologic Unit 03090202, 2.2 mi west of U.S. Interstate 95, Yamato Road exit approximately 110 yards south of 51st Street (Yamato Road) on the E-3 Canal in Boca Raton.DRAINAGE AREA.--Indeterminate.PERIOD OF RECORD.--March 1982 to current year.GAGE.--Electronic data logger. Datum of gage is National Geodetic Vertical Datum of 1929. Prior to June 1, 1994, at site 100 yards upstream at same datum.REMARKS.--Station is part of a canal system operated by Lake Worth Drainage District.EXTREME STAGES FOR PERIOD OF RECORD.--Maximum gage height, 13.53 ft June 18, 1999; minimum, 7.61 ft May 23, 2001.EXTREME STAGES FOR CURRENT YEAR.--Maximum gage height, 10.89 ft Aug. 3; minimum, 7.61 ft May 23.
262300080220001 HILLSBORO CANAL AT S-10-D, NEAR DEERFIELD BEACH, FL
LOCATION.--Lat 26°23'14", long 80°22'50", in NE 1⁄4 sec.6, T.47 S., R.40 E., Palm Beach County, Hydrologic Unit 03090202, on Hillsboro Canal on the north bank of the spillway 200 ft northeast of S-10-D, a four-gated control structure, 11.9 mi west of State Road 7 (U.S. Highway 441) on Hillsboro Boulevard. The auxiliary stage recorder is located approximately 20 yards downstream of S-10-D on the south bank of the spillway.DRAINAGE AREA.--Indeterminate.PERIOD OF RECORD.--June 1991 to current year.GAGE.--Satellite data collection platform with water-stage shaft encoders upstream and downstream of structure S-10-D. Tipping bucket rain gage at S-10-D upstream. Datum of gage is National Geodetic Vertical Datum of 1929 (U.S. Army Corps of Engineers).REMARKS.--Land-surface datum is 1.10 ft above national Geodetic Vertical of 1929. Station is one of several located on L-39 which regulates flow for Conservation Areas 1 and 2A. Gage records are primarily used to determine stages. Rainfall data is not published but is available in files of the U.S. Geological Survey. Gage is capable of recording water levels below land-surface datum.EXTREME UPSTREAM STAGES FOR PERIOD OF RECORD.--Maximum gage height, 17.82 ft Dec. 15, 1997; minimum, dry May 11-26, 2001.EXTREME DOWNSTREAM STAGES FOR PERIOD OF RECORD.--Maximum gage height, 17.07 ft Oct. 15, 1996, Oct. 15, 1999; minimum, 11.43 ft May 22, 2001.EXTREME UPSTREAM STAGES FOR CURRENT YEAR.--Maximum gage height, 17.50 ft Oct. 13, 14; minimum, dry May 11-26.EXTREME DOWNSTREAM STAGES FOR CURRENT YEAR.--Maximum gage height, 15.35 ft Aug. 7, 8; minimum, 11.43 ft May 22.
262200080210001 HILLSBORO CANAL AT S-10-C, NEAR DEERFIELD BEACH, FL
LOCATION.--Lat 26°22'16", long 80°21'00", in NW 1⁄4 sec.14, T.47 S., R.40 E., Palm Beach County, Hydrologic Unit 03090202, on Hillsboro Canal on the north bank of the spillway 200 ft northeast of S-10-C, a four-gated control structure, 9.6 mi west of State Road 7 (U.S. Highway 441) on Hillsboro Boulevard. The auxiliary stage recorder is located approximately 20 yards downstream of S-10-C on the south bank of the spillway.DRAINAGE AREA.--Indeterminate.PERIOD OF RECORD.--June 1991 to current year.GAGE.--Satellite data collection platform with water-stage shaft encoders upstream and downstream of structure S-10-C. Datum of gage is National Geodetic Vertical Datum of 1929 (U.S. Army Corps of Engineers bench mark).REMARKS.--Land-surface datum is 1.0 ft above National Geodetic Vertical Datum of 1929. Station is one of several located on L-39 which regulates flow for Conservation Areas 1 and 2A. Gage records are primarily used to determine stages. Water levels below land-surface datum can be recorded.EXTREME UPSTREAM STAGES FOR PERIOD OF RECORD.--Maximum gage height, 17.82 ft Dec. 15, 1997; minimum, 11.79 ft May 22, 23, 2001.EXTREME DOWNSTREAM STAGES FOR PERIOD OF RECORD.--Maximum gage height, 16.92 ft Oct. 15, 1999; minimum, 11.45 ft May 22, 2001.EXTREME UPSTREAM STAGES FOR CURRENT YEAR.--Maximum gage height, 17.50 ft Oct. 14, 15; minimum, 11.79 ft May 22, 23.EXTREME DOWNSTREAM STAGES FOR CURRENT YEAR.--Maximum gage height, 15.24 ft Aug. 11; minimum, 11.45 ft May 22.
262100080190001 HILLSBORO CANAL AT S-10-A, NEAR DEERFIELD BEACH, FL
LOCATION.--Lat 26°21'32", long 80°18'37", in NE 1⁄4 sec.24, T.47 S., R.40 E., Palm Beach County, Hydrologic Unit 03090202, on Hillsboro Canal on the north bank of the spillway 200 ft northeast of S-10-A, a four-gated control structure, 6.9 mi west of State Road 7 (U.S. Highway 441) on Hillsboro Boulevard. The auxiliary stage recorder is located approximately 20 yards downstream of S-10-A on the south bank of the spillway.DRAINAGE AREA.--Indeterminate.PERIOD OF RECORD.--June 1991 to current year.GAGE.--Satellite data collection platform with water-stage shaft encoders upstream and downstream of structure S-10-A. Datum of gage is National Geodetic Vertical Datum of 1929 (U.S. Army Corps of Engineers bench mark).REMARKS.--Land-surface datum is 1.10 ft above National Geodetic Vertical Datum of 1929. Station is one of several located on L-39 which regulates flow for Conservation Areas 1 and 2A. Gage records are primarily used to determine stages. Water levels below land-surface datum can be recorded.EXTREME UPSTREAM STAGES FOR PERIOD OF RECORD.--Maximum gage height, 17.78 ft Dec. 14, 15, 1998; minimum gage height, 12.03 ft May 23, 2001.EXTREME DOWNSTREAM STAGES FOR PERIOD OF RECORD.--Maximum gage height, 16.77 ft (estimated) Oct. 16, 1999; minimum, 11.43 ft May 22, 2001.EXTREME UPSTREAM STAGES FOR CURRENT YEAR.--Maximum gage height, 17.42 ft Oct. 15, 16; minimum, 12.03 ft May 23.EXTREME DOWNSTREAM STAGES FOR CURRENT YEAR.--Maximum gage height, 15.01 ft Oct. 11; minimum, 11.43 ft May 22.REVISIONS.--Revised figures of downstream stage for water year 2000 are available in the files of the U.S. Geological Survey and will not be published. These supersede those published in the water year 2000 report. Revisions were necessary due to new levels, run February 7, 2002.
LOCATION.--Lat 26°20'07", long 80°32'15", in NW 1⁄4 sec.27, T.47 S., R.38 E., Palm Beach County, Hydrologic Unit 03090202, 175 ft downstream of S-150, on the west side of U.S. Highway 27, 18.6 mi north of U.S. Interstate 595.DRAINAGE AREA.--Indeterminate.PERIOD OF RECORD.--November 1990 to current year.GAGE.--Satellite data collection platform with water-stage shaft encoder and acoustic velocity meter. Datum of gage is National Geodetic Vertical Datum of 1929.REMARKS.--Records poor. Flow regulated by sluice gates upstream at S-150. Flow occasionally reversed during and after periods of heavy rainfall by pumpage at S-7 which may draw water through S-150 gates. Discharge computed from relations between velocity index and mean velocity.ANNUAL MEAN and ANNUAL RUNOFF (AC-FT) SUMMARY STATISTICS.--Figures represent 5 complete water years of discharge (1994-95, 1997-98, 2000).EXTREME STAGES FOR PERIOD OF RECORD.--Maximum gage height, 13.50 ft Nov. 2, 1999; minimum, 7.17 ft Apr. 18, 1991.EXTREME STAGES FOR CURRENT YEAR.--Maximum gage height, 11.46 ft Sept. 30; minimum, 7.61 ft May 22.
SUMMARY STATISTICS FOR 2000 CALENDAR YEAR FOR 2001 WATER YEAR WATER YEARS 1991 - 2001 ANNUAL MEAN 54.8 HIGHEST ANNUAL MEAN 101 1997 LOWEST ANNUAL MEAN -6.29 1995 HIGHEST DAILY MEAN 555 Aug 7 294 Oct 13 850 Jan 16 1991 LOWEST DAILY MEAN -25 May 11 -22 Sep 30 -108 Sep 20 1992 ANNUAL SEVEN-DAY MINIMUM -11 May 8 -13 Aug 3 -82 Sep 16 1992 ANNUAL RUNOFF (AC-FT) 39680 10 PERCENT EXCEEDS 404 18 390 50 PERCENT EXCEEDS 10 4.7 1.4 90 PERCENT EXCEEDS -2.2 -.50 -26 e Estimated
The period of record statistics were computed from complete water year's of record. See the annual mean and annual runoff (ac-ft) summary statistics section of the manuscript.
111 EVERGLADES AND SOUTHEASTERN COASTAL AREA
02284300 NORTH NEW RIVER CANAL AT S-7, AT TERRYTOWN, FL
LOCATION.--Lat 26°20'07", long 80°32'14", in SW 1⁄4 sec.22, T.47 S., R.38 E., Palm Beach County, Hydrologic Unit 03090202, 50 ft east of U.S. Highway 27 in Terrytown, and 25 mi south of Okeelanta.DRAINAGE AREA.--Indeterminate.PERIOD OF RECORD.--October 1944 to December 1959 (weekly gage heights and periodic discharge measurements), January 1960 to 1982 (discharge), November 1990 to current year.GAGE.--Satellite data collection platform with water-stage shaft encoder and acoustic velocity meter until September 30, 2001. Satellite data collection platform with water-stage shaft encoder and acoustic doppler velocity meter installed May 23, 2001. The acoustic velocity meter and acoustic doppler velocity meter were run in tandem for the period of May 23, 2001 to January 30, 2002. Datum of gage is National Geodetic Vertical Datum of 1929.REMARKS.--Records poor. Flow regulated by pumpage and operation of gate at pump station 7 and by operation of Structure 351 at Lake Okeechobee. Accoustic Velocity Meter (AVM) system began operation November 8, 1990. Discharge computed from relations between stage vs area and line velocity vs mean velocity index ratings. Positive flow is considered flow into the conservation area. The computed discharge represents pumpage and gate discharge into the conservation area. Negative discharge through gate into North New River Canal is not computed because no rating has been developed for this condition.ANNUAL MEAN and ANNUAL RUNOFF (AC-FT) SUMMARY STATISTICS.--Figures represent 28 complete water years of discharge (1961-82, 1993-1995, 1998-99, 2001).EXTREME STAGES FOR PERIOD OF RECORD.--Maximum gage height, 14.09 ft Oct. 31, 1961; minimum, 7.84 ft May 3, 4, 2001.EXTREME STAGES FOR CURRENT YEAR.--Maximum gage height, 12.31 ft July 28; minimum, 7.84 ft May 3, 4.
SUMMARY STATISTICS FOR 2000 CALENDAR YEAR FOR 2001 WATER YEAR WATER YEARS 1960 - 2001 ANNUAL TOTAL 49274.50 ANNUAL MEAN 135 245 HIGHEST ANNUAL MEAN 663 1993 LOWEST ANNUAL MEAN 47.1 1967 HIGHEST DAILY MEAN 2730 Oct 5 2730 Oct 5 2860 Jun 30 1992 LOWEST DAILY MEAN .00 Jan 1 .00 Oct 1 -755 Jul 31 1966 ANNUAL SEVEN-DAY MINIMUM .00 Jan 1 .00 Oct 16 -620 Jul 30 1966 ANNUAL RUNOFF (AC-FT) 97740 177500 10 PERCENT EXCEEDS 582 197 876 50 PERCENT EXCEEDS .00 .00 9.5 90 PERCENT EXCEEDS .00 .00 .00 e Estimated
The period of record statistics were computed from complete water year's of record. See the annual mean and annual runoff (ac-ft) summary statistics section of the manuscript.
113 EVERGLADES AND SOUTHEASTERN COASTAL AREA
261952080074500 E-3 CANAL AT SW 18TH STREET, BOCA RATON, FL
LOCATION.--Lat 26°19'52", long 80°07'45", in SE 1⁄4 NE 1⁄4 NW
1⁄4 sec.35, T.47 S., R.42 E., Palm Beach County, Hydrologic Unit 03090202, 0.7 mi west of U.S. Interstate 95, 1.5 mi south of Palmetto Park Road exit in Boca Raton.DRAINAGE AREA.--Indeterminate.PERIOD OF RECORD.--March 1982 to current year.GAGE.--Electronic data logger. Datum of gage is National Geodetic Vertical Datum of 1929.REMARKS.--Salinity monitering was discontinued for water year 2001. Station is part of a canal system operated and controlled by Lake Worth Drainage District.EXTREME STAGES FOR PERIOD OF RECORD.--Maximum gage height, 11.79 ft May 4, 1982; minimum, 5.33 ft Aug. 24, 2000.EXTREME STAGES FOR CURRENT YEAR.--Maximum gage height, 10.56 ft Oct. 3; minimum, 7.44 ft Sept. 14.
261710080190001 SITE 19 IN CONSERVATION AREA 2A NEAR CORAL SPRINGS, FL
LOCATION.--Lat 26°16'55", long 80°18'23", T.48 S., R.40 E., Broward County, Hydrologic Unit 03090202, in Conservation Area 2A near Coral Springs. Station is located approximately 0.5 mi west of the Sawgrass Expressway and 1 mi north of Sample Road in line with the water tower in Coral Springs. No section could be determined from existing maps.DRAINAGE AREA.--Indeterminate.PERIOD OF RECORD.--October 1992 to current year.GAGE.--Satellite data collection platform with water-stage shaft encoder and tipping bucket rain gage. Datum of gage is National Geodetic Vertical Datum of 1929.REMARKS.--Land-surface datum is 10.60 ft above National Geodetic Vertical Datum of 1929. Station is one of several located in Conservation Area 2A. Rainfall data available in files of the U.S. Geological Survey.COOPERATION.--U.S. Army Corps of Engineers.EXTREME STAGES FOR PERIOD OF RECORD.--Maximum gage height, 15.33 ft Dec. 9, 10, 1994; minimum, 10.88 ft Apr. 5-12, 1997.EXTREME STAGES FOR CURRENT YEAR.--Maximum gage height, 13.75 ft Oct. 13; minimum, indeterminate, well was dry Mar. 9-20, 23-31, Apr. 5 to June 2.
261300080280001 NORTH NEW RIVER CANAL AT S-11-C, NEAR ANDYTOWN, FL
LOCATION.--Lat 26°13'43", long 80°27'37", in NE 1⁄4 sec.32, T.48 S., R.37 E., Broward County, Hydrologic Unit 03090202, in North New River Canal on the east bank of the spillway, 100 ft southeast of S-11-C, a four-gated control structure, 5.9 mi north of State Road 84 on U.S. Highway 27. The auxiliary stage recorder is located approximately 30 yards downstream of structure S-11-C on the west bank of the spillway.DRAINAGE AREA.--Indeterminate.PERIOD OF RECORD.--May 1991 to current year.GAGE.--Satellite data collection platform with water-stage shaft encoders upstream and downstream of structure S-11-C. Datum of gage is National Geodetic Vertical Datum of 1929 (U.S. Army Corps of Engineers bench mark).REMARKS.--Station is one of several located on Levee 38W which regulates flow for Conservation Areas 2A and 3A. Gage records are primarily used to determine stages.COOPERATION.--U.S. Army Corps of Engineers.EXTREME UPSTREAM STAGES FOR PERIOD OF RECORD.--Maximum gage height, 14.90 ft Dec. 22, 1994; minimum, 9.64 ft May 22, 2001.EXTREME DOWNSTREAM STAGES FOR PERIOD OF RECORD.--Maximum gage height, 13.93 ft Dec. 12, 1994; minimum, indeterminate, well was dry, Apr. 18 to May 2, May 13-23, 2001.EXTREME UPSTREAM STAGES FOR CURRENT YEAR.--Maximum gage height, 13.65 ft Oct. 14; minimum, 9.64 ft May 22.EXTREME DOWNSTREAM STAGES FOR CURRENT YEAR.--Maximum gage height, 11.76 ft Sept. 30; minimum, indeterminate, well was dry, Apr. 18 to May 2, May 13-23.
262240080258001 SITE 17 NEAR L-38 IN CONSERVATION AREA 2A NEAR CORAL SPRINGS, FL
LOCATION.--Lat 26°17'11", long 80°24'40", in NE 1⁄4 sec.11, T.48 S., R.39 E., Broward County, Hydrologic Unit 03090202, in Conservation Area 2A near L-38 and approximately 7 mi west of Coral Springs.DRAINAGE AREA.--Indeterminate.PERIOD OF RECORD.--August 1991 to current year. Prior to August 1991 station was operated by the U.S. Army Corps of Engineers.GAGE.--Satellite data collection platform with water-stage shaft encoder and tipping bucket rain gage. Datum of gage is National Geodetic Vertical Datum of 1929.REMARKS.--Land-surface datum is 11.10 ft above National Geodetic Vertical datum of 1929. Gage is capable of recording water levels below land-surface datum. Rainfall data is not published but is available in files of the U.S. Geological Survey.EXTREME STAGES FOR PERIOD OF RECORD.--Maximum gage height, 15.38 ft Dec. 9, 1994; minimum, 10.30 ft May 19, 1999.EXTREME STAGES FOR CURRENT YEAR.--Maximum gage height, 13.72 ft Oct. 14 (estimated); minimum, 10.48 ft May 22, 23.
261200080275001 NORTH NEW RIVER CANAL AT S-11-B NEAR ANDYTOWN, FL
LOCATION.--Lat 26°12'08", long 80°27'13", in NE 1⁄4 sec.9, T.48 S., R.37 E., Broward County, Hydrologic Unit 03090202, on North New River Canal on the east bank of the spillway, 100 ft southeast of S-11-B, a four-gated control structure, 4.0 mi north of State Road 84 on U.S. Highway 27. The auxiliary stage recorder is located approximately 30 yards downstream of S-11-B, on the west bank of the spillway .DRAINAGE AREA.--Indeterminate.PERIOD OF RECORD.--May 1991 to current year.GAGE.--Satellite data collection platform with water-stage shaft encoders upstream and downstream of structure S-11-B. Datum of gage is National Geodetic Vertical Datum of 1929 (U.S. Army Corps of Engineers bench mark).REMARKS.--Station is one of several located on L-38W which regulates flow for Conservation Area 2A and 3A. Gage records are primarily used to determine stage. Minimum extreme value for downstream stage was estimated because the well had gone dry. Estimation was based on downstream stage at S-11-A, using the averaging technique.COOPERATION.--U.S. Army Corps of Engineers.EXTREME UPSTREAM STAGES FOR PERIOD OF RECORD.--Maximum gage height, 14.85 ft Jan. 15, 1995; minimum, 9.67 ft May 22, 2001.EXTREME DOWNSTREAM STAGES FOR PERIOD OF RECORD.--Maximum gage height, 13.84 ft Dec. 5, 1994; minimum, 7.66 ft (estimated), May 22, 2001. See REMARKS.EXTREME UPSTREAM STAGES FOR CURRENT YEAR.--Maximum gage height, 13.67 ft Oct. 14; minimum, 9.67 ft May 22.EXTREME DOWNSTREAM STAGES FOR CURRENT YEAR.--Maximum gage height, 11.68 ft Sept. 30; minimum, 7.66 ft (estimated), May 22.
261117080315201 SITE 63 IN CONSERVATION AREA 3A, NEAR ANDYTOWN, FL
LOCATION.--Lat 26°11'19", long 80°31'52", in SE 1⁄4 sec.10, T.38 S., R.49 E., Broward County, Hydrologic Unit 03090202, in Conservation Area 3A, 6.2 mi west of intersection of U.S. Interstate 75 and U.S. Highway 27 and 4 mi north of U.S. Interstate 75.DRAINAGE AREA.--Indeterminate.PERIOD OF RECORD.--June 1991 to current year.GAGE.--Satellite data collection platform with water-stage shaft encoder and tipping bucket rain gage. Datum of gage is National Geodetic Vertical Datum of 1929.REMARKS.--Land-surface datum is 8.40 ft above National Geodetic Vertical Datum of 1929. Gage is capable of recording water levels below land-surface datum. Rainfall data available in files of the U.S. Geological Survey.EXTREME STAGES FOR PERIOD OF RECORD.--Maximum gage height, 13.45 ft Dec. 6, 9-11, 1994; minimum, 7.24 ft June 1, 1992.EXTREME STAGES FOR CURRENT YEAR.--Maximum gage height, 11.31 ft Sept. 30; minimum, 7.83 ft May 21.
261150080270001 NORTH NEW RIVER CANAL AT S-11-A, NEAR ANDYTOWN, FL
LOCATION.--Lat 26°10'40", long 80°26'53", in SE 1⁄4 sec.16, T.49 S., R.39 E., Broward County, Hydrologic Unit 03090202, on North New River Canal on the east bank of the spillway, 100 ft northeast of S-11-A, a four-gated control structure, 2.2 mi north of State Road 84 on U.S. Highway 27. The auxiliary stage recorder is located approximately 30 yards upstream of S-11-A on the west bank of the spillway.DRAINAGE AREA.--Indeterminate.PERIOD OF RECORD.--May 1991 to current year.GAGE.--Satellite data collection platform with water-stage shaft encoders upstream and downstream of structure S-11-A and tipping bucket rain gage. Datum of gage is National Geodetic Vertical Datum of 1929 (U.S. Army Corps of Engineers bench mark).REMARKS.--Station is one of several located on Levee 38W which regulates flow for Conservation Areas 2A and 3A. Gage records are primarily used to determine stage. Rainfall data available in files of the U.S. Geological Survey.EXTREME UPSTREAM STAGES FOR PERIOD OF RECORD.--Maximum gage height, 15.12 ft Dec. 21, 1994; minimum, 9.64 ft May 22, 23, 2001.EXTREME DOWNSTREAM STAGES FOR PERIOD OF RECORD.--Maximum gage height, 13.80 ft Dec. 5, 1994; minimum, 7.65 ft May 22, 2001.EXTREME UPSTREAM STAGES FOR CURRENT YEAR.--Maximum gage height, 13.65 ft Oct. 14; minimum, 9.64 ft May 22, 23.EXTREME DOWNSTREAM STAGES FOR CURRENT YEAR.--Maximum gage height, 11.66 ft Sept. 30; minimum, 7.65 ft May 22.
261023080443001 SITE 62 IN CONSERVATION AREA 3A, NEAR ANDYTOWN, FL
LOCATION.--Lat 26°10'28", long 80°45'05", T.36 S., R.49 E., Broward County, Hydrologic Unit 03090202, 20.5 mi west of intersection of U.S. Interstate 75 and U.S. Highway 27 and 1.5 mi north of U.S. Interstate 75. No section could be determined from existing map.DRAINAGE AREA.--Indeterminate.PERIOD OF RECORD.--August 1991 to current year.GAGE.--Satellite data collection platform with water-stage shaft encoder and tipping bucket rain gage. Datum of gage is National Geodetic Vertical Datum of 1929.REMARKS.--Land-surface datum is 9.90 ft above National Geodetic Vertical Datum of 1929. Gage is capable of recording water levels below land-surface datum. Rainfall data available in files of the U.S. Geological Survey.EXTREME STAGES FOR PERIOD OF RECORD.--Maximum gage height, 13.68 ft Oct. 21, 1999; minimum, 8.06 ft June 3, 1992.EXTREME STAGES FOR CURRENT YEAR.--Maximum gage height, 12.01 ft Sept. 30, minimum, 8.79 ft May 22.
260810080222001 SITE 99 NEAR L-35A IN CONSERVATION AREA 2B, NEAR SUNRISE, FL
LOCATION.--Lat 26°08'21", long 80°22'02", in sec.32, T.49 S., R.40 E., Broward County, Hydrologic Unit 03090202, located in Conservation Area 2B, north of North New River Canal, West of Markham Park.DRAINAGE AREA.--Indeterminate.PERIOD OF RECORD.--July 1991 to present.GAGE.--Satellite data collection platform with water-stage shaft encoder. Datum of gage is National Geodetic Vertical Datum of 1929.REMARKS.--Land-surface datum is 6.20 ft above National Geodetic Vertical Datum of 1929. Rainfall data collection discontinued April 4, 1996. Rainfall data available in files of the U.S. Geological Survey. Prior to July 1991, station operated by the U.S. Army Corps of Engineers.EXTREME STAGES FOR PERIOD OF RECORD.--Maximum gage height, 11.92 ft Dec. 23, 1994; minimum, 4.12 ft May 26, 1992.EXTREME STAGES FOR CURRENT YEAR.--Maximum gage height, 10.85 ft Nov. 7-11; minimum, 5.87 ft May 23.
02286100 SOUTH NEW RIVER CANAL AT S-13, NEAR DAVIE, FL
LOCATION.--Lat 26°03'57", long 80°12'32", in SW 1⁄4 sec.25, T.50 S., R.41 E., Broward County, Hydrologic Unit 03090202, 18 ft from north bank, 150 ft upstream from pump station S-13, 300 ft west of U.S. Highway 441, and 1.5 mi east of Davie.DRAINAGE AREA.--Indeterminate.PERIOD OF RECORD.--March 1957 to current year.REVISED RECORDS.--WDR FL-87-2A:1962-86 (maximum daily reverse flow); WDR FL-95-2A:1994; WDR FL-99-2A:1996-98.GAGE.--Water-stage recorders upstream and downstream and gate-opening recorder. Prior to September 30, 1984, deflection vane and prior to September 30, 1985, electromagnetic velocity meter at same site. Datum of gage is National Geodetic Vertical Datum of 1929.REMARKS.--Records fair except for estimated daily discharges, which are poor. Flow is affected by tide and is occasionally reversed. Negative figures indicate reverse flow. Flow is regulated by pumpage and operation of gate at S-13. Flow is affected by regulation of control-structure 13A, 5 mi upstream, and by upstream withdrawals from the canal during the growing season and pumpage into the canal during high water. Discharge is computed from relation between head and gate-opening at S-13. The discharge published represents gate discharge computed by U.S. Geological Survey combined with pump discharge computed by South Florida Water Management District unless otherwise noted. The South Florida Water Management District determined that the previous rating used to compute pump discharge needed revision. The pump rating was revised during 1999. They revised their pump discharge for the water years 1995 through 1999. Prior to 1995 the accuracy of the pump discharge combined with our gate discharge can not be determined. Downstream stage is basically tidal, but at times is affected by gate operation and pumping at S-13. The downstream stage record published is the maximum and minimum tide event for each calendar day. Prior to 1998 tidal stages were published under station number 02286101.COOPERATION.--Gate-opening and pump records provided by South Florida Water Management District.ANNUAL MEAN and ANNUAL RUNOFF (AC-FT) SUMMARY STATISTICS.--Figures represent 34 complete water years of discharge (1958-86, 1988, 1990, 1999-2001).EXTREME UPSTREAM STAGES FOR PERIOD OF RECORD.--Maximum gage height, 5.04 ft Oct. 15, 1999; minimum, -0.79 ft July 14, 1961.EXTREME UPSTREAM STAGES FOR CURRENT YEAR.--Maximum gage height, 3.81 ft Oct. 03; minimum, 0.03 ft Sept. 13.EXTREME DOWNSTREAM STAGES FOR PERIOD OF RECORD.--Maximum gage height, 4.33 ft Oct. 15, 1999; minimum, -1.97 ft Apr. 28, 1963.EXTREME DOWNSTREAM STAGES FOR CURRENT YEAR.--Maximum gage height, 3.36 ft Oct. 04; minimum -1.23 ft Feb. 6.
SUMMARY STATISTICS FOR 2000 CALENDAR YEAR FOR 2001 WATER YEAR WATER YEARS 1957 - 2001 ANNUAL TOTAL 53090.30 33826.60 ANNUAL MEAN 145 92.7 164 HIGHEST ANNUAL MEAN 320 1960 LOWEST ANNUAL MEAN 51.9 1990 HIGHEST DAILY MEAN 844 Oct 4 844 Oct 4 2460 Dec 27 1986 LOWEST DAILY MEAN .00 Mar 7 .00 Oct 28 -128 Sep 6 1965 ANNUAL SEVEN-DAY MINIMUM .00 May 6 .00 Feb 15 -9.3 Mar 26 1974 ANNUAL RUNOFF (AC-FT) 105300 67100 118800 10 PERCENT EXCEEDS 240 186 340 50 PERCENT EXCEEDS 131 65 127 90 PERCENT EXCEEDS 42 .00 .00 e Estimated
The period of record statistics were computed from complete water year's of record. See the annual mean and annual runoff (ac-ft) summary statistics section of the manuscript.
128 EVERGLADES AND SOUTHEASTERN COASTAL AREA
260037080303401 SITE 76 IN CONSERVATION AREA 3B NEAR ANDYTOWN, FL
LOCATION.--Lat 26°00'27", long 80°28'58", in NW 1⁄4 sec.18, T.39 S., R.51 E., Broward County, Hydrologic Unit 03090202, in Conservation Area 3B approximately 0.7 mi southeast of Levee 67C, 3 mi southwest of intersection of Levee 67C and Levee 67A.DRAINAGE AREA.--Indeterminate.PERIOD OF RECORD.--July 1991 to current year.GAGE.--Satellite data collection platform with water-stage shaft encoder and tipping bucket rain gage. Datum of gage is National Geodetic Vertical Datum of 1929.REMARKS.--Land-surface datum is 6.80 ft above National Geodetic Vertical Datum of 1929. Rainfall data is available in files of the U.S. Geological Survey. Revised figures of stage required because an erroneous M.P. elevation was initially used for the 1995-98 water years. These will not be republished and supersede those published in the reports for 1995-98. The revised data are available in the files of the U.S. Geological Survey.EXTREME STAGES FOR PERIOD OF RECORD.--Maximum gage height, 9.60 ft Oct. 15, 1999; minimum, 6.66 ft June 3, 1992.EXTREME STAGES FOR CURRENT YEAR.--Maximum gage height, 8.52 ft Sept. 29; minimum, 5.39 ft May 22, 23.
255828080401301 SITE 64 IN CONSERVATION AREA 3A NEAR COOPERTOWN, FL
LOCATION.--Lat 25°58'31", long 80°40'10", in T.37 S., R.51 E., Broward County, Hydrologic Unit 03090202, approximately 17 mi northwest of Coopertown. No section could be determined from existing maps.DRAINAGE AREA.--Indeterminate.PERIOD OF RECORD.--June 1991 to current year.GAGE.--Satellite data collection platform with water-stage shaft encoder and tipping bucket rain gage. Datum of gage is National Geodetic Vertical Datum of 1929.REMARKS.--Land-surface datum is 8.40 ft above National Geodetic Vertical Datum of 1929. Gage is capable of recording water levels below land-surface datum. Rainfall data is available in files of the U.S. Geological Survey.EXTREME STAGES FOR PERIOD OF RECORD.--Maximum gage height, 12.81 ft Nov. 02, 1999; minimum, 8.23 ft May 31, 1992.EXTREME STAGES FOR CURRENT YEAR.--Maximum gage height, 10.99 ft Sept. 30; minimum, 8.28 ft May 22, 23.
255300080370001 SITE 69 IN CONSERVATION AREA 3B NEAR COOPERTOWN, FL
LOCATION.--Lat 25°53'00", long 80°37'00", in T.52 S., R.35 E., Miami-Dade County, Hydrologic Unit 03090202. Two gages are located on the east and west sides of the Levee 67A, 11.3 mi northeast of access gate at the Tamiami Trail. No section could be determine from existing maps.DRAINAGE AREA.--Indeterminate.PERIOD OF RECORD FOR EAST GAGE.--July 1991 to current year.PERIOD OF RECORD FOR WEST GAGE.--October 1994 to current year.GAGE.--Satellite data collection platform with water-stage shaft encoder with tipping bucket rain gage located in the east gage shelter. Shaft encoder located in the west gage shelter. Datum of gage is National Geodetic Vertical Datum of 1929.REMARKS.--Rainfall data is available in files of the U.S. Geological Survey.COOPERATION.--U.S. Army Corps of Engineers.EXTREME STAGES FOR EAST GAGE FOR PERIOD OF RECORD.--Maximum gage height, 10.48 ft (revised) Oct. 15, 1999; minimum, 7.22 ft (revised) June 3, 1992.EXTREME STAGES FOR EAST GAGE FOR CURRENT YEAR.--Maximum gage height, 9.38 ft Sept. 29; minimum, 7.22 ft May 22, 23.EXTREME STAGES FOR WEST GAGE FOR PERIOD OF RECORD.--Maximum gage height, 12.74 ft (revised) Dec. 21, 1994; minimum, 7.42 ft (revised) Apr. 27, 1999.EXTREME STAGES FOR WEST GAGE FOR CURRENT YEAR.--Maximum gage height, 10.77 ft Sept. 30; minimum, 7.64 ft May 22.
254848080432001 SITE 65 IN CONSERVATION AREA 3A NEAR COOPERTOWN, FL
LOCATION.--Lat 25°48'52", long 80°43'12", SE 1⁄4 T.53 S., R.36 E., Miami-Dade County, Hydrologic Unit 03090202, in the Everglades Water Conservation Area 3A, 4 mi north of Tamiami Trail (U.S. Highway 41) and 5 mi west of Levee 67A. No section could be determined from existing maps.DRAINAGE AREA.--Indeterminate.PERIOD OF RECORD.--1991 to current year.GAGE.--Satellite data collection platform with water-stage shaft encoder with tipping bucket rain gage. Datum of gage is National Geodetic Vertical Datum of 1929.REMARKS.--Rainfall data is available in files of the U.S. Geological Survey.COOPERATION.--U.S. Army Corps of Engineers.EXTREME STAGES FOR PERIOD OF RECORD.--Maximum gage height, 12.06 ft Dec. 21, 22, 1994; minimum, 7.82 ft May 22, 23, 2001.EXTREME STAGES FOR CURRENT YEAR.--Maximum gage height, 10.37 ft Sept. 29; minimum, 7.82 ft May 22, 23.
255250080335001 SITE 71 IN CONSERVATION AREA 3B, NEAR COOPERTOWN, FL
LOCATION.--Lat 25°53'04", long 80°33'25", in T.52 S., R.35 E., Miami-Dade County, Hydrologic Unit 03090202, in Conservation Area 3B, 2.6 mi east of Levee 67°C and 8.3 mi southeast of intersection with Levee 30. No section could be determined from existing maps.DRAINAGE AREA.--Indeterminate.PERIOD OF RECORD.--July 1991 to current year.GAGE.--Satellite data collection platform with water-stage shaft encoder and tipping bucket rain gage. Datum of gage is National Geodetic Vertical Datum of 1929.REMARKS.--Land-surface datum is 7.00 ft above National Geodetic Vertical Datum of 1929. Gage is capable of recording water levels below land-surface datum. Rainfall data available in files of the U.S. Geological Survey.EXTREME STAGES FOR PERIOD OF RECORD.--Maximum gage height, 9.80 ft Oct. 15, 1999; minimum, 6.04 ft May 22, 23, 2001.EXTREME STAGES FOR CURRENT YEAR.--Maximum gage height, 8.61 ft Sept. 29; minimum, 6.04 ft May 22, 23.
02286200 SNAKE CREEK CANAL AT NW 67TH AVENUE, NEAR HIALEAH, FL
LOCATION.--Lat 25°57'50", long 80°18'40", in SW 1⁄4 sec.36, T.51 S., R.40 E., Broward County, Hydrologic Unit 03090202, 300 ft downstream of N.W. 67th Avenue bridge on A-frame walkway, 6.0 mi north of Hialeah, Dade County, 10.9 mi upstream from salinity-control structure 29, and 11 mi upstream from mouth.DRAINAGE AREA.--Indeterminate.PERIOD OF RECORD.--November 1959 to February 1962 (gage heights only), March 1962 to current year.REVISED RECORDS.--WDR FL-74-2A:1969.GAGE.--Water-stage shaft encoder and acoustic doppler velocity meter with a cellular phone / radio telemetry and electronic data logger provided by the South Florida Water Management District. Prior to July 19, 1999, water-stage recorder and electromagnetic velocity meter. Datum of gage is National Geodetic Vertical Datum of 1929 (State Department of Transportation bench mark). Prior to October 1, 1975, at datum 0.28 ft lower. November 1, 1959, to March 15, 1962, water-stage recorder 10 ft downstream at datum 0.28 ft lower.REMARKS.--Records poor. Flow affected by regulation at salinity-control structure 29, Broward county pump structure (S7) on the N.W. 67 Avenue Canal and, at times by tide, and is occasionally reversed. Records of gage heights prior to March 1962, are available in files of the U.S. Geological Survey. Discharge represents flow to the east.COOPERATION.--South Florida Water Management District.ANNUAL MEAN and ANNUAL RUNOFF (AC-FT) SUMMARY STATISTICS.--Figures represent 26 complete years of discharge (1963-86, 1993, 2000).EXTREME STAGES FOR PERIOD OF RECORD.--Maximum gage height, 5.57 ft Oct. 15, 1999; minimum, 0.58 ft June 22, 1960.EXTREME STAGES FOR CURRENT YEAR.--Maximum gage height, 5.02 ft Oct. 3; minimum, 1.83 ft Aug. 31.
SUMMARY STATISTICS FOR 2000 CALENDAR YEAR FOR 2001 WATER YEAR WATER YEARS 1963 - 2001 ANNUAL TOTAL 85005.5 ANNUAL MEAN 232 269 HIGHEST ANNUAL MEAN 518 1966 LOWEST ANNUAL MEAN 114 1993 HIGHEST DAILY MEAN 984 Oct 8 984 Oct 8 1550 Mar 10 1969 LOWEST DAILY MEAN 9.5 Feb 13 -22 May 10 -64 Sep 10 1984 ANNUAL SEVEN-DAY MINIMUM 56 Sep 23 -13 May 7 -13 May 7 2001 ANNUAL RUNOFF (AC-FT) 168600 194700 10 PERCENT EXCEEDS 463 551 518 50 PERCENT EXCEEDS 178 104 182 90 PERCENT EXCEEDS 66 -4.2 34 e Estimated
The period of record statistics were computed from complete water year's of record. See the annual mean and annual runoff (ac-ft) summary statistics section of the manuscript.
136 EVERGLADES AND SOUTHEASTERN COASTAL AREA
255026080231300 SNAPPER CREEK CANAL EXTENSION AT NW 74TH STREET, NEAR HIALEAH, FL
LOCATION.--Lat 25°50'26", long 80°23'13", in SE 1⁄4 sec.12, T.53 S., R.39 E., Miami-Dade County, Hydrologic Unit 03090202, on the north side of a short spur canal that runs west from the main canal at N.W. 74th Street, and 5.5 mi upstream from the Tamiami Canal.DRAINAGE AREA.--Indeterminate.PERIOD OF RECORD.--April 1984 to current year.GAGE.--Electronic data logger. Datum of gage is National Geodetic Vertical Datum of 1929.EXTREME STAGES FOR PERIOD OF RECORD.--Maximum gage height, 7.07 ft Oct. 15-17, 1999; minimum, 0.21 ft June 5, 6, 1989.EXTREME STAGES FOR CURRENT YEAR.--Maximum gage height, 6.41 ft Oct. 4; minimum, 2.96 ft Apr. 25-30.
02286400 MIAMI CANAL AT S-354, AND S-3, AT LAKE HARBOR, FL
LOCATION.--Lat 26°41'42", long 80°48'25", in SE 1⁄4 sec. 35, T.44 S., R.35 E., Palm Beach County, Hydrologic Unit 03090202, 0.25 mi downstream of S-354 and pump station 3 at Lake Okeechobee, 0.05 mi south of U.S. Highway 27 on the Miami Canal in Lake Harbor, FL.DRAINAGE AREA.--Indeterminate.PERIOD OF RECORD.--Prior to October 1940, monthly discharge only, published in WSP 1304. October 1988 to current year. December 1939 to June 1943 (published as Miami Canal at Lake Harbor, October 1957 to September 1988, published as Miami Canal at HGS-3, and S-3, at Lake Harbor.REVISED RECORDS.--WDR FL-93-2A:1992GAGE.--Satellite data collection platform with water-stage shaft encoder and acoustic velocity meter. Datum of gage is National Geodetic Vertical Datum of 1929. December 1, 1939 to June 30, 1943, nonrecording gage at this site at same datum. October 1, 1957 to September 30, 1959, dual water-stage recorder at present site, at datum 0.05 ft lower and October 1, 1959 to February 7, 1962, at datum 0.22 ft lower. October 1, 1957 to September 30, 1968, two deflection vane recorders. From 1981 water year to April 1, 1987, electromagnetic velocity meter and digital recorder. Electromagnetic velocity meter reinstalled May 11, 1988. Satellite data collection platform and acoustic velocity meter installed September 11, 1991 to present. Prior to October 1, 1998, Lake stage published under station number 02286399. Lake station discontinued September 30, 1998.REMARKS.--Records fair except for estimated daily discharges, which are poor. Flow regulated by gates and pump station at Lake Okeechobee. Discharge is the flow through acoustic velocity meter site approximately 0.25 mi below S-354 structure. Stage collected also at the acoustic velocity meter site. Flow frequently reversed during and after periods of heavy rainfall by pumpage into the canal from agricultural lands in the Everglades, or by the operation of pump station 3 (negative figure indicates reverse flow). Discharge computed from relations between velocity index vs. mean velocity.COOPERATION.--S-3 pump, syphon record and S-354 gate-operation record provided by South Florida Water Management District.ANNUAL MEAN and ANNUAL RUNOFF (AC-FT) SUMMARY STATISTICS.--Figures represent 38 complete water years of discharge (1957-89, 1993-97, 2001).EXTREME CANAL STAGES FOR PERIOD OF RECORD.--Maximum gage height 14.92 ft, present datum, Mar. 21, 1960 and Oct. 2, 1965: minimum, 7.45 ft May 2, 2001.EXTREME CANAL STAGES FOR CURRENT YEAR.--Maximum gage height, 12.81 ft Oct. 6; minimum, 7.45 ft May 2.
SUMMARY STATISTICS FOR 2000 CALENDAR YEAR FOR 2001 WATER YEAR WATER YEARS 1958 - 199 ANNUAL TOTAL -28273.27 ANNUAL MEAN -77.5 73.4 HIGHEST ANNUAL MEAN 487 199 LOWEST ANNUAL MEAN -290 196 HIGHEST DAILY MEAN 1850 May 19 530 Dec 20 2280 Mar 24 196 LOWEST DAILY MEAN -1210 Oct 5 -1870 Jul 26 -2790 Mar 26 197 ANNUAL SEVEN-DAY MINIMUM -498 Oct 2 -1420 Sep 9 -2170 Jun 18 195 ANNUAL RUNOFF (AC-FT) -56080 53150 10 PERCENT EXCEEDS 830 302 556 50 PERCENT EXCEEDS 78 23 .00 90 PERCENT EXCEEDS -5.1 -705 -349 e Estimated
The period of record statistics were computed from complete water year's of record. See the annual mean and annual runoff (ac-ft) summary statistics section of the manuscript.
139 EVERGLADES AND SOUTHEASTERN COASTAL AREA
02286700 MIAMI CANAL AT S-8, NEAR LAKE HARBOR, FL
LOCATION.--Lat 26°19'53", long 80°46'29", in NE 1⁄4 sec.7, T.48 S., R.36 E., Broward County, Hydrologic Unit 03090202, 26 mi south of Lake Harbor, and 26.4 mi downstream from S-354 and pump station 3 at Lake Okeechobee.DRAINAGE AREA.--Indeterminate.PERIOD OF RECORD.--March 1962 to September 1968 (gage heights and discharge), October 1968 to December 1982, October 1990 to current year.GAGE.--Satellite data collection platform with water-stage shaft encoder and acoustic velocity meter. Datum of gage is National Geodetic Vertical Datum of 1929 (U.S. Army Corps of Engineers bench mark).REMARKS.--Records fair except for estimated discharges, which are poor. Flow regulated by pumpage and operation of gate at pump station 8, by operation of S-354 and pump station 3 at Lake Okeechobee, and operation of drainage and irrigation pumps upstream.COOPERATION.--Discharge record furnished by South Florida Water Management District October 1968 to December 1982 for publication. Prior to October 1968, gage height, gate opening and pump records furnished by South Florida Water Management District, and records computed by U.S. Geological Survey.ANNUAL MEAN and ANNUAL RUNOFF (AC-FT) SUMMARY STATISTIC.--Figures represent 25 complete water years of discharge (1963-82, 1992, 1995-96, 1998, 2000).EXTREME STAGES FOR PERIOD OF RECORD.--Maximum gage height, 15.17 ft, Oct. 17, 1995; minimum (daily) gage height, 6.02 ft June 7, 1981.EXTREME STAGES FOR CURRENT YEAR.--Maximum gage height, 15.01 ft Oct. 5; minimum, 7.74 ft May 21, 22.
SUMMARY STATISTICS FOR 2000 CALENDAR YEAR FOR 2001 WATER YEAR WATER YEARS 1962 - 2001 ANNUAL MEAN 344 HIGHEST ANNUAL MEAN 900 1995 LOWEST ANNUAL MEAN 41.6 1967 HIGHEST DAILY MEAN 3050 Oct 5 3050 Oct 5 4240 Oct 22 1969 LOWEST DAILY MEAN -109 Feb 21 -141 Aug 21 -369 Aug 3 1991 ANNUAL SEVEN-DAY MINIMUM -80 Mar 22 -61 Aug 21 -300 Dec 8 1999 ANNUAL RUNOFF (AC-FT) 249200 10 PERCENT EXCEEDS 738 248 1090 50 PERCENT EXCEEDS -23 -9.0 65 90 PERCENT EXCEEDS -72 -47 .00 e Estimated
The period of record statistics were computed from complete water year's of record. See the annual mean and annual runoff (ac-ft) summary statistics section of the manuscript.
141 EVERGLADES AND SOUTHEASTERN COASTAL AREA
02287395 MIAMI CANAL EAST OF LEVEE 30, NEAR MIAMI, FL
LOCATION.--Lat 25°56'28", long 80°26'23", in NE 1⁄4 sec.9, T.52 S., R.39 E., Miami-Dade County, Hydrologic Unit 03090202, south of State Road 997 approximately 800 ft on south bank, 1000 ft downstream from control structure 32, 14.1 mi upstream from salinity-structure 26, 19.5 mi northwest of Miami, and 19.8 mi upstream from mouth.DRAINAGE AREA.--Indeterminate.PERIOD OF RECORD.--November 1959 to current year. Published as "at broken dam, near Miami" November 1959 to September 1967, and October 1984 to November 1988.REVISED RECORDS.--WDR FL-99-2A:1998.GAGE.--Electronic data logger with water-stage shaft encoder and acoustic doppler velocity meter with phone/radio telemetry provided by South Florida Water Management District. Prior to August 23, 1999, water-stage recorder and electromagnetic velocity meter. Datum of gage is National Geodetic Vertical Datum of 1929 (Dade County bench mark). Prior to January 20, 1968 and October 1984 to November 1988, at site 0.5 mi downstream at same datum.REMARKS.--Records poor. Flow affected by regulation at downstream salinity-control structure S-26 and by upstream storage releases at control structures 31, 32, and 32A.COOPERATION.--South Florida Water Management District.ANNUAL MEAN and ANNUAL RUNOFF (AC-FT) SUMMARY STATISTICS.--Figures represent 31 complete water years of discharge (1961-84, 87, 1992-94, 1999-2001).EXTREME STAGES FOR PERIOD OF RECORD.--Maximum gage height, 6.59 ft July 1, 1982; minimum, 1.40 ft May 31, 1962 (site at broken dam). See PERIOD OF RECORD.EXTREME STAGES FOR CURRENT YEAR.--Maximum gage height, 5.68 ft Oct. 4; minimum, 2.02 ft Apr. 25.
SUMMARY STATISTICS FOR 2000 CALENDAR YEAR FOR 2001 WATER YEAR WATER YEARS 1961 - 2001 ANNUAL TOTAL 70903 21937 ANNUAL MEAN 194 60.1 197 HIGHEST ANNUAL MEAN 476 1970 LOWEST ANNUAL MEAN 28.4 1997 HIGHEST DAILY MEAN 588 Jan 14 130 Sep 12 1090 Mar 20 1970 LOWEST DAILY MEAN 48 Oct 9 22 Apr 27 .00 Apr 26 1979 ANNUAL SEVEN-DAY MINIMUM 65 Mar 21 24 Apr 27 .00 Apr 26 1979 ANNUAL RUNOFF (AC-FT) 140600 43510 142700 10 PERCENT EXCEEDS 563 96 333 50 PERCENT EXCEEDS 97 63 150 90 PERCENT EXCEEDS 70 27 .12 e Estimated
The period of record statistics were computed from complete water year's of record. See the annual mean and annual runoff (ac-ft) summary statistics section of the manuscript.
143 EVERGLADES AND SOUTHEASTERN COASTAL AREA
02287497 N.W. WELLFIELD CANAL NEAR DADE BROWARD LEVEE, NEAR PENNSUCO, FL
LOCATION.--Lat 25°53'28", long 80°26'13", in NE 1⁄4 sec.28, T.52 S., R.39 E., Miami-Dade County, Hydrologic Unit 03090202, (Pennsuco quadrangle), 0.7 mi north of Pennsuco Canal, 0.9 mi east of Dade Broward Levee, 2.5 mi southwest of the Miami Canal, 3 mi east of Levee 30 Canal, and 3.5 mi west of Pennsuco.DRAINAGE AREA.--Indeterminate.PERIOD OF RECORD.--February 1991 to current year.GAGE.--Satellite data collection platform with water-stage shaft encoder and acoustic velocity meter. Datum of gage is National Geodetic Vertical Datum of 1929 (DERM bench mark).REMARKS.--Records fair except for estimated discharges, which are poor. Flow is the sum of regulation from vertical control structure DERM No. 1 and from levee seepage. Flow is positive to the east.ANNUAL MEAN and ANNUAL RUNOFF (AC-FT) SUMMARY STATISTICS.--Figures represent 6 water years of complete discharge (1992, 1996-2000).EXTREME STAGES FOR PERIOD OF RECORD.--Maximum gage height, 7.07 ft Oct. 15-17, 1999; minimum, 1.39 ft May 28, 1992.EXTREME STAGES FOR CURRENT YEAR.--Maximum gage height, 6.41 ft (estimated) Oct. 4; minimum, 3.01 ft Apr. 25.
SUMMARY STATISTICS FOR 2000 CALENDAR YEAR FOR 2001 WATER YEAR WATER YEARS 1991 - 2001 ANNUAL MEAN 182 HIGHEST ANNUAL MEAN 208 1996 LOWEST ANNUAL MEAN 129 1992 HIGHEST DAILY MEAN 196 Apr 15 184 Oct 27 360 Aug 16 1992 LOWEST DAILY MEAN 54 Oct 4 54 Oct 4 40 May 10 1991 ANNUAL SEVEN-DAY MINIMUM 111 Jul 1 72 May 16 42 May 9 1991 ANNUAL RUNOFF (AC-FT) 131600 10 PERCENT EXCEEDS 170 165 223 50 PERCENT EXCEEDS 150 129 181 90 PERCENT EXCEEDS 126 84 113 e Estimated
The period of record statistics were computed from complete water year's of record. See the annual mean and annual runoff (ac-ft) summary statistics section of the manuscript.
145 EVERGLADES AND SOUTHEASTERN COASTAL AREA
02288600 MIAMI CANAL AT N.W. 36TH STREET, MIAMI, FL
LOCATION.--Lat 25°48'29", long 80°15'49", in NE 1⁄4 sec.29, T.53 S., R.41 E., Miami-Dade County, Hydrologic Unit 03090202, on right bank at downstream end of N.W. 36th Street bridge fender at Miami, 200 ft upstream from salinity-control structure S-26.DRAINAGE AREA.--Indeterminate.PERIOD OF RECORD.--February 1959 to current year.REVISED RECORDS.--WDR FL-98-2A:1997GAGE.--Electronic data logger with water-stage shaft encoder and acoustic velocity meter with phone/radio telemetry provided by South Florida Water Management District. Datum of gage is National Geodetic Vertical Datum of 1929 (Dade County bench mark).REMARKS.--Records fair except for estimated daily discharges, which are poor. Flow affected by tide and is occasionally reversed. Some seepage losses above station into Miami-Dade Water and Sewer Authority well field for ground-water withdrawals. Natural flow materially affected by levee and control structures 31, 32 and 32A about 14 mi upstream, and structure 26 downstream. Acoustic velocity meter began on October 1, 1996. Discharge computed from continuous velocity record obtained from acoustic velocity meter.COOPERATION.--South Florida Water Management District.ANNUAL MEAN and ANNUAL RUNOFF (AC-FT) SUMMARY STATISTICS.--Figures represent 28 complete water years of discharge (1960-85,1987-88).EXTREME STAGES FOR PERIOD OF RECORD.--Maximum gage height, 5.28 ft (estimated) Oct. 15, 1999; minimum, -0.55 ft Apr. 26, 1970.EXTREME STAGES FOR CURRENT YEAR.--Maximum gage height, 4.63 ft Oct. 4; minimum, 0.47 ft Sept. 15.
SUMMARY STATISTICS FOR 2000 CALENDAR YEAR FOR 2001 WATER YEAR WATER YEARS 1959 - 2001 ANNUAL MEAN 251 HIGHEST ANNUAL MEAN 843 1960 LOWEST ANNUAL MEAN 31.2 1987 HIGHEST DAILY MEAN 1610 Oct 4 1610 Oct 4 1730 Oct 16 1999 LOWEST DAILY MEAN -2.9 May 29 -13 Feb 3 -279 Jun 1 1993 ANNUAL SEVEN-DAY MINIMUM .00 Dec 21 -1.1 Jan 31 -69 May 26 1993 ANNUAL RUNOFF (AC-FT) 182000 10 PERCENT EXCEEDS 656 469 568 50 PERCENT EXCEEDS 149 16 170 90 PERCENT EXCEEDS 6.2 .00 .00 e Estimated
The period of record statistics were computed from complete water year's of record. See the annual mean and annual runoff (ac-ft) summary statistics section of the manuscript.
147
81°
81°
80°
80°
26°26°
25°25°
Cape Sable
M I A M I - D A D E
BIS
CAY
NE
BAY
KEY LARGO
FLORIDA BAY
L-6
7 E
XT
1
1
1
27
27
41
94
826
836
95
Homestead
North Miami Beach
MIAMI02289060
254100080402200254100080402400
255300080370001
252523080352500
02290710
02290769
251716080342100
251724080341400
252036080324300
251855080283400251906080283400
251946080254800252043080302400
02287395
02287497
02288600
0229076502290766
02290767
02290768
255026080231300
022907647
MIAMI CANAL
CoralGables
255828080401301
02289050
254848080432001
255250080335001
25475408034430002289019
254543080405401
254543080491101
254130080380500
M O N R O E
254315080331500
253753080393600
253828080391100
02286200
02289500
EXPLANATION
STREAM GAGING STATION
02290769
0228904002289041
TAMIAMI CANAL
25454008032570025454008800361500
Figure 7. Location of gaging stations in the portio of the Everglades and southeartern coastal area
south of latitude 26 degrees; Florida Bay and the Florida Keys.
148
Figure 8. Tamiami Canal Outlets.
149 BIG CYPRESS SWAMP AND SOUTHWESTERN COASTAL AREA
02288800 TAMIAMI CANAL OUTLETS, MONROE TO CARNESTOWN, FL
LOCATION.--Lat 25°53'10", long 81°15'30", in NW 1⁄4 sec.6, T.53 S., R.31 E., Collier County, Hydrologic Unit 03090204, on downstream side of bridge 84 on U.S. Highway 41, 7 mi east of Carnestown, and 10 mi west of Monroe.DRAINAGE AREA.--Indeterminate.PERIOD OF RECORD.--August 1960 to current year.REVISED RECORDS.--WDR FL-98-2A:1997.GAGE.--Water-stage recorder. Datum of gage is National Geodetic Vertical Datum of 1929. Prior to May 2, 1963, at site 2 mi east at datum 0.93 ft lower. May 2, 1963, to February 10, 1965, at site on west bank of unnamed lateral 30 ft downstream.REMARKS.--No estimated daily discharges. Records poor. Figures of discharge consist of runoff from Big Cypress Watershed as represented by flow through all the outlets of the Tamiami Canal from Monroe, 55 mi west of Miami, to a point 1 mi east of the intersection with State Highway 29 at Carnestown (Bridge numbers 95-77). Flow at western-most outlets affected by tide. Flow measurements under tidal influence are computed as zero flow. Peak flow above base are not determined.ANNUAL MEAN and ANNUAL RUNOFF (AC-FT) SUMMARY STATISTICS.--Figures represent 40 complete water years of discharge (1960-94, 1996-2001).EXTREME STAGES FOR PERIOD OF RECORD.--Maximum gage height, 5.90 ft present datum Sept. 14, 1960; minimum, -0.52 ft, June 5-8, 2001.EXTREME STAGES FOR CURRENT YEAR.--Maximum gage height, 5.58 ft Oct. 4; minimum, -0.52 ft June 5-8.
SUMMARY STATISTICS FOR 2000 CALENDAR YEAR FOR 2001 WATER YEAR WATER YEARS 1960 - 2001 ANNUAL TOTAL 116296.92 180110.44 ANNUAL MEAN 318 493 401 HIGHEST ANNUAL MEAN 790 1983 LOWEST ANNUAL MEAN 187 1975 HIGHEST DAILY MEAN 3950 Oct 4 3950 Oct 4 6010 Sep 13 1960 LOWEST DAILY MEAN .00 Apr 3 .00 Jan 3 .00 Jan 15 1961 ANNUAL SEVEN-DAY MINIMUM .00 Apr 3 .00 Jan 3 .00 Jan 15 1961 ANNUAL RUNOFF (AC-FT) 230700 357200 290600 10 PERCENT EXCEEDS 1200 1740 1260 50 PERCENT EXCEEDS 31 9.3 105 90 PERCENT EXCEEDS .00 .00 .00
The period of record statistics were computed from complete water year's of record. See the annual mean and annual runoff (ac-ft) summary statistics section of the manuscript.
151 BIG CYPRESS SWAMP AND SOUTHWESTERN COASTAL AREA
02288900 TAMIAMI CANAL OUTLETS, 40-MILE BEND TO MONROE, FL
LOCATION.--Lat 25°51'05", long 80°58'50", in SW 1⁄4 sec.13, T.53 S., R.33 E., Collier County, Hydrologic Unit 03090202, on south bank, 25 ft east of bridge 105 on U.S. Highway 41, and 54 mi west of Miami, Dade County.DRAINAGE AREA.--Indeterminate.PERIOD OF RECORD.--November 1939 to September 1963 (monthly discharge only), October 1963 to current year. Prior to October 1963, published as Tamiami Canal at bridge 105, near Miami (auxiliary). Records of gage height prior to October 1963, are available in files of the U.S. Geological Survey.GAGE.--Water-stage recorder. Datum of gage is National Geodetic Vertical Datum of 1929. Prior to February 20, 1952, non-recording gage and February 20, 1952, to May 28, 1952, water-stage recorder, at same site at datum 0.37 ft higher.REMARKS.--No estimated daily discharges. Discharge records poor. Figures of daily discharge consist of runoff from Big Cypress Watershed and from the southern extension of the Levee 28 canal as represented by flow through all 29 bridges from bridge 28 to 22 and bridge 117 to 96. Prior to October 1963, daily discharge for this portion of canal was published as part of the total daily discharge of station, Tamiami Canal Outlets, Miami to Monroe (station 02289000). No NASQAN water quality records collected after September 30, 1993. No peaks above base determined.ANNUAL MEAN and ANNUAL RUNOFF (AC-FT) SUMMARY STATISTICS.--Average annual mean discharge, 340 ft3/s, 247,100 acre-ft/yr. Figures represent 60 complete water years of discharge (1964-88, 1990-97, 1999-2001). Monthly discharge only, available 1941-63 water years.EXTREME STAGES FOR PERIOD OF RECORD.--Maximum gage height, 10.01 ft Oct. 20,1947 (present datum); minimum, 2.65 ft May 26,1974.EXTREME STAGES FOR CURRENT YEAR.--Maximum gage height, 8.90 ft Sept. 29; minimum, 3.67 ft May 21, 22.
SUMMARY STATISTICS FOR 2000 CALENDAR YEAR FOR 2001 WATER YEAR WATER YEARS 1964 - 2001 ANNUAL TOTAL 83376.06 113591.38 ANNUAL MEAN 228 311 387 HIGHEST ANNUAL MEAN 1660 1995 LOWEST ANNUAL MEAN 118 1975 HIGHEST DAILY MEAN 2120 Oct 4 2120 Oct 4 7270 Oct 17 1999 LOWEST DAILY MEAN .00 Apr 11 .00 Mar 16 .00 Apr 16 1965 ANNUAL SEVEN-DAY MINIMUM .00 May 12 .00 Apr 3 .00 Apr 30 1966 ANNUAL RUNOFF (AC-FT) 165400 225300 280000 10 PERCENT EXCEEDS 607 1180 1060 50 PERCENT EXCEEDS 111 44 128 90 PERCENT EXCEEDS 3.4 .00 .94
The period of record statistics were computed from complete water year's of record. See the annual mean and annual runoff (ac-ft) summary statistics section of the manuscript.
153 EVERGLADES AND SOUTHEASTERN COASTAL AREA
254754080344300 SHARK RIVER SLOUGH NO. 1 IN CONSERVATION AREA 3B NEAR COOPERTOWN, FL
LOCATION.--Lat 25°47'54", long 80°33'43", in SW 1⁄4 sec.30, T.53 S., R.38 E., Miami-Dade County, Hydrologic Unit 03090202, 2.8 mi northwest of Coopertown on east-west ditch in Conservation Area 3B.DRAINAGE AREA.--Indeterminate.PERIOD OF RECORD.--October 1976 to September 1980, October 1982 to current year. Prior to October 1977, published as "Shark Valley Slough No. 1 in Conservation Area 3B near Coopertown."GAGE.--Satellite data collection platform with water-stage shaft encoder. Datum of gage is National Geodetic Vertical Datum of 1929.EXTREME STAGES FOR PERIOD OF RECORD.--Maximum gage height, 9.76 ft Oct. 15, 1999; minimum, 3.95 ft May 23, 1990.EXTREME STAGES FOR CURRENT YEAR.--Maximum gage height, 8.47 ft Sept. 29, 30; minimum, 5.21 ft May 22, 23.REVISIONS.--Water years 1994 - 1997 were corrected by -0.02 ft, due to levels. Water years 1998 and 1999 were corrected by -0.03 ft, due to levels. Corrected data are in the files of the U.S. Geological Survey.
261533080571600 L-28 INTERCEPTOR CANAL BELOW S-190 NEAR CLEWISTON, FL
LOCATION.--Lat 26°15'33", long 80°57'16", in SW 1⁄4 sec.32, T.48 S., R.34 E., Hendry County, Hydrologic Unit 03090202, on east bank of Levee 28 Interceptor canal, 500 ft upstream from the northern boundary of Big Cypress National Preserve and inside the southern boundary of the Big Cypress Seminole Indian Reservation, 3.3 mi south of State Road 833, 4.6 mi west of the intersection of the Hendry, Collier and Broward county lines, 6.6 mi north of U.S. Interstate 75, and 33 mi south of Clewiston.DRAINAGE AREA.--Indeterminate.PERIOD OF RECORD.--October 16, 1996 to current year.GAGE.--Water-stage shaft encoder, acoustic velocity meter, and acoustic doppler velocity meter provided by the U.S. Geological Survey. Electronic data logger with cellular phone/radio telemetry provided by South Florida Water Management District. Datum of gage is National Geodetic Vertical Datum of 1929 (R. D. Price and Assoc. bench mark).REMARKS.--Records fair except for daily discharges below 100 cfs and estimated discharges, which are poor. Flow affected by levee and control structure S-190 about 2 mi upstream. Discharge computed from continuous velocity record obtained from acoustic doppler velocity meter and acoustic velocity meter. Flow is positive to the south.COOPERATION.--Seminole Tribe of Florida.ANNUAL MEAN and ANNUAL RUNOFF (AC-FT) SUMMARY STATISTICS.--Figures represent 4 complete water years of discharge (1998-2001).EXTREME STAGES FOR PERIOD OF RECORD.--Maximum gage height, 13.80 ft Nov. 5, 1998; minimum, 9.13 ft May 23, 2001.EXTREME STAGES FOR CURRENT YEAR.--Maximum gage height, 13.78 ft Sept. 18; minimum, 9.13 ft May 23.
SUMMARY STATISTICS FOR 2000 CALENDAR YEAR FOR 2001 WATER YEAR WATER YEARS 1997 - 2001 ANNUAL TOTAL 13941.67 38840.22 ANNUAL MEAN 38.1 106 73.4 HIGHEST ANNUAL MEAN 106 2001 LOWEST ANNUAL MEAN 38.6 2000 HIGHEST DAILY MEAN 2050 Oct 5 2050 Oct 5 2050 Oct 5 2000 LOWEST DAILY MEAN -135 Jan 18 -83 Dec 9 -135 Jan 18 2000 ANNUAL SEVEN-DAY MINIMUM -91 Jan 17 -40 Dec 9 -91 Jan 17 2000 ANNUAL RUNOFF (AC-FT) 27650 77040 53140 10 PERCENT EXCEEDS 92 316 216 50 PERCENT EXCEEDS -8.2 4.4 10 90 PERCENT EXCEEDS -63 -35 -50 e Estimated
The period of record statistics were computed from complete water year's of record. See the annual mean and annual runoff (ac-ft) summary statistics section of the manuscript.
156 EVERGLADES AND SOUTHEASTERN COASTAL AREA
261543080495000 L28 CANAL ABOVE S-140 NEAR CLEWISTON, FL
LOCATION.--Lat 26°15'43", long 80°49'50", in SW 1⁄4 sec. 34, T.48 S., R.35 E., Broward County, Hydrologic Unit 03090202, Florida, on east bank, 500 ft upstream from the northern boundary of the Miccosukee Tribe of Florida and inside the southern boundary of the Big Cypress Seminole Indian Reservation, 3.1 mi east of the intersection of the Broward, Collier and Hendry county lines, 6.0 mi north of Pump Station S-140, 6.9 mi north of U.S. Interstate 75, and 33 mi south of Clewiston on the Levee 28 canal.DRAINAGE AREA.--Indeterminate.PERIOD OF RECORD.--February 3, 1997 to current year.GAGE.--Electronic data logger with water-stage shaft encoder and acoustic velocity meter with cellular phone / radio telemetry provided by South Florida Management District. Datum of gage is National Geodetic Vertical Datum of 1929.REMARKS.--No estimated daily discharge. Records are fair. Flow affected by G-89 and USSO culvert structures upstream and pump structure S-140 downstream. Positive flow is to the south. Discharge computed from continuous velocity record obtained from acoustic velocity meter.COOPERATION.--Seminole Tribe of Florida.ANNUAL MEAN and ANNUAL RUNOFF (AC-FT) SUMMARY STATISTICS.--Figures represent three complete water years of discharge (1998-2000).EXTREME STAGES FOR PERIOD OF RECORD.--Maximum gage height, 12.06 ft Oct. 16, 1999; minimum, 8.04 ft Oct. 29, 2000.EXTREME STAGES FOR CURRENT YEAR.--Maximum gage height, 11.74 ft July 23; minimum, 8.04 ft Oct. 29.
SUMMARY STATISTICS FOR 2000 CALENDAR YEAR FOR 2001 WATER YEAR WATER YEARS 1997 - 2001 ANNUAL TOTAL 19807.99 ANNUAL MEAN 54.1 88.3 HIGHEST ANNUAL MEAN 116 1999 LOWEST ANNUAL MEAN 71.3 2000 HIGHEST DAILY MEAN 853 Oct 5 853 Oct 5 853 Oct 5 2000 LOWEST DAILY MEAN -61 Apr 30 -66 Mar 27 -67 Mar 24 1997 ANNUAL SEVEN-DAY MINIMUM -30 Feb 20 -37 May 8 -37 May 8 2001 ANNUAL RUNOFF (AC-FT) 39290 63950 10 PERCENT EXCEEDS 139 233 230 50 PERCENT EXCEEDS 11 36 48 90 PERCENT EXCEEDS -26 -19 -17
The period of record statistics were computed from complete water year's of record. See the annual mean and annual runoff (ac-ft) summary statistics section of the manuscript.
158 EVERGLADES AND SOUTHEASTERN COASTAL AREA
02289027 DRAINAGE CANAL BELOW STRUCTURE G-136, NEAR CLEWISTON, FL
LOCATION.--Lat 26°40'02", long 80°56'18", in SW 1⁄4 sec.9, T.44 S., R.34 E., Hendry County, Hydrologic Unit 03090202, approximately 1,000 ft east of structure G-136, and approximately 6 mi south of Clewiston, FL.DRAINAGE AREA.--Indeterminate.PERIOD OF RECORD.--May - July 1992 (gage heights only), August 1992 to current year.REVISED RECORDS.--WDR FL-94-2A:1992, 1993.GAGE.--Satellite data collection platform with water-stage shaft encoder and acoustic velocity meter. Datum of gage is National Geodetic Vertical Datum of 1929.REMARKS.--Records poor. Flow affected by structure activity at G-136 and by agricultural pumping. Discharge computed from continuous record of acoustic velocity and stage.ANNUAL MEAN AND ANNUAL RUNOFF (AC-FT) SUMMARY STATISTICS.--Figures represent 3 complete water years of discharge (1996-97, 2000).EXTREME STAGES FOR PERIOD OF RECORD.--Maximum gage height, 13.88 ft Nov. 5, 1998; minimum, 9.08 ft May 21, 22, 2001.EXTREME STAGES FOR CURRENT YEAR.--Maximum gage height, 13.26 ft Sept. 29; minimum, 9.08 ft May 21, 22.
SUMMARY STATISTICS FOR 2000 CALENDAR YEAR FOR 2001 WATER YEAR WATER YEARS 1992 - 2001 ANNUAL TOTAL 6881.5 ANNUAL MEAN 18.8 30.2 HIGHEST ANNUAL MEAN 42.0 1996 LOWEST ANNUAL MEAN 21.1 1993 HIGHEST DAILY MEAN 84 Sep 21 211 Aug 8 376 Oct 17 1995 LOWEST DAILY MEAN 6.6 Aug 24 4.7 May 28 .00 Sep 19 1992 ANNUAL SEVEN-DAY MINIMUM 9.0 Aug 22 7.5 Apr 30 .00 Nov 10 1992 ANNUAL RUNOFF (AC-FT) 13650 21850 10 PERCENT EXCEEDS 28 66 92 50 PERCENT EXCEEDS 15 13 18 90 PERCENT EXCEEDS 11 8.5 7.3 e Estimated
The period of record statistics were computed from complete water year's of record. See the annual mean and annual runoff (ac-ft) summary statistics section of the manuscript.
160 EVERGLADES AND SOUTHEASTERN COASTAL AREA
02289031 LEVEE 3 CANAL BELOW STRUCTURE G-155, NEAR CLEWISTON, FL
LOCATION.--Lat 26°19'48", long 80°52'48", in NW 1⁄4 sec.7, T.48 S., R.35 E., Broward County, Hydrologic Unit 03090202, approximately 1,050 ft downstream, due east of structure G-155, 3.0 mi northeast of Snake Road, and 35 mi south of Clewiston, FL.DRAINAGE AREA.--Indeterminate.PERIOD OF RECORD.--May to August 1992 (gage heights only), September 1992 to current year.GAGE.--Satellite data collection platform with water-stage shaft encoder and acoustic velocity meter until January 17, 2002, when it was removed. Satellite data collection platform with water-stage shaft encoder and acoustic doppler velocity meter installed September 25, 2001. The acoustic velocity meter and acoustic doppler velocity meter were run in tandem for the period of September 25, 2001 to January 17, 2002. Datum of gage is National Geodetic Vertical Datum of 1929.REMARKS.--Records poor. Flow affected by structure activity at G-155 and by agricultural pumping. Gage height records revised May 1992 through September 1994, based upon new elevation for BM L-4-6 from 22.578 ft to 22.543 ft. Discharge was not revised. Revised records are available in the files of the U.S. Geological Survey. The elevation of BM L-4-6 was revised by South Florida Water Management for a second time, elevation is now 22.380 ft. Gage height records for the 1992 - 1994 water years require an adjustment of + 0.16 ft due to the revised elevation of BM L-4-6. Gage height records for the 1995 - 1996 water years require an adjustment of + 0.19 ft also due to the revised elevation of BM L-4-6.ANNUAL MEAN and ANNUAL RUNOFF (AC-FT) SUMMARY STATISTICS.--Figures represent 1 complete water year of discharge (1997).EXTREME STAGES FOR PERIOD OF RECORD.--Maximum gage height, 15.56 ft Nov. 8, 1998; minimum, 9.02 ft May 23, 2001.EXTREME STAGES FOR CURRENT YEAR.--Maximum gage height, 14.64 ft Sept. 15; minimum, 9.02 ft May 23.
SUMMARY STATISTICS FOR 2000 CALENDAR YEAR FOR 2001 WATER YEAR WATER YEARS 1992 - 2001 ANNUAL MEAN 114 HIGHEST ANNUAL MEAN 114 1997 LOWEST ANNUAL MEAN 114 1997 HIGHEST DAILY MEAN 382 Oct 5 718 Sep 30 1040 Jun 25 1996 LOWEST DAILY MEAN -8.8 Sep 7 -7.7 Mar 12 -51 Mar 24 1999 ANNUAL SEVEN-DAY MINIMUM 5.1 Aug 18 2.4 Apr 19 -33 Dec 26 1996 ANNUAL RUNOFF (AC-FT) 82270 10 PERCENT EXCEEDS 101 127 389 50 PERCENT EXCEEDS 28 34 34 90 PERCENT EXCEEDS 7.0 7.4 -5.6 e Estimated
The period of record statistics were computed from complete water year's of record. See the annual mean and annual runoff (ac-ft) summary statistics section of the manuscript.
162 EVERGLADES AND SOUTHEASTERN COASTAL AREA
02289032 LEVEE 4 BELOW STRUCTURE G-88, NEAR CLEWISTON, FL
LOCATION.--Lat 26°19'52", long 80°52'48", in NW 1⁄4 sec.7, T.48 S., R.35 E., Broward County, Hydrologic Unit 03090202, approximately 1,050 ft below structure G-88, 3.0 mi northeast of Snake Road and 35 mi south of Clewiston, FL.DRAINAGE AREA.--Indeterminate.PERIOD OF RECORD.--May to July 1992 (gage height only), August 1992 to current year.GAGE.--Satellite data collection platform with water-stage shaft encoder and acoustic velocity meter until October 18, 2001, when it was removed. Satellite data collection platform with water-stage shaft encoder and acoustic doppler velocity meter installed January 10, 2001. The acoustic velocity meter and acoustic doppler velocity meter were run in tandem for the period of January 10, 2001 to October 18, 2001. Datum of gage is National Geodetic Vertical Datum of 1929.REMARKS.--Records poor. Flow affected by operation of G-88, pump station S-8, and by agricultural pumping. Flow reversal occurs at times, during agricultural activity. Discharge computed from continuous record of line velocity and stage. Gage height records revised -0.04 ft May 1992 through September 1994, based upon revised elevation for BM L-4-6 from 22.578 ft to 22.543 ft. Discharge was not revised. Revised records are available in the files of the U.S. Geological Survey. The elevation of BM L-4-6 was revised by South Florida Water Management for a second time, elevation is now 22.380 ft. Gage height records for the 1992 - 1994 water years are now in error + 0.21 ft in the files of the U.S. Geological Survey due to the revised elevation of BM L-4-6. Gage height records for the 1995 - 1996 water years are now in error + 0.25 ft in the files of the U.S. Geological Survey due to the revised elevation of BM L-4-6.ANNUAL MEAN AND ANNUAL RUNOFF (AC-FT) SUMMARY STATISTICS.--Figures represent 4 complete water years of discharge (1994, 1996-97, 2001).EXTREME STAGES FOR PERIOD OF RECORD.--Maximum gage height, 14.61 ft Sept. 15, 2001; minimum, 8.68 ft Sept. 19, 1998.EXTREME STAGES FOR CURRENT YEAR.--Maximum gage height, 14.61 ft Sept. 15; minimum, 9.03 ft May. 23.
SUMMARY STATISTICS FOR 2000 CALENDAR YEAR FOR 2001 WATER YEAR WATER YEARS 1992 - 2001 ANNUAL TOTAL 10325.01 ANNUAL MEAN 28.3 76.9 HIGHEST ANNUAL MEAN 126 1996 LOWEST ANNUAL MEAN 28.3 2001 HIGHEST DAILY MEAN 279 Oct 5 390 Sep 15 995 Oct 21 1995 LOWEST DAILY MEAN -214 May 20 -64 May 21 -214 May 20 2000 ANNUAL SEVEN-DAY MINIMUM -70 May 27 -17 May 16 -127 May 21 1998 ANNUAL RUNOFF (AC-FT) 20480 55740 10 PERCENT EXCEEDS 41 84 269 50 PERCENT EXCEEDS 6.1 7.4 31 90 PERCENT EXCEEDS -40 -10 -25 e Estimated
The period of record statistics were computed from complete water year's of record. See the annual mean and annual runoff (ac-ft) summary statistics section of the manuscript.
164 EVERGLADES AND SOUTHEASTERN COASTAL AREA
254543080491101 TAMIAMI CANAL AT S-12-A, NEAR MIAMI, FL
LOCATION.--Lat 25°45'43", long 80°49'11", T.54 S., R.35 E., Dade County, Hydrologic Unit 03090202, on northwest bank of Levee 29 Tamiami Canal, 50 feet south of structure S-12-A. Approximately 21.8 mi west of State Road 997 (old State Road 27) along U.S. Highway 41 near 40 mile bend. No section could be determined from existing maps.DRAINAGE AREA.--Indeterminate.PERIOD OF RECORD.--October 1963 to September 1965, October 1970 to September 1971, October 1975 to September 1976, October 1977 to September 1980 (discharge only), October 1980 to current year.GAGE.--Satellite data collection platform with water-stage shaft encoders for upstream and downstream stages. Water-stage recorder for upstream and downstream used as backup prior to August 30, 1999. Datum of gage is National Geodetic Vertical Datum of 1929. Satellite data collection platform installed April 1, 1990.REMARKS.--Records fair, no estimated daily discharge. Station is one of several located downstream from the control structures, in Levee 29 at Tamiami Canal. Gage record is primarily used to determine discharge through control structure 12-A. Discharge is the total discharge through the S-12-A structure, from Conservation Area 3A. The daily discharge computed from relations between discharge, head, and gate-openings when flow is controlled by gates and computed by relation between stage and discharge under uncontrolled conditions. Stage and discharge records prior to 1980, were either fragmentary or unavailable from the files of the U.S. Geological Survey. Upstream gage height records were formerly published under 254543080491100. Upstream gage height records have been relocated under 254543080491101 as °Published' upstream record in the files of the U.S. Geological Survey.COOPERATION.--Gate opening records provided by U.S. Army Corps of Engineers.ANNUAL MEAN and ANNUAL RUNOFF (AC-FT) SUMMARY STATISTICS.--Figures represent 28 complete water years of discharge (1964-65, 1971,1976,1978-2001).EXTREME UPSTREAM STAGES FOR PERIOD OF RECORD.--Maximum gage height, 11.83 ft Dec. 21, 1994; minimum, 5.17 ft June 18, 19, 1989.EXTREME UPSTREAM STAGES FOR CURRENT YEAR.--Maximum gage height, 10.14 ft Sept. 29; minimum, 7.43 ft May 22.EXTREME DOWNSTREAM STAGES FOR PERIOD OF RECORD.--Maximum gage height, 11.80 ft Dec. 21, 1994; minimum, 5.21 ft June 19, 20, 1989.EXTREME DOWNSTREAM STAGES FOR CURRENT YEAR.--Maximum gage height, 10.12 ft Sept. 29, 30; minimum, 6.73 ft May 19, 21, 22.
SUMMARY STATISTICS FOR 2000 CALENDAR YEAR FOR 2001 WATER YEAR WATER YEARS 1964 - 2001 ANNUAL TOTAL 9067.00 20211.00 ANNUAL MEAN 24.8 55.4 132 HIGHEST ANNUAL MEAN 672 1995 LOWEST ANNUAL MEAN .000 1964 HIGHEST DAILY MEAN 355 Oct 18 521 Sep 30 1530 Jan 5 1995 LOWEST DAILY MEAN .00 Jan 1 .00 Oct 1 .00 Oct 1 1963 ANNUAL SEVEN-DAY MINIMUM .00 Jan 1 .00 Oct 1 .00 Oct 1 1963 ANNUAL RUNOFF (AC-FT) 17980 40090 95570 10 PERCENT EXCEEDS .00 292 382 50 PERCENT EXCEEDS .00 .00 .00 90 PERCENT EXCEEDS .00 .00 .00
The period of record statistics were computed from complete water year's of record. See the annual mean and annual runoff (ac-ft) summary statistics section of the manuscript.
167 EVERGLADES AND SOUTHEASTERN COASTAL AREA
02289019 TAMIAMI CANAL AT S-12-B, NEAR MIAMI, FL
LOCATION.--Lat 25°45'40", long 80°46'05", T.54 S., R.36 E., Miami-Dade County, Hydrologic Unit 03090202, on west bank of spillway, 100 ft southwest of control structure 12-B, and 35 mi west of Miami. No section could be determined from existing maps.DRAINAGE AREA.--Indeterminate.PERIOD OF RECORD.--April 1963 to September 1963, October 1963 to September 1965, October 1966 to September 1975 (gage heights only), October 1975 to current year.GAGE.--Satellite data collection platform with water-stage shaft encoders for upstream and downstream stages. Water-stage recorder for upstream and downstream used as backup prior to August 30, 1999. Datum of gage is National Geodetic Vertical Datum of 1929.REMARKS.--Records fair except for estimated daily discharges, which are poor. Since March 9, 1990, satellite data collection platform. Station is one of several located below the gated control structures in Levee 29 at Tamiami Canal. Gage record is primarily used to determine discharge through structure 12-B. Discharge computed from relation between discharge, head, and gate openings when flow is controlled by gates and computed by relation between stage and discharge under uncontrolled conditions. Discharge records for the missing periods above were either fragmentary or unavailable from files of the U.S. Geological Survey. Upstream gage height records were formerly published under 02289018. Upstream gage height records have been relocated under 02289019 as Published upstream record in the files of the U.S. Geological Survey.ANNUAL MEAN and ANNUAL RUNOFF (AC-FT) SUMMARY STATISTICS.--Figures represent 28 complete water years of discharge (1964-65, 1976-2001).COOPERATION.--Gate opening records provided by U.S. Army Corps of Engineers.EXTREME UPSTREAM STAGES FOR PERIOD OF RECORD.--Maximum gage height, 11.92 ft Dec. 21, 1994; minimum, 5.14 ft June 18, 19, 1989.EXTREME UPSTREAM STAGES FOR CURRENT YEAR.--Maximum gage height, 10.16 ft Sept. 29; minimum, 7.43 ft May 22.EXTREME DOWNSTREAM STAGES FOR PERIOD OF RECORD.--Maximum gage height, 11.91 ft Dec. 21, 1994; minimum, 5.02 ft June 19, 1989.EXTREME DOWNSTREAM STAGES FOR CURRENT YEAR.--Maximum gage height, 10.15 ft Sept. 29; minimum, 6.68 ft May 22.
SUMMARY STATISTICS FOR 2000 CALENDAR YEAR FOR 2001 WATER YEAR WATER YEARS 1964 - 2001 ANNUAL TOTAL 9054.00 21380.00 ANNUAL MEAN 24.7 58.6 125 HIGHEST ANNUAL MEAN 561 1995 LOWEST ANNUAL MEAN .000 1964 HIGHEST DAILY MEAN 460 Oct 12 488 Sep 30 1380 Jan 5 1995 LOWEST DAILY MEAN .00 Jan 1 .00 Oct 1 -22 Mar 28 1985 ANNUAL SEVEN-DAY MINIMUM .00 Jan 1 .00 Oct 1 -3.1 Mar 26 1985 ANNUAL RUNOFF (AC-FT) 17960 42410 90280 10 PERCENT EXCEEDS .00 283 353 50 PERCENT EXCEEDS .00 .00 9.5 90 PERCENT EXCEEDS .00 .00 .00 e Estimated
The period of record statistics were computed from complete water year's of record. See the annual mean and annual runoff (ac-ft) summary statistics section of the manuscript.
170 EVERGLADES AND SOUTHEASTERN COASTAL AREA
02289040 TAMIAMI CANAL OUTLETS, LEVEE 67A TO 40-MILE BEND, NEAR MIAMI, FL
LOCATION.--Lat 25°45'22", long 80°43'34", T.54 S., R.36 E., Miami-Dade County, Hydrologic Unit 03090202, on south bank of Levee 29 Borrow Canal, 100 ft northwest of control structure 12-C, and 33 mi west of Miami. No section could be determined from existing maps.DRAINAGE AREA.--Indeterminate.PERIOD OF RECORD.--November 1939 to September 1963 (monthly discharge), October 1963 to current year.REVISED RECORDS.--WDR FL-87-2A:1986. WDR FL-89-2A:1983.GAGE.--Satellite data collection platform with water-stage shaft encoder. Datum of gage is National Geodetic Vertical Datum of 1929.REMARKS.--Records fair except for estimated daily discharges, which are poor. Discharge is the total discharge through the S-12 structures A, B, C, and D from Conservation Area 3A. Prior to October 1963 discharge was the total discharge of station, Tamiami Canal Outlets, Miami to Monroe (station 02289000). The daily discharge computed from relation between discharge, head, and gate openings when flow is controlled by gates and computed by relation between stage and discharge under uncontrolled conditions. Satellite data collection platform at S-12-C downstream that records upstream and downstream gages.COOPERATION.--Gate-opening records for S-12 complex provided by U.S. Army Corps of Engineers.ANNUAL MEAN and ANNUAL RUNOFF (AC-FT) SUMMARY STATISTICS.--Average annual mean discharge, 581 ft3/s, 420,900 acre-ft/yr. Figures represent 60 complete water years of discharge (1941-97,1999-2001). Monthly discharge only, available 1941-63 water years. SPECIAL NOTE: Statistics for the period of record 1941-2001 computed manually. NWIS database not complete.EXTREME STAGES FOR PERIOD OF RECORD.--Maximum gage height, 11.87 ft Dec. 21, 1994; minimum, 5.17 ft June 19, 1989.EXTREME STAGES FOR CURRENT YEAR.--Maximum gage height, 10.21 ft Sept. 29; minimum, 7.46 ft May 22.
SUMMARY STATISTICS FOR 2000 CALENDAR YEAR FOR 2001 WATER YEAR WATER YEARS 1964 - 2001* ANNUAL TOTAL 138283.00 148846.20 ANNUAL MEAN 378 408 819 HIGHEST ANNUAL MEAN 3328 1995 LOWEST ANNUAL MEAN 6.82 1964 HIGHEST DAILY MEAN 2050 Oct 12 2650 Sep 30 7430 Dec 22 1994 LOWEST DAILY MEAN .00 Feb 16 .00 Feb 13 -38 Mar 28 1985 ANNUAL SEVEN-DAY MINIMUM .00 Feb 16 .00 Feb 13 -5.4 Mar 28 1985 ANNUAL RUNOFF (AC-FT) 274300 295200 593500 10 PERCENT EXCEEDS 1660 1700 2280 50 PERCENT EXCEEDS 64 28 336 90 PERCENT EXCEEDS .00 .00 .00 e Estimated
* The period of record statistics were computed from complete water year's of record stored in the NWIS database. See the annual mean and annual runoff (ac-ft) summary statistics section of the manuscript for the statistics for the complete period of record (1941-2001).
172 EVERGLADES AND SOUTHEASTERN COASTAL AREA
02289041 TAMIAMI CANAL BELOW S-12-C, NEAR MIAMI, FL
LOCATION.--Lat 25°45'40", long 80°43'34", T.54 S., R.36 E., Miami-Dade County, Hydrologic Unit 03090202, on west bank of spillway, 100 ft southwest of control structure 12-C, and 33 mi west of Miami. No section could be determined from existing maps.DRAINAGE AREA.--Indeterminate.PERIOD OF RECORD.--April 1963 to September 1963, October 1965 to September 1976 (gage heights only), October 1963 to September 1965, October 1976 to current year.GAGE.--Satellite data collection platform with water-stage shaft encoders for upstream and downstream stages. Water-stage recorders used as back up prior to August 26, 1999. Datum of gage is National Geodetic Vertical Datum of 1929.REMARKS.--Records fair. No estimated daily discharges. Daily mean for upstream gage height published under 02289040. Station is one of several located downstream from the control structures in Levee 29 at Tamiami Canal. Gage record is primarily used to determine discharge through control structure 12-C. Discharge is the total discharge through the S-12-C structure, from Conservation Area 3A. The daily discharge computed from relation between discharge, head, and gate-openings when flow is controlled by gates and computed by relation between stage and discharge under uncontrolled conditions. Since March 16, 1990, data collection platform. Discharge records prior to 1976, for missing periods were fragmentary or missing from the files of the U.S. Geological Survey.COOPERATION.--Gate-opening records provided by the U.S. Army Corps of Engineers.ANNUAL MEAN and ANNUAL RUNOFF (AC-FT) SUMMARY STATISTICS.--Figures represent 27 complete water years of discharge (1964-65, 1977-2001).EXTREME STAGES FOR PERIOD OF RECORD.--Maximum gage height, 11.86 ft Dec. 21, 1994; minimum, 4.87 ft June 19, 20, 1989.EXTREME STAGES FOR CURRENT YEAR.--Maximum gage height, 10.19 ft Sept. 29; minimum, 6.69 ft May. 22.
SUMMARY STATISTICS FOR 2000 CALENDAR YEAR FOR 2001 WATER YEAR WATER YEARS 1964 - 2001 ANNUAL TOTAL 54145.00 48432.00 ANNUAL MEAN 148 133 258 HIGHEST ANNUAL MEAN 919 1995 LOWEST ANNUAL MEAN .000 1964 HIGHEST DAILY MEAN 919 Jan 1 793 Sep 30 2500 Jan 23 1970 LOWEST DAILY MEAN .00 Feb 16 .00 Nov 16 -49 Jul 14 1990 ANNUAL SEVEN-DAY MINIMUM .00 Feb 16 .00 Nov 16 -9.7 Jul 8 1990 ANNUAL RUNOFF (AC-FT) 107400 96060 186700 10 PERCENT EXCEEDS 564 543 672 50 PERCENT EXCEEDS .00 .00 99 90 PERCENT EXCEEDS .00 .00 .00
The period of record statistics were computed from complete water year's of record. See the annual mean and annual runoff (ac-ft) summary statistics section of the manuscript.
174 EVERGLADES AND SOUTHEASTERN COASTAL AREA
254543080405401 TAMIAMI CANAL AT S-12-D, NEAR MIAMI, FL
LOCATION.--Lat 25°45'43", long 80°40'54", T.54 S., R.36 E., Miami-Dade County, Hydrologic Unit 03090202, on south bank 100 ft southwest of structure 12-D, near east boundary of Indian Reservation on U.S. Highway 41. No section could be determined from existing maps.DRAINAGE AREA.--Indeterminate.PERIOD OF RECORD.--October 1963 to September 1965, October 1975 to September 1977, October 1978 to September 1979, October 1980 to September 1981 (discharge only), October 1981 to current year.GAGE.--Satellite data collection platform with water-stage shaft encoders for upstream and downstream stages, tipping bucket rain gage. Water-stage recorders used as back-up prior to August 11, 1999. Datum of gage is National Geodetic Vertical Datum of 1929.REMARKS.--Records fair except for estimated daily discharges, which are poor. Station is one of several located downstream from the control structures in Levee 29 at Tamiami Canal. Gage records are primarily used to determine discharge through control structure 12-D. Discharge is the total discharge through the S-12-D structure from Conservation Area 3A. The daily discharge computed from relations between discharge, head, and gate openings when flow is controlled by gates and computed by relation between stage and discharge under uncontrolled conditions. Discharge and stage record for missing periods were fragmentary or missing from the files of the U.S. Geological Survey. Since October 1, 1989, satellite data collection platform. Rainfall data available in filed of the U.S. Geological Survey. Upstream gage height records were formerly published under 254543080405400. Upstream gage height records have been relocated under 254543080405401 as Published upstream record in the files of the U.S. Geological Survey.COOPERATION.--Gate-opening records provided by the U.S. Army Corps of Engineers.ANNUAL MEAN and ANNUAL RUNOFF (AC-FT) SUMMARY STATISTICS.-- Figures represent 25 complete water years of discharge (1964-65, 1976-77, 1979, 1981-97, 1999-2001).EXTREME UPSTREAM STAGES FOR PERIOD OF RECORD.--Maximum gage height, 11.99 ft Dec. 21, 1994; minimum, 5.16 ft June 19, 1989.EXTREME UPSTREAM STAGES FOR CURRENT YEAR.--Maximum gage height, 10.32 ft Sept. 29; minimum, 7.44 ft May 22.EXTREME DOWNSTREAM STAGES FOR PERIOD OF RECORD.--Maximum gage height, 11.94 ft Dec. 21, 1994 (corrected); minimum, 4.70 ft June 20, 1989.EXTREME DOWNSTREAM STAGES FOR CURRENT YEAR.--Maximum gage height, 10.31 ft Sept. 29; minimum, 5.47 ft May 22.
SUMMARY STATISTICS FOR 2000 CALENDAR YEAR FOR 2001 WATER YEAR WATER YEARS 1964 - 2001 ANNUAL TOTAL 66024.00 58875.20 ANNUAL MEAN 180 161 261 HIGHEST ANNUAL MEAN 1177 1995 LOWEST ANNUAL MEAN .000 1976 HIGHEST DAILY MEAN 907 Jan 2 854 Sep 30 2670 Dec 22 1994 LOWEST DAILY MEAN .00 Feb 16 .00 Feb 13 -16 Mar 28 1985 ANNUAL SEVEN-DAY MINIMUM .00 Feb 16 .00 Feb 13 -2.3 Mar 28 1985 ANNUAL RUNOFF (AC-FT) 131000 116800 189000 10 PERCENT EXCEEDS 572 560 728 50 PERCENT EXCEEDS 64 28 9.9 90 PERCENT EXCEEDS .00 .00 .00 e Estimated
The period of record statistics were computed from complete water year's of record. See the annual mean and annual runoff (ac-ft) summary statistics section of the manuscript.
177 EVERGLADES AND SOUTHEASTERN COASTAL AREA
02289050 TAMIAMI CANAL AT S-333 NEAR MIAMI, FL
LOCATION.--Lat 25°45'39", long 80°40'27", in SW 1⁄4 sec.6, T.54 S., R.37 E., Dade County, Hydrologic Unit 03090202, on south bank of Levee 29 in control house of control structure 333 at Levee 67A, 100 ft north of U.S. Highway 41 and 29 mi west of Miami.DRAINAGE AREA.--Indeterminate.PERIOD OF RECORD.--August 1978 to September 1981 (gage heights only), October 1981 to current year.REVISED RECORDS.--WDR FL-87-2A:1986.GAGE.--Water-stage shaft encoders for upstream and downstream, and gate-opening recorder with cellular phone/radio telemetry. Water-stage recorders prior to September 1, 1999. Datum of gage is National Geodetic Vertical Datum of 1929 (U.S. Army Corps of Engineers bench mark).REMARKS.--Records good except estimated discharges, which are poor. Flow is regulated by operation of control structure 333. Discharge computed from relations between discharge, head, and gate opening. Records prior to October 1981, are available in files of the South Florida Water Management District.COOPERATION.--Control structure 333 gate-operation records and upstream and downstream data provided by South Florida Water Management District.ANNUAL MEAN and ANNUAL RUNOFF (AC-FT) SUMMARY STATISTICS.--Figures represent 20 complete water years of discharge (1982-2001).EXTREME UPSTREAM STAGES FOR PERIOD OF RECORD.--Maximum gage height, 12.10 ft Dec. 21, 1994; minimum, 5.20 ft June 19, 1989 (estimated).EXTREME UPSTREAM STAGES FOR CURRENT YEAR.--Maximum gage height, 10.37 ft Sept. 29, 30; minimum, 7.44 ft May 22.EXTREME DOWNSTREAM STAGES FOR CURRENT YEAR.--Maximum gage height, 8.34 ft Nov. 7; minimum, 4.67 ft May 22.
SUMMARY STATISTICS FOR 2000 CALENDAR YEAR FOR 2001 WATER YEAR WATER YEARS 1982 - 2001 ANNUAL TOTAL 118834.40 62832.00 ANNUAL MEAN 325 172 238 HIGHEST ANNUAL MEAN 572 1993 LOWEST ANNUAL MEAN 51.8 1989 HIGHEST DAILY MEAN 1670 Feb 24 1410 Aug 28 1670 Feb 24 2000 LOWEST DAILY MEAN .00 Jan 1 .00 Oct 4 .00 Oct 1 1981 ANNUAL SEVEN-DAY MINIMUM .00 Jul 25 .00 Oct 4 .00 Oct 1 1981 ANNUAL RUNOFF (AC-FT) 235700 124600 172100 10 PERCENT EXCEEDS 989 558 705 50 PERCENT EXCEEDS 230 .00 127 90 PERCENT EXCEEDS .00 .00 .00 e Estimated
The period of record statistics were computed from complete water year's of record. See the annual mean and annual runoff (ac-ft) summary statistics section of the manuscript.
180 EVERGLADES AND SOUTHEASTERN COASTAL AREA
254540080361500 TAMIAMI CANAL AT S-355A, NEAR MIAMI, FL
LOCATION.--Lat 25°45'40", long 80°36'15", in SW 1⁄4 sec. T.54 S., R.37 E., Miami-Dade County, Hydrologic Unit 03090202, on north bank of Levee 29 in control house 100 ft east of structure 355A, 2.4 mi west of structure 355B, 6.7 mi west of SR 997.DRAINAGE AREA.--Indeterminate.PERIOD OF RECORD.--October 2000 to current year.GAGE.--Satellite data collection platform with water-stage shaft encoders for upstream and downstream inside structure 355A control house; potentiometer-gage recorder attached to hydraulic ram of gate. Datum of gage is National Geodetic Vertical Datum of 1929.REMARKS.--Station is one of two located between structure 333 and structure 334 on Levee 29. Gage records are primarily used to determine discharge. Discharge is not available at time of publication. The gate is opened once a month for about an hour when conditions allow for maintenance purposes.COOPERATION.--U.S. Army Corps of Engineers.EXTREME UPSTREAM STAGES FOR PERIOD OF RECORD.--Maximum gage height, 8.49 ft Sept. 29, 2001; minimum, 4.95 ft May 22, 23, 2001.EXTREME DOWNSTREAM STAGES FOR PERIOD OF RECORD.--Maximum gage height, 8.40 ft Nov. 7, 2000; minimum, 4.91 ft May 22, 23, 2001.EXTREME UPSTREAM STAGES FOR CURRENT YEAR.--Maximum gage height, 8.49 ft Sept. 29; minimum, 4.95 ft May 22, 23.EXTREME DOWNSTREAM STAGES FOR CURRENT YEAR.--Maximum gage height, 8.40 ft Nov. 7; minimum, 4.91 ft May 22, 23.
02289060 TAMIAMI CANAL OUTLETS, LEVEE 30 TO LEVEE 67A, NEAR MIAMI, FL
LOCATION.--Lat 25°45'40", long 80°33'40", in SE 1⁄4 sec.6, T.54 S., R.38 E., Miami-Dade County, Hydrologic Unit 03090202, on south bank of Levee 29, 50 ft west of bridge 53 on U.S. Highway 41, and 22.8 mi west of Miami.DRAINAGE AREA.--Indeterminate.PERIOD OF RECORD.--November 1939 to September 1963 (monthly discharge), October 1963 to current year. October 1962 to September 1963, stage only (twice monthly) published as Tamiami Canal at bridge 45, near Miami (auxiliary). Stage records prior to October 1962, are available in files of the U.S. Geological Survey. Prior to October 1963, daily discharge for this portion of the canal was published as part of the total daily discharge of station, Tamiami Canal Outlets, Miami to Monroe (station 02289000).REVISED RECORDS.--WDR FL-2000-2A:1998-99.GAGE.--Electronic data logger. Datum of gage is National Geodetic Vertical Datum of 1929. Prior to August 27, 1942, non-recording gage at datum 0.80 ft lower; August 27, 1942 to February 21, 1952, non-recording gage at present datum; and February 21, 1952 to August 7, 1969, water-stage recorder at same datum, all at site 4 mi to the west.REMARKS.--No estimated daily discharges. Records poor. Figures of daily discharge consist of seepage through levee 29 from Conservation Area 3B and discharges from S-333 distributed along Levee 29 from Conservation Area 3A as represented by flow through all the outlets of Tamiami Canal from levee 30 to levee 67A (Bridges 45-59).ANNUAL MEAN and ANNUAL RUNOFF (AC-FT) SUMMARY STATISTICS.--Average annual mean discharge, 230 ft3/s, 167,400 acre-ft/yr. Figures represent 61 complete water years of discharge (1941-2001). Monthly discharge only, available 1941-1963 water years. SPECIAL NOTE: Statistics for the period of record 1941-2001 computed manually. NWIS database not complete.EXTREME STAGES FOR PERIOD OF RECORD.--Maximum gage height, 9.76 ft Nov. 1, 1960; minimum, 1.66 ft May 13, 14, 1971.EXTREME STAGES FOR CURRENT YEAR.--Maximum gage height, 8.28 ft Nov. 07; minimum, 4.86 ft May 23.
SUMMARY STATISTICS FOR 2000 CALENDAR YEAR FOR 2001 WATER YEAR WATER YEARS 1964 - 2001* ANNUAL TOTAL 118598 74356.61 ANNUAL MEAN 324 204 168 HIGHEST ANNUAL MEAN 660 1993 LOWEST ANNUAL MEAN 28.3 1974 HIGHEST DAILY MEAN 1780 Mar 1 1560 Aug 22 1780 Mar 1 2000 LOWEST DAILY MEAN 27 Apr 5 .00 May 1 -7.0 May 11 1964 ANNUAL SEVEN-DAY MINIMUM 56 Oct 30 .00 May 15 -5.9 May 7 1964 ANNUAL RUNOFF (AC-FT) 235200 147500 121900 10 PERCENT EXCEEDS 753 543 460 50 PERCENT EXCEEDS 229 54 87 90 PERCENT EXCEEDS 91 .71 1.1
*The period of record statistics were computed from complete water year's of record stored in the NWIS database. See the annual mean and annual runoff (ac-ft) summary statistics section of the manuscript for the statistics for the complete period of record (1941-2001).
184 EVERGLADES AND SOUTHEASTERN COASTAL AREA
254540080325700 TAMIAMI CANAL AT S-355B, NEAR MIAMI, FL
LOCATION.--Lat 25°45'40", long 80°32'57", in SW 1⁄4 sec. T.54 S., R.37 E., Miami-Dade County, Hydrologic Unit 03090202, on north bank of Levee 29 in control house 100 ft east of structure 355B, 2.4 mi east of structure 355A, 4.3 mi east of SR 997.DRAINAGE AREA.--Indeterminate.PERIOD OF RECORD.--July 1999 to current year.GAGE.--Satellite data collection platform with water-stage shaft encoders for upstream and downstream inside structure 355B control house; potentiometer-gage recorder attached to hydraulic ram of gate. Datum of gage is National Geodetic Vertical Datum of 1929.REMARKS.--Station is one of two located between structure 333 and structure 334 on Levee 29. Gage records are primarily used to determine discharge. Discharge is not available at time of publication. The gate is opened once a month for about an hour when conditions allow for maintenance purposes.COOPERATION.--U.S. Army Corps of Engineers.EXTREME UPSTREAM STAGES FOR PERIOD OF RECORD.--Maximum gage height, 9.67 ft Oct. 17, 18, 1999; minimum, 4.80 ft May 23, 2001.EXTREME DOWNSTREAM STAGES FOR PERIOD OF RECORD.--Maximum gage height, 8.88 ft Oct. 15, 1999; minimum, 4.89 ft May 22, 23, 2001.EXTREME UPSTREAM STAGES FOR 1999 WATER YEAR.--Maximum gage height , 8.65 ft Sept. 25, 27; minimum 7.74 July 13, 14, 15, 16, 17.EXTREME DOWNSTREAM STAGES FOR 1999 WATER YEAR.--Maximum gage height, 7.87 ft Sept. 27; minimum, 7.21 ft July 14.EXTREME UPSTREAM STAGES FOR 2000 WATER YEAR.--Maximum gage height, 9.67 ft Oct. 17, 18; minimum 6.73 ft June 6, 7.EXTREME DOWNSTREAM STAGES FOR 2000 WATER YEAR.--Maximum gage height, 8.88 ft Oct. 15; minimum, 6.32 ft Apr. 5.EXTREME UPSTREAM STAGES FOR CURRENT YEAR.--Maximum gage height, 8.47 ft Sept. 29, 30; minimum, 4.80 ft May 23.EXTREME DOWNSTREAM STAGES FOR CURRENT YEAR.--Maximum gage height, 8.20 ft Aug. 22; minimum, 4.89 ft May 22, 23.
LOCATION.--Lat 25°45'43", long 80°19'42", in SW 1⁄4 sec.3, T.54 S., R.40 E., Miami-Dade County, Hydrologic Unit 03090202, on upstream side of footbridge, 25 ft from south bank, 0.5 mi upstream from Coral Gables Canal, 2.5 mi west of Coral Gables city limits, 3.5 mi downstream from Snapper Creek Canal, and 6.2 mi upstream from mouth.DRAINAGE AREA.--Indeterminate.PERIOD OF RECORD.--January 1940 to June 1943, October 1959 to current year.REVISED RECORDS.--WDR FL-87-2A:1986; WDR FL-97-2A:1995; WDR FL-98-2A:1997.GAGE.--Satellite data collection platform with water-stage shaft encoder and acoustic velocity meter. Datum of gage is National Geodetic Vertical Datum of 1929. January 1940 to June 1943, non-recording gage at same site at datum 0.22 ft lower. Benchmark was readjusted, datum prior to 1963, 0.48 lower.REMARKS.--Records poor. The flow is slightly affected by tide and is regulated by control structures downstream at the Coral Gables Canal, Comfort Canal (S-25), S-25A, S-25B and upstream by S-336 and drainage from the Snapper Creek. Discharge computed from continuous velocity record obtained from acoustic velocity metering system and stage. Records of gage height prior to October 1960, are available in files of the U.S. Geological Survey.COOPERATION.--South Florida Water Management District.ANNUAL MEAN and ANNUAL RUNOFF (AC-FT) SUMMARY STATISTICS.--Figures represent 32 complete water years of discharge (1941, 42, 1960-83, 1985-88, 1990, 2001).EXTREME STAGES FOR OUTSIDE PERIOD OF RECORD.--Maximum stage known, 8.01 ft Oct. 12, 1947, present datum, from non-recording gage reading.EXTREME STAGES FOR PERIOD OF RECORD.--Maximum gage height, 7.90 ft Oct. 4, 2000; minimum, 1.08 ft May 31, 1962.EXTREME STAGES FOR CURRENT YEAR.--Maximum gage height, 7.90 ft Oct. 4; minimum, 2.34 ft Apr. 25.
SUMMARY STATISTICS FOR 2000 CALENDAR YEAR FOR 2001 WATER YEAR WATER YEARS 1940 - 2001 ANNUAL TOTAL 55480.69 ANNUAL MEAN 152 139 HIGHEST ANNUAL MEAN 288 1960 LOWEST ANNUAL MEAN 30.8 1990 HIGHEST DAILY MEAN 979 Oct 5 979 Oct 5 1120 Oct 16 1999 LOWEST DAILY MEAN 31 Jun 24 -8.2 Apr 26 -259 May 22 1991 ANNUAL SEVEN-DAY MINIMUM 35 Jun 20 2.3 Apr 26 -127 May 17 1991 ANNUAL RUNOFF (AC-FT) 110000 100600 10 PERCENT EXCEEDS 279 301 271 50 PERCENT EXCEEDS 157 139 123 90 PERCENT EXCEEDS 72 26 27 e Estimated
The period of record statistics were computed from complete water year's of record. See the annual mean and annual runoff (ac-ft) summary statistics section of the manuscript.
188 EVERGLADES AND SOUTHEASTERN COASTAL AREA
254315080331500 NORTHEAST SHARK RIVER SLOUGH NO. 2 NEAR COOPERTOWN, FL
LOCATION.--Lat 25°43'11", long 80°33'26", in NW 1⁄4 sec.4, T.54 S., Miami-Dade County, Hydrologic Unit 03090202, 2.7 mi south of Coopertown in Northeast Shark River Slough.DRAINAGE AREA.--Indeterminate.PERIOD OF RECORD.--October 1976 to September 1980, October 1982 to current year (gage heights only). Published as "Northeast Shark Valley Slough No. 2 near Coopertown" October 1976 to September 1977.GAGE.--Satellite data collection platform with water-stage shaft encoder. Datum of gage is National Geodetic Vertical Datum of 1929.REMARKS.--Land-surface datum is 5.40 ft above National Geodetic Vertical Datum of 1929. Water levels below land-surface datum are recorded. Estimated period of record minimum value of 3.41 ft on April 23, 1979, is suspect.EXTREME STAGES FOR PERIOD OF RECORD.--Maximum gage height, 8.51 ft Oct. 16, 1999; minimum, 3.41 ft estimated, Apr. 23, 1979.EXTREME STAGES FOR CURRENT YEAR.--Maximum gage height, 8.04 ft Oct. 6; minimum, indeterminate, well was dry Apr. 22 to early June.
254130080380500 NORTHEAST SHARK RIVER SLOUGH NO. 1 NEAR COOPERTOWN, FL
LOCATION.--Lat 25°41'30", long 80°38'05" in NW 1⁄4 sec.4, T.54 S., R.31 E., Miami-Dade County, Hydrologic Unit 03090202, 0.7 mi west of southeast corner of Blue Shanty Canal, 0.8 mi south of east-west section of Shanty Canal, and 4.7 mi southwest of Coopertown.DRAINAGE AREA.--Indeterminate.PERIOD OF RECORD.--October 1976 to September 1980, July 1982 to current year (gage heights only).REVISED RECORD.--WDR FL-79-2A:1977; WDR FL-96-2A:1995.GAGE.--Satellite data collection platform with water-stage shaft encoder and tipping bucket rain gage. Datum of gage is National Geodetic Vertical Datum of 1929.REMARKS.--Land-surface Datum is 5.88 ft above National Geodetic Vertical Datum of 1929. Rainfall data available in files of the U.S. Geological Survey. Water levels below land-surface datum are recorded. Prior to October 1977, published as "Northeast Shark Valley Slough No. 1 near Coopertown."EXTREME STAGES FOR PERIOD OF RECORD.--Maximum gage height, 8.54 ft Oct. 16, 1999; minimum, indeterminate, well was dry.EXTREME STAGES FOR CURRENT YEAR.--Maximum gage height, 8.00 ft Oct. 4; minimum, 4.76 ft May 22.
254100080402400 L-67 EXTENDED CANAL WEST NEAR FLORIDA CITY, FL
LOCATION.--Lat 25°41'00", long 80°40'24", between sec.24, T.55 S., R.36 E., and sec.6, T.55 S., R.37 E., between hiatus of unsurveyed area, Miami-Dade County, Hydrologic Unit 03090202, 5.8 mi south of U.S. Highway 41 on the Levee 67 extension and 11.8 mi west of Krome Avenue.DRAINAGE AREA.--Indeterminate.PERIOD OF RECORD.--October 1983 to present year (gage heights only).GAGE.--Electronic data logger. Datum of gage is National Geodetic Vertical Datum of 1929.REMARKS.--During the 1999 water year, due to a change in starting benchmarks, a -0.12 ft datum correction was applied to published records for the 1984 to 1996 water years. Revised daily mean values for 1984 - 1996 are available in the files of the Geological Survey.EXTREME STAGES FOR PERIOD OF RECORD.--Maximum gage height, 9.32 ft Oct. 16, 1999; minimum, 3.38 ft Apr. 8, 1990.EXTREME STAGES FOR CURRENT YEAR.--Maximum gage height, 8.06 ft Sept. 29; minimum, 4.92 ft May 22.
254100080402200 NORTHEAST SHARK RIVER SLOUGH EAST OF L 67 EXT. NEAR RICHMOND HEIGHTS, FL
LOCATION.--Lat 25°41'00", long 80°40'22", in NW 1⁄4 sec.6, T.55 S., R.37 E., Miami-Dade County, Hydrologic Unit 03090202, 5.8 mi south of U.S. Highway 41 on the Levee 67 extension and 11.8 mi west of Krome Avenue.DRAINAGE AREA.--Indeterminate.PERIOD OF RECORD.--January 1984 to current year (gage heights only).GAGE.--Electronic data logger. Datum of gage is National Geodetic Vertical Datum of 1929.REMARKS.--Due to a change in the starting benchmarks, a -0.12 ft datum correction was applied to the published records for the 1984 to 1996 water years. Revised daily mean values for 1984-1996 are available in the files of Geological Survey.EXTREME STAGES FOR PERIOD OF RECORD.--Maximum gage height, 8.85 ft Oct. 15, 1999; minimum, indeterminate, well was dry.EXTREME STAGES FOR CURRENT YEAR.--Maximum gage height, 7.86 ft Oct. 3-5; minimum, 5.33 ft May 21-23.
253828080391100 NORTHEAST SHARK RIVER SLOUGH NO. 4, NORTH OF GROSSMAN, FL
LOCATION.--Lat 25°38'24", long 80°39'10", in NW 1⁄4 sec.4, T.54 S., R. Government Lot 6 E., Miami-Dade County, Hydrologic Unit 03090202, approximately 2.0 mi northeast of the extreme southern end of the Levee 67 extension and 11.8 mi west of Krome Avenue.DRAINAGE AREA.--Indeterminate.PERIOD OF RECORD.--July 1985 to current year (gage heights only).REVISED RECORDS.--WDR FL-93-2A:1990-1992; WDR FL-95-2A:1994; WDR FL-96-2A:1993, 1986-1989 (extremes only).GAGE.--Satellite data collection platform with water-stage shaft encoder. Datum of gage is National Geodetic Vertical Datum of 1929.REMARKS.--Hurricane Andrew destroyed the gage and all reference marks in 1992. The station was rebuilt on February 19, 1993, and precise adjustments to the gage datum prior to 1993 based on Everglades National Park contractor surveys were not possible. The reader should use -0.40 to approximate this adjustment for water years prior to 1993. Land-surface datum is approximately 5.50 ft above National Geodetic Vertical Datum of 1929. Gage is capable of recording water levels below land-surface datum.EXTREME STAGES FOR PERIOD OF RECORD.--Maximum gage height, 8.41 ft Oct. 15, 1999; minimum, indeterminate, well was dry.EXTREME STAGES FOR CURRENT YEAR.--Maximum gage height, 7.87 ft Oct. 4; minimum, indeterminate, well was dry Apr. 22 - May 3, May 9-23.
253753080393600 NORTHEAST SHARK RIVER SLOUGH NO. 5, SOUTH OF GROSSMAN, FL
LOCATION.--Lat 25°37'55", long 80°39'42", in NW 1⁄4 sec.4, T.54 S., R. Government Lot 6 E., Miami-Dade County, Hydrologic Unit 03090202, approximately 0.3 mi northeast of the extreme southern end of the Levee 67 extension levee and 11.8 mi west of Krome Avenue.DRAINAGE AREA.--Indeterminate.PERIOD OF RECORD.--July 1985 to current year (gage heights only).REVISED RECORDS.--WDR FL-95-2A:1994.GAGE.--Satellite data collection platform with water-stage shaft encoder. Datum of gage is National Geodetic Vertical Datum of 1929.REMARKS.--Records for water years prior to 1993 were published with a datum of 0.48 ft lower. Levels were run during the 1995 water year. The gage datum was reset based on elevations provided by James Beadman and Associates, Inc.EXTREME STAGES FOR PERIOD OF RECORD.--Maximum gage height, 8.45 ft Oct. 15, 1999; minimum, indeterminate many days during 1989, 1990, 1991, 1992, 2001 water years when well went dry.EXTREME STAGES FOR CURRENT YEAR.--Maximum gage height, 7.77 ft Oct. 4; minimum, indeterminate, well was dry Apr. 20 to June 1.REVISIONS.-- Levels were run during the 2000 water year. A -0.07 ft correction was prorated from a zero correction in 1995 to a -0.07 ft correction in the 2000 water year. Data were revised for water years 1997-2000 and are available in the files of the U.S. Geological Survey.
02290710 BLACK CREEK CANAL AT S-21, NEAR GOULDS, FL
LOCATION.--Lat 25°32'34", long 80°19'52", in NE 1⁄4 sec.21, T.56 S., R.40 E., Dade County, Hydrologic Unit 03090202, in control house of salinity-control structure S-21, 0.5 mi upstream from mouth, and 3.5 mi east of Goulds.DRAINAGE AREA.--Indeterminate.PERIOD OF RECORD.--March 1957 to October 1969 (gage heights only), November 1969 to September 1977, October 1978 to current year.REVISED RECORDS.--WDR FL-89-2A:1988.GAGE.--Electronic data loggers for upstream and downstream stages and electronic data logger with shaft encoders for gate operation. Datum of gage is National Geodetic Vertical Datum of 1929 (Dade County bench mark). Prior to August 9, 1960, water-stage recorder at site 270 ft upstream in north lateral borrow canal, and April 9, 1960 to July 8, 1968, at site 810 ft upstream in north lateral borrow canal, all at same datum.REMARKS.--Records fair except for estimated daily discharges, which are poor. Flow is regulated by the operation of salinity-control structure S-21 and by some upstream pumpage for irrigation. Discharge computed from relation between head, discharges and gate-openings at structure S-21. Records of gage heights prior to October 1962, are available in files of the U.S. Geological Survey. Discharge occurring under submerged weir flow conditions is not computed and included as part of the total discharge after September 30, 1999.COOPERATION.--Supplementary gate-opening record and gage-height record provided by the South Florida Water Management District.ANNUAL MEAN and ANNUAL RUNOFF (AC-FT) SUMMARY STATISTICS.--Figures represent 21 complete water years of discharge (1971-77, 1979-90, 1995, 1998).EXTREME UPSTREAM STAGES FOR PERIOD OF RECORD.--Maximum gage height, 10.17 ft Aug. 24, 1992; minimum, -1.09 ft Aug. 24, 1992.EXTREME UPSTREAM STAGES FOR CURRENT YEAR.--Maximum gage height, 3.32 ft Jan. 31; minimum, -0.17 ft Sept. 14.EXTREME DOWNSTREAM STAGES FOR CURRENT YEAR.--Maximum gage height, 3.23 ft Oct. 13; minimum, -1.03 ft Jan. 21.REVISIONS.--The discharge for October 14-25, 1999 was revised because the rating used for the submerged weir conditions that existed during this period was determined to be inaccurate. The revised table supersedes the one published in the 2000 report.
SUMMARY STATISTICS FOR 1999 CALENDAR YEAR FOR 2000 WATER YEAR WATER YEARS 1970 - 2000 ANNUAL MEAN 164 HIGHEST ANNUAL MEAN 600 1995 LOWEST ANNUAL MEAN 33.0 1989 HIGHEST DAILY MEAN 1160 Sep 21 1010 Oct 1 2340 Aug 18 1981 LOWEST DAILY MEAN -273 Sep 22 .00 Nov 16 -384 Jan 23 1983 ANNUAL SEVEN-DAY MINIMUM .00 Mar 19 .00 Mar 28 -94 Oct 23 1998 ANNUAL RUNOFF (AC-FT) 118600 10 PERCENT EXCEEDS 770 620 476 50 PERCENT EXCEEDS 152 104 85 90 PERCENT EXCEEDS .00 .00 .00
REVISED
195 EVERGLADES AND SOUTHEASTERN COASTAL AREA
02290710 BLACK CREEK CANAL AT S-21, NEAR GOULDS, FL
SUMMARY STATISTICS FOR 2000 CALENDAR YEAR FOR 2001 WATER YEAR WATER YEARS 1970 - 2001 ANNUAL MEAN 164 HIGHEST ANNUAL MEAN 600 1995 LOWEST ANNUAL MEAN 33.0 1989 HIGHEST DAILY MEAN 958 Aug 8 980 Aug 6 2340 Aug 18 1981 LOWEST DAILY MEAN .00 Jan 3 .00 Nov 12 -384 Jan 23 1983 ANNUAL SEVEN-DAY MINIMUM .00 Mar 28 .00 Nov 22 -94 Oct 23 1998 ANNUAL RUNOFF (AC-FT) 118600 10 PERCENT EXCEEDS 384 592 483 50 PERCENT EXCEEDS 104 91 85 90 PERCENT EXCEEDS .00 .00 .00
The period of record statistics were computed from complete water year's of record. See the annual mean and annual runoff (ac-ft) summary statistics section of the manuscript.
198 EVERGLADES AND SOUTHEASTERN COASTAL AREA
022907647 LEVEE 31 NORTH EXTENSION AT 1 MILE NEAR WEST MIAMI, FL
LOCATION.--Lat 25°44'53", long 80°29'53", in SE 1⁄4 sec. 35, T.54 S., R.38 E., Miami-Dade County, Hydrologic Unit 03090202, (South Miami NW quadrangle), 0.5 mi west of intersection of U.S. Highway 41 and Krome Avenue, and 1.0 mi south of U.S. Highway 41 on the west side of Levee 31 North.DRAINAGE AREA.--Indeterminate.PERIOD OF RECORD.--November 1989 to November 1990, (gage heights only). February 1992 to current year.GAGE.--Satellite data collection platform with water-stage shaft encoder and acoustic velocity meter. Datum of gage is 0.10 ft below National Geodetic Vertical Datum of 1929 (FCE bench mark).REMARKS.--Records poor. Flow is the sum of regulation from upstream control structures S-334, S-335, and S-336 and from levee seepage and rainfall. Positive flow is to the south and may reverse for short periods. Datum of gage is based upon an adjustment to the RM elevation. To convert gage height values to NGVD, a 0.10 ft correction must be applied.ANNUAL MEAN and ANNUAL RUNOFF (AC-FT) SUMMARY STATISTICS.--Figures represent 5 complete water years of discharge (1997-2001).EXTREME STAGES FOR PERIOD OF RECORD.--Maximum gage height, 8.17 ft Oct. 15, 1999; minimum, 2.33 ft May 23, 1990.EXTREME STAGES FOR CURRENT YEAR.--Maximum gage height, 7.78 ft Oct. 4; minimum, 3.49 ft May 23.
SUMMARY STATISTICS FOR 2000 CALENDAR YEAR FOR 2001 WATER YEAR WATER YEARS 1998 - 2001 ANNUAL TOTAL 146496 84391.57 ANNUAL MEAN 400 231 330 HIGHEST ANNUAL MEAN 439 2000 LOWEST ANNUAL MEAN 231 2001 HIGHEST DAILY MEAN 1090 Jan 16 663 Oct 17 1090 Jan 16 2000 LOWEST DAILY MEAN -112 Oct 4 -112 Oct 4 -112 Oct 4 2000 ANNUAL SEVEN-DAY MINIMUM 34 Oct 3 -4.7 Jun 6 -4.7 Jun 6 2001 ANNUAL RUNOFF (AC-FT) 290600 167400 239200 10 PERCENT EXCEEDS 785 396 634 50 PERCENT EXCEEDS 368 244 268 90 PERCENT EXCEEDS 149 16 135 e Estimated
The period of record statistics were computed from complete water year's of record. See the annual mean and annual runoff (ac-ft) summary statitics section of the manuscript.
200 EVERGLADES AND SOUTHEASTERN COASTAL AREA
02290765 LEVEE 31 NORTH EXTENSION AT 3 MILE NEAR WEST MIAMI, FL
LOCATION.--Lat 25°43'02", long 80°29'50", in SE 1⁄4 sec.35, T.54 S., R.38 E., Miami-Dade County, Hydrologic Unit 03090202, (South Miami NW quadrangle), 0.5 mi west of intersection of U.S. Highway 41 and Krome Avenue, and 3 mi south of U.S. Highway 41 on the west side of Levee 31 North.DRAINAGE AREA.--Indeterminate.PERIOD OF RECORD.--March 1992 to current year.REVISED RECORDS.--WDR 97-2A:1992-96.GAGE.--Satellite data collection platform with water-stage shaft encoder and acoustic velocity meter. Datum of gage is 0.10 ft below National Geodetic Vertical Datum of 1929 (FCE bench mark). (Corrected).REMARKS.--Records poor. Flow is the sum of regulation from upstream control structures S-334, S-335, and S-336 and from levee seepage and rainfall. Positive flow is to the south and may reverse for short periods. Datum of gage is based upon an adjustment to the RM elevation. To convert stage values to NGVD, a +0.10 ft correction must be applied. Negative discharge is considered estimated due to insufficient measurements to verify negative portion of the rating.ANNUAL MEAN and ANNUAL RUNOFF (AC-FT) SUMMARY STATISTICS.--Figures represent 9 complete water years of discharge (1993-2001).EXTREME STAGES FOR PERIOD OF RECORD.--Maximum gage height, 8.19 ft Oct. 15, 1999; minimum, 3.48 ft May 23, 2001.EXTREME STAGES FOR CURRENT YEAR.--Maximum gage height, 7.78 ft Oct. 4; minimum, 3.48 ft May 23.
SUMMARY STATISTICS FOR 2000 CALENDAR YEAR FOR 2001 WATER YEAR WATER YEARS 1992 - 2001 ANNUAL TOTAL 157236.8 91601.40 ANNUAL MEAN 430 251 358 HIGHEST ANNUAL MEAN 467 2000 LOWEST ANNUAL MEAN 251 2001 HIGHEST DAILY MEAN 1090 Jan 18 841 Oct 17 1100 Apr 20 1998 LOWEST DAILY MEAN -218 Oct 4 -218 Oct 4 -218 Oct 4 2000 ANNUAL SEVEN-DAY MINIMUM 52 Oct 3 -69 Jul 10 -69 Jul 10 2001 ANNUAL RUNOFF (AC-FT) 311900 181700 259100 10 PERCENT EXCEEDS 824 471 545 50 PERCENT EXCEEDS 372 254 338 90 PERCENT EXCEEDS 199 -20 187 e Estimated
The period of record statistics were computed from complete water year's of record. See the annual mean and annual runoff (ac-ft) summary statistics section of the manuscript.
202 EVERGLADES AND SOUTHEASTERN COASTAL AREA
02290766 LEVEE 31 NORTH EXTENSION AT 4 MILE NEAR WEST MIAMI, FL
LOCATION.--Lat 25°42'06", long 80°29'46", in NE 1⁄4 NE 1⁄4 NE
1⁄4 sec.35, T.54 S., R. 38 E., Miami-Dade County, Hydrologic Unit 03090202, 0.5 mi west of the junction of U.S. Highway 41 and Krome Avenue and 4.1 mi south of U.S. Highway 41 on west side of Levee 31 North, near West Miami, FL.DRAINAGE AREA.--Indeterminate.PERIOD OF RECORD.--June 1994 to current year.GAGE.--Satellite data collection platform with water-stage shaft encoder and acoustic velocity meter. Datum of gage is National Geodetic Vertical Datum of 1929 (FCE bench mark).REMARKS.--Records poor. Flow is the sum of regulation from upstream control structure S-335 and S-336 and from levee seepage and rainfall. Positive flow is to the south and may reverse for short periods.ANNUAL MEAN and ANNUAL RUNOFF (AC-FT) SUMMARY STATISTICS.--Figures represent 6 complete water years of discharge (1995, 1997-2001).EXTREME STAGES FOR PERIOD OF RECORD.--Maximum gage height, 8.32 ft Oct. 15, 1999; minimum, 3.53 ft May 23, 2001.EXTREME STAGES FOR CURRENT YEAR.--Maximum gage height, 7.81 ft Oct. 4; minimum, 3.53 ft May 23.
SUMMARY STATISTICS FOR 2000 CALENDAR YEAR FOR 2001 WATER YEAR WATER YEARS 1994 - 2001 ANNUAL TOTAL 174295 98898.5 ANNUAL MEAN 476 271 385 HIGHEST ANNUAL MEAN 526 2000 LOWEST ANNUAL MEAN 271 2001 HIGHEST DAILY MEAN 1210 Jan 16 846 Oct 17 1210 Jan 16 2000 LOWEST DAILY MEAN -211 Oct 4 -211 Oct 4 -300 Jun 10 1997 ANNUAL SEVEN-DAY MINIMUM 102 Oct 3 -16 May 29 -16 May 29 2001 ANNUAL RUNOFF (AC-FT) 345700 196200 278700 10 PERCENT EXCEEDS 922 463 620 50 PERCENT EXCEEDS 418 277 339 90 PERCENT EXCEEDS 206 16 161 e Estimated
The period of record statistics were computed from complete water year's of record. See the annual mean and annual runoff (ac-ft) summary statistics section of the manuscript.
204 EVERGLADES AND SOUTHEASTERN COASTAL AREA
02290767 LEVEE 31 NORTH EXTENSION AT 5 MILE NEAR WEST MIAMI, FL
LOCATION.--Lat 25°41'09", long 80°29'50", T.54 S., R.38 E., Dade County, Hydrologic Unit 03090202, (South Miami NW quadrangle), 1.05 mi west of the junction of U.S. Highway 41 and Krome Avenue, and 5.25 mi south of U.S. Highway 41 on west side of Levee 31 North, near West Miami, FL.DRAINAGE AREA.--Indeterminate.PERIOD OF RECORD.--June 16, 1994 to current year.GAGE.--Satellite data collection platform with water-stage shaft encoder and acoustic velocity meter. Datum of gage is National Geodetic Vertical Datum of 1929 (FCE bench mark).REMARKS.--Records fair except for estimated daily discharges, which are poor. Flow is the sum of regulation from upstream control structures S-334, S-335 and S-336 and from levee seepage and rainfall. Positive flow is to the south and may reverse for short periods.ANNUAL MEAN and ANNUAL RUNOFF (AC-FT) SUMMARY STATISTICS.--Figures represent 6 water years of discharge (1995, 1997-2001).EXTREME STAGES FOR PERIOD OF RECORD.--Maximum gage height, 8.27 ft Oct. 15, 1999; minimum, 3.48 ft May 23, 2001.EXTREME STAGES FOR CURRENT YEAR.--Maximum gage height, 7.64 ft Oct. 4; minimum, 3.48 ft May 23.
SUMMARY STATISTICS FOR 2000 CALENDAR YEAR FOR 2001 WATER YEAR WATER YEARS 1994 - 2001 ANNUAL TOTAL 201340.47 112040.07 ANNUAL MEAN 550 307 405 HIGHEST ANNUAL MEAN 605 2000 LOWEST ANNUAL MEAN 280 1997 HIGHEST DAILY MEAN 1300 Jan 17 1010 Oct 17 1300 Jan 17 2000 LOWEST DAILY MEAN -121 Oct 4 -123 May 30 -285 Jun 10 1997 ANNUAL SEVEN-DAY MINIMUM 179 Dec 22 -68 Jun 6 -68 Jun 6 2001 ANNUAL RUNOFF (AC-FT) 399400 222200 293100 10 PERCENT EXCEEDS 1000 525 648 50 PERCENT EXCEEDS 498 316 345 90 PERCENT EXCEEDS 274 -8.6 145 e Estimated
The period of record statistics were computed from complete water year's of record. See the annual mean and annual runoff (ac-ft) summary statistics section of the manuscript.
206 EVERGLADES AND SOUTHEASTERN COASTAL AREA
02290768 LEVEE 31 NORTH EXTENSION AT 7 MILE NEAR WEST MIAMI, FL
LOCATION.--Lat 25°39'48", long 80°29'54", (corrected) NE 1⁄4 NE 1⁄4 SE
1⁄4 sec.11, T.55 S., R.38 E., Miami-Dade County, Hydrologic Unit 03090202, (South Miami NW quadrangle), 0.5 mi west of junction of U.S. Highway 41 and Krome Avenue and 6.9 mi south of U.S. Highway 41 on the west side of Levee 31 North Levee, near West Miami, FL.DRAINAGE AREA.--Indeterminate.PERIOD OF RECORD.--June 1994 to current year.GAGE.--Satellite data collection platform with water-stage shaft encoder and acoustic velocity meter. Datum of gage is National Geodetic Vertical Datum of 1929 (FCE bench mark).REMARKS.--Records fair except for estimated daily discharge, which are poor. Flow is the sum of regulation from upstream control structures S-334, S-335 and S-336 and from levee seepage and rainfall. Positive flow is to the south and may reverse for short periods.ANNUAL MEAN and ANNUAL RUNOFF (AC-FT) SUMMARY STATISTICS.--Figures represent 5 complete water years of discharge (1995, 1997-98, 2000-01).EXTREME STAGES FOR PERIOD OF RECORD.--Maximum gage height, 8.19 ft Oct. 15, 1999; minimum, 3.46 ft May 23, 2001.EXTREME STAGES FOR CURRENT YEAR.--Maximum gage height, 7.67 ft Oct. 4; minimum, 3.46 ft May 23.
SUMMARY STATISTICS FOR 2000 CALENDAR YEAR FOR 2001 WATER YEAR WATER YEARS 2000 - 2001 ANNUAL TOTAL 182489 105120.04 ANNUAL MEAN 499 288 426 HIGHEST ANNUAL MEAN 564 2000 LOWEST ANNUAL MEAN 288 2001 HIGHEST DAILY MEAN 1220 Jan 16 1010 Oct 17 1220 Jan 16 2000 LOWEST DAILY MEAN -184 Oct 4 -184 Oct 4 -184 Oct 4 2000 ANNUAL SEVEN-DAY MINIMUM 116 Dec 22 18 Jun 20 18 Jun 20 2001 ANNUAL RUNOFF (AC-FT) 362000 208500 308800 10 PERCENT EXCEEDS 948 503 847 50 PERCENT EXCEEDS 434 263 402 90 PERCENT EXCEEDS 243 38 111 e Estimated
The period of record statistics were computed from complete water year's of record. See the annual mean and annual runoff (ac-ft) summary statistics section of the manuscript.
208 EVERGLADES AND SOUTHEASTERN COASTAL AREA
02290769 CANAL 111 AT S-18-C, NEAR FLORIDA CITY, FL
LOCATION.--Lat 25°19'49", long 80°31'31", in NW 1⁄4 sec.3, T.59 S., R.38 E., Miami-Dade County, Hydrologic Unit 03090202, at control structure 18-C, and 8.5 mi south of Florida City.DRAINAGE AREA.--Indeterminate.PERIOD OF RECORD.--October 1968 to current year.REVISED RECORD.--WDR FL-78-2A:1974-77.GAGE.--Satellite data collection platform with water-stage shaft encoder and acoustic velocity meter until September 30, 2001. Satellite data collection platform with water-stage shaft encoder and acoustic doppler velocity meter installed May 24, 2001. The acoustic velocity meter and acoustic doppler velocity meter were run in tandem for the period of May 24, 2001 to October 17, 2001. Datum of gage is National Geodetic Vertical Datum of 1929 (U.S. Army Corps of Engineers bench mark).REMARKS.--Records good except for estimated daily discharges, which are poor. Flow regulated by S-18-C. Prior to November 30, 1992, discharge computed from relation between head, and gate openings at S-18-C. After December 1, 1992, discharge computed based on continuous record of stage and velocity at newly established acoustic velocity meter site downstream of S-18-C. Prior to the 1993 water year the downstream gage height is available in files of the U.S. Geological Survey under station number 02290770. Starting with the 1993 water year, the downstream gage height is available in files of the U.S. Geological Survey under station number 02290769. Prior to 1994 water year discharge published under the name Canal 111 Above S-18-C under the same station number (02290769). Prior to December 1, 1992, digital water-stage recorders, electromagnetic velocity meter recorder, and dual graphic water-stage and gate opening recorder.ANNUAL MEAN and ANNUAL RUNOFF (AC-FT) SUMMARY STATISTICS.--Figures represent 28 complete water years of discharge (1969-90, 1993-2000).COOPERATION.--Gate-opening recorder record and record of slot operations provided by South Florida Water Management District, upon request.EXTREME UPSTREAM STAGES FOR PERIOD OF RECORD (1969-92).--Maximum gage height, 3.62 ft July 24, 1985; minimum, -1.53 ft estimated May 14, 1971.EXTREME DOWNSTREAM STAGES FOR PERIOD OF RECORD (1993-current year).--Maximum gage height, 3.82 ft Oct. 15, 1999; minimum, 0.50 ft Apr. 25, 26, 2001.EXTREME DOWNSTREAM STAGES FOR CURRENT YEAR.--Maximum gage height, 2.89 ft Sept. 29; minimum, 0.50 ft Apr. 25, 26.
SUMMARY STATISTICS FOR 2000 CALENDAR YEAR FOR 2001 WATER YEAR WATER YEARS 1969 - 2001 ANNUAL TOTAL 94317.41 ANNUAL MEAN 258 167 HIGHEST ANNUAL MEAN 485 1983 LOWEST ANNUAL MEAN 4.42 1974 HIGHEST DAILY MEAN 2060 Oct 4 2060 Oct 4 2940 Aug 16 1988 LOWEST DAILY MEAN -85 May 17 -51 May 1 -194 Jan 2 1988 ANNUAL SEVEN-DAY MINIMUM -25 Dec 3 -30 Apr 27 -92 Dec 29 1987 ANNUAL RUNOFF (AC-FT) 187100 120800 10 PERCENT EXCEEDS 602 540 624 50 PERCENT EXCEEDS 183 27 5.8 90 PERCENT EXCEEDS -.11 -22 .00 e Estimated
The period of record statistics were computed from complete water year's of record. See the annual mean and annual runoff (ac-ft) summary statistics section of the manuscript.
210 EVERGLADES AND SOUTHEASTERN COASTAL AREA
251716080342100 EVERGLADES 5A IN C-111 BASIN NEAR HOMESTEAD, FL
LOCATION.--Lat 25°17'10", long 80°34'22", in SW 1⁄4 sec.18, T.59 S., R.38 E., Miami-Dade County, Hydrologic Unit 03090202, in C-111 drainage basin, 2.5 mi south of Levee 31 canal and 7 mi west of U.S. Highway 1, 12.5 mi southwest of Florida City.DRAINAGE AREA.--Indeterminate.PERIOD OF RECORD.--October 1985 to current year.GAGE.--Electronic data logger. Datum of gage is National Geodetic Vertical Datum of 1929.REMARKS.--Land surface datum is 1.10 ft above National Geodetic Vertical Datum of 1929. Data prior to 1993 water year are unpublished and in files of the U.S. Geological Survey. Unit values prior to 1993 water year were not available for review to determine instantaneous maximum and minimum gage height. Water levels below Land surface datum are recorded.EXTREME STAGES FOR PERIOD OF RECORD.--Maximum mean daily gage height, 3.06 ft Oct. 16, 1999; minimum, -0.77 ft May 21, 1990.EXTREME STAGES FOR CURRENT YEAR.--Maximum mean daily gage height, 2.10 ft Sept. 14; minimum, -0.56 ft Apr. 14.
251724080341400 EVERGLADES 5B IN C-111 BASIN NEAR HOMESTEAD, FL
LOCATION.--Lat 25°17'14", long 80°34'08", in SW 1⁄4 sec.18, T.59 S., R.38 E., Miami-Dade County, Hydrologic Unit 03090202, in C-111 drainage basin, 2.5 mi south of Levee 31 canal and 7 mi west of U.S. Highway 1, 12.5 mi southwest of Florida City.DRAINAGE AREA.--Indeterminate.PERIOD OF RECORD.--October 1985 to current year.GAGE.--Electronic data logger. Datum of gage is National Geodetic Vertical Datum of 1929 (U.S. Army Corps of Engineers bench mark).REMARKS.--Land-surface datum is 1.10 ft above National Geodetic Vertical Datum of 1929. Water levels below land-surface datum are recorded. Data prior to 1993 water year are unpublished and in the files of the U.S. Geological Survey. Unit values data prior to 1993 water year was not available to determine instantaneous maximum and minimum gage height.EXTREME STAGES FOR PERIOD OF RECORD.--Maximum mean daily gage height, 3.10 ft Oct. 16, 1999; minimum, indeterminate.EXTREME STAGES FOR CURRENT YEAR.--Maximum mean daily gage height, 2.14 ft Oct. 4; minimum, indeterminate, well was dry for many days.
251855080283400 EVERGLADES 2B IN C-111 BASIN NEAR HOMESTEAD, FL
LOCATION.--Lat 25°18'43", long 80°28'37", in NW 1⁄4 sec.7, T.59 S., R.39 E., Miami-Dade County, Hydrologic Unit 03090202, in C-111 drainage basin between C-109 and C-110 Canals, 1.6 mi west of U.S. Highway 1 and 1.15 mi north of C-111 Canal, 8.9 mi south of Florida City.DRAINAGE AREA.--Indeterminate.PERIOD OF RECORD.--October 1985 to current year, (discontinued).GAGE.--Electronic data logger. Datum of gage is National Geodetic Vertical Datum of 1929 (U.S. Army Corps of Engineers bench mark).REMARKS.--Land-surface datum is approximately 1.20 ft above mean sea level, National Geodetic Vertical Datum of 1929. Data prior to 1993 water year are unpublished and in files of the U.S. Geological Survey. Unit values data prior to 1993 water year was not available to determine instantaneous maximum and minimum gage height.EXTREME STAGES FOR PERIOD OF RECORD.--Maximum mean daily gage height, 3.63 ft Oct. 15, 1999 (estimated); minimum, indeterminate.EXTREME STAGES FOR CURRENT YEAR.--Maximum mean daily gage height, 2.87 ft Oct. 3 (estimated); minimum, indeterminate, well was dry for many days.
251906080283400 EVERGLADES 2A IN C-111 BASIN NEAR HOMESTEAD, FL
LOCATION.--Lat 25°18'57", long 80°28'41", in sec.7, T.59 S., R.39 E., Miami-Dade County, Hydrologic Unit 03090202, in C-111 basin between C-109 and C-110 Canals, 1.6 mi west of U.S. Highway 1 and 1.5 mi north of C-111 Canal, approximately 8.5 mi south of Florida City.DRAINAGE AREA.--Indeterminate.PERIOD OF RECORD.--September 25, 1985 to current year.GAGE.--Electronic data logger. Datum of gage is National Geodetic Vertical Datum of 1929REMARKS.--Unit values prior to 1993 water year were not available to determine instantaneous maximum and minimum gage height. Land-surface datum is 1.2 ft above National Geodetic Vertical Datum of 1929. Water levels below land-surface datum are recorded. Gage height records prior to October 1992, are available in the files of the U.S. Geological Survey.EXTREME STAGES FOR PERIOD OF RECORD.--Maximum mean daily gage height, 3.60 ft Oct. 15, 1999, (estimated); minimum, 0.28 ft May 22, 1990.EXTREME STAGES FOR CURRENT YEAR.--Maximum mean daily gage height, 2.88 ft Oct. 3, 4; minimum, 0.49 ft Apr. 26.REVISIONS.--Water year 2000 was revised. Revised data is available in the files of the U.S. Geological Survey.
251946080254800 EVERGLADES 1 IN C-111 BASIN NEAR HOMESTEAD, FL
LOCATION.--Lat 25°19'50", long 80°26'06", in NE 1⁄4 sec.4, T.59 S., R.39 E., Dade County, Hydrologic Unit 03090202, approximately 1 mi east of U.S. Highway 1, 1.3 mi west-southwest of Levee 31-E, east of S-18-C, southeast of Florida City.DRAINAGE AREA.--Indeterminate.PERIOD OF RECORD.--April 1985 to current year.GAGE.--Electronic data logger. Datum of gage is National Geodetic Vertical Datum of 1929 (U.S. Army Corps of Engineers bench mark).REMARKS.--Land-surface datum is 1.10 ft above National Geodetic Vertical Datum of 1929. Data prior to 1993 water year are available in files of the U.S. Geological Survey. Unit values prior to 1993 water year were not available for review to determine maximum and minimum instantaneous gage height. Water levels below land-surface datum are recorded.EXTREME STAGES FOR PERIOD OF RECORD.--Maximum mean daily gage height, 3.26 ft Nov. 15, 1994; minimum, 0.31 ft May 22, 1990.EXTREME STAGES FOR CURRENT YEAR.--Maximum mean daily gage height, 2.41 ft Oct. 13, 14; minimum, 0.49 ft Apr. 25, 26.
252036080324300 EVERGLADES 4 IN C-111 BASIN NEAR HOMESTEAD, FL
LOCATION.--Lat 25°20'19", long 80°32'47", in sec.30, T.58 S., R.38 E., Miami-Dade County, Hydrologic Unit 03090202, approximately 1.3 mi northwest of S-18-C and approximately 1.8 mi east of Aerojet Road.DRAINAGE AREA.--Indeterminate.PERIOD OF RECORD.--October 1985 to current year.GAGE.--Satellite data collection platform with water-stage shaft encoder. Datum of gage is National Geodetic Vertical Datum of 1929.REMARKS.--Land-surface datum is 2.40 ft above National Geodetic Vertical Datum of 1929. Gage is capable of recording water levels below land-surface datum. Unpublished data prior to 1993 water year are available in the files of the U.S. Geological Survey. Unit value data prior to 1993 water year were not available for review to determine instantaneous maximum and minimum gage height.EXTREME STAGES FOR PERIOD OF RECORD.--Maximum mean daily gage height, 3.58 ft Oct. 16, 1999; minimum, 0.44 ft Apr. 26, 2001, estimated.EXTREME STAGES FOR CURRENT YEAR.--Maximum mean daily gage height, 2.82 ft Oct. 4, Sept. 29; minimum, 0.44 ft Apr. 26, estimated.
252043080302400 EVERGLADES 3 IN C-111 BASIN NEAR HOMESTEAD, FL
LOCATION.--Lat 25°20'53", long 80°30'28", in sec.23, T.58 S., R.38 E., Miami-Dade County, Hydrologic Unit 03090202, approximately 1.5 mi north-northeast of S-18-C and approximately 3.2 mi west of U.S. Highway 1 southwest of Florida City.DRAINAGE AREA.--Indeterminate.PERIOD OF RECORD.--October 1985 to current year.REVISED RECORDS.--WDR FL-96-2A:1994, 1995.GAGE.--Electronic data logger. Datum of gage is National Geodetic Vertical Datum of 1929.REMARKS.--Land-surface datum is 1.67 ft above National Geodetic Vertical Datum of 1929. Data prior to 1993 water year are unpublished and in files of the U.S. Geological Survey.EXTREME STAGES FOR PERIOD OF RECORD.--Maximum mean daily gage height, 3.76 ft Oct. 16, 1999; minimum, 0.40 ft May 17, 1991.EXTREME STAGES FOR CURRENT YEAR.--Maximum mean daily gage height, 3.12 ft Oct. 4; minimum 0.69 ft Apr. 25.
Figure 9. Location of gaging stations in the Big Cypress Swamp and southwestern coastal area,
the Caloosahatchee River, Lake Trafford, Charlotte Harbor and the coastal area.
82°
82°
81°
81°
26° 26°
27° 27°
75
75
41
41
41
84
29
29
29
78
80
82
LEE
La Belle
Ca l
oos
hee
Naples
Marco
Sunniland
Carnestown
Cape
ahat
c
FortMyers HENDRY
Felda
COLLIER
Coral
LakeTrafford
02293345
0229334602293347
02293288
02292780
264437081550100
02291597
0228880002288900
02292900
02291000
02292000
02292480
02291500
02291524
02291580
02293343
02293214
02293240
02293246
02293241
02291200
02291673
02288800
EXPLANATION
STREAM GAGING STATION
02291669
02293230
264139082022100
218 BIG CYPRESS SWAMP AND SOUTHWESTERN COASTAL AREA
02291000 BARRON RIVER CANAL NEAR EVERGLADES, FL
LOCATION.--Lat 25°57'28", long 81°21'19", in NW 1⁄4 sec.7, T.52 S., R.30 E., Collier County, Hydrologic Unit 03090204, on right bank 40 ft upstream from control structure No. 6, 0.7 mi north of Copeland, 7 mi north of town of Everglades City, and 7.5 mi upstream from mouth.DRAINAGE AREA.--Indeterminate.PERIOD OF RECORD.--July to December 1951 (discharge measurements only), January 1952 to current year.GAGE.--Electronic data logger. Datum of gage is National Geodetic Vertical Datum of 1929 (State Department of Transportation bench mark). Prior to January 24, 1952, non-recording gage.REMARKS.--No estimated daily discharges. Records poor. Flow regulated by operation of control structure at, above, and below station. Overbank flow not included in discharge figures. Records prior to January 1952 are available in files of the U.S. Geological Survey.ANNUAL MEAN and ANNUAL SUMMARY STATISTICS.--Figures represent 46 complete years of discharge (1952-87, 1989-94, 1996, 1998-2001).EXTREME STAGE FOR PERIOD OF RECORD.--Maximum gage height, 7.07 ft Aug. 26, 1995; minimum, 0.21 ft May 18, 1962 and May 18, 1972.EXTREMES FOR STAGES FOR CURRENT YEAR.--Maximum gage height, 6.20 ft Sept. 14, 15; minimum, 0.55 ft June 13, 14.
SUMMARY STATISTICS FOR 2000 CALENDAR YEAR FOR 2001 WATER YEAR WATER YEARS 1952 - 2001 ANNUAL TOTAL 15115.1 17556.09 ANNUAL MEAN 41.3 48.1 90.5 HIGHEST ANNUAL MEAN 189 1958 LOWEST ANNUAL MEAN 3.52 1989 HIGHEST DAILY MEAN 120 Sep 9 156 Sep 14 292 Sep 25 1962 LOWEST DAILY MEAN 3.0 Jun 20 .15 Jun 13 .00 May 17 1952 ANNUAL SEVEN-DAY MINIMUM 3.2 Jun 15 .26 Jun 9 .00 May 17 1975 MAXIMUM PEAK FLOW 292 Sep 25 1962 MAXIMUM PEAK STAGE 6.57 Sep 4 1983 ANNUAL RUNOFF (AC-FT) 29980 34820 65540 10 PERCENT EXCEEDS 100 115 195 50 PERCENT EXCEEDS 36 33 77 90 PERCENT EXCEEDS 4.3 1.6 6.6
The period of record statistics were computed from complete water year's of record. See the annual mean and annual runoff (ac-ft) summary statistics section of the manuscript.
220 BIG CYPRESS SWAMP AND SOUTHWESTERN COASTAL AREA
02291200 LAKE TRAFFORD NEAR IMMOKALEE, FL
LOCATION.--Lat 26°26'08", long 81°29'25", in NW 1⁄4 sec.35, T.46 S., R.28 E., Collier County, Hydrologic Unit 03090204, at county boat ramp dock, on north side of lake and 4.2 mi west of Immokalee.SURFACE AREA.--1,485 acres.DRAINAGE AREA.--27 mi2, approximately.PERIOD OF RECORD.--March 1941 to current year. Records of elevations prior to October 1960 are available in files of the U.S. Geological Survey.GAGE.--Electronic data logger. Datum of gage is National Geodetic Vertical Datum of 1929. Prior to October 6, 1960, gage was located at sites in the immediate vicinity at same datum. May 15, 1962, to September 30, 1962, auxiliary non-recording gage in canal at county boat landing, 0.3 mi southeast. October 1, 1962, to November 25, 1968, non-recording gage at same site and datum. Gage relocated March 30, 1988, because of excessive aquatic growth in ditch causing erroneous record at low stage.REMARKS.--Lake is landlocked except above an elevation of about 21 ft, when there is overflow to the south into Corkscrew Swamp.EXTREME STAGES FOR PERIOD OF RECORD.--Maximum elevation, 22.79 ft Sept. 23, 1947; minimum, 15.90 ft estimated, June 6-10, 1962.EXTREME STAGES FOR CURRENT YEAR.--Maximum elevation, 21.69 ft Sept. 30; minimum, 17.74 ft June 4, 5, 13-15, 26, 27.
221 BIG CYPRESS SWAMP AND SOUTHWESTERN COASTAL AREA
02291500 IMPERIAL RIVER NEAR BONITA SPRINGS, FL
LOCATION.--Lat 26°20'07", long 81°44'59", in SW 1⁄4 sec.31, T.47 S., R.26 E., Lee County, Hydrologic Unit 03090204, on left bank, 4 ft downstream of bridge on Orr Road, 0.3 mi north of Bonita Beach Road, 2.0 mi east of U.S. Highway 41 at Bonita Springs, and 7.4 mi upstream from mouth.DRAINAGE AREA.--Indeterminate.PERIOD OF RECORD.--May 1940 to November 1954, February 1987 to current year.GAGE.--Satellite data collection platform with a water-stage shaft encoder. Datum of gage is National Geodetic Vertical Datum of 1929. May 1940 to November 1954, water-stage recorder at wooden control on right bank, 1.5 mi east of Bonita Springs (lat 26°20'05", long 81°45'20"). Prior to September 10, 1941, staff gage at same site and datum.REMARKS.--Records good. No estimated daily discharges.ANNUAL MEAN and ANNUAL RUNOFF (AC-FT) SUMMARY STATISTICS.--Figures represent 28 complete water years of discharge (1941-54, 1988-2001).
SUMMARY STATISTICS FOR 2000 CALENDAR YEAR FOR 2001 WATER YEAR WATER YEARS 1940 - 2001 ANNUAL TOTAL 20370.6 36801.0 ANNUAL MEAN 55.7 101 99.7 HIGHEST ANNUAL MEAN 273 1995 LOWEST ANNUAL MEAN 24.1 1990 HIGHEST DAILY MEAN 460 Sep 29 738 Sep 16 2890 Sep 12 1940 LOWEST DAILY MEAN 6.8 Jun 18 4.8 May 18 .00 Jun 28 1940 ANNUAL SEVEN-DAY MINIMUM 7.0 Jun 13 5.3 Apr 23 .07 Jun 27 1940 MAXIMUM PEAK FLOW 750 Sep 30 2890 Sep 12 1940 MAXIMUM PEAK STAGE 11.32 Sep 30 13.68 Oct 15 1995 INSTANTANEOUS LOW FLOW 4.5 May 18 .00 Jun 28 1940 ANNUAL RUNOFF (AC-FT) 40410 72990 72250 10 PERCENT EXCEEDS 172 397 288 50 PERCENT EXCEEDS 17 14 22 90 PERCENT EXCEEDS 7.9 6.3 1.2
The period of record statistics were computed from complete water year's of record. See the annual mean and annual runoff (ac-ft) summary statistics section of the manuscript.
223 BIG CYPRESS SWAMP AND SOUTHWESTERN COASTAL AREA
02291524 SPRING CREEK HEADWATER NEAR BONITA SPRINGS, FL
LOCATION.--Lat 26°21'42", long 81°47'27", in SE 1⁄4 sec.22, T.47 S., R.25 E., Lee County, Hydrologic Unit 03090204, at culvert on State Road 887 (old U.S. Highway 41), 1.8 mi north of Bonita Springs, 4.7 mi upstream from mouth and 5.6 mi south of Estero.DRAINAGE AREA.--Indeterminate.PERIOD OF RECORD.--November 1987 to current year.GAGE.--Satellite data collection platform with water-stage shaft encoder. Datum of gage is National Geodetic Vertical Datum of 1929 (Florida State Road Department Bench Mark).REMARKS.--No estimated daily discharges. Records are good.ANNUAL MEAN and ANNUAL RUNOFF (AC-FT) SUMMARY STATISTICS.--Figures represent 13 complete water years of discharge (1989-2001).
SUMMARY STATISTICS FOR 2000 CALENDAR YEAR FOR 2001 WATER YEAR WATER YEARS 1987 - 2001 ANNUAL TOTAL 2402.52 2461.49 ANNUAL MEAN 6.56 6.74 9.17 HIGHEST ANNUAL MEAN 17.2 1995 LOWEST ANNUAL MEAN 3.18 1989 HIGHEST DAILY MEAN 108 Sep 18 100 Jul 24 465 Sep 21 1999 LOWEST DAILY MEAN .31 Jun 3 .07 May 20 .00 Jun 5 1989 ANNUAL SEVEN-DAY MINIMUM .32 Jun 2 .12 May 15 .00 Jun 5 1989 MAXIMUM PEAK FLOW 128 Jul 23 557 Sep 21 1999 MAXIMUM PEAK STAGE 9.77 Jul 23 11.09 Jun 28 1992 INSTANTANEOUS LOW FLOW .06 May 21 .00 Jun 5 1989 ANNUAL RUNOFF (AC-FT) 4770 4880 6650 10 PERCENT EXCEEDS 18 16 20 50 PERCENT EXCEEDS 2.0 2.1 3.4 90 PERCENT EXCEEDS .66 .64 .56
The period of record statistics were computed from complete water year's of record. See the annual mean and annual runoff (ac-ft) summary statistics section of the manuscript.
225 BIG CYPRESS SWAMP AND SOUTHWESTERN COASTAL AREA
02291580 NORTH BRANCH ESTERO RIVER AT ESTERO, FL
LOCATION.--Lat 26°26'30", long 81°47'45", in SW 1⁄4 SW 1⁄4 NE
1⁄4 sec.27, T.46 S., R.25 E., Lee County, Hydrologic Unit 03090204, on right bank behind house at east end of Broadway Road, 0.95 mi east of U.S. Highway 41, 0.9 mi upstream from confluence with South Branch Estero River and 5.6 mi upstream from mouth of Estero River. (Corrected).DRAINAGE AREA.--Indeterminate.PERIOD OF RECORD.--February 1987 to current year.GAGE.--Satellite data collection platform with water-stage shaft encoder. Datum of gage is National Geodetic Vertical Datum of 1929.REMARKS.--Records good except for estimated daily discharges, which are poor.ANNUAL MEAN and ANNUAL RUNOFF (AC-FT) SUMMARY STATISTICS.--Figures represent 14 complete water years of discharge (1988-2001).
SUMMARY STATISTICS FOR 2000 CALENDAR YEAR FOR 2001 WATER YEAR WATER YEARS 1987 - 2001 ANNUAL TOTAL 2139.40 4351.63 ANNUAL MEAN 5.85 11.9 8.04 HIGHEST ANNUAL MEAN 17.9 1995 LOWEST ANNUAL MEAN .000 1990 HIGHEST DAILY MEAN 204 Sep 18 284 Sep 14 366 Aug 26 1995 LOWEST DAILY MEAN .00 Jan 1 .00 Nov 28 .00 May 24 1987 ANNUAL SEVEN-DAY MINIMUM .00 Jan 1 .00 Nov 28 .00 May 29 1987 MAXIMUM PEAK FLOW 310 Sep 14 381 Aug 25 1995 MAXIMUM PEAK STAGE 13.70 Sep 14 14.41 Aug 25 1995 INSTANTANEOUS LOW FLOW .00 Jan 18 .00 May 24 1987 ANNUAL RUNOFF (AC-FT) 4240 8630 5820 10 PERCENT EXCEEDS 12 23 16 50 PERCENT EXCEEDS .00 .02 .01 90 PERCENT EXCEEDS .00 .00 .00 e Estimated
The period of record statistics were computed from complete water year's of record. See the annual mean and annual runoff (ac-ft) summary statistics section of the manuscript.
227 BIG CYPRESS SWAMP AND SOUTHWESTERN COASTAL AREA
02291597 SOUTH BRANCH ESTERO RIVER AT ESTERO, FL
LOCATION.--Lat 26°25'43", long 81°47'36", in NW 1⁄4 sec.34, T.46 S., R.25 E., Lee County, Hydrologic Unit 03090204, near left bank on downstream culvert headwall on Corkscrew Road, 1.1 mi east of U.S. Highway 41 at Estero and 3.9 mi upstream from mouth of Estero River.DRAINAGE AREA.--Indeterminate.PERIOD OF RECORD.--February 1987 to current year.REVISED RECORDS.--WDR FL-2000-2A:1999.GAGE.--Satellite data collection platform with water-stage shaft encoder. Datum of gage is National Geodetic Vertical Datum of 1929.REMARKS.--Records fair except for estimated daily discharges, which are poor.ANNUAL MEAN AND ANNUAL RUNOFF (AC-FT) SUMMARY STATISTICS.--Figures represent 12 complete water years of discharge (1989-98, 2000-2001).
SUMMARY STATISTICS FOR 2000 CALENDAR YEAR FOR 2001 WATER YEAR WATER YEARS 1987 - 2001 ANNUAL TOTAL 3384.62 4647.77 ANNUAL MEAN 9.25 12.7 13.0 HIGHEST ANNUAL MEAN 33.6 1995 LOWEST ANNUAL MEAN 2.03 1989 HIGHEST DAILY MEAN 147 Sep 18 225 Sep 14 410 Aug 26 1995 LOWEST DAILY MEAN .00 May 8 .18 Apr 27 .00 Apr 26 1996 ANNUAL SEVEN-DAY MINIMUM .00 May 8 .18 Apr 27 .00 Apr 26 1996 MAXIMUM PEAK FLOW 264 Sep 14 440 Aug 25 1995 MAXIMUM PEAK STAGE 9.49 Sep 14 12.60 Aug 25 1995 INSTANTANEOUS LOW FLOW .15 Apr 29 .00 May 10 1990 ANNUAL RUNOFF (AC-FT) 6710 9220 9410 10 PERCENT EXCEEDS 22 44 38 50 PERCENT EXCEEDS .76 .93 1.9 90 PERCENT EXCEEDS .04 .28 .18 e Estimated
The period of record statistics were computed from complete water year's of record. See the annual mean and annual runoff (ac-ft) summary statistics section of the manuscript.
229 BIG CYPRESS SWAMP AND SOUTHWESTERN COASTAL AREA
02291669 SIXMILE CYPRESS CREEK NORTH NEAR FORT MYERS, FL
LOCATION.--Lat 26°31'18", long 81°51'09", in SW 1⁄4 NW 1⁄4 NW
1⁄4 sec.31, T.45 S., R.25 E., Lee County, Hydrologic Unit 03090204, 10 ft upstream from Tenmile Canal, 0.4 mi south of Sixmile Cypress parkway, and 5.2 mi south of Colonial Boulevard in Ft. Myers, FL.DRAINAGE AREA.--Indeterminate.PERIOD OF RECORD.--December 1987 to 1990, 1992 to current year.GAGE.--Satellite data collection platform with water-stage shaft encoder. Datum of gage is National Geodetic Vertical Datum of 1929.COOPERATION.--Gate operation log provided by the county of Lee.REMARKS.--No estimated daily discharges. Records poor. Flow can be regulated by four vertical lift gates, two on either side of control weir. New control weir constructed in 1991. Records of discharge for water years 1999-2001 represent only flow over the top of the weir. Daily value discharge during water years 1999-2001 are not provided when partial or full gate openings occurred. Records of discharge prior to water year 1999 include combinations of flow over the weir and gate flow. No distinctions in flow types prior to water year 1999 have been made.ANNUAL MEAN and ANNUAL RUNOFF (AC-FT) SUMMARY STATISTICS.--Figures represent 9 complete water years of discharge (1989-90, 1992-98).REVISIONS.--Discharge for water year 2000 has been revised based on an evaluation of the high end of the rating used, which produced higher discharge than warranted.
SUMMARY STATISTICS FOR 1999 CALENDAR YEAR FOR 2000 WATER YEAR WATER YEARS 1987 - 2000 ANNUAL MEAN 23.3 HIGHEST ANNUAL MEAN 47.2 1995 LOWEST ANNUAL MEAN 6.84 1993 HIGHEST DAILY MEAN 96 Aug 8 105 Aug 7 860 Aug 27 1995 LOWEST DAILY MEAN .00 Feb 13 .00 Nov 28 .00 Jan 17 1988 ANNUAL SEVEN-DAY MINIMUM .00 Feb 13 .00 Nov 28 .00 Feb 25 1988 MAXIMUM PEAK STAGE 11.42 Sep 18 12.12 Aug 27 1995 ANNUAL RUNOFF (AC-FT) 16910 10 PERCENT EXCEEDS 33 43 54 50 PERCENT EXCEEDS .00 .00 .00 90 PERCENT EXCEEDS .00 .00 .00
REVISED
230 BIG CYPRESS SWAMP AND SOUTHWESTERN COASTAL AREA
02291669 SIXMILE CYPRESS CREEK NORTH NEAR FORT MYERS, FL
SUMMARY STATISTICS FOR 2000 CALENDAR YEAR FOR 2001 WATER YEAR WATER YEARS 1987 - 2001 ANNUAL MEAN 23.3 HIGHEST ANNUAL MEAN 47.2 1995 LOWEST ANNUAL MEAN 6.84 1993 HIGHEST DAILY MEAN 105 Aug 7 267 Sep 30 860 Aug 27 1995 LOWEST DAILY MEAN .00 Jan 1 .00 Oct 31 .00 Jan 17 1988 ANNUAL SEVEN-DAY MINIMUM .00 Jan 1 .00 Oct 31 .00 Feb 25 1988 MAXIMUM PEAK STAGE 11.53 Sep 10 12.12 Aug 27 1995 ANNUAL RUNOFF (AC-FT) 16910 10 PERCENT EXCEEDS 36 14 54 50 PERCENT EXCEEDS .00 .00 .00 90 PERCENT EXCEEDS .00 .00 .00
The period of record statistics were computed from complete water year's of record. See the annual mean and annual runoff (ac-ft) summary statistics section of the manuscript.
232 BIG CYPRESS SWAMP AND SOUTHWESTERN COASTAL AREA
02291673 TENMILE CANAL AT CONTROL NEAR ESTERO, FL
LOCATION.--Lat 26°30'19", long 81°51'00", in NW 1⁄4 SW 1⁄4 NW
1⁄4 sec. 6, T.46 S., R.24 E., Lee County, Hydrologic Unit 03090204, on left bank 367 ft upstream of weir, 1.05 mi north of Alico Road, and 5.3 mi northwest of Estero.DRAINAGE AREA.--Indeterminate.PERIOD OF RECORD.--December 1987 to current year.GAGE.--Satellite data collection platform with water-stage shaft encoder. Datum of gage is National Geodetic Vertical Datum of 1929 (State Department of Transportation bench mark).REMARKS.--Records poor. Downstream gage discontinued as of October 1, 1997. Flow can be regulated by two vertical lift gates, one on each side of the control weir. Records of discharge for water years 1999-2001 represent only flow over the top of the weir. Daily value discharge during water years 1999-2001 are not provided when partial or full gate openings occurred. Records of discharge prior to water year 1999 include combinations of flow over the weir with gate flow included. No distinctions in flow types prior to water year 1999 have been made.ANNUAL MEAN and ANNUAL RUNOFF (AC-FT) SUMMARY STATISTICS.--Figures represent 9 complete water years of discharge (1990-98).
SUMMARY STATISTICS FOR 2000 CALENDAR YEAR FOR 2001 WATER YEAR WATER YEARS 1988 - 2001 ANNUAL MEAN 90.4 HIGHEST ANNUAL MEAN 165 1995 LOWEST ANNUAL MEAN 29.6 1993 HIGHEST DAILY MEAN 2170 Sep 18 462 Sep 29 2170 Sep 18 2000 LOWEST DAILY MEAN .00 Jan 17 .00 May 7 .00 Apr 15 1988 ANNUAL SEVEN-DAY MINIMUM .00 Apr 28 .00 May 7 .00 Apr 15 1988 MAXIMUM PEAK STAGE 7.55 Sep 14 8.34 Aug 26 1995 ANNUAL RUNOFF (AC-FT) 65510 10 PERCENT EXCEEDS 93 37 200 50 PERCENT EXCEEDS 7.9 6.6 11 90 PERCENT EXCEEDS .00 .00 .00 e Estimated
The period of record statistics were computed from complete water year's of record. See the annual mean and annual runoff (ac-ft) summary statistics section of the manuscript.
234 CALOOSAHATCHEE RIVER
02292000 CALOOSAHATCHEE CANAL AT MOORE HAVEN, FL
LOCATION.--Lat 26°50'22", long 81°05'15", in NW 1⁄4 NW 1⁄4 sec.12, T.42 S., R.32 E., Glades County, Hydrologic Unit 03090205, on
the west side of the lock structure approximately 75 ft north of lock control house, 0.1 mi west of control structure 77, 0.45 mi upstream from U.S. Highway 27, and 15 mi upstream from lock 2.DRAINAGE AREA.--Indeterminate.PERIOD OF RECORD.--May to September 1913 (discharge measurements), October 1938 to current year. Monthly discharge only for some periods, published in WSP 1304. Prior to October 1938, published as Threemile Canal near Ritta.REVISED RECORDS.--WDR FL-98-2A:1996-97GAGE.--U.S Army Corps of Engineers owned and operated satellite data collection platform with water-stage shaft encoders. Datum of gage is National Geodetic Vertical Datum of 1929 (levels by U.S. Army Corps of Engineers). Prior to January 17, 1952, at site 0.5 mi downstream, at datum 1.44 ft lower. January 17, 1952 to September 30, 1966, at site 0.5 mi downstream at present datum. October 1938 to September 1966, auxiliary water-stage recorder 0.2 mi upstream from Lake Hicpochee and 3.0 mi downstream. Since October 1966, auxiliary water-stage recorder on upstream side of hurricane gate structure and lock 1. U.S. Geological Survey satellite data collection platform removed October 19, 1998.REMARKS.--Records poor. Flow regulated by operation of control structure S-77 at Lake Okeechobee. Gage height and discharge records revised October 1995 through September 1997, except 1996 canal gage height, based upon new elevation for lake and canal measuring point. Revised records are available in the files of the U.S. Geological Survey.COOPERATION.-- Stage, gate-opening and lock operation record provided by U.S. Army Corps of Engineer. ANNUAL MEAN and ANNUAL RUNOFF (AC-FT) SUMMARY STATISTICS--Figures represent 60 complete water years of discharge (1939-96, 1998-2000).EXTREME LAKE STAGES FOR PERIOD OF RECORD.--Maximum lake gage height, 18.61 ft Oct. 23, 1995; minimum, 7.24 ft present datum, estimated Aug. 8, 1940.EXTREME LAKE STAGES FOR CURRENT YEAR.--Maximum gage height, 14.50 ft Sept 30; minimum, 8.69 ft May 16.EXTREME CANAL STAGES FOR PERIOD OF RECORD.--Maximum canal gage height, 16.98 ft present datum, Sept. 27, 1948; minimum, 7.14 ft present datum, estimated Aug. 8, 1940.EXTREME CANAL STAGES FOR CURRENT YEAR.--Maximum gage height, 12.00 ft Sept. 14; minimum, 8.57 ft May 16.
SUMMARY STATISTICS FOR 2000 CALENDAR YEAR FOR 2001 WATER YEAR WATER YEARS 1939 - 2001 ANNUAL TOTAL 250188.10 ANNUAL MEAN 684 880 HIGHEST ANNUAL MEAN 3716 1970 LOWEST ANNUAL MEAN 10.0 1951 HIGHEST DAILY MEAN 5950 May 3 1690 Dec 31 8290 Apr 10 1970 LOWEST DAILY MEAN .00 Jan 7 -2440 Jul 27 -4410 May 29 1982 ANNUAL SEVEN-DAY MINIMUM .00 Jan 28 -1790 Jul 25 -1790 Jul 25 2001 ANNUAL RUNOFF (AC-FT) 496200 637400 10 PERCENT EXCEEDS 1590 625 3660 50 PERCENT EXCEEDS 297 .00 10 90 PERCENT EXCEEDS .00 -705 5.0 e Estimated
The period of record statistics were computed from complete water year's of record. See the annual mean and annual runoff (ac-ft) summary statistics section of the manuscript.
237 CALOOSAHATCHEE RIVER
02292480 CALOOSAHATCHEE CANAL AT ORTONA LOCK NEAR LA BELLE, FL
LOCATION.--Lat 26°47'22", long 81°18'11", in SW 1⁄4 sec.26, T.42 S., R.30 E., Glades County, Hydrologic Unit 03090205, near right bank, 500 ft upstream from Ortona Lock, 1.4 mi downstream from Long Hammock Creek, and 9.0 mi east of La Belle.DRAINAGE AREA.--Indeterminate.PERIOD OF RECORD.--October 1948 to September 1950 (discharge measurements and gage heights), July 1971 to current year. Records of gage heights and discharge measurements can be found in the files of the U.S. Geological Survey.REVISED RECORDS.--WDR FL-80-2A:1979; WDR FL-96-2A:1995.GAGE.--U.S. Army Corps of Engineers owned and operated satellite data collection platform with water-stage shaft encoders. Prior to September 29, 1998, similar equipment belonging to the U.S. Geological Survey was used. Datum of gage is National Geodetic Vertical Datum of 1929.REMARKS.--Records fair except for estimated discharges, which are poor. Flow regulated by operation of control structures 77 and 78. Satellite data collection platform installed September 7, 1994. Extremes for downstream stages for the period of record are not available at the present time.COOPERATION.--Stage, gate-opening and lock operation records provided by U.S. Army Corps of Engineers.ANNUAL MEAN and ANNUAL RUNOFF (AC-FT) SUMMARY STATISTICS.--Figures represent 27 complete water years of discharge (1972-93, 1995, 1996-99).EXTREME UPSTREAM STAGES FOR PERIOD OF RECORD.--Maximum gage height, 12.80 ft June 26, 1974; minimum, 8.59 ft May 16, 2001.EXTREME UPSTREAM STAGES FOR CURRENT YEAR.--Maximum gage height, 11.81 ft Sept. 14; minimum, 8.59 ft May 16.EXTREME DOWNSTREAM STAGES FOR CURRENT YEAR.--Maximum gage height, 6.72 ft Sept. 14; minimum, 2.09 ft Oct. 3.
SUMMARY STATISTICS FOR 2000 CALENDAR YEAR FOR 2001 WATER YEAR WATER YEARS 1971 - 2001 ANNUAL MEAN 913 HIGHEST ANNUAL MEAN 3062 1995 LOWEST ANNUAL MEAN 113 1981 HIGHEST DAILY MEAN 4600 May 5 4480 Sep 15 9720 Aug 8 1974 LOWEST DAILY MEAN 35 Jan 7 35 Oct 12 .00 Oct 3 1971 ANNUAL SEVEN-DAY MINIMUM 35 Aug 6 35 Oct 12 .00 Jun 15 1976 ANNUAL RUNOFF (AC-FT) 661300 10 PERCENT EXCEEDS 1400 646 2900 50 PERCENT EXCEEDS 245 35 197 90 PERCENT EXCEEDS 35 35 9.5 e Estimated
The period of record statistics were computed from complete water year's of record. See the annual mean and annual runoff (ac-ft) summary statistics section of the manuscript.
240 CALOOSAHATCHEE RIVER
02292900 CALOOSAHATCHEE RIVER AT S-79, NEAR OLGA, FL
LOCATION.--Lat 26°43'25", long 81°41'55", in SW 1⁄4 sec.23, T.43 S., R.26 E., Lee County, Hydrologic Unit 03090205, in control house at southeast end of lock at salinity-control structure 79, 1 mi upstream from Telegraph Creek, and 1.2 mi northeast of Olga.DRAINAGE AREA.--Indeterminate.PERIOD OF RECORD.--December 1964 to March 1966 (gage heights only), April 1966 to current year.REVISED RECORD.--WDR FL-79-2A:1978.GAGE.--U.S. Army Corps of Engineers owned and operated satellite data collection platform with water-stage shaft encoders. Prior to October 16, 1998, similar equipment belonging to the U.S.Geological Survey was used. Datum of gage is National Geodetic Vertical Datum of 1929.REMARKS.--Records good except for estimated discharges, which are fair. Flow regulated by operation of salinity-control structure 79. Discharge computed from relations between discharge, head, and gate opening. Satellite data collection platform with shaft encoders were installed August 30, 1991 to collect upstream and downstream stages. U.S. Army Corps of Engineers equipment installed on October 16, 1998.COOPERATION.--Records of stage, gate and lock operation provided by U.S. Army Corps of Engineers.ANNUAL MEAN and ANNUAL RUNOFF (AC-FT) SUMMARY STATISTICS.--Figures represent 29 complete years of discharge (1967-94, 1996-97).EXTREME UPSTREAM STAGES FOR PERIOD OF RECORD.--Maximum gage height, 6.04 ft Sept. 14, 2001; minimum, 1.18 ft Sept. 22, 1966.EXTREME UPSTREAM STAGES FOR CURRENT YEAR.--Maximum gage height, 6.04 ft Sept. 14; minimum, 2.34 ft Oct. 3, (estimated).
SUMMARY STATISTICS FOR 2000 CALENDAR YEAR FOR 2001 WATER YEAR WATER YEARS 1966 - 2001 ANNUAL MEAN 1571 HIGHEST ANNUAL MEAN 5203 1970 LOWEST ANNUAL MEAN 296 1981 HIGHEST DAILY MEAN 5230 May 6 14500 Sep 14 21400 Mar 27 1970 LOWEST DAILY MEAN .00 Jan 9 .00 Oct 17 .00 May 17 1981 ANNUAL SEVEN-DAY MINIMUM .00 Feb 5 .00 Oct 17 .00 May 20 1981 ANNUAL RUNOFF (AC-FT) 1138000 10 PERCENT EXCEEDS 2600 3690 5390 50 PERCENT EXCEEDS 291 .00 498 90 PERCENT EXCEEDS .00 .00 8.6 e Estimated
The period of record statistics were computed from complete water year's of record. See the annual mean and annual runoff (ac-ft) summary statistics section of the manuscript.
243 CALOOSAHATCHEE RIVER
02293214 MEADE CANAL AT CAPE CORAL, FL
LOCATION.--Lat 26°38'10", long 81°55'48", in NE 1⁄4 NW 1⁄4 NE
1⁄4 sec.20 T.44 S., R.24 E., Lee County, Hydrologic Unit 0300205, near left bank on upstream side of containment wall, 20 ft east of bridge wingwall, on Viscaya Parkway, 100 ft west of SE 21st Avenue, and 1.2 mi upstream from Caloosahatchee River at Cape Coral.DRAINAGE AREA.--Indeterminate.PERIOD OF RECORD.--November 1986 to current year.REVISED RECORDS.--WRD FL-99-2A:1997, 1998.GAGE.--Electronic data logger. Datum of gage is National Geodetic Vertical Datum of 1929 (State Road Department Bench Mark).REMARKS.--Records are good except for estimated daily discharges, which are poor.ANNUAL MEAN and RUNOFF (AC-FT) SUMMARY STATISTICS.--Figures represent 14 complete water years of discharge (1988-2001).
SUMMARY STATISTICS FOR 2000 CALENDAR YEAR FOR 2001 WATER YEAR WATER YEARS 1987 - 2001 ANNUAL TOTAL 2235.65 2711.34 ANNUAL MEAN 6.11 7.43 5.56 HIGHEST ANNUAL MEAN 10.6 1995 LOWEST ANNUAL MEAN 2.28 1993 HIGHEST DAILY MEAN 79 Sep 18 321 Jul 23 321 Jul 23 2001 LOWEST DAILY MEAN .00 May 27 .00 May 10 .00 May 8 1988 ANNUAL SEVEN-DAY MINIMUM .00 Jun 1 .00 May 10 .00 Jun 3 1988 MAXIMUM PEAK FLOW 406 Jul 23 MAXIMUM PEAK STAGE 7.73 Jul 23 INSTANTANEOUS LOW FLOW .00 May 20 ANNUAL RUNOFF (AC-FT) 4430 5380 4030 10 PERCENT EXCEEDS 20 21 15 50 PERCENT EXCEEDS 2.2 1.2 2.2 90 PERCENT EXCEEDS .10 .16 .00 e Estimated
The period of record statistics were computed from complete water year's of record. See the annual mean and annual runoff (ac-ft) summary statistics section of the manuscript.
245 CALOOSAHATCHEE RIVER
02293230 WHISKEY CREEK AT FT. MYERS, FL
LOCATION.--Lat 26°34'27", long 81°53'29", in NW 1⁄4 NW 1⁄4 SE
1⁄4 , sec.10, T.45 S., R.24 E., Lee County, Hydrologic Unit 03090205, 300 ft upstream from mouth on left bank, above spillway at Whiskey Creek Drive, 1.4 mi south of Colonial Boulevard.DRAINAGE AREA.--Approximately 9 mi sq. Information provided by Johnson Engineering, Inc. 1979.PERIOD OF RECORD.--April 1994 to current year.GAGE.--Satellite data collection platform with water-stage shaft encoder. Datum of gage is National Geodetic Vertical Datum of 1929.REMARKS.--Records good except for estimated daily discharges, which are poor. Discharge for all periods when the vertical gates are opened are not included. Formerly published as Whiskey Creek at Whiskey Creek Drive near Ft. Myers, Fl.ANNUAL MEAN and ANNUAL RUNOFF (AC-FT) SUMMARY STATISTICS.--Figures represent 4 complete water years of discharge (1995-98, 2001).
SUMMARY STATISTICS FOR 2000 CALENDAR YEAR FOR 2001 WATER YEAR WATER YEARS 1994 - 2001 ANNUAL TOTAL 4744.33 ANNUAL MEAN 13.0 11.4 HIGHEST ANNUAL MEAN 13.1 1995 LOWEST ANNUAL MEAN 8.88 1997 HIGHEST DAILY MEAN 271 Sep 17 200 Sep 14 380 Sep 2 1995 LOWEST DAILY MEAN .56 May 25 .13 Jun 4 .00 May 21 1994 ANNUAL SEVEN-DAY MINIMUM .80 May 23 .23 May 29 .00 May 21 1994 MAXIMUM PEAK FLOW 175 Sep 8 1280 Jun 15 1996 MAXIMUM PEAK STAGE 3.64 Sep 8 4.65 Sep 17 2000 INSTANTANEOUS LOW FLOW .00 May 31 .00 Apr 12 1994 ANNUAL RUNOFF (AC-FT) 9410 8260 10 PERCENT EXCEEDS 22 34 24 50 PERCENT EXCEEDS 4.6 4.3 5.3 90 PERCENT EXCEEDS 1.3 .68 1.0 e Estimated
The period of record statistics were computed from complete water year's of record. See the annual mean and annual runoff (ac-ft) summary statistics section of the manuscript.
247 CHARLOTTE HARBOR AND COASTAL AREA
02293240 ARIES CANAL AT CAPE CORAL, FL
LOCATION.--Lat 26°36'00", long 81°59'39", in SE 1⁄4 SW 1⁄4 NE
1⁄4 sec.34, T.44 S., R.23 E., Lee County, Hydrologic Unit 03090205, on right wingwall on downstream side of bridge at S.W. 28th Street, 0.33 mi west of Skyline Boulevard, and 4.6 mi upstream from Caloosahatchee River at Cape Coral.DRAINAGE AREA.--Indeterminate.PERIOD OF RECORD.--December 1989 to current year.GAGE.--Electronic data logger. Datum of gage is National Geodetic Vertical Datum of 1929.REMARKS.--No estimated daily discharges. Records fair.ANNUAL MEAN and ANNUAL RUNOFF (AC-FT) SUMMARY STATISTICS.--Figures represent 12 complete water years of discharge (1990-2001).
SUMMARY STATISTICS FOR 2000 CALENDAR YEAR FOR 2001 WATER YEAR WATER YEARS 1990 - 2001 ANNUAL TOTAL 7162.56 5701.58 ANNUAL MEAN 19.6 15.6 14.8 HIGHEST ANNUAL MEAN 27.9 1999 LOWEST ANNUAL MEAN 5.73 1990 HIGHEST DAILY MEAN 467 Sep 17 587 Jul 23 587 Jul 23 2001 LOWEST DAILY MEAN .00 Mar 7 .00 Feb 19 .00 Nov 30 1989 ANNUAL SEVEN-DAY MINIMUM .00 Apr 2 .00 Feb 19 .00 Nov 30 1989 MAXIMUM PEAK FLOW 849 Jul 24 849 Jul 24 2001 MAXIMUM PEAK STAGE 7.17 Jul 24 7.17 Jul 24 2001 INSTANTANEOUS LOW FLOW .00 Feb 18 .00 Nov 30 1989 ANNUAL RUNOFF (AC-FT) 14210 11310 10740 10 PERCENT EXCEEDS 61 38 37 50 PERCENT EXCEEDS 2.4 2.0 4.7 90 PERCENT EXCEEDS .00 .00 .00
The period of record statistics were computed from complete water year's of record. See the annual mean and annual runoff (ac-ft) summary statistics section of the manuscript.
249 CALOOSAHATCHEE RIVER
02293241 SAN CARLOS CANAL AT CAPE CORAL, FL
LOCATION.--Lat 26°36'11", long 81°57'48", in NW 1⁄4 SW 1⁄4 NE
1⁄4 sec.36, T.44 S., R.23 E., Lee County, Hydrologic Unit 03090205, near right bank on upstream side of wingwall of bridge on SE 26th Terrace, 300 ft west of Retunda Parkway and 2.4 mi upstream of Caloosahatchee River.DRAINAGE AREA.--Indeterminate.PERIOD OF RECORD.--November 1986 to current year.GAGE.--Electronic data logger. Datum of gage is National Geodetic Vertical Datum of 1929 (State Road Department bench mark).REMARKS.--No estimated daily discharges. Records good.ANNUAL MEAN and ANNUAL RUNOFF (AC-FT) SUMMARY STATISTICS.--Figures represent 14 complete water years of discharge (1988-2001).REVISIONS.--Revised figures of discharge for September 11-30, 2000 water year, superseding those published in the 2000 report are given below. Revisions are based upon measurements taken in the 2001 water year.
SUMMARY STATISTICS FOR 2000 CALENDAR YEAR FOR 2001 WATER YEAR WATER YEARS 1987 - 2001 ANNUAL TOTAL 1722.60 2929.42 ANNUAL MEAN 4.71 8.03 5.10 HIGHEST ANNUAL MEAN 11.5 1995 LOWEST ANNUAL MEAN 2.39 1997 HIGHEST DAILY MEAN 153 Sep 18 330 Jul 23 330 Jul 23 2001 LOWEST DAILY MEAN .00 Feb 8 .00 Oct 24 .00 Dec 14 1986 ANNUAL SEVEN-DAY MINIMUM .00 Feb 8 .00 Oct 24 .00 Dec 14 1986 MAXIMUM PEAK FLOW 415 Jul 23 415 Jul 23 2001 MAXIMUM PEAK STAGE 7.54 Jul 23 7.58 Jun 28 1992 INSTANTANEOUS LOW FLOW 3.1 Dec 28 .00 Dec 14 1986 ANNUAL RUNOFF (AC-FT) 3420 5810 3690 10 PERCENT EXCEEDS 14 23 13 50 PERCENT EXCEEDS .00 .00 1.4 90 PERCENT EXCEEDS .00 .00 .00
The period of record statistics were computed from complete water year's of record. See the annual mean and annual runoff (ac-ft) summary statistics section of the manuscript.
252 CALOOSAHATCHEE RIVER
02293243 COURTNEY CANAL AT CAPE CORAL, FL
LOCATION.--Lat 26°34'40", long 81°59'00", in SW 1⁄4 SE 1⁄4 SW
1⁄4 sec.2, T.45 S., R.23 E., Lee County, Hydrologic Unit 03090205, near left bank on upstream side of wing wall of bridge at Mohawk Parkway, 200 ft west of 5th Avenue, 1.07 mi north of West Cape Coral Parkway and 3.15 mi upstream from Caloosahatchee River at Cape Coral.DRAINAGE AREA.--Indeterminate.PERIOD OF RECORD.--November 1986 to current year.GAGE.--Electronic data logger. Datum of gage is National Geodetic Vertical Datum of 1929 (State Road Department bench mark).REMARKS.--No estimated daily discharges. Records good.ANNUAL MEAN and ANNUAL RUNOFF (AC-FT) SUMMARY STATISTICS.--Figures represent 14 complete water years of discharge (1988-2001).
SUMMARY STATISTICS FOR 2000 CALENDAR YEAR FOR 2001 WATER YEAR WATER YEARS 1987 - 2001 ANNUAL TOTAL 5423.63 5782.59 ANNUAL MEAN 14.8 15.8 10.3 HIGHEST ANNUAL MEAN 28.2 1998 LOWEST ANNUAL MEAN 3.51 1988 HIGHEST DAILY MEAN 193 Sep 17 194 Jul 23 220 Jun 26 1999 LOWEST DAILY MEAN .00 Mar 1 .00 Oct 24 .00 Nov 18 1986 ANNUAL SEVEN-DAY MINIMUM .00 Mar 1 .00 Oct 24 .00 Nov 18 1986 MAXIMUM PEAK FLOW 222 Jul 23 358 Sep 7 1995 MAXIMUM PEAK STAGE 7.54 Jul 23 7.44 Sep 7 1995 INSTANTANEOUS LOW FLOW .00 May 14 .00 May 14 2001 ANNUAL RUNOFF (AC-FT) 10760 11470 7450 10 PERCENT EXCEEDS 53 52 30 50 PERCENT EXCEEDS .84 .03 .13 90 PERCENT EXCEEDS .00 .00 .00
The period of record statistics were computed from complete water year's of record. See the annual mean and annual runoff (ac-ft) summary statistics section of the manuscript.
254 CHARLOTTE HARBOR AND COASTAL AREA
02293345 SHADROE CANAL AT CAPE CORAL, FL
LOCATION.--Lat 26°39'07", long 82°02'22", in SE 1⁄4 SW 1⁄4 SW
1⁄4 sec.8 T.44 S., R.23 E., Lee County, Hydrologic Unit 03100103, near right bank on downstream side of wingwall of bridge on Embers Parkway, 75 ft west of N.W. 29th Place, 0.28 mi east of State Road 765 (Burnt Store Road) and 0.3 mi upstream of weir, at Cape Coral.DRAINAGE AREA.--Indeterminate.PERIOD OF RECORD.--January 1987 to current year.GAGE.--Electronic Data Logger. Datum of gage is National Geodetic Vertical Datum of 1929 (State Road Department Bench Mark).REMARKS.--No estimated daily discharges. Records are good.ANNUAL MEAN and ANNUAL RUNOFF (AC-FT)SUMMARY STATISTICS.--Figures represent 14 complete water years of discharge (1988-2001).
SUMMARY STATISTICS FOR 2000 CALENDAR YEAR FOR 2001 WATER YEAR WATER YEARS 1987 - 2001 ANNUAL TOTAL 3134.63 4254.67 ANNUAL MEAN 8.56 11.7 9.46 HIGHEST ANNUAL MEAN 21.8 1995 LOWEST ANNUAL MEAN 3.70 1990 HIGHEST DAILY MEAN 586 Sep 17 903 Jul 23 903 Jul 23 2001 LOWEST DAILY MEAN .00 Apr 4 .00 Feb 20 .00 May 9 1988 ANNUAL SEVEN-DAY MINIMUM .00 Apr 4 .00 Feb 20 .00 Jun 1 1988 MAXIMUM PEAK FLOW 1580 Jul 23 1580 Jul 23 2001 MAXIMUM PEAK STAGE 4.49 Jul 23 4.61 Sep 3 1995 INSTANTANEOUS LOW FLOW .00 Feb 20 ANNUAL RUNOFF (AC-FT) 6220 8440 6860 10 PERCENT EXCEEDS 18 16 20 50 PERCENT EXCEEDS 2.2 1.6 3.5 90 PERCENT EXCEEDS .00 .00 .16
The period of record statistics were computed from complete water year's of record. See the annual mean and annual runoff (ac-ft) summary statistics section of the manuscript.
256 CHARLOTTE HARBOR AND COASTAL AREA
02293346 HORSESHOE CANAL AT CAPE CORAL, FL
LOCATION.--Lat 26°40'41", long 82°02'26", in SW 1⁄4 NW 1⁄4 NW
1⁄4 sec.5, T.44 S., R.23 E., Lee County, Hydrologic Unit 03100103, on left bank, 100 ft north of Diplomat Parkway 152 ft upstream from weir and 252 ft east of State Road 765 (Burnt Store Road) in Cape Coral.DRAINAGE AREA.--Indeterminate.PERIOD OF RECORD.--January 1987 to current year. GAGE.--Electronic Data Logger. Datum of gage is National Geodetic Vertical Datum of 1929 (State Road Department bench mark).REMARKS.--Records are poor.ANNUAL MEAN and ANNUAL RUNOFF (AC-FT) SUMMARY STATISTICS.--Figures represent 14 complete water years of discharge (1988-2001).REVISIONS.--Gage heights for the 1998, 1999, and 2000 water years were revised based on levels run during the 2001 water year. The corrected gage heights are in the files of the U.S. Geological Survey.
SUMMARY STATISTICS FOR 2000 CALENDAR YEAR FOR 2001 WATER YEAR WATER YEARS 1987 - 2001 ANNUAL TOTAL 4122.25 10042.25 ANNUAL MEAN 11.3 27.5 24.6 HIGHEST ANNUAL MEAN 50.1 1998 LOWEST ANNUAL MEAN 10.9 1989 HIGHEST DAILY MEAN 315 Sep 17 819 Jul 23 1060 Aug 25 1995 LOWEST DAILY MEAN .00 Feb 28 .00 Nov 21 .00 Jun 3 1988 ANNUAL SEVEN-DAY MINIMUM .00 Mar 15 .00 Dec 14 .00 Jun 13 1988 MAXIMUM PEAK FLOW 1220 Jul 23 1420 Aug 25 1995 MAXIMUM PEAK STAGE 4.86 Jul 23 5.10 Aug 25 1995 INSTANTANEOUS LOW FLOW .00 Jun 3 .00 Jun 3 1988 ANNUAL RUNOFF (AC-FT) 8180 19920 17830 10 PERCENT EXCEEDS 40 90 65 50 PERCENT EXCEEDS .96 .00 7.6 90 PERCENT EXCEEDS .00 .00 .02 e Estimated
The period of record statistics were computed from complete water year's of record. See the annual mean and annual runoff (ac-ft) summary statistics section of the manuscript.
258 CHARLOTTE HARBOR AND COASTAL AREA
02293347 HERMOSA CANAL AT CAPE CORAL, FL
LOCATION.--Lat 26°40'41", long 82°02'26", in NW 1⁄4 SW 1⁄4 SW
1⁄4 sec.5, T.44 S., R.23 E., Lee County, Hydrologic Unit 03100103, on right bank, 175 ft upstream of bridge on State Road 765 (Burnt Store Road) and approximately 50 ft south of NW 9th Terrace in Cape Coral.DRAINAGE AREA.--Indeterminate.PERIOD OF RECORD.--January 1987 to current year.GAGE.--Electronic data logger. Datum of gage is National Geodetic Vertical Datum of 1929 (State Road Department bench mark).REMARKS.--No estimated daily discharges. Records good.ANNUAL MEAN and ANNUAL RUNOFF (AC-FT) SUMMARY STATISTICS.--Figures represent 14 complete water years of discharge (1988-2001).REVISIONS.--Revised figures of discharge for the 2000 water year based upon weir logs from the City of Cape Coral, superseding those previously published are shown below.
SUMMARY STATISTICS FOR 1999 CALENDAR YEAR FOR 2000 WATER YEAR WATER YEARS 1987 - 2000 ANNUAL TOTAL 6025.18 7565.29 ANNUAL MEAN 16.5 20.7 22.0 HIGHEST ANNUAL MEAN 39.1 1995 LOWEST ANNUAL MEAN 12.7 1990 HIGHEST DAILY MEAN 240 Jul 2 420 Sep 17 1040 Aug 25 1995 LOWEST DAILY MEAN .00 Feb 20 .00 Jan 17 .00 May 12 1989 ANNUAL SEVEN-DAY MINIMUM .00 Mar 9 .00 Jan 17 .00 Jan 16 1997 MAXIMUM PEAK FLOW 671 Sep 17 1370 Aug 25 1995 MAXIMUM PEAK STAGE 4.16 Sep 17 5.11 Aug 25 1995 INSTANTANEOUS LOW FLOW .00 Jun 8 .00 May 12 1989 ANNUAL RUNOFF (AC-FT) 11950 15010 15930 10 PERCENT EXCEEDS 48 60 55 50 PERCENT EXCEEDS 5.1 2.5 9.1 90 PERCENT EXCEEDS .00 .00 .12
SUMMARY STATISTICS FOR 2000 CALENDAR YEAR FOR 2001 WATER YEAR WATER YEARS 1987 - 2001 ANNUAL TOTAL 7351.65 9978.87 ANNUAL MEAN 20.1 27.3 22.4 HIGHEST ANNUAL MEAN 39.1 1995 LOWEST ANNUAL MEAN 12.7 1990 HIGHEST DAILY MEAN 420 Sep 17 745 Jul 23 1040 Aug 25 1995 LOWEST DAILY MEAN .00 Jan 17 .00 Feb 9 .00 May 12 1989 ANNUAL SEVEN-DAY MINIMUM .00 Jan 17 .00 Feb 9 .00 Jan 16 1997 MAXIMUM PEAK FLOW 1090 Jul 23 1370 Aug 25 1995 MAXIMUM PEAK STAGE 4.76 Jul 23 5.11 Aug 25 1995 INSTANTANEOUS LOW FLOW .00 Jun 2 .00 May 12 1989 ANNUAL RUNOFF (AC-FT) 14580 19790 16210 10 PERCENT EXCEEDS 78 95 57 50 PERCENT EXCEEDS 1.8 2.3 8.6 90 PERCENT EXCEEDS .00 .00 .00
The period of record statistics were computed from complete water year's of record. See the annual mean and annual runoff (ac-ft) summary statistics section of the manuscript.
261 CHARLOTTE HARBOR AND COASTAL AREA
264437081550100 GATOR SLOUGH AT U.S. 41 NEAR FT. MYERS, FL
LOCATION.--Lat 26°44'38", long 81°54'59", in SE 1⁄4 NE 1⁄4 SW
1⁄4 sec.9, T.43 S., R.24 E., Lee County, Hydrologic Unit 03100103, 325 ft upstream of bridge on U.S. Highway 41, 4.4 mi north of State Road 78, and 8.3 mi upstream from mouth.DRAINAGE AREA.--Indeterminate.PERIOD OF RECORD.--1973 to 1984 (annual maximum gage heights only), June 1984 to current year. Prior to 1984, published as Gator Slough near Ft. Myers, FL.GAGE.--Satellite data collection platform with water-stage shaft encoder. Datum of gage is National Geodetic Vertical Datum of 1929. Prior to April 26, 1988, at site 325 ft downstream on upstream side of bridge on U.S. Highway 41 at datum -1.07 ft lower. Gage was extended into deeper water at same location May 27, 1997.REMARKS.--Records good except for estimated daily discharges, which are poor.ANNUAL MEAN and ANNUAL RUNOFF (AC-FT) SUMMARY STATISTICS.--Figures represent 17 complete water years of discharge (1985-2001).
SUMMARY STATISTICS FOR 2000 CALENDAR YEAR FOR 2001 WATER YEAR WATER YEARS 1984 - 2001 ANNUAL TOTAL 1784.18 2665.60 ANNUAL MEAN 4.87 7.30 7.15 HIGHEST ANNUAL MEAN 17.5 1995 LOWEST ANNUAL MEAN .64 1990 HIGHEST DAILY MEAN 93 Sep 18 154 Jul 24 277 Jun 28 1992 LOWEST DAILY MEAN .00 Mar 16 .00 Nov 23 .00 Mar 2 1985 ANNUAL SEVEN-DAY MINIMUM .00 Mar 29 .00 Nov 23 .00 Mar 2 1985 MAXIMUM PEAK FLOW 183 Jul 23 518 Jun 28 1992 MAXIMUM PEAK STAGE 18.63 Jul 23 19.44 Aug 25 1995 INSTANTANEOUS LOW FLOW .00 Feb 21 .00 Feb 1 1986 ANNUAL RUNOFF (AC-FT) 3540 5290 5180 10 PERCENT EXCEEDS 17 23 21 50 PERCENT EXCEEDS .86 .00 1.4 90 PERCENT EXCEEDS .00 .00 .00 e Estimated
The period of record statistics were computed from complete water year's of record. See the annual mean and annual runoff (ac-ft) summary statistics section of the manuscript.
263 CHARLOTTE HARBOR AND COASTAL AREA
264139082022100 GATOR SLOUGH AT SR 765 AT CAPE CORAL, FL
LOCATION.--Lat 26°41'38", long 82°02'14" in SW 1⁄4 NW 1⁄4 NW
1⁄4 sec.32, T.43 S., R.23 E., Lee County, Hydrologic Unit 380 ft upstream from bridge on SR-765 (Burnt Store Road) in Cape Coral, 280 ft upstream from weir, and 2.9 mi north of Pine Island Road in Cape Coral, Fl.DRAINAGE AREA.--Indeterminate.PERIOD OF RECORD.--1973-83 (annual maximum gage heights, only), May 1984 to October 5, 1997, June 2000 to current year. Prior to 1984, published as "near Pine Island."GAGE.--Electronic data logger. Datum of gage is National Geodetic Vertical Datum of 1929. (State road department bench mark).REMARKS.--Records good, except for estimated daily discharges, which are poor. Formerly published as, "near Ft. Myers, Fl."ANNUAL MEAN and ANNUAL RUNOFF (AC-FT) SUMMARY STATISTICS.--Figures represent 14 complete water years of discharge (1985-97, 2001).
SUMMARY STATISTICS FOR 2000 CALENDAR YEAR FOR 2001 WATER YEAR WATER YEARS 1984 - 2001 ANNUAL TOTAL 16755.63 ANNUAL MEAN 45.9 48.2 HIGHEST ANNUAL MEAN 92.7 1995 LOWEST ANNUAL MEAN 21.7 1990 HIGHEST DAILY MEAN 576 Sep 18 1400 Sep 14 1400 Sep 14 2001 LOWEST DAILY MEAN .00 Dec 14 .00 Dec 14 .00 Apr 6 1985 ANNUAL SEVEN-DAY MINIMUM .00 Dec 21 .00 Dec 21 .00 May 2 1985 MAXIMUM PEAK FLOW 2550 Sep 14 2550 Sep 14 2001 MAXIMUM PEAK STAGE 4.61 Sep 14 4.61 Sep 14 2001 INSTANTANEOUS LOW FLOW .00 May 29 .00 May 29 2001 ANNUAL RUNOFF (AC-FT) 33230 34900 10 PERCENT EXCEEDS 132 109 130 50 PERCENT EXCEEDS 9.4 2.1 16 90 PERCENT EXCEEDS .31 .00 .50 e Estimated
The period of record statistics were computed from complete water year's of record. See the annual mean and annual runoff (ac-ft) summary statistics section of the manuscript.
265 WATER RESOURCES DATA - FLORIDA, 2001
VOLUME 2A: SOUTH FLORIDA
SURFACE WATER QUALITY RECORDS
FIELD MEASUREMENTS
WATER RESOURCES DATA - FLORIDA, 2001
VOLUME 2A: SOUTH FLORIDA266
SURFACE WATER QUALITY RECORDS FIELD MEASUREMENTS
MULTIPLE STATION ANALYSES
SPE- CHLO- LOCAL CIFIC RIDE, IDENT- LAT- LONG- CON- DIS- I- I- I- DUCT- SOLVED STATION NUMBER FIER TUDE TUDE DATE TIME ANCE (MG/L (US/CM) AS CL) (00095) (00940)
02282100 CYPRESS CREEK C AT S-37A, 26 12 20 N 080 07 57 W 10-26-00 1023 452 40.0 26 12 20 N 080 07 57 W 01-17-01 1330 610 70.0 26 12 20 N 080 07 57 W 04-17-01 1044 498 58.0 26 12 20 N 080 07 57 W 07-18-01 1100 482 56.0
02282700 MIDDLE RIVER CANAL AT S-36 26 10 22 N 080 10 47 W 10-26-00 1246 602 66.0 26 10 22 N 080 10 47 W 01-18-01 1200 600 76.0 26 10 22 N 080 10 47 W 04-17-01 1406 586 74.0 26 10 22 N 080 10 47 W 07-17-01 1424 595 54.0
02282701 MIDDLE RIVER CANAL BL S-36 26 10 22 N 080 10 44 W 10-26-00 1246 654 82.0 26 10 22 N 080 10 44 W 01-18-01 1201 9870 3250 26 10 22 N 080 10 44 W 04-17-01 1408 5830 1760
02283200 PLANTATION RD CA AT S-33 N 26 08 05 N 080 11 42 W 10-26-00 0943 362 32.0 26 08 05 N 080 11 42 W 01-18-01 1215 425 56.0 26 08 05 N 080 11 42 W 04-18-01 0955 305 50.0 26 08 05 N 080 11 42 W 07-17-01 1111 217 36.0
02283201 PLANTATION RD CA BL S-33 N 26 08 05 N 080 11 40 W 10-26-00 0943 485 30.0 26 08 05 N 080 11 40 W 01-18-01 1216 3330 1000 26 08 05 N 080 11 40 W 04-18-01 0958 486 40.0 26 08 05 N 080 11 40 W 07-17-01 1112 306 36.0
02285000 NORTH NEW RIVER CANAL NEAR 26 05 39 N 080 13 48 W 10-27-00 1255 666 52.0 26 05 39 N 080 13 48 W 01-19-01 1230 522 78.0 26 05 39 N 080 13 48 W 04-18-01 1316 501 76.0 26 05 39 N 080 13 48 W 07-19-01 1339 407 56.0
02285001 NORTH NEW RIVER CANAL BL C 26 05 39 N 080 13 50 W 10-27-00 1330 762 124 26 05 39 N 080 13 50 W 01-19-01 1305 5720 1820 26 05 39 N 080 13 50 W 04-18-01 1420 3790 1080 26 05 39 N 080 13 50 W 07-19-01 1405 426 52.0
02285101 NORTH NEW RIVER CA AT SR7 26 05 15 N 080 12 00 W 10-27-00 1330 6600 2000 26 05 15 N 080 12 00 W 01-19-01 1300 9550 3150 26 05 15 N 080 12 00 W 04-18-01 1416 5690 1700 26 05 15 N 080 12 00 W 07-19-01 1400 455 54.0
260037080100700 HOLLYWOOD CANAL AT HOLLYWO 26 00 37 N 080 10 07 W 10-27-00 1005 597 48.0 26 00 37 N 080 10 07 W 01-29-01 1330 8660 2550 26 00 37 N 080 10 07 W 04-17-01 1413 1040 200 26 00 37 N 080 10 07 W 07-26-01 1149 2260 620
260104080101300 HOLLYWOOD CANAL AT JOHNSON 26 01 04 N 080 10 13 W 10-27-00 1121 2050 720 26 01 04 N 080 10 13 W 01-29-01 1416 8550 2800 26 01 04 N 080 10 13 W 04-17-01 1145 2460 840 26 01 04 N 080 10 13 W 07-26-01 1130 4110 1080
260132080094900 HOLLYWOOD CANAL AT TAFT ST 26 01 32 N 080 09 49 W 10-27-00 1227 9150 3100 26 01 32 N 080 09 49 W 01-29-01 1207 15400 5400 26 01 32 N 080 09 49 W 04-18-01 1532 11200 3900 26 01 32 N 080 09 49 W 07-26-01 1532 9280 2850
267 WATER RESOURCES DATA - FLORIDA, 2001
VOLUME 2A: SOUTH FLORIDA
SURFACE WATER QUALITY RECORDS
FIELD MEASUREMENTS
MULTIPLE STATION ANALYSES
SPE- CHLO- LOCAL CIFIC RIDE, IDENT- LAT- LONG- CON- DIS- I- I- I- DUCT- SOLVED STATION NUMBER FIER TUDE TUDE DATE TIME ANCE (MG/L (US/CM) AS CL) (00095) (00940)
260212080112500 HOLLYWOOD CANAL AT N46 AVE 26 02 12 N 080 11 25 W 10-27-00 1400 601 70.0 26 02 12 N 080 11 25 W 01-29-01 1358 914 215 26 02 12 N 080 11 25 W 06-25-01 1530 839 195 26 02 12 N 080 11 25 W 07-26-01 1530 470 92.0
260225080095800 HOLLYWOOD CANAL AT N29 AVE 26 02 25 N 080 09 58 W 10-27-00 1309 11500 3700 26 02 25 N 080 09 58 W 01-29-01 1358 24700 7600 26 02 25 N 080 09 58 W 04-18-01 1517 29900 10600 26 02 25 N 080 09 58 W 07-26-01 1520 9930 3050
260956080094200 MIDDLE RIVER CA AT OAKLAND 26 09 56 N 080 09 42 W 10-26-00 1258 588 52.0 26 09 56 N 080 09 42 W 01-18-01 1220 3140 900 26 09 56 N 080 09 42 W 04-17-01 1325 1400 310 26 09 56 N 080 09 42 W 07-18-01 1430 711 90.0
261000080084900 N FORK MIDDLE RIVER AT AND 26 10 00 N 080 08 49 W 10-26-00 1341 3500 980 26 10 00 N 080 08 49 W 01-18-01 1300 13900 4500 26 10 00 N 080 08 49 W 04-17-01 1443 8240 2600 26 10 00 N 080 08 49 W 07-18-01 1500 3180 1000
261010080090400 N FORK MIDDLE R AT NW 34 S 26 10 10 N 080 09 04 W 10-26-00 1336 1850 445 26 10 10 N 080 09 04 W 01-18-01 1241 13200 4300 26 10 10 N 080 09 04 W 04-17-01 1437 7740 2450 26 10 10 N 080 09 04 W 07-18-01 1454 3550 1000
261019080100300 ROYAL PALM ISLES CA (C-13F 26 10 19 N 080 10 03 W 10-26-00 1258 582 46.0 26 10 19 N 080 10 03 W 01-18-01 1110 1470 335 26 10 19 N 080 10 03 W 04-17-01 1315 1050 195 26 10 19 N 080 10 03 W 07-18-01 1420 596 48.0
261019080100600 26 10 19 N 080 10 06 W 10-26-00 1255 610 68.0
261019080100600 ROYAL PALM ISLES CA (C-13F 26 10 19 N 080 10 06 W 01-18-01 1100 9860 3100 26 10 19 N 080 10 06 W 04-17-01 1320 6900 2150 26 10 19 N 080 10 06 W 07-18-01 1424 1810 425
261020080091700 N FORK MIDDLE R AT NW 9 AV 26 10 20 N 080 09 17 W 10-26-00 1315 2120 560 26 10 20 N 080 09 17 W 01-18-01 1235 920 195 26 10 20 N 080 09 17 W 04-17-01 1418 1880 490 26 10 20 N 080 09 17 W 07-18-01 1436 308 30.0
261034080093500 CA-13 FEEDER CA AT 10TH AV 26 10 34 N 080 09 35 W 10-26-00 1202 445 52.0 26 10 34 N 080 09 35 W 01-18-01 0930 395 44.0 26 10 34 N 080 09 35 W 04-17-01 1240 357 42.0 26 10 34 N 080 09 35 W 07-18-01 1259 316 32.0
261952080074500 E-3 CA AT SW 18TH ST IN BO 26 19 52 N 080 07 45 W 10-18-00 1005 504 44.0 26 19 52 N 080 07 45 W 12-04-00 1025 618 66.0 26 19 52 N 080 07 45 W 01-03-01 0959 573 58.0 26 19 52 N 080 07 45 W 02-06-01 0943 589 66.0 26 19 52 N 080 07 45 W 03-05-01 1118 543 78.0 26 19 52 N 080 07 45 W 04-09-01 1046 515 52.0 26 19 52 N 080 07 45 W 05-07-01 1005 539 58.0 26 19 52 N 080 07 45 W 06-05-01 1242 374 52.0 26 19 52 N 080 07 45 W 07-09-01 1207 514 30.0 26 19 52 N 080 07 45 W 08-06-01 1256 427 38.0 26 19 52 N 080 07 45 W 09-20-01 1234 469 42.0
WATER RESOURCES DATA - FLORIDA, 2001
VOLUME 2A: SOUTH FLORIDA268
This page left intentionally blank
269 WATER RESOURCES DATA - FLORIDA, 2001
VOLUME 2A: SOUTH FLORIDA
NATIONAL WATER-QUALITY ASSESSMENT
(NAWQA) DATA
270 WATER RESOURCES DATA - FLORIDA, 2001
VOLUME 2A: SOUTH FLORIDA
NATIONAL WATER-QUALITY ASSESSMENT (NAWQA) PROGRAM
The National Water-Quality Assessment (NAWQA) Program of the U.S. Geological Survey is a long-term program with goalsto describe the status and trends of water-quality conditions for a large, representative part of the Nation’s ground- andsurface-water resources; provide an improved understanding of the primary natural and human factors affecting these observedconditions and trends; and provide information that supports development and evaluation of management, regulatory, andmonitoring decisions by other agencies.
02281200 - HILLSBORO CANAL AT S-6 NEAR SHAWANO
WATER-QUALITY DATA, WATER YEAR OCTOBER 2000 TO SEPTEMBER 2001
DIS- SAMPLE BARO- OXYGEN, PH
AGENCY AGENCY CHARGE, LOC- METRIC DIS- WATER SPE- ANA- COL- INST. DRAIN- ATION, PRES- SOLVED WHOLE CIFIC LYZING LECTING CUBIC AGE DIST SURE OXYGEN, (PER- FIELD CON- TEMPER- TEMPER- SAMPLE SAMPLE GAGE FEET AREA UP- (MM DIS- CENT (STAND- DUCT- ATURE ATURE DATE (CODE (CODE HEIGHT PER (SQ. STREAM OF SOLVED SATUR- ARD ANCE AIR WATER NUMBER) NUMBER) (FEET) SECOND MI.) (FEET) HG) (MG/L) ATION) UNITS) (US/CM) (DEG C) (DEG C) (00028) (00027) (00065) (00061) (81024) (72105) (00025) (00300) (00301) (00400) (00095) (00020) (00010)
WATER-QUALITY DATA, WATER YEAR OCTOBER 2000 TO SEPTEMBER 2001
HARD- ALKA- BICAR-
NESS HARD- MAGNE- POTAS- SODIUM LINITY BONATE CHLO- FLUO- SILICA, NONCARB NESS CALCIUM SIUM, SIUM, AD- SODIUM, WAT DIS WATER RIDE, RIDE, DIS- DISSOLV TOTAL DIS- DIS- DIS- SORP- DIS- TOT IT DIS IT DIS- DIS- SOLVED FLD. AS (MG/L SOLVED SOLVED SOLVED TION SOLVED FIELD FIELD SOLVED SOLVED (MG/L DATE CACO3 AS (MG/L (MG/L (MG/L RATIO (MG/L SODIUM MG/L AS MG/L AS (MG/L (MG/L AS (MG/L) CACO3) AS CA) AS MG) AS K) AS NA) PERCENT CACO3 HCO3 AS CL) AS F) SIO2) (00904) (00900) (00915) (00925) (00935) (00931) (00930) (00932) (39086) (00453) (00940) (00950) (00955)
Access to USGS water data ...........................................................................30Accuracy of the records .............................................................................26Acid neutralizing capacity, definition of ...........................................................31Acknowledgment .....................................................................................IIIAcre-foot, definition of ............................................................................31Adenosine triphosphate, definition of ...............................................................31Algae, definition of ................................................................................32
Blue-green, definition of ........................................................................32Fire, definition of ..............................................................................34Green, definition of .............................................................................35
Algal growth potential, definition of ...............................................................31Alkalinity, definition of ...........................................................................31Annual 7-day minimum discharge, definition of .......................................................31Annual runoff, definition of ........................................................................31Aquifer, water table, definition of .................................................................42Aroclor, definition of ..............................................................................31Arrangement of records ..............................................................................20Artificial substrate, definition of .................................................................31Ash mass, definition of .............................................................................31
Bacteria, definition of .............................................................................34Enterococcus, definition of ......................................................................34Escherichia coli, definition of ..................................................................34Fecal coliform, definition of ....................................................................34Fecal streptococcal, definition of ...............................................................34Total coliform, definition of ....................................................................41
Base flow, definition of ............................................................................31Bed load, definition of .............................................................................31Bed material, definition of .........................................................................32Bed-load discharge, definition of ...................................................................31Benthic organisms, definition of ....................................................................32Biochemical oxygen demand, definition of ............................................................32Biomass pigment ratio, definition of ................................................................32Biomass, definition of ..............................................................................32Blank Samples, explanation of .......................................................................24
Equipment blank ..................................................................................24Field blank, explanation of ......................................................................24Filter blank, explanation of .....................................................................24Preservation blank ...............................................................................24Sampler blank, explanation of ....................................................................24Splitter blank, explanation of ...................................................................24Trip blank, explanation of .......................................................................24
Blue-green algae, definition of .....................................................................32Bottom material, definition of ......................................................................32
Cells/volume, definition of .........................................................................32Chemical oxygen demand, definition of ...............................................................32Chlorophyll, definition of ..........................................................................32Classification of records ...........................................................................20Colloid, definition of .............................................................................32Color unit, definition of ...........................................................................32Confined aquifer, definition of .....................................................................32Contents, definition of .............................................................................32Continuing-record station, definition of ............................................................32Control, definition of ..............................................................................32Control structure, definition of ....................................................................32Cooperation ..........................................................................................2Cubic foot per second per square mile, definition of ................................................33Cubic foot per second, definition of ................................................................33Cubic foot per second-day, definition of ...........................................................33
Daily record station, definition of ................................................................33Daily record, definition of .........................................................................33Daily table of daily mean values, explanation of ...................................................17Data collection and computation
Stage and water discharge ........................................................................14Surface-water quality ............................................................................20Ground-water levels ..............................................................................25Ground-water quality .............................................................................30
Data presentationStage and water discharge ........................................................................22Surface-water quality ............................................................................20Ground-water levels ..............................................................................25Ground-water quality .............................................................................30
Datum, definition of ................................................................................33Definition of terms .................................................................................31Diatom, definition of ...............................................................................33Diel, definition of .................................................................................33Discharge, definition of ............................................................................33Dissolved oxygen, definition of .....................................................................33Dissolved, definition of ............................................................................33Dissolved solids concentration, definition of .......................................................33Diversity index, definition of ......................................................................33Downstream order system .............................................................................13Drainage area, definition of ........................................................................34Drainage basin, definition of .......................................................................34Dry mass, definition of .............................................................................34Dry weight, definition of ...........................................................................34
Enterococcus bacteria, definition of ................................................................34Escherichia coli (E. coli), definition of ...........................................................34Euglenoids, definition of ...........................................................................34Explanation of the records ..........................................................................13
Fecal coliform bacteria, definition of ..............................................................34Fecal streptococcal bacteria, definition of .........................................................34Fire algae, definition of ...........................................................................34Flow (see Discharge) ................................................................................34Flow-duration percentiles, definition of ............................................................34
Gage datum, definition of ...........................................................................34Gage height, definition of ..........................................................................35Gaging station, definition of .......................................................................35Gas chromatography/flame ionization detector, definition of .........................................35Green algae, definition of ..........................................................................35Ground-Water Levels, records of .....................................................................25Ground-Water Quality, records of ....................................................................30
Hardness of water, definition of ....................................................................35High tide, definition of ............................................................................35Hydrologic Benchmark Network, explanation of ........................................................12Hydrologic benchmark station, definition of .........................................................35Hydrologic Conditions, summary of ....................................................................3Hydrologic unit, definition of ......................................................................35
Identifying Estimated Daily Discharge ...............................................................19Instantaneous discharge, definition of ..............................................................35Introduction .........................................................................................1
Laboratory Measurements, explanation of .............................................................21Land-surface datum, definition of ...................................................................35Latitude-Longitude System ...........................................................................13Light-attenuation coefficient, definition of ........................................................35Lipid, definition of ................................................................................36Low flow, 7-day 10-year, definition of .............................................................39Low tide, definition of .............................................................................36
Macrophytes, definition of ..........................................................................36Mean discharge, definition of .......................................................................36Measuring point, definition of ......................................................................36Membrane filter, definition of ......................................................................36Metamorphic stage, definition of ....................................................................36Methylene blue active substances definition of ......................................................36Micrograms per gram (ug/g), definition of ...........................................................36Micrograms per kilogram, definition of ..............................................................36
Micrograms per liter (ug/L), definition of ..........................................................36Microsiemens per centimeter, definition of ..........................................................36Milligrams per liter (mg./L), definition of .........................................................36Miscellaneous site, definition of ...................................................................36Most probable number (MPN), definition of ...........................................................36Multiple-plate samplers, definition of ..............................................................37
Nanograms per liter, definition of ..................................................................37National Geodetic Vertical Datum of 1929, definition of .............................................37Natural substrate, definition of ....................................................................37Nekton, definition of ...............................................................................37Nephelometric turbidity unit, definition of .........................................................37NGVD of 1929, definition of .........................................................................37
On-site Measurements and Sample Collection, explanation of ..........................................20Open or screened interval, definition of ...........................................................37Organic carbon, definition of ......................................................................37Organic mass ........................................................................................37Organism count, definition of
Area, definition of ..............................................................................37Total, definition of .............................................................................41Volume, definition of ............................................................................37
Organism, definition of .............................................................................37Organochlorine compounds, definition of .............................................................37
Parameter code, definition of .......................................................................37Partial-record station, definition of ...............................................................37Particle size, definition of ........................................................................37Particle size classification, definition of .........................................................37Percent composition, definition of ..................................................................38Periodic station, definition of .....................................................................38Periphyton, definition of ...........................................................................38Pesticides, definition of ...........................................................................38Phytoplankton, definition of ........................................................................38Picocurie, definition of ............................................................................38Plankton, definition of .............................................................................38Polychlorinated biphenyls (PCB’s), definition of ....................................................38Primary productivity, definition of .................................................................38
Carbon method, definition of .....................................................................38Oxygen method, definition of .....................................................................38
Radioisotopes, definition of ........................................................................38Records, explanation of the .........................................................................14
stage and water discharge ........................................................................14surface-water quality ............................................................................20ground-water levels ..............................................................................25ground-water quality .............................................................................30
Recoverable, bottom material, definition of .........................................................39Recurrence interval, definition of ..................................................................39Reference samples, explanation of ...................................................................25References, selected ................................................................................48Remark codes ........................................................................................23Replicate samples, definition of ....................................................................39Replicate samples, explanation of ...................................................................39River mile, definition of ...........................................................................39River mileage, definition of .......................................................................39Runoff, definition of ...............................................................................39
Samples, blank, explanation of ......................................................................24Equipment blank, explanation of ..................................................................24Field blank, explanation of ......................................................................24Filter blank, explanation of .....................................................................24Preservation blank, explanation of ...............................................................24Preservation blank, explanation of ...............................................................24Sampler blank, explanation of ....................................................................24Splitter blank, explanation of ...................................................................24Trip blank, explanation of .......................................................................24
Samples, reference, explanation of ..................................................................25Samples, replicate, explanation of ..................................................................25Samples, spike, explanation of ......................................................................25Sea level, definition of ............................................................................39Sediment, definition of .............................................................................39Sediment, explanation of ............................................................................21Selected References ................................................................................48Sodium-adsorption-ratio definition of ...............................................................39Specific conductance, definition of .................................................................39Spike samples .......................................................................................25Stable isotope ratio, definition of .................................................................39Stage (see gage height) ............................................................................39Stage and water discharge, records of ...............................................................14Stage discharge relation, definition of .............................................................39Station identification numbers ......................................................................13Station manuscript, explanation of ..................................................................16Statistics of monthly mean data, explanation of .....................................................17Streamflow, definition of ...........................................................................40Substrate, artificial, definition of ................................................................31Substrate, definition of ............................................................................40Substrate, natural, definition of ...................................................................37Summary of hydrologic conditions .....................................................................3Summary Statistics ..................................................................................17Surface area, definition of .........................................................................40Surface-water quality, records of ...................................................................20Surficial bed material, definition of ...............................................................40Suspended sediment, definition of ...................................................................40Suspended sediment, mean concentration, definition of ...............................................36Suspended, definition of ............................................................................40
Recoverable, definition of .......................................................................40Total, definition of .............................................................................40
Suspended-sediment concentration, definition of .....................................................40Suspended-sediment discharge, definition of .........................................................40Suspended-sediment load, definition of ..............................................................40Synoptic Studies, definition of .....................................................................40
Taxonomy, definition of .............................................................................41Techniques of water resources investigations ........................................................43Temperature, Water ..................................................................................41Time-weighted average, definition of ................................................................41Tons per acre-foot, definition of ...................................................................41Tons per day, definition of .........................................................................41Total, definition of ................................................................................41
Bottom Material, definition of ...................................................................32Coliform bacteria, definition of .................................................................39Discharge, definition of .........................................................................33Length, definition of ............................................................................41Load, definition of ..............................................................................41Organism count, definition of ....................................................................37Recoverable, definition of .......................................................................39Sediment discharge, definition of ................................................................39Sediment load, definition of .....................................................................42
Volatile Organic Compounds, definition of ...........................................................42
Water-quality control data, explanation of ..........................................................24Water-resources investigations, techniques of .......................................................43Water table, definition of ..........................................................................42Water Temperature, explanation of ..................................................................41Water year, definition of ...........................................................................42Water-table aquifer, definition of ..................................................................42WDR, definition of ..................................................................................42Weighted average, definition of .....................................................................42Wet mass, definition of .............................................................................42Wet weight, definition of ...........................................................................42WSP, definition of ..................................................................................42
Zooplankton, definition of ..........................................................................42
VOLUME 2A: SOUTH FLORIDA
288 WATER RESOURCES DATA FOR FLORIDA, 2001
This page left intentionally blank
289VOLUME 2A: SOUTH FLORIDA
WATER RESOURCES DATA FOR FLORIDA, 2001
INDEX TO SURFACE WATER SITES IN THIS REPORT
VOLUME 2A: SOUTH FLORIDA
290 WATER RESOURCES DATA FOR FLORIDA, 2001
INDEX TO SURFACE WATER SITES IN THIS REPORTPage
Aries Canal at Cape Coral, FL ......................................................................247
Barron River Canal near Everglades, FL .............................................................218Black Creek Canal at S-21, near Goulds, FL .........................................................194
Caloosahatchee Canal at Moore Haven, FL ............................................................234Caloosahatchee Canal at Ortona Lock near La Belle, FL ..............................................237Caloosahatchee River at S-79, near Olga, FL ........................................................240Canal 111 at S-18-C, near Florida City, FL .........................................................208C-111 Canal 100 ft below S-177 nr Homestead, FL(NAWQA) .............................................277Conservation Area No 1 below S-5 Complex, near Loxahatchee, FL ......................................70Courtney Canal at Cape Coral, FL ...................................................................252
Diversions to Conservation Area No 1 at S-5A and S-5A-S near Loxahatchee, FL ........................68Drainage Canal below G-136 near Clewiston, FL ......................................................158
E-3 Canal at NW 51st in Boca Raton, FL ............................................................102E-3 Canal at SW 18th St in Boca Raton, FL .........................................................113E-4 Canal at Clint-Moore Road in Boca Raton, FL ....................................................101Everglades 1 in C-111 Basin near Homestead, FL .....................................................214Everglades 2A in C-111 Basin near Homestead, FL ....................................................213Everglades 2B in C-111 Basin near Homestead, FL ....................................................212Everglades 3 in C-111 Basin near Homestead, FL .....................................................216Everglades 4 in C-111 Basin near Homestead, FL .....................................................215Everglades 5A in C-111 Basin near Homestead, FL ....................................................210Everglades 5B in C-111 Basin near Homestead, FL ....................................................211
Gator Slough at US 41 near Ft Myers, FL ............................................................261Gator Slough at SR 765 at Cape Coral, FL ...........................................................263
Hermosa Canal at Cape Coral, FL ....................................................................258Hillsboro Canal at S-6 near Shawano, FL .............................................................82Hillsboro Canal at S-6 near Shawano, FL (NAWQA) ....................................................270Hillsboro Canal at S-10-A near Deerfield Beach, FL .................................................107Hillsboro Canal at S-10-C near Deerfield Beach, FL ................................................105Hillsboro Canal at S-10-D near Deerfield Beach, FL .................................................103Hillsboro Canal below S-351 near South Bay, FL ......................................................80Hillsboro Canal near Margate, FL ....................................................................84Horseshoe Canal at Cape Coral, FL ..................................................................256
Imperial River near Bonita Springs, FL .............................................................221Industrial Canal at Clewiston, FL ...................................................................78
Kitchings Creek near Hobe Sound, FL .................................................................56
L-67 Extended Canal West near Florida City, FL .....................................................190Lake Trafford near Immokalee, FL ...................................................................220Levee 3 Canal below G-155 near Clewiston, FL .......................................................160Levee 4 Canal below G-88 near Clewiston, FL .......................................................162Levee 8 Canal at West Palm Beach near Loxahatchee, FL ...............................................71Levee 8 Canal near Canal Point, FL ..................................................................64Levee 31 North Extension at 1 mile near West Miami, FL .............................................198Levee 31 North Extension at 3 mile near West Miami, FL .............................................200Levee 31 North Extension at 4 mile near West Miami, FL .............................................202Levee 31 North Extension at 5 mile near West Miami, FL .............................................204Levee 31 North Extension at 7 mile near West Miami, FL .............................................206L-28 Interceptor Canal below S-190 near Clewiston, FL .............................................154L-28 Canal above S-140 near Clewiston, FL ..........................................................156Loxahatchee River near Jupiter, FL ..................................................................58
WATER RESOURCES DATA FOR FLORIDA, 2001 291
VOLUME 2A: SOUTH FLORIDA
INDEX TO SURFACE WATER SITES IN THIS REPORT--continuedPage
Meade Canal at Cape Coral, FL ......................................................................243Miami Canal at S-354 and S-3, at Lake Harbor, FL ...................................................137Miami Canal at NW 36th St near Miami, FL ...........................................................145Miami Canal at S-8 near Lake Harbor, FL ............................................................139Miami Canal East of Levee 30, near Miami, FL .......................................................141Middle River Canal at S-36, near Ft Lauderdale, FL ..................................................86
Northeast Shark River Slough #1 near Coopertown, FL ................................................189Northeast Shark River Slough #2 near Coopertown, FL ................................................188Northeast Shark River Slough #4, north of Grossman, FL .............................................192Northeast Shark River Slough #5, south of Grossman, FL .............................................193Northeast Shark River Slough east of L-67 extension near Richmond Heights, FL ......................191North Branch Estero River at Estero, FL ............................................................225North New River Canal at S-2 and S-351, near South Bay, FL ..........................................92North New River Canal at S-7 at Terrytown, FL .....................................................111North New River Canal at S-11-A near Andytown, FL ..................................................121North New River Canal at S-11-B near Andytown, FL ..................................................118North New River Canal at S-11-C near Andytown, FL ..................................................115North New River Canal below S-351, near South Bay, FL ...............................................95N.W. Wellfield Canal near Dade Broward Levee near Pennsuco, FL .....................................143
Plantation Road Canal at S-33, near Ft Lauderdale, FL ...............................................89
S-150 at Terrytown, FL ............................................................................109San Carlos Canal at Cape Coral, FL .................................................................249Shadroe Canal at Cape Coral, FL ....................................................................254Shark River99 Slough #1 in Cons. 3B near Coopertown, FL ............................................153Site 7 in Conservation Area No. 1 near Shawano, FL ..................................................97Site 8C near L-40 in Conservation Area No. 1 near Boynton Beach, FL .................................99Site 8T in Conservation Area No. 1 near Boynton Beach, FL ...........................................98Site 9 in Conservation Area No. 1 near Boynton Beach, FL ...........................................100Site 17 near L-38, Conservation Area 2A near Coral Springs, FL .....................................117Site 19 in Conservation Area 2A near Coral Springs, FL .............................................114Site 62 in Conservation Area 3A near Andytown, FL ..................................................123Site 63 in Conservation Area 3A near Andytown, FL ..................................................120Site 64 in Conservation Area 3A near Coopertown, FL ................................................129Site 65 in Conservation Area 3A near Coopertown, FL ................................................132Site 69 in Conservation Area 3B near Coopertown, FL ................................................130Site 71 in Conservation Area 3B near Coopertown, FL ................................................133Site 76 in Conservation Area 3B near Andytown, FL ..................................................128Site 99 near L-35A in Conservation Area 2B near Sunrise, FL ........................................124Sixmile Cypress Creek North near Ft Myers, FL ......................................................229Snake Creek Canal at NW 67th Ave near Hialeah, FL ..................................................134Snapper Creek Canal Extension at NW 74 St. near Hialeah, FL ........................................136South Branch Estero River at Estero, FL ............................................................227South New River Canal at S-13 near Davie, FL .......................................................125Spring Creek Headwater near Bonita Springs, FL .....................................................223St Lucie Canal at Lake Okeechobee, FL ...............................................................51St Lucie Canal at Lock near Stuart, FL ..............................................................53
Tamiami Canal at S-333, near Miami, FL .............................................................177Tamiami Canal at S-355A, near Miami, FL ............................................................180Tamiami Canal at S-355B, near Miami, FL ............................................................184Tamiami Canal below S-12-A, near Miami, FL .........................................................164Tamiami Canal below S-12-B, near Miami, FL .........................................................167Tamiami Canal below S-12-C, near Miami, FL .........................................................172Tamiami Canal below S-12-D, near Miami, FL .........................................................174Tamiami Canal near Coral Gables, FL ................................................................186Tamiami Canal Outlets, Levee 30 to Levee 67A, near Miami, FL .......................................182Tamiami Canal Outlets, Levee 67A to 40-Mile Bend near Miami, FL ....................................170Tamiami Canal Outlets, Monroe to Carnestown, FL ....................................................149Tamiami Canal Outlets, 40-Mile Bend to Monroe, FL ..................................................151Tenmile Canal at Control near Estero, FL ...........................................................232
West Palm Beach Canal above S-5A, near Loxahatchee, FL ..............................................66West Palm Beach Canal at S-352, at Canal Point, FL ..................................................61West Palm Beach Canal at West Palm Beach, FL ........................................................75West Palm Beach Canal Below S-5A-E near Loxahatchee, FL .............................................73Whiskey Creek at Ft. Myers, FL .....................................................................245