Water Resources in the IPCC Fourth Assessment Report Jean Palutikof Abstract The Intergovernmental Panel on Climate Change has recently published its Fourth Assessment Report. This presents an up-to-date assessment of the scientific literature on the physical basis of climate change (Working Group I), impacts, adaptation and vulnerability (Working Group II) and mitigation (Working Group III). Some 500 authors from around the world came together over a period of five years to write the three assessment reports, together with the Synthesis Report, each of which has undergone a rigorous process ofreview by experts and governments. The last publication of the Fourth Assessment will be a Technical Paper on ‘Climate Change and Water’. This is a distillation of all the material in the IPCC Assessment and Special Reports which deals with the topic, although naturally it focuses primarily on the Fourth Assessment, since this is the most up to date. It is expected to appear in August 2008, and will be translated into all the official UN languages. This paper presents the major findings of the IPCC Fourth Assessment as these relate to climate change and water resources. It looks at the process by which Assessment Reports are written, reviewed and approved. It reports briefly on the decisions made to date on the Fifth Assessment. Key Words: IPCC, climate change, water resources, water availability. 1. Background The Intergovernmental Panel on Climate Change (IPCC) published its Fourth Assessment in 2007. This presents an up-to-date assessment of the scientific literature on the physical basis of climate change (the Working Group I Report), impacts, adaptation and vulnerability (Working Group II) and mitigation (Working Group III). Some 500 authors from around the world came together over a period of 5 years to write the three working group reports which, together with the Synthesis Report, comprise the Fourth Assessment. Each report has undergone a rigorous process of review by experts and governments. As can be imagined, there is a great deal of material in the Fourth Assessment which relates to water resources and climate change. Therefore, the IPCC decided at its plenary meeting in 2002 that a Technical Paper would be prepared, drawing together the material in IPCC Assessment and Special Reports which relates to climate change and water. This was to be delivered by the writing team to the IPCC Bureau in spring 2008. 2. Introduction to the Technical Paper The last publication of the Fourth Assessment is the Technical Paper ‘Climate Change and Water’ which became available on-line in August 2008, and which was published as a paper volume in the English language in the same month. It will ultimately become available in all
Transcript
Water Resources in the IPCC Fourth Assessment Report
Jean Palutikof
Abstract
The Intergovernmental Panel on Climate Change has recently published its Fourth Assessment
Report This presents an up-to-date assessment of the scienti fic literature on the physical basis of climate change (Working Group I) impacts adaptation and vulnerability (Working Group II) and
mitigation (Working Group III) Some 500 authors from around the world came together over a period of five years to write the three assessment reports together with the Synthesis Report each of
which has undergone a rigorous process of review by experts and governments The last publication of the Fourth Assessment will be a Technical Paper on lsquoClimate Change and Waterrsquo This is a
distillation of all the material in the IPCC Assessment and Special Reports which deals with the topic although naturally it focuses primarily on the Fourth Assessment since this is the most up to date It
is expected to appear in August 2008 and will be translated into all the offi cial UN languages This paper presents the major findings of the IPCC Fourth Assessment as these relate to climate change
and water resources It looks at the process by which Assessment Reports are written reviewed and
approved It reports briefly on the decisions made to date on the Fifth Assessment
Key Words IPCC climate change water resources water availability
1 Background
The Intergovernmental Panel on Climate Change (IPCC) published its Fourth Assessment in
2007 This presents an up-to-date assessment of the scientific literature on the physical basis
of climate change (the Working Group I Report) impacts adaptation and vulnerability
(Working Group II) and mitigation (Working Group III) Some 500 authors from around the world came together over a period of 5 years to write the three working group reports which
together with the Synthesis Report comprise the Fourth Assessment Each report has
undergone a rigorous process of review by experts and governments
As can be imagined there is a great deal of material in the Fourth Assessment which relates to water resources and climate change Therefore the IPCC decided at its plenary meeting in
2002 that a Technical Paper would be prepared drawing together the material in IPCC
Assessment and Special Reports which relates to climate change and water This was to be
delivered by the writing team to the IPCC Bureau in spring 2008
2 Introduction to the Technical Paper
The last publication of the Fourth Assessment is the Technical Paper lsquoClimate Change and
Waterrsquo which became available on-line in August 2008 and which was published as a paper
volume in the English language in the same month It will ultimately become available in all
Water resources and IPCC
the official languages of the United Nations This is a distillation of all the material in the
IPCC Assessment and Special Reports which deals with the interrelationships between
climate change and water although naturally it focuses primarily on the Fourth Assessment since this is the most up-to-date The Technical Paper is available on the web site at
wwwipccch
The objectives of the Technical Paper are
1 To improve our understanding of the links of both natural and anthropogenically induced climate change its impacts and adaptation and mitigation response options
with water issues and
2 To inform policymakers and stakeholders about the implications of climate change and
climate change response options for water resources as well as the implications for
water resources of various climate change and climate change response options including associated synergies and trade-offs
There were 29 authors in the writing team for the Technical Paper drawn from some 20
different countries The team was led by Bryson Bates from Australia Zbigniew Kundzewicz
from Poland and Shaohong Wu from China The document underwent two stages of review the first by experts and government representatives and the second by government
representatives only The final step in the process of production was to place the document
before the IPCC Bureau whose members acted as an editorial committee as set out in the
Principles Governing IPCC Work and this took place at a meeting in Budapest in April 2008
In this overview we explore the major findings of the Paper as these appear in the Executive
Summary There are 15 key statements in the Technical Paper Executive Summary
3 Major findings of the Technical Paper
31 Statements related to the physical basis of climate change
Key statement 1 Observed warming over several decades has been linked to changes in
the large-scale hydrological cycle These changes include changes to precipitation amounts
and intensity changes to extremes such as droughts and floods as well as changes to cryospheric components such as reduced snow cover and widespread melting of ice During
the 20th century in general precipitation increased over land in high northern latitudes but
decreases dominated from 10degS to 30degN from the 1970s onwards Extremes of both high
rainfall events and of drought are expected to become more severe where high rainfall events
are measured as the proportion of total rainfall from heavy falls and drought is measured by the area of land classified as very dry There have been significant decreases in water storage
in mountain glaciers and Northern Hemisphere snow cover
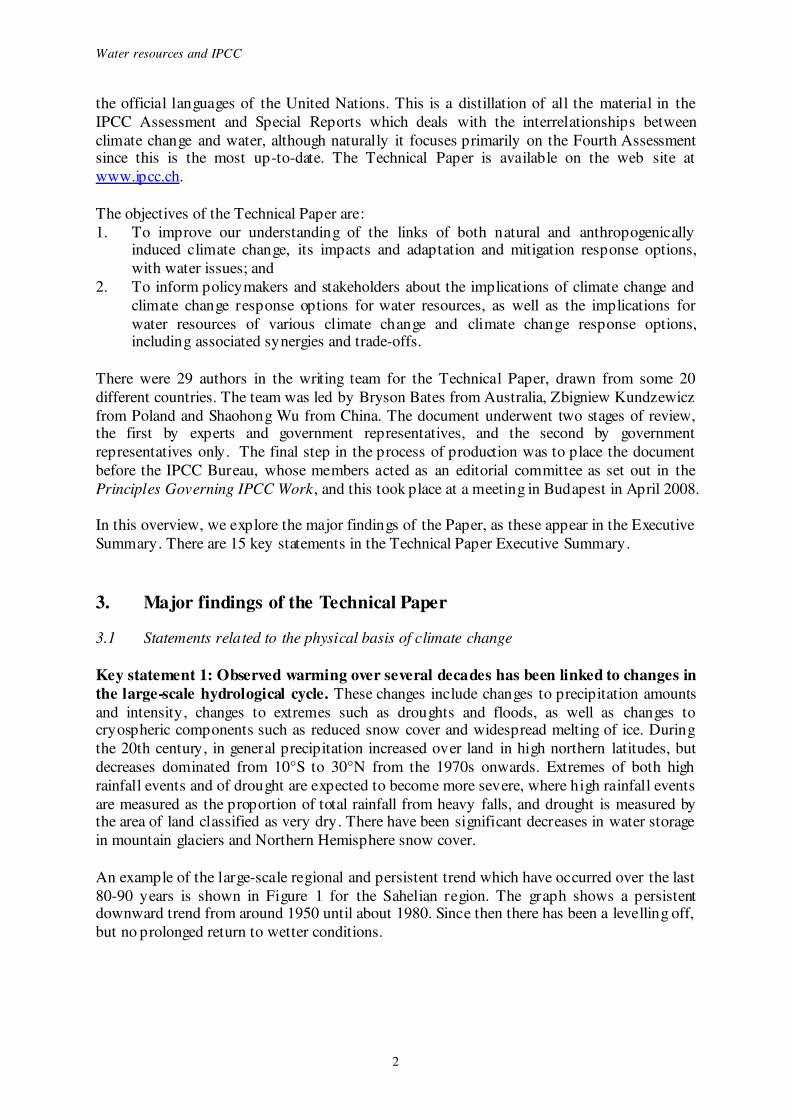
An example of the large-scale regional and persistent trend which have occurred over the last
80-90 years is shown in Figure 1 for the Sahelian region The graph shows a persistent downward trend from around 1950 until about 1980 Since then there has been a levelling off
but no prolonged return to wetter conditions
2
Water resources and IPCC
Figure 1 Normalised rainfall index for the Sahelian region of West Africa
Key statement 2 Climate model simulations for the 21st century are consistent in
projecting precipitation increases in high latitudes and parts of the tropics and decreases in some subtropical and lower mid-latitude region Outside these areas there is
substantial uncertainty in precipitation projections
Key statement 3 By the middle of the 21st century annual average river runoff and
water availability are projected to increase as a result of climate change at high latitudes and in some wet tropical areas and decrease over some dry regions at midshy
latitudes and in the dry tropics Many semi-arid and arid areas (eg the Mediterranean
basin western USA southern Africa and north-eastern Brazil) are particularly exposed to the
impacts of climate change and are projected to suffer a decrease of water resources due to
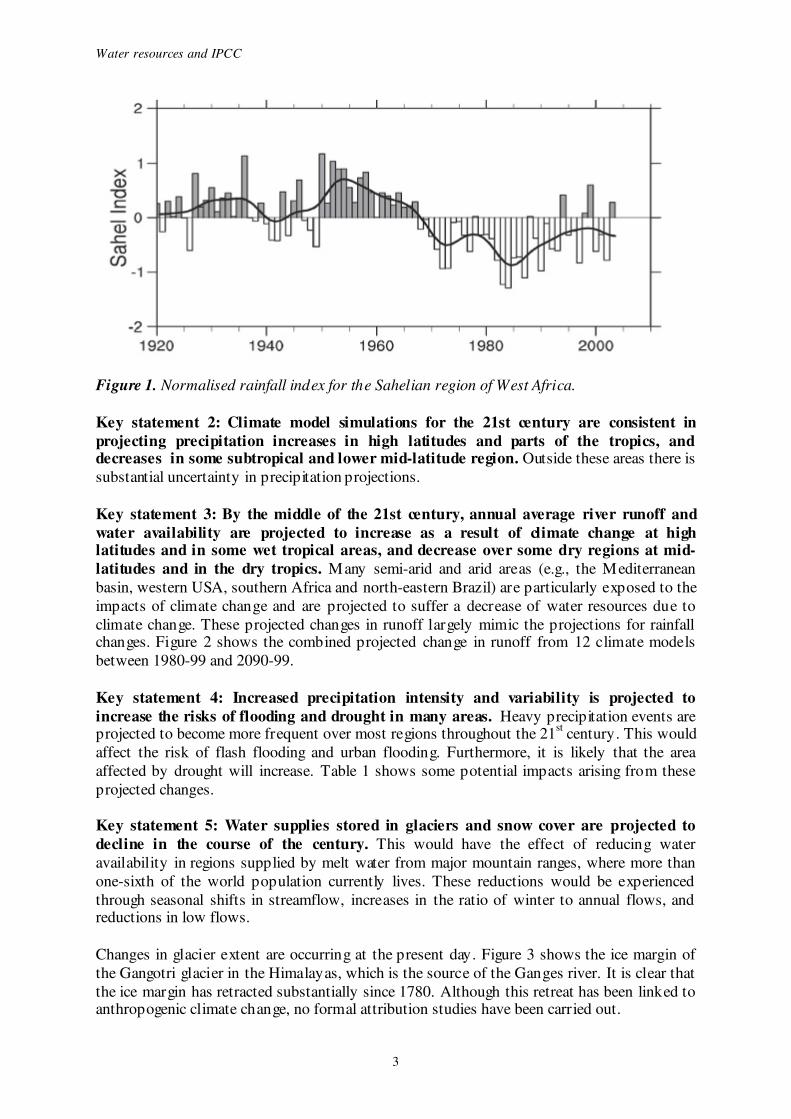
climate change These projected changes in runoff largely mimic the projections for rainfall changes Figure 2 shows the combined projected change in runoff from 12 climate models
between 1980-99 and 2090-99
Key statement 4 Increased precipitation intensity and variability is projected to
increase the risks of flooding and drought in many areas Heavy precipitation events are projected to become more frequent over most regions throughout the 21
st century This would
affect the risk of flash flooding and urban flooding Furthermore it is likely that the area
affected by drought will increase Table 1 shows some potential impacts arising from these
projected changes
Key statement 5 Water supplies stored in glaciers and snow cover are projected to
decline in the course of the century This would have the effect of reducing water
availability in regions supplied by melt water from major mountain ranges where more than
one-sixth of the world population currently lives These reductions would be experienced
through seasonal shifts in streamflow increases in the ratio of winter to annual flows and reductions in low flows
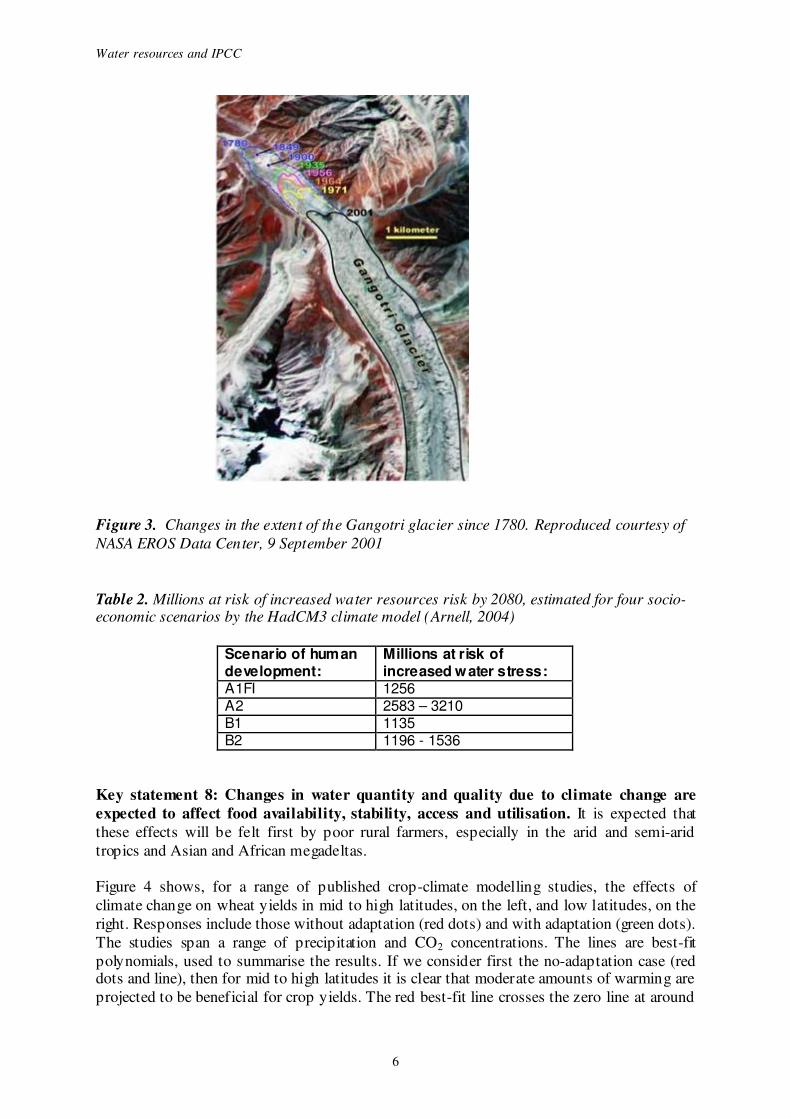
Changes in glacier extent are occurring at the present day Figure 3 shows the ice margin of
the Gangotri glacier in the Himalayas which is the source of the Ganges river It is clear that
the ice margin has retracted substantially since 1780 Although this retreat has been linked to anthropogenic climate change no formal attribution studies have been carried out
3
Water resources and IPCC
Figure 2 Ensemble-mean percentage projected change in annual mean runoff between 1980shy99 and 2090-99 Hatched areas indicate high model agreement (more than 90 of models
agree) white areas are where there is low agreement between models fewer than 66 of
models agree) (after Milly et al 2005) [TP1
Figure 210]
32 Statements related to climate change impacts
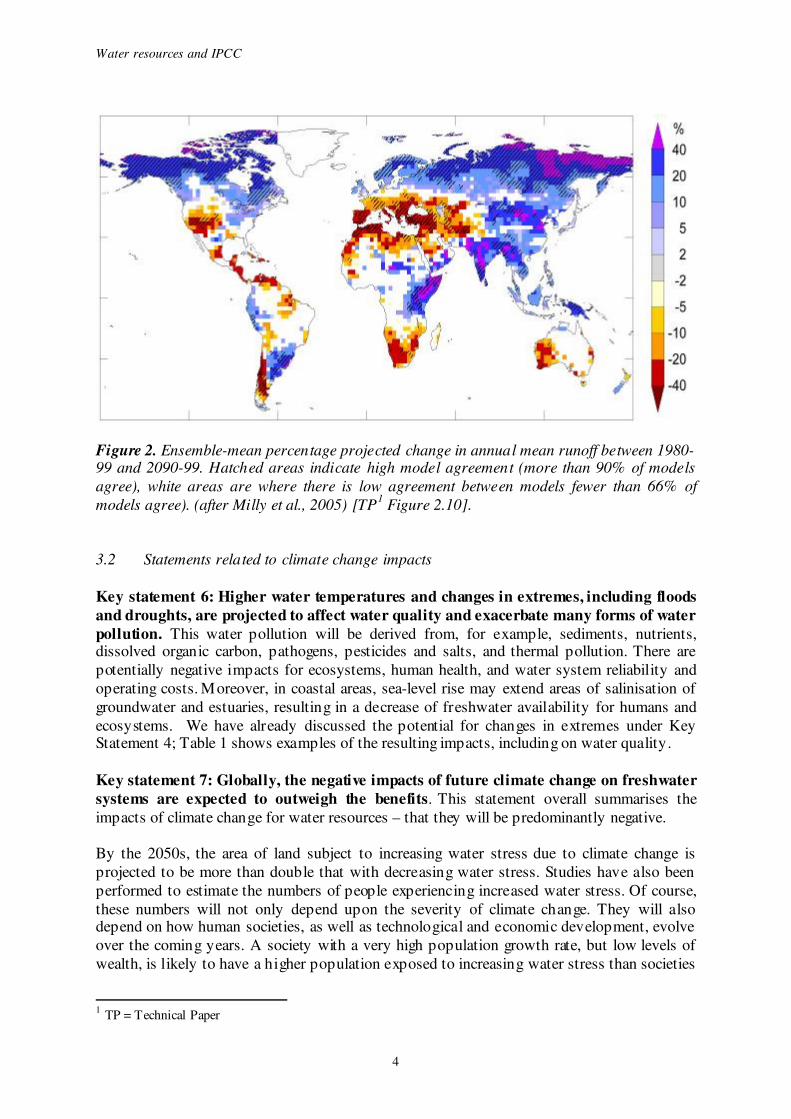
Key statement 6 Higher water temperatures and changes in extremes including floods
and droughts are projected to affect water quality and exacerbate many forms of water
pollution This water pollution will be derived from for example sediments nutrients dissolved organic carbon pathogens pesticides and salts and thermal pollution There are
potentially negative impacts for ecosystems human health and water system reliability and
operating costs Moreover in coastal areas sea-level rise may extend areas of salinisation of
groundwater and estuaries resulting in a decrease of freshwater availability for humans and
ecosystems We have already discussed the potential for changes in extremes under Key Statement 4 Table 1 shows examples of the resulting impacts including on water quality
Key statement 7 Globally the negative impacts of future climate change on freshwater
systems are expected to outweigh the benefits This statement overall summarises the
impacts of climate change for water resources ndash that they will be predominantly negative
By the 2050s the area of land subject to increasing water stress due to climate change is
projected to be more than double that with decreasing water stress Studies have also been
performed to estimate the numbers of people experiencing increased water stress Of course
these numbers will not only depend upon the severity of climate change They will also depend on how human societies as well as technological and economic development evolve
over the coming years A society with a very high population growth rate but low levels of
wealth is likely to have a higher population exposed to increasing water stress than societies
1 TP = Technical Paper
4
Water resources and IPCC
with lower population growth rates and greater wealth This concept is clearly illustrated in
Table 2 below This shows the people at risk of increased water stress at three dates in the
future and for four scenarios of future human development These are the SRES scenarios as set out in the IPCC Special Report on Emissions Scenarios Population growth is highest in
the A2 scenario and lowest in the B1 and B2 scenarios Thus the population at risk reflects
not only the extent of climate change but also to an equal or even greater extent the
influence of the socio-economic scenario
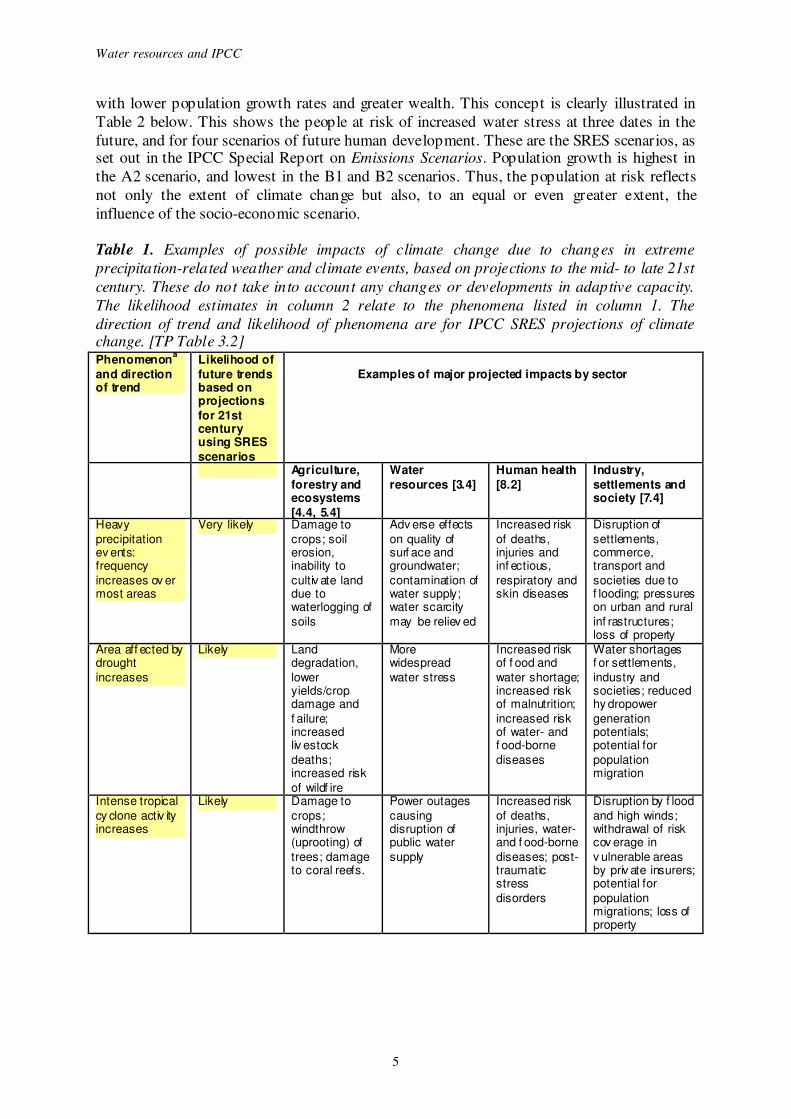
Table 1 Examples of possible impacts of climate change due to changes in extreme
precipitation-related weather and climate events based on projections to the mid- to late 21st
century These do not take into account any changes or developments in adaptive capacity
The likelihood estimates in column 2 relate to the phenomena listed in column 1 The
direction of trend and likelihood of phenomena are for IPCC SRES projections of climate change [TP Table 32] Phenomenon
a
and direction of trend
Likelihood of
future trends based on projections
for 21st century using SRES
scenarios
Examples of major projected impacts by sector
Agriculture Water Human health Industry
forestry and resources [34] [82] settlements and ecosystems society [74]
[44 54] Heavy
precipitation ev ents frequency
increases ov er most areas
Very likely Damage to
crops soil erosion inability to
cultiv ate land due to waterlogging of
soils
Adv erse effects
on quality of surf ace and groundwater
contamination of water supply water scarcity
may be reliev ed
Increased risk
of deaths injuries and inf ectious
respiratory and skin diseases
Disruption of
settlements commerce transport and
societies due to f looding pressures on urban and rural
inf rastructures loss of property
Area aff ected by drought
increases
Likely Land degradation
lower yieldscrop damage and
f ailure increased liv estock
deaths increased risk
of wildf ire
More widespread
water stress
Increased risk of f ood and
water shortage increased risk of malnutrition
increased risk of water- and f ood-borne
diseases
Water shortages f or settlements
industry and societies reduced hy dropower
generation potentials potential for
population migration
Intense tropical Likely Damage to Power outages Increased risk Disruption by f lood
cy clone activ ity crops causing of deaths and high winds increases windthrow
(uprooting) of
trees damage to coral reefs
disruption of public water
supply
injuries watershyand f ood-borne
diseases postshytraumatic stress
disorders
withdrawal of risk cov erage in
v ulnerable areas by priv ate insurers potential for
population migrations loss of property
5
Water resources and IPCC
Figure 3 Changes in the extent of the Gangotri glacier since 1780 Reproduced courtesy of
NASA EROS Data Center 9 September 2001
Table 2 Millions at risk of increased water resources risk by 2080 estimated for four socioshyeconomic scenarios by the HadCM3 climate model (Arnell 2004)
Key statement 8 Changes in water quantity and quality due to climate change are
expected to affect food availability stability access and utilisation It is expected that
these effects will be felt first by poor rural farmers especially in the arid and semi-arid
tropics and Asian and African megadeltas
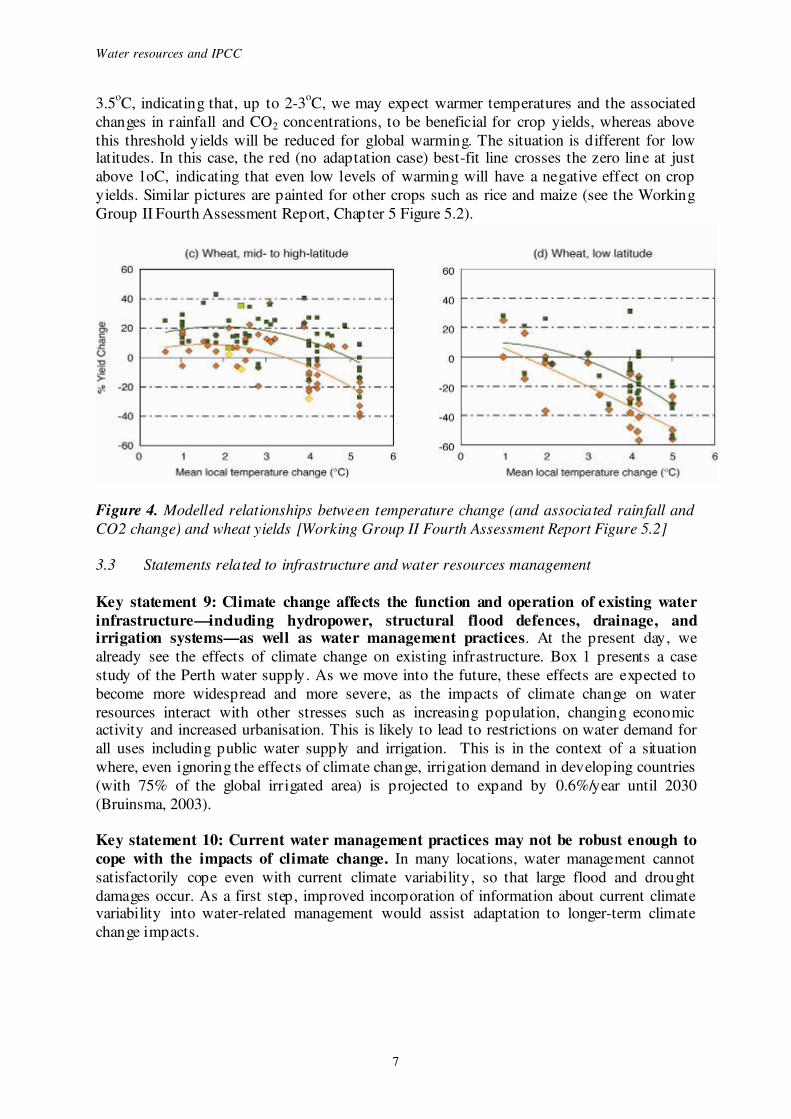
Figure 4 shows for a range of published crop-climate modelling studies the effects of
climate change on wheat yields in mid to high latitudes on the left and low latitudes on the
right Responses include those without adaptation (red dots) and with adaptation (green dots)
The studies span a range of precipitation and CO2 concentrations The lines are best-fit
polynomials used to summarise the results If we consider first the no-adaptation case (red dots and line) then for mid to high latitudes it is clear that moderate amounts of warming are
projected to be beneficial for crop yields The red best-fit line crosses the zero line at around
6
Water resources and IPCC
35oC indicating that up to 2-3
oC we may expect warmer temperatures and the associated
changes in rainfall and CO2 concentrations to be beneficial for crop yields whereas above
this threshold yields will be reduced for global warming The situation is different for low latitudes In this case the red (no adaptation case) best-fit line crosses the zero line at just
above 1oC indicating that even low levels of warming will have a negative effect on crop
yields Similar pictures are painted for other crops such as rice and maize (see the Working
Group II Fourth Assessment Report Chapter 5 Figure 52)
Figure 4 Modelled relationships between temperature change (and associated rainfall and
CO2 change) and wheat yields [Working Group II Fourth Assessment Report Figure 52]
33 Statements related to infrastructure and water resources management
Key statement 9 Climate change affects the function and operation of existing water
infrastructuremdashincluding hydropower structural flood defences drainage and irrigation systemsmdashas well as water management practices At the present day we
already see the effects of climate change on existing infrastructure Box 1 presents a case
study of the Perth water supply As we move into the future these effects are expected to
become more widespread and more severe as the impacts of climate change on water
resources interact with other stresses such as increasing population changing economic activity and increased urbanisation This is likely to lead to restrictions on water demand for
all uses including public water supply and irrigation This is in the context of a situation
where even ignoring the effects of climate change irrigation demand in developing countries
(with 75 of the global irrigated area) is projected to expand by 06year until 2030
(Bruinsma 2003)
Key statement 10 Current water management practices may not be robust enough to
cope with the impacts of climate change In many locations water management cannot
satisfactorily cope even with current climate variability so that large flood and drought
damages occur As a first step improved incorporation of information about current climate variability into water-related management would assist adaptation to longer-term climate
change impacts
7
Water resources and IPCC
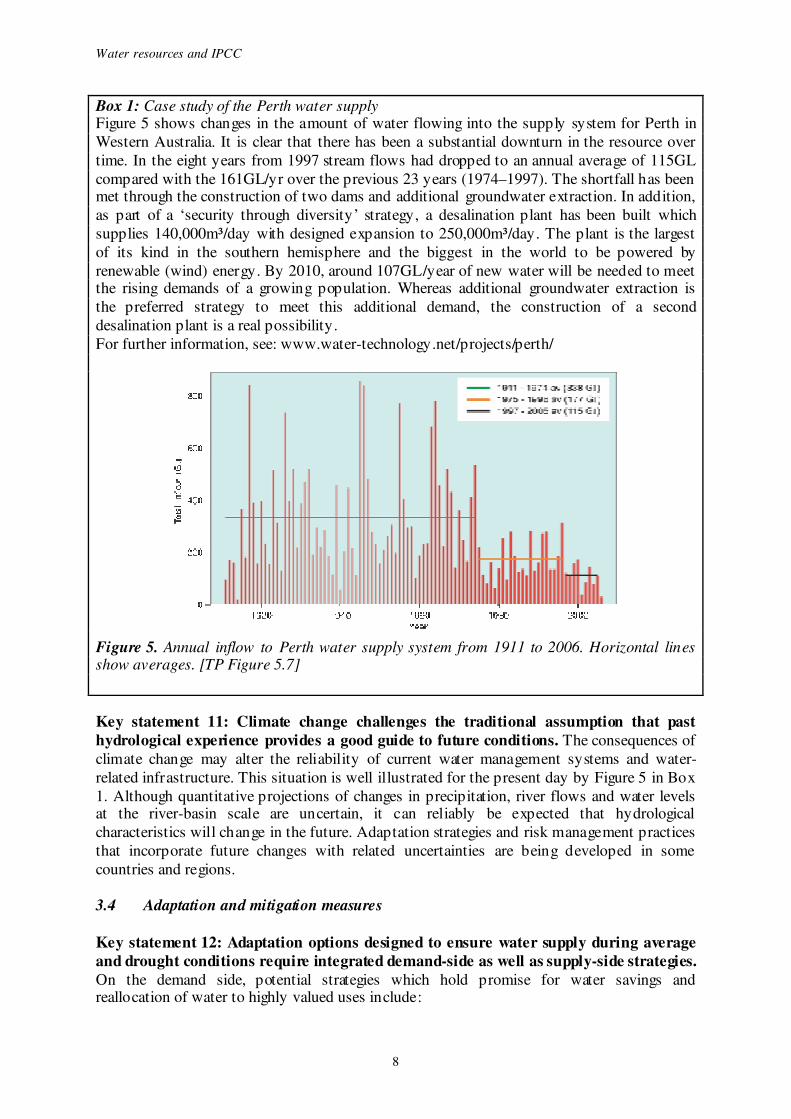
Box 1 Case study of the Perth water supply Figure 5 shows changes in the amount of water flowing into the supply system for Perth in
Western Australia It is clear that there has been a substantial downturn in the resource over
time In the eight years from 1997 stream flows had dropped to an annual average of 115GL
compared with the 161GLyr over the previous 23 years (1974ndash1997) The shortfall has been met through the construction of two dams and additional groundwater extraction In addition
as part of a lsquosecurity through diversityrsquo strategy a desalination plant has been built which
supplies 140000msup3day with designed expansion to 250000msup3day The plant is the largest
of its kind in the southern hemisphere and the biggest in the world to be powered by
renewable (wind) energy By 2010 around 107GLyear of new water will be needed to meet the rising demands of a growing population Whereas additional groundwater extraction is
the preferred strategy to meet this additional demand the construction of a second
desalination plant is a real possibility
For further information see wwwwater-technologynetprojectsperth
Figure 5 Annual inflow to Perth water supply system from 1911 to 2006 Horizontal lines show averages [TP Figure 57]
Key statement 11 Climate change challenges the traditional assumption that past
hydrological experience provides a good guide to future conditions The consequences of
climate change may alter the reliability of current water management systems and watershy
related infrastructure This situation is well illustrated for the present day by Figure 5 in Box
1 Although quantitative projections of changes in precipitation river flows and water levels at the river-basin scale are uncertain it can reliably be expected that hydrological
characteristics will change in the future Adaptation strategies and risk management practices
that incorporate future changes with related uncertainties are being developed in some
countries and regions
34 Adaptation and mitigation measures
Key statement 12 Adaptation options designed to ensure water supply during average
and drought conditions require integrated demand-side as well as supply-side strategies
On the demand side potential strategies which hold promise for water savings and reallocation of water to highly valued uses include
8
Water resources and IPCC
bull improved water-use efficiency eg by recycling water
bull expanded use of economic incentives including metering and pricing to encourage water conservation and
bull development of water markets and implementation of virtual water trade
Supply-side strategies include
bull increases in storage capacity
bull abstraction from water courses and
bull water transfers
Integrated water resources management provides an important framework to achieve
adaptation measures across socio-economic environmental and administrative systems
Successful integrated water management strategies include among others capturing societyrsquos
views reshaping planning processes co-ordinating land and water resources management protecting and restoring natural systems recognising water quantity and water quality
linkages and including considerations of climate change In particular an integrated approach
to water management could help to resolve conflicts between competing water users In
several places in the western USA water managers and various interest groups have been
experimenting with methods to promote consensus-based decision making which takes into account the need for sustainable water use
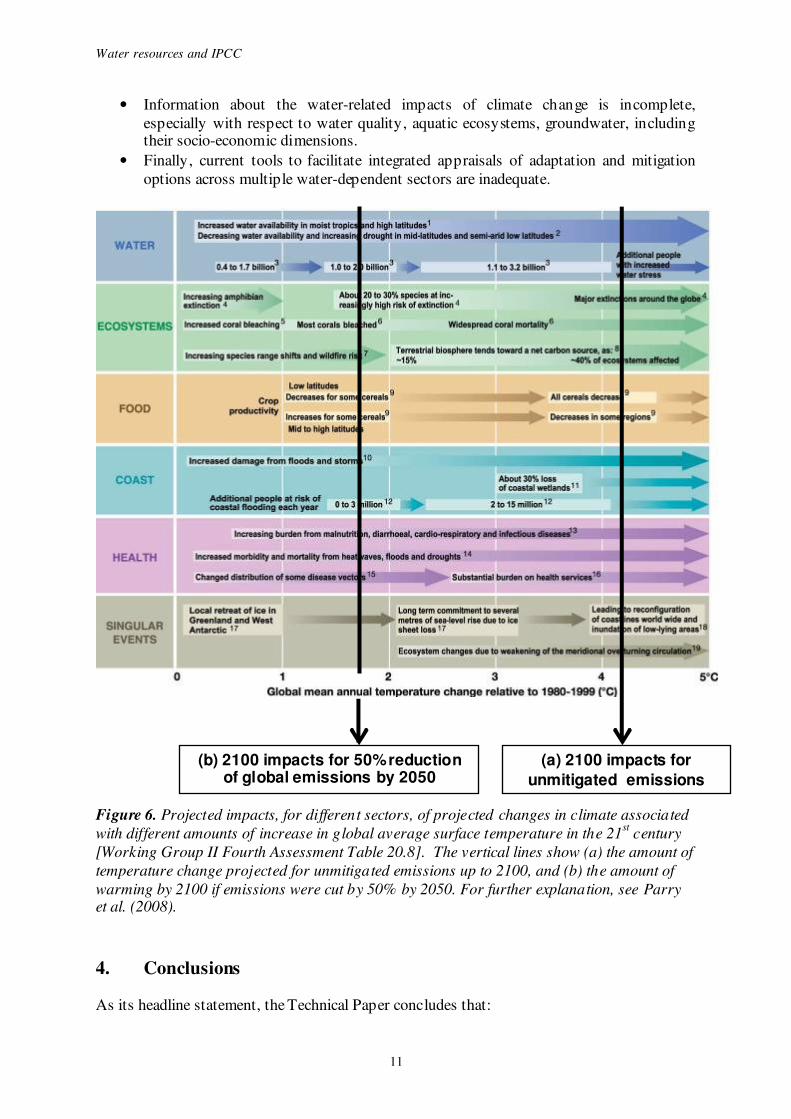
Key statement 13 Mitigation measures can reduce the magnitude of impacts of global
warming on water resources in turn reducing adaptation needs Figure 6 shows for a
range of sectors the expected impacts scaled against climate change By plotting the unmitigated temperature change by 2100 (line a) on this figure we can see the impacts likely
to be experienced by that date if no efforts are made to reduce our emissions of greenhouse
gases Line b shows the temperature change by 2100 if mitigation measures are put in place
specifically a 50 cut in emissions by 2050 To explore further mitigation scenarios the
reader is referred to Parry et al (2008)
However it should be noted that mitigation measures can in themselves have considerable
negative side effects such as increased water requirements for afforestationreforestation
activities or bio-energy crops if these are not sustainably located designed and managed
35 Climate change water resources sustainability and knowledge
Key statement 14 Water resources management clearly impacts on many other policy
areas such as energy health food security nature conservation In designing adaptation and mitigation measures to address climate change care must be taken to ensure that they interact
favourably with the need for sustainable development Low-income countries and regions are
likely to remain vulnerable over the medium term with fewer options than high-income
countries for adapting to climate change
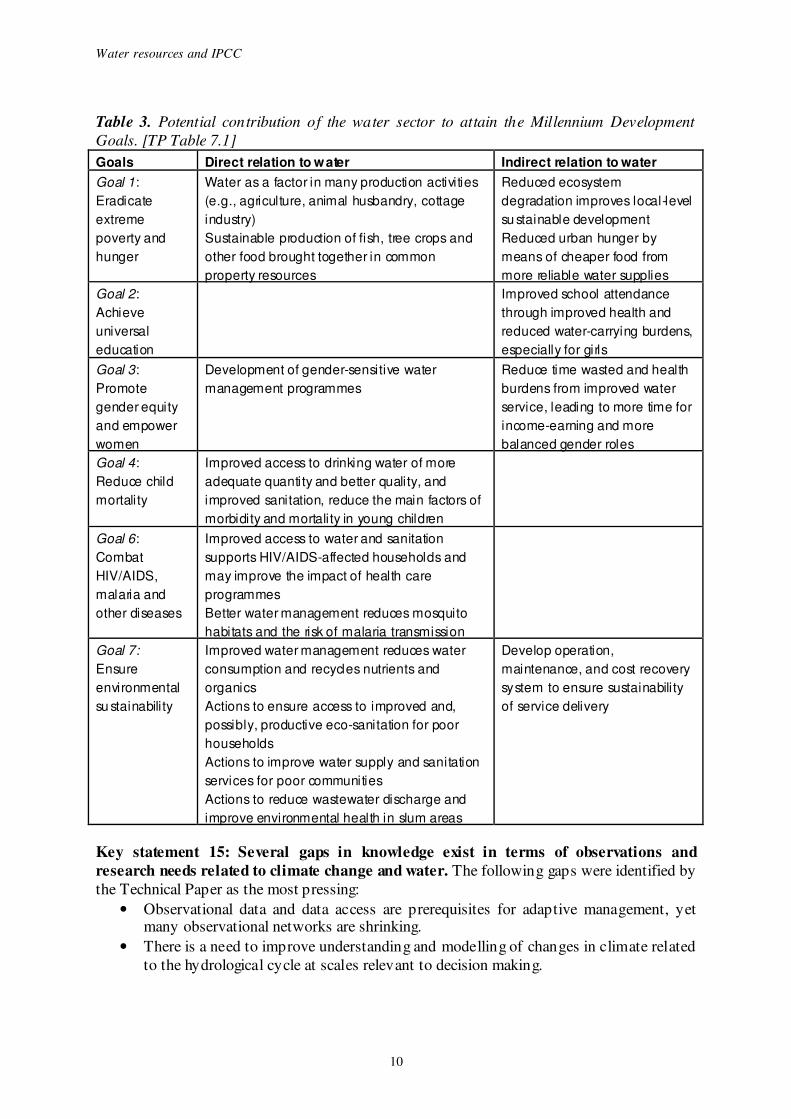
As an example of the interrelationships between water resources management under climate
change and sustainable development Table 3 shows how sustainable management of water
can contribute to the achievement of the Millennium Development Goals
9
Water resources and IPCC
Table 3 Potential contribution of the water sector to attain the Millennium Development
Goals [TP Table 71]
Goals Direct relation to w ater Indirect relation to water
Goal 1 Water as a factor in many production activities Reduced ecosystem
poverty and Sustainable production of fish tree crops and Reduced urban hunger by
hunger other food brought together in common
property resources
means of cheaper food from
more reliable water supplies
Goal 2 Improved school attendance
Achieve through improved health and
universal reduced water-carrying burdens
education especially for girls
Goal 3
Promote
gender equity
and empower
women
Development of gender-sensitive water
management programmes
Reduce time wasted and health
burdens from improved water
service leading to more time for
income-earning and more
balanced gender roles
Goal 4 Improved access to drinking water of more
Reduce child adequate quantity and better quality and
mortality improved sanitation reduce the main factors of
morbidity and mortality in young children
Goal 6
Combat
HIVAIDS
malaria and
other diseases
Improved access to water and sanitation
supports HIVAIDS-affected households and
may improve the impact of health care
programmes
Better water management reduces mosquito
habitats and the risk of malaria transmission
Goal 7
Ensure
environmental
su stainability
Improved water management reduces water
consumption and recycles nutrients and
organics
Actions to ensure access to improved and
possibly productive eco-sanitation for poor
households
Actions to improve water supply and sanitation
services for poor communities
Actions to reduce wastewater discharge and
improve environmental health in slum areas
Develop operation
maintenance and cost recovery
system to ensure sustainability
of service delivery
Key statement 15 Several gaps in knowledge exist in terms of observations and
research needs related to climate change and water The following gaps were identified by
the Technical Paper as the most pressing
bull Observational data and data access are prerequisites for adaptive management yet many observational networks are shrinking
bull There is a need to improve understanding and modelling of changes in climate related
to the hydrological cycle at scales relevant to decision making
10
Water resources and IPCC
bull Information about the water-related impacts of climate change is incomplete
especially with respect to water quality aquatic ecosystems groundwater including their socio-economic dimensions
bull Finally current tools to facilitate integrated appraisals of adaptation and mitigation
options across multiple water-dependent sectors are inadequate
Figure 6 Projected impacts for different sectors of projected changes in climate associated
with different amounts of increase in global average surface temperature in the 21st
century
[Working Group II Fourth Assessment Table 208] The vertical lines show (a) the amount of
temperature change projected for unmitigated emissions up to 2100 and (b) the amount of
warming by 2100 if emissions were cut by 50 by 2050 For further explanation see Parry et al (2008)
4 Conclusions
As its headline statement the Technical Paper concludes that
(b) 2100 impacts for 50reduction of global emissions by 2050
(a) 2100 impacts for
unmitigated emissions
11
Water resources and IPCC
Observational records and climate projections provide abundant evidence
that freshwater resources are vulnerable and have the potential to be
strongly impacted by climate change with wide-ranging consequences on human societies and ecosystems
The 180-page Technical Paper is a compact and integrated publication focussed on water and
climate change which summarises and synthesises the latest results from all IPCC Working
Groups on Climate Change and Water It is targeted not only at policymakers in government but also at the science community NGOs and the media As such the language is crafted to
be accessible to the general reader with an interest in climate change It will be printed and
distributed by the IPCC Secretariat free of charge and translated into all UN languages
making it a readily-available primer on the current knowledge of climate change and water
References
Arnell NW 2004 Climate change and global water resources SRES emissions and socio economic scenarios Global Environmental Change 14 31ndash52
Bruinsma J 2003 World Agriculture Towards 20152030 An FAO Perspective Earthscan UK
444 pp Milly PCD KA Dunne and AV Vecchia 2005 Global pattern of trends in streamflow and water
availability in a changing climate Nature 438(7066) 347ndash350
Parry ML Palutikof JP Hanson CE and Lowe J 2008 Climate policy squaring up to reality Nature Reports Climate Change Published online 29 May 2008 doi101038climate200850
The Technical Paper should be cited as
Bates BC ZW Kundzewicz S Wu and JP Palutikof Eds 2008 Climate Change and
Water Technical Paper of the Intergovernmental Panel on Climate Change IPCC
Secretariat Geneva 210 pp
12
Water resources and IPCC
the official languages of the United Nations This is a distillation of all the material in the
IPCC Assessment and Special Reports which deals with the interrelationships between
climate change and water although naturally it focuses primarily on the Fourth Assessment since this is the most up-to-date The Technical Paper is available on the web site at
wwwipccch
The objectives of the Technical Paper are
1 To improve our understanding of the links of both natural and anthropogenically induced climate change its impacts and adaptation and mitigation response options
with water issues and
2 To inform policymakers and stakeholders about the implications of climate change and
climate change response options for water resources as well as the implications for
water resources of various climate change and climate change response options including associated synergies and trade-offs
There were 29 authors in the writing team for the Technical Paper drawn from some 20
different countries The team was led by Bryson Bates from Australia Zbigniew Kundzewicz
from Poland and Shaohong Wu from China The document underwent two stages of review the first by experts and government representatives and the second by government
representatives only The final step in the process of production was to place the document
before the IPCC Bureau whose members acted as an editorial committee as set out in the
Principles Governing IPCC Work and this took place at a meeting in Budapest in April 2008
In this overview we explore the major findings of the Paper as these appear in the Executive
Summary There are 15 key statements in the Technical Paper Executive Summary
3 Major findings of the Technical Paper
31 Statements related to the physical basis of climate change
Key statement 1 Observed warming over several decades has been linked to changes in
the large-scale hydrological cycle These changes include changes to precipitation amounts
and intensity changes to extremes such as droughts and floods as well as changes to cryospheric components such as reduced snow cover and widespread melting of ice During
the 20th century in general precipitation increased over land in high northern latitudes but
decreases dominated from 10degS to 30degN from the 1970s onwards Extremes of both high
rainfall events and of drought are expected to become more severe where high rainfall events
are measured as the proportion of total rainfall from heavy falls and drought is measured by the area of land classified as very dry There have been significant decreases in water storage
in mountain glaciers and Northern Hemisphere snow cover
An example of the large-scale regional and persistent trend which have occurred over the last
80-90 years is shown in Figure 1 for the Sahelian region The graph shows a persistent downward trend from around 1950 until about 1980 Since then there has been a levelling off
but no prolonged return to wetter conditions
2
Water resources and IPCC
Figure 1 Normalised rainfall index for the Sahelian region of West Africa
Key statement 2 Climate model simulations for the 21st century are consistent in
projecting precipitation increases in high latitudes and parts of the tropics and decreases in some subtropical and lower mid-latitude region Outside these areas there is
substantial uncertainty in precipitation projections
Key statement 3 By the middle of the 21st century annual average river runoff and
water availability are projected to increase as a result of climate change at high latitudes and in some wet tropical areas and decrease over some dry regions at midshy
latitudes and in the dry tropics Many semi-arid and arid areas (eg the Mediterranean
basin western USA southern Africa and north-eastern Brazil) are particularly exposed to the
impacts of climate change and are projected to suffer a decrease of water resources due to
climate change These projected changes in runoff largely mimic the projections for rainfall changes Figure 2 shows the combined projected change in runoff from 12 climate models
between 1980-99 and 2090-99
Key statement 4 Increased precipitation intensity and variability is projected to
increase the risks of flooding and drought in many areas Heavy precipitation events are projected to become more frequent over most regions throughout the 21
st century This would
affect the risk of flash flooding and urban flooding Furthermore it is likely that the area
affected by drought will increase Table 1 shows some potential impacts arising from these
projected changes
Key statement 5 Water supplies stored in glaciers and snow cover are projected to
decline in the course of the century This would have the effect of reducing water
availability in regions supplied by melt water from major mountain ranges where more than
one-sixth of the world population currently lives These reductions would be experienced
through seasonal shifts in streamflow increases in the ratio of winter to annual flows and reductions in low flows
Changes in glacier extent are occurring at the present day Figure 3 shows the ice margin of
the Gangotri glacier in the Himalayas which is the source of the Ganges river It is clear that
the ice margin has retracted substantially since 1780 Although this retreat has been linked to anthropogenic climate change no formal attribution studies have been carried out
3
Water resources and IPCC
Figure 2 Ensemble-mean percentage projected change in annual mean runoff between 1980shy99 and 2090-99 Hatched areas indicate high model agreement (more than 90 of models
agree) white areas are where there is low agreement between models fewer than 66 of
models agree) (after Milly et al 2005) [TP1
Figure 210]
32 Statements related to climate change impacts
Key statement 6 Higher water temperatures and changes in extremes including floods
and droughts are projected to affect water quality and exacerbate many forms of water
pollution This water pollution will be derived from for example sediments nutrients dissolved organic carbon pathogens pesticides and salts and thermal pollution There are
potentially negative impacts for ecosystems human health and water system reliability and
operating costs Moreover in coastal areas sea-level rise may extend areas of salinisation of
groundwater and estuaries resulting in a decrease of freshwater availability for humans and
ecosystems We have already discussed the potential for changes in extremes under Key Statement 4 Table 1 shows examples of the resulting impacts including on water quality
Key statement 7 Globally the negative impacts of future climate change on freshwater
systems are expected to outweigh the benefits This statement overall summarises the
impacts of climate change for water resources ndash that they will be predominantly negative
By the 2050s the area of land subject to increasing water stress due to climate change is
projected to be more than double that with decreasing water stress Studies have also been
performed to estimate the numbers of people experiencing increased water stress Of course
these numbers will not only depend upon the severity of climate change They will also depend on how human societies as well as technological and economic development evolve
over the coming years A society with a very high population growth rate but low levels of
wealth is likely to have a higher population exposed to increasing water stress than societies
1 TP = Technical Paper
4
Water resources and IPCC
with lower population growth rates and greater wealth This concept is clearly illustrated in
Table 2 below This shows the people at risk of increased water stress at three dates in the
future and for four scenarios of future human development These are the SRES scenarios as set out in the IPCC Special Report on Emissions Scenarios Population growth is highest in
the A2 scenario and lowest in the B1 and B2 scenarios Thus the population at risk reflects
not only the extent of climate change but also to an equal or even greater extent the
influence of the socio-economic scenario
Table 1 Examples of possible impacts of climate change due to changes in extreme
precipitation-related weather and climate events based on projections to the mid- to late 21st
century These do not take into account any changes or developments in adaptive capacity
The likelihood estimates in column 2 relate to the phenomena listed in column 1 The
direction of trend and likelihood of phenomena are for IPCC SRES projections of climate change [TP Table 32] Phenomenon
a
and direction of trend
Likelihood of
future trends based on projections
for 21st century using SRES
scenarios
Examples of major projected impacts by sector
Agriculture Water Human health Industry
forestry and resources [34] [82] settlements and ecosystems society [74]
[44 54] Heavy
precipitation ev ents frequency
increases ov er most areas
Very likely Damage to
crops soil erosion inability to
cultiv ate land due to waterlogging of
soils
Adv erse effects
on quality of surf ace and groundwater
contamination of water supply water scarcity
may be reliev ed
Increased risk
of deaths injuries and inf ectious
respiratory and skin diseases
Disruption of
settlements commerce transport and
societies due to f looding pressures on urban and rural
inf rastructures loss of property
Area aff ected by drought
increases
Likely Land degradation
lower yieldscrop damage and
f ailure increased liv estock
deaths increased risk
of wildf ire
More widespread
water stress
Increased risk of f ood and
water shortage increased risk of malnutrition
increased risk of water- and f ood-borne
diseases
Water shortages f or settlements
industry and societies reduced hy dropower
generation potentials potential for
population migration
Intense tropical Likely Damage to Power outages Increased risk Disruption by f lood
cy clone activ ity crops causing of deaths and high winds increases windthrow
(uprooting) of
trees damage to coral reefs
disruption of public water
supply
injuries watershyand f ood-borne
diseases postshytraumatic stress
disorders
withdrawal of risk cov erage in
v ulnerable areas by priv ate insurers potential for
population migrations loss of property
5
Water resources and IPCC
Figure 3 Changes in the extent of the Gangotri glacier since 1780 Reproduced courtesy of
NASA EROS Data Center 9 September 2001
Table 2 Millions at risk of increased water resources risk by 2080 estimated for four socioshyeconomic scenarios by the HadCM3 climate model (Arnell 2004)
Key statement 8 Changes in water quantity and quality due to climate change are
expected to affect food availability stability access and utilisation It is expected that
these effects will be felt first by poor rural farmers especially in the arid and semi-arid
tropics and Asian and African megadeltas
Figure 4 shows for a range of published crop-climate modelling studies the effects of
climate change on wheat yields in mid to high latitudes on the left and low latitudes on the
right Responses include those without adaptation (red dots) and with adaptation (green dots)
The studies span a range of precipitation and CO2 concentrations The lines are best-fit
polynomials used to summarise the results If we consider first the no-adaptation case (red dots and line) then for mid to high latitudes it is clear that moderate amounts of warming are
projected to be beneficial for crop yields The red best-fit line crosses the zero line at around
6
Water resources and IPCC
35oC indicating that up to 2-3
oC we may expect warmer temperatures and the associated
changes in rainfall and CO2 concentrations to be beneficial for crop yields whereas above
this threshold yields will be reduced for global warming The situation is different for low latitudes In this case the red (no adaptation case) best-fit line crosses the zero line at just
above 1oC indicating that even low levels of warming will have a negative effect on crop
yields Similar pictures are painted for other crops such as rice and maize (see the Working
Group II Fourth Assessment Report Chapter 5 Figure 52)
Figure 4 Modelled relationships between temperature change (and associated rainfall and
CO2 change) and wheat yields [Working Group II Fourth Assessment Report Figure 52]
33 Statements related to infrastructure and water resources management
Key statement 9 Climate change affects the function and operation of existing water
infrastructuremdashincluding hydropower structural flood defences drainage and irrigation systemsmdashas well as water management practices At the present day we
already see the effects of climate change on existing infrastructure Box 1 presents a case
study of the Perth water supply As we move into the future these effects are expected to
become more widespread and more severe as the impacts of climate change on water
resources interact with other stresses such as increasing population changing economic activity and increased urbanisation This is likely to lead to restrictions on water demand for
all uses including public water supply and irrigation This is in the context of a situation
where even ignoring the effects of climate change irrigation demand in developing countries
(with 75 of the global irrigated area) is projected to expand by 06year until 2030
(Bruinsma 2003)
Key statement 10 Current water management practices may not be robust enough to
cope with the impacts of climate change In many locations water management cannot
satisfactorily cope even with current climate variability so that large flood and drought
damages occur As a first step improved incorporation of information about current climate variability into water-related management would assist adaptation to longer-term climate
change impacts
7
Water resources and IPCC
Box 1 Case study of the Perth water supply Figure 5 shows changes in the amount of water flowing into the supply system for Perth in
Western Australia It is clear that there has been a substantial downturn in the resource over
time In the eight years from 1997 stream flows had dropped to an annual average of 115GL
compared with the 161GLyr over the previous 23 years (1974ndash1997) The shortfall has been met through the construction of two dams and additional groundwater extraction In addition
as part of a lsquosecurity through diversityrsquo strategy a desalination plant has been built which
supplies 140000msup3day with designed expansion to 250000msup3day The plant is the largest
of its kind in the southern hemisphere and the biggest in the world to be powered by
renewable (wind) energy By 2010 around 107GLyear of new water will be needed to meet the rising demands of a growing population Whereas additional groundwater extraction is
the preferred strategy to meet this additional demand the construction of a second
desalination plant is a real possibility
For further information see wwwwater-technologynetprojectsperth
Figure 5 Annual inflow to Perth water supply system from 1911 to 2006 Horizontal lines show averages [TP Figure 57]
Key statement 11 Climate change challenges the traditional assumption that past
hydrological experience provides a good guide to future conditions The consequences of
climate change may alter the reliability of current water management systems and watershy
related infrastructure This situation is well illustrated for the present day by Figure 5 in Box
1 Although quantitative projections of changes in precipitation river flows and water levels at the river-basin scale are uncertain it can reliably be expected that hydrological
characteristics will change in the future Adaptation strategies and risk management practices
that incorporate future changes with related uncertainties are being developed in some
countries and regions
34 Adaptation and mitigation measures
Key statement 12 Adaptation options designed to ensure water supply during average
and drought conditions require integrated demand-side as well as supply-side strategies
On the demand side potential strategies which hold promise for water savings and reallocation of water to highly valued uses include
8
Water resources and IPCC
bull improved water-use efficiency eg by recycling water
bull expanded use of economic incentives including metering and pricing to encourage water conservation and
bull development of water markets and implementation of virtual water trade
Supply-side strategies include
bull increases in storage capacity
bull abstraction from water courses and
bull water transfers
Integrated water resources management provides an important framework to achieve
adaptation measures across socio-economic environmental and administrative systems
Successful integrated water management strategies include among others capturing societyrsquos
views reshaping planning processes co-ordinating land and water resources management protecting and restoring natural systems recognising water quantity and water quality
linkages and including considerations of climate change In particular an integrated approach
to water management could help to resolve conflicts between competing water users In
several places in the western USA water managers and various interest groups have been
experimenting with methods to promote consensus-based decision making which takes into account the need for sustainable water use
Key statement 13 Mitigation measures can reduce the magnitude of impacts of global
warming on water resources in turn reducing adaptation needs Figure 6 shows for a
range of sectors the expected impacts scaled against climate change By plotting the unmitigated temperature change by 2100 (line a) on this figure we can see the impacts likely
to be experienced by that date if no efforts are made to reduce our emissions of greenhouse
gases Line b shows the temperature change by 2100 if mitigation measures are put in place
specifically a 50 cut in emissions by 2050 To explore further mitigation scenarios the
reader is referred to Parry et al (2008)
However it should be noted that mitigation measures can in themselves have considerable
negative side effects such as increased water requirements for afforestationreforestation
activities or bio-energy crops if these are not sustainably located designed and managed
35 Climate change water resources sustainability and knowledge
Key statement 14 Water resources management clearly impacts on many other policy
areas such as energy health food security nature conservation In designing adaptation and mitigation measures to address climate change care must be taken to ensure that they interact
favourably with the need for sustainable development Low-income countries and regions are
likely to remain vulnerable over the medium term with fewer options than high-income
countries for adapting to climate change
As an example of the interrelationships between water resources management under climate
change and sustainable development Table 3 shows how sustainable management of water
can contribute to the achievement of the Millennium Development Goals
9
Water resources and IPCC
Table 3 Potential contribution of the water sector to attain the Millennium Development
Goals [TP Table 71]
Goals Direct relation to w ater Indirect relation to water
Goal 1 Water as a factor in many production activities Reduced ecosystem
poverty and Sustainable production of fish tree crops and Reduced urban hunger by
hunger other food brought together in common
property resources
means of cheaper food from
more reliable water supplies
Goal 2 Improved school attendance
Achieve through improved health and
universal reduced water-carrying burdens
education especially for girls
Goal 3
Promote
gender equity
and empower
women
Development of gender-sensitive water
management programmes
Reduce time wasted and health
burdens from improved water
service leading to more time for
income-earning and more
balanced gender roles
Goal 4 Improved access to drinking water of more
Reduce child adequate quantity and better quality and
mortality improved sanitation reduce the main factors of
morbidity and mortality in young children
Goal 6
Combat
HIVAIDS
malaria and
other diseases
Improved access to water and sanitation
supports HIVAIDS-affected households and
may improve the impact of health care
programmes
Better water management reduces mosquito
habitats and the risk of malaria transmission
Goal 7
Ensure
environmental
su stainability
Improved water management reduces water
consumption and recycles nutrients and
organics
Actions to ensure access to improved and
possibly productive eco-sanitation for poor
households
Actions to improve water supply and sanitation
services for poor communities
Actions to reduce wastewater discharge and
improve environmental health in slum areas
Develop operation
maintenance and cost recovery
system to ensure sustainability
of service delivery
Key statement 15 Several gaps in knowledge exist in terms of observations and
research needs related to climate change and water The following gaps were identified by
the Technical Paper as the most pressing
bull Observational data and data access are prerequisites for adaptive management yet many observational networks are shrinking
bull There is a need to improve understanding and modelling of changes in climate related
to the hydrological cycle at scales relevant to decision making
10
Water resources and IPCC
bull Information about the water-related impacts of climate change is incomplete
especially with respect to water quality aquatic ecosystems groundwater including their socio-economic dimensions
bull Finally current tools to facilitate integrated appraisals of adaptation and mitigation
options across multiple water-dependent sectors are inadequate
Figure 6 Projected impacts for different sectors of projected changes in climate associated
with different amounts of increase in global average surface temperature in the 21st
century
[Working Group II Fourth Assessment Table 208] The vertical lines show (a) the amount of
temperature change projected for unmitigated emissions up to 2100 and (b) the amount of
warming by 2100 if emissions were cut by 50 by 2050 For further explanation see Parry et al (2008)
4 Conclusions
As its headline statement the Technical Paper concludes that
(b) 2100 impacts for 50reduction of global emissions by 2050
(a) 2100 impacts for
unmitigated emissions
11
Water resources and IPCC
Observational records and climate projections provide abundant evidence
that freshwater resources are vulnerable and have the potential to be
strongly impacted by climate change with wide-ranging consequences on human societies and ecosystems
The 180-page Technical Paper is a compact and integrated publication focussed on water and
climate change which summarises and synthesises the latest results from all IPCC Working
Groups on Climate Change and Water It is targeted not only at policymakers in government but also at the science community NGOs and the media As such the language is crafted to
be accessible to the general reader with an interest in climate change It will be printed and
distributed by the IPCC Secretariat free of charge and translated into all UN languages
making it a readily-available primer on the current knowledge of climate change and water
References
Arnell NW 2004 Climate change and global water resources SRES emissions and socio economic scenarios Global Environmental Change 14 31ndash52
Bruinsma J 2003 World Agriculture Towards 20152030 An FAO Perspective Earthscan UK
444 pp Milly PCD KA Dunne and AV Vecchia 2005 Global pattern of trends in streamflow and water
availability in a changing climate Nature 438(7066) 347ndash350
Parry ML Palutikof JP Hanson CE and Lowe J 2008 Climate policy squaring up to reality Nature Reports Climate Change Published online 29 May 2008 doi101038climate200850
The Technical Paper should be cited as
Bates BC ZW Kundzewicz S Wu and JP Palutikof Eds 2008 Climate Change and
Water Technical Paper of the Intergovernmental Panel on Climate Change IPCC
Secretariat Geneva 210 pp
12
Water resources and IPCC
Observational records and climate projections provide abundant evidence
that freshwater resources are vulnerable and have the potential to be
strongly impacted by climate change with wide-ranging consequences on human societies and ecosystems
The 180-page Technical Paper is a compact and integrated publication focussed on water and
climate change which summarises and synthesises the latest results from all IPCC Working
Groups on Climate Change and Water It is targeted not only at policymakers in government but also at the science community NGOs and the media As such the language is crafted to
be accessible to the general reader with an interest in climate change It will be printed and
distributed by the IPCC Secretariat free of charge and translated into all UN languages
making it a readily-available primer on the current knowledge of climate change and water
References
Arnell NW 2004 Climate change and global water resources SRES emissions and socio economic scenarios Global Environmental Change 14 31ndash52
Bruinsma J 2003 World Agriculture Towards 20152030 An FAO Perspective Earthscan UK
444 pp Milly PCD KA Dunne and AV Vecchia 2005 Global pattern of trends in streamflow and water
availability in a changing climate Nature 438(7066) 347ndash350
Parry ML Palutikof JP Hanson CE and Lowe J 2008 Climate policy squaring up to reality Nature Reports Climate Change Published online 29 May 2008 doi101038climate200850
The Technical Paper should be cited as
Bates BC ZW Kundzewicz S Wu and JP Palutikof Eds 2008 Climate Change and
Water Technical Paper of the Intergovernmental Panel on Climate Change IPCC