Water Resources Research Institute of the University of North Carolina Annual Technical Report FY 2012 Water Resources Research Institute of the University of North Carolina Annual Technical Report FY 2012 1
Transcript
Water Resources Research Institute of theUniversity of North Carolina
Annual Technical ReportFY 2012
Water Resources Research Institute of the University of North Carolina Annual Technical Report FY 20121
Introduction
During 2012-2013 (Fiscal Year 2012), the Water Resources Research Institute (WRRI) of The University ofNorth Carolina System was responsible for fostering and developing a research, training, and informationdissemination program responsive to the water problems of the State and region. To develop its programs, theInstitute maintains an aggressive effort to interact and communicate with federal, state, and local watermanagers. The close contact with water managers is a basis for determining the ever-changing water researchpriorities.
Research priorities continue to be identified by the WRRI Advisory Committee, composed of representativesof several federal and state agencies, local governments, industries, and non-governmental environmentalorganizations (NGOs), as well as by other water resource experts in the state with whom WRRI has closerelationships. A technical review committee is also convened on an annual basis to advise WRRI staff on thescientific merit of research proposals submitted for funding. Full-time faculty members from all NorthCarolina institutions of higher education are eligible to receive grants from WRRI.
The information transfer program continued to focus on disseminating results of sponsored research andproviding information on emerging water issues, solutions, and regulations. Results of research aredisseminated by publication of technical completion reports, summaries in the WRRI newsletter, publicationof summaries on the WRRI website, and presentations by investigators at the WRRI Annual Conference andindividual group meetings where appropriate. WRRI continues to be a sponsor of continuing education creditsby the NC Board of Examiners of Engineers and Surveyors and the NC Board of Landscape Architects. Thisallows WRRI to offer Professional Development Hours (PDHs) and contact hours for attendance at the WRRIAnnual Conference and other workshops and seminars that WRRI sponsors.
WRRI continues to adapt to changes in the landscape of its home institution, NC State University, byconsolidating its operations and maximizing staff efficiencies and outputs. They continue to leverage fundsfrom a variety of sources to expand the reach and impact of research and outreach activities, and grow theirinvolvement in and support of water-related research and outreach across the state.
Introduction 1
Research Program Introduction
During 2012-2013 (Fiscal Year 2012), WRRI continued its regular program of fostering research, training,and information transfer responsive to water issues of the state and region. Results from Institute-supportedresearch efforts are expected to assist local, municipal, state, regional and federal agencies improve theirdecision-making in the management and stewardship of their water resources. To help it chart and sponsor aresearch program responsive to the water resource issues and opportunities in North Carolina, WRRI interactsclosely with the N.C. Department of Environment and Natural Resources, other agencies, water and powerutilities, and an array of research and outreach programs within the UNC system and at private highereducational institutions across North Carolina. A research advisory committee provides input, guidance, andreview of the Institute’s research priorities on an annual basis. This committee is composed of representativesof several federal and state agencies, local governments, industries, and non-governmental environmentalorganizations (NGOs).
The results of this process are shared with prospective investigators as part of WRRI’s annualcall-for-proposals. Proposals that address the annual priorities and meet peer review and other criteria receivepreferential consideration for funding. Research priorities, as determined via the above process, areincorporated into our Section 104 Objectives on an annual basis. The proposal solicitation, as in the past, issent to relevant contacts at colleges and universities across North Carolina to apprise them of the opportunityto submit proposals. The call for proposals is also sent to an email distribution list of approximately 180university faculty across North Carolina. Full-time faculty members from all North Carolina institutions ofhigher education are eligible to receive grants from WRRI.
The proposals received are sent to a Technical Committee and to external peer reviewers to determine therelevancy, need for the proposed research and relative strength and weaknesses. The Technical Committeeconvenes on an annual basis to review all comments made by reviewers, advise WRRI staff on the scientificmerit of research proposals, and make recommendations regarding proposal funding.
Efforts were made to maintain a consolidated, refined, and focused list of FY12-13 research priorities basedon in-depth discussions of the most significant water research needs and priorities for the state of NorthCarolina. These priorities were included in the annual call for FY 2012-2013, and the projects resulting fromthis annual call will be funded from March 1, 2013 to February 28, 2014 and will be reported in the nextUSGS Annual Report.
The FY 2012-2013 research priorities were: •quantifying the economic value of water quality •quantifyingsources, transport, and fate of nutrients and sediments in surface waters, and water quality changes in NCwatersheds in which TMDLs and nutrient management plans have been implemented •defining and evaluatingin-stream flow needs and aquatic ecosystem function •groundwater flow and quality, human impacts•evaluation of methods for quantifying pollutant removal from stream restoration practices and projects•defining and evaluating different stormwater control measures, their relative pros and cons, and appropriatepollutant removal credits for these measures as they relate to sediment, nitrogen, phosphorous,pathogens/bacteria, and other stormwater contaminants in urban stormwater systems •defining and evaluatingrealistic management measures that can quantifiably mitigate the effects of impervious cover on aquatic life,in different urban settings and stormwater systems •understanding, quantifying, and managing risks anduncertainties in public water supplies, in the face of changing population, land use, climate, and regulations•setting rates and financing capital improvements for water and/or sewer utilities, in the face of changingpopulation, land use, climate, and regulations •applying social science and economic valuation methodologiesto help utilities better understand customers’ level-of-service expectations, their motivations, and willingnessto pay for services, as well as understand customer perceptions, attitudes, opinions and beliefs related towater, wastewater, and reclaimed water •identifying, understanding, and applying innovative processes and
Research Program Introduction
Research Program Introduction 1
technologies for water and wastewater treatment, plant operation, distribution systems, and potable andreclaimed water supply and waste discharge management •evaluation of alternative water sources (e.g.,graywater or harvested rainwater) for differing consumptive uses (e.g., home irrigation), health risks ofalternative sources, and potential impacts of alternative water use on overall water supply and demand
Research Program Introduction
Research Program Introduction 2
Identification of membrane foulants and optimum cleaningstrategies for nanofiltration and reverse osmosismembranes treating groundwaters from the Castle Hayneand Peedee aquifers
Basic Information
Title:Identification of membrane foulants and optimum cleaning strategies for nanofiltrationand reverse osmosis membranes treating groundwaters from the Castle Hayne andPeedee aquifers
Focus Category: Treatment, Groundwater, Water SupplyDescriptors: None
PrincipalInvestigators: Orlando Coronell
Publications
There are no publications.
Identification of membrane foulants and optimum cleaning strategies for nanofiltration and reverse osmosis membranes treating groundwaters from the Castle Hayne and Peedee aquifers
Identification of membrane foulants and optimum cleaning strategies for nanofiltration and reverse osmosis membranes treating groundwaters from the Castle Hayne and Peedee aquifers1
CONFIDENTIAL
Identification of membrane foulants and optimum cleaning strategies for
nanofiltration and reverse osmosis membranes treating groundwaters from
the Castle Hayne and Peedee aquifers: Final Report (WRRI project#11-03-W, Sub-award agreement#2011-1481-02)
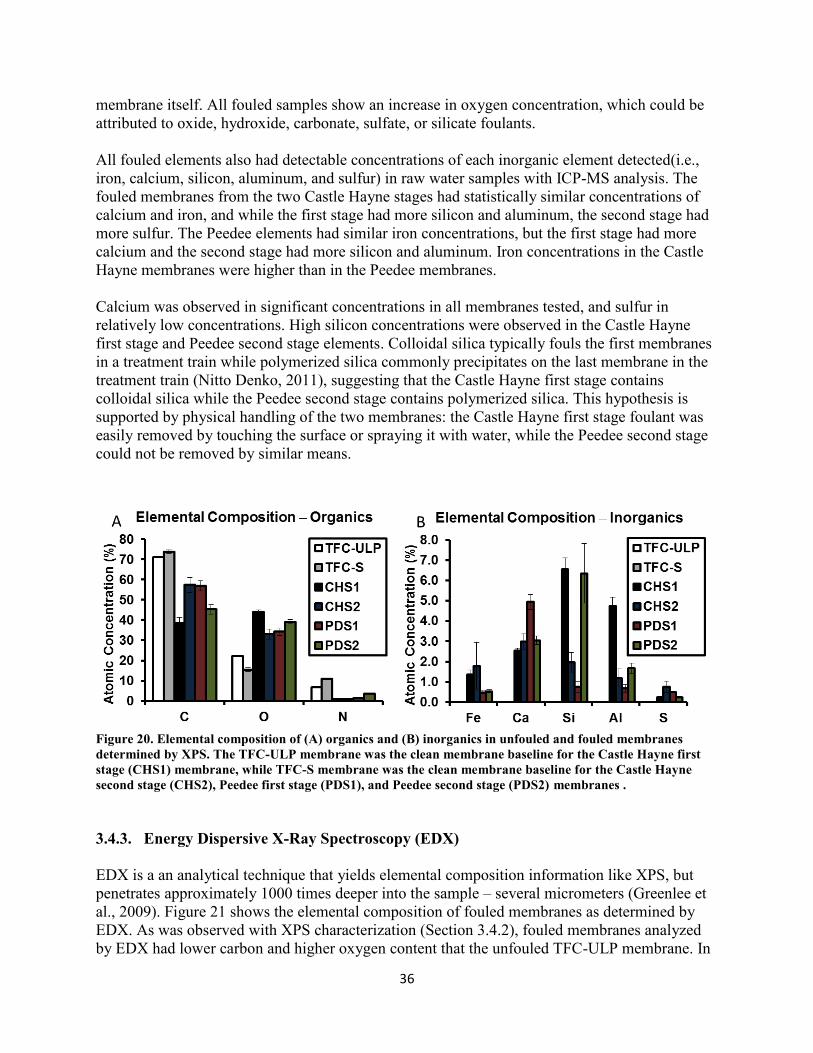
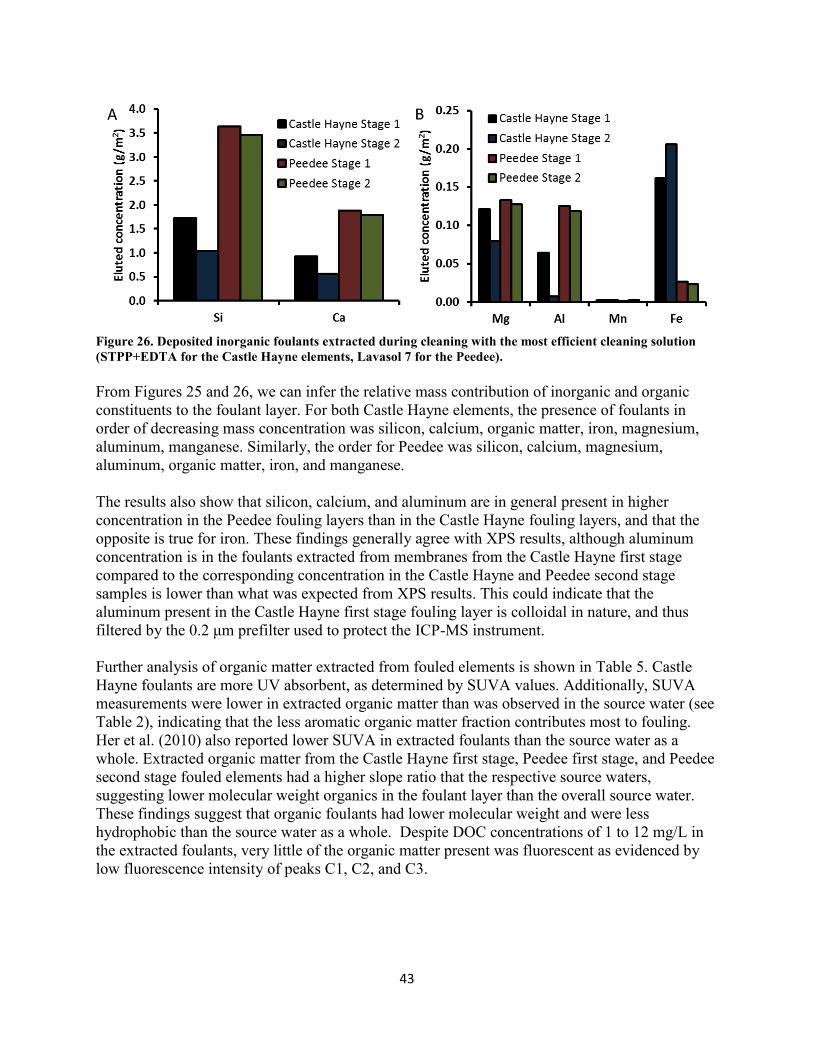
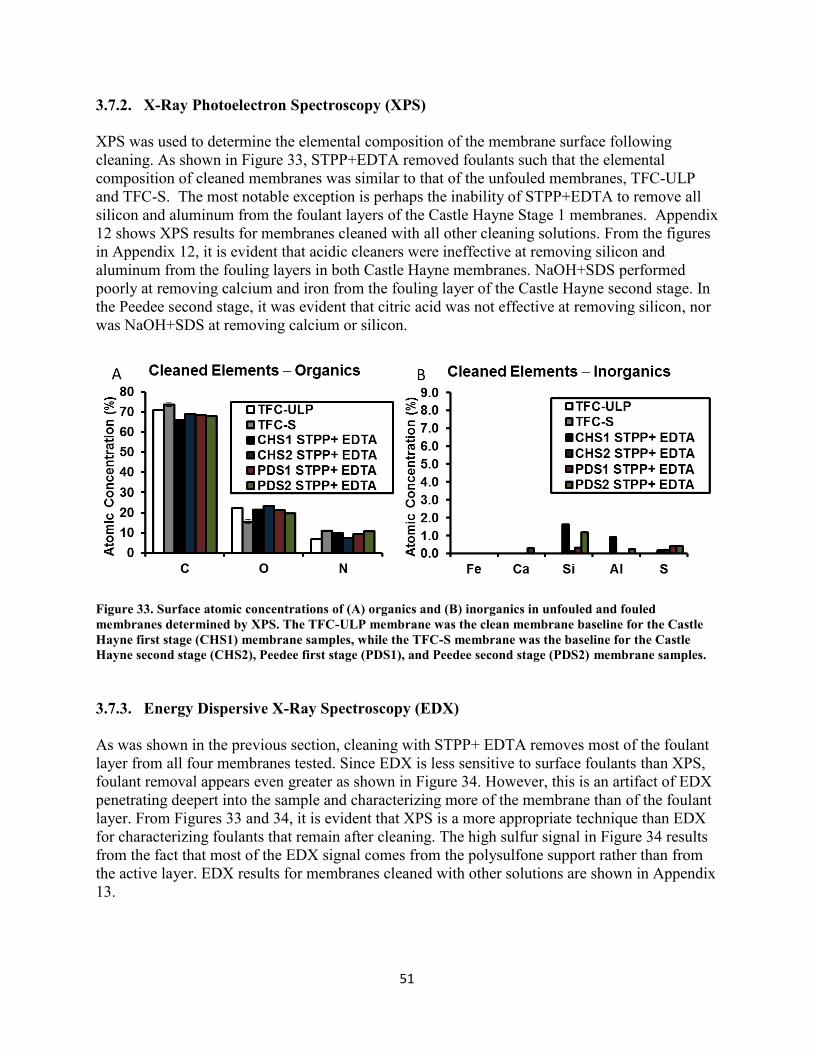
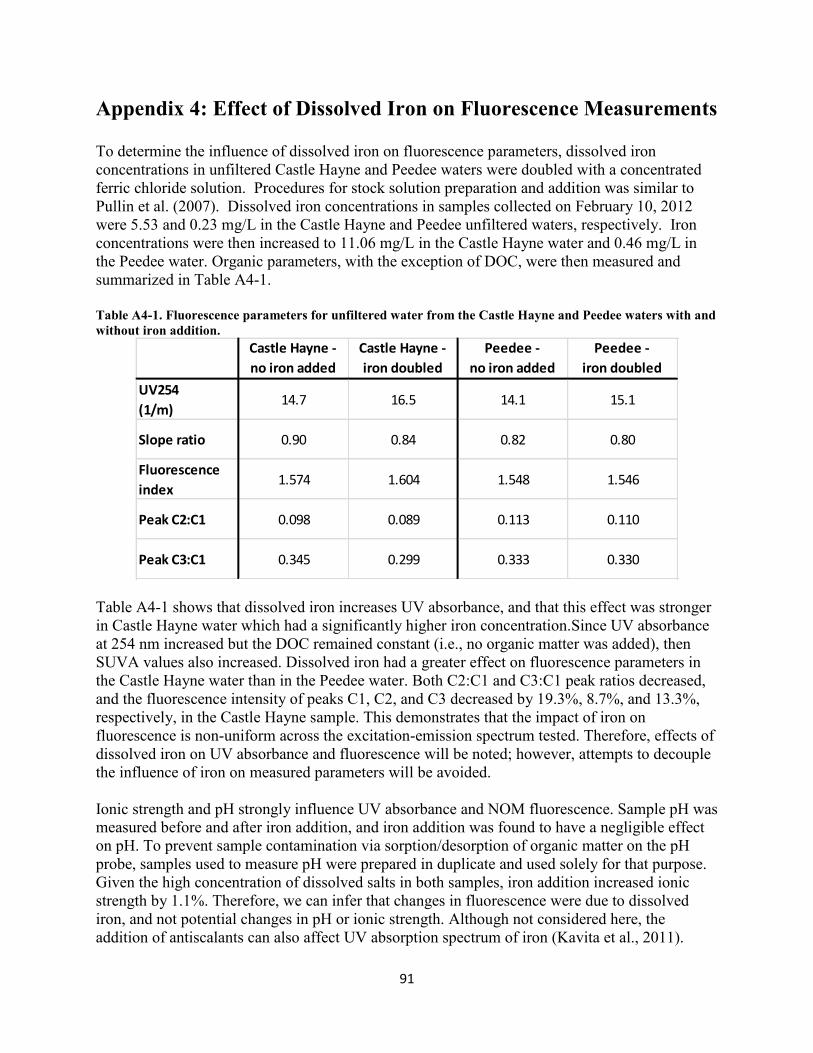
pretreatment steps (Kumar et al., 2006). Percent reduction in parameters from Table 2 following
filtration are shown in Table 3.
3.1.1. Conventional Water Quality Parameters
Recommendations by the manufacturer (Koch Membrane Systems) of the membranes used in the
treatment plant state that turbidity of feed water should not exceed 1 NTU (Koch, 2010a and
2010b). Turbidity in water from the plant intake was 0.088 NTU in the Castle Hayne and 0.105
NTU in the Peedee aquifer at the time of collection (see Table 2). Turbidity measured in the
laboratory was much higher, likely due to precipitation of dissolved species during transport.
Since samples were filtered in the laboratory following transport, feed turbidity measurements
taken in the laboratory for unfiltered water were used to calculate turbidity rejection during
filtration tests (see Table 3). Even with the precipitation that occurred during transport and
storage, and the corresponding relatively high turbidity it produces, the 5 μm cartridge filters
currently used for prefiltration were sufficient to reduce turbidity below 1 NTU.
Silt density index (SDI) in feed water should be less than or equal to 5 to prevent particulate
fouling, according to the membrane manufacturer (Koch, 2010a and 2010b). SDI was measured
at the treatment plant for plant intake with both Castle Hayne and Peedee waters, and was found
to be less than 2. Measurements obtained at the laboratory were higher than on site (see Table 2)
likely due to precipitation during transport, not to particulate matter in the source water.
Particle size distributions (see Appendix 3) were measured before and after filtration for both the
Castle Hayne and Peedee waters. Filtration with 1.2 μm filters resulted in minimal change in
average particle diameter, while 0.1 μm filtration noticeably reduced particle size for both
waters. Ultrafiltration with 100 kDa filters reduced average particle diameter below the lower
detection limit (i.e., a few nanometers) of the instrument (Zetasizer Nano ZS90 - Malvern
Instruments).
15
Minimal changes in hardness alkalinity, and conductivity following filtration were observed.
Changes in pH following filtration were likely due to equilibration of the water with the
atmosphere. Groundwaters, especially those whose pH has been adjusted by acid addition (i.e.,
Castle Hayne water), are typically saturated with carbonic acid, which volatilizes in the form
carbon dioxide when exposed to the atmosphere. The loss of carbonic acid is likely the cause of
the increasing pH observed with filtration. The concentration of total suspended solids (TSS) was
below the limit of quantification following all forms of filtration.
16
Table 2. Water quality parameters for Castle Hayne and Peedee groundwaters.
Average
Standard
Deviation Note Average
Standard
Deviation Note
Conventional Parameters*
Turbidity (NTU) 0.088 - [1] 0.105 - [1]
Alkalinity (mg/L as CaCO3) 94.6 0.6 180.5 0.7
SDI 5.4 - [2] 3.5 - [2]
Hardness (mg/L as CaCO3) 281.4 3.1 262.1 2.7
Conductivity (µs/cm) 570.3 5.5 578.0 1.0
TSS (mg/L) 1.8 0.7 Below LOQ Below LOQ [3]
pH 5.99 0.05 6.67 0.03
Dissolved Inorganics (mg/L)**
Aluminum 0.015 0.011 0.011 0.012
Chloride 29.4 - [4] 51.6 - [4]
Calcium 105.5 - [4] 93.5 - [4]
Iron 5.7 1.1 0.09 0.03
Magnesium 2.2 0.1 7.4 0.6
Manganese 0.084 0.009 0.011 0.000
Slicon 8.0 8.8 5.9 7.1
Sodium 8.4 0.4 19.6 1.5
Sulfate 231.4 - [4] 103.1 - [4]
Organic Parameters***
DOC (mg/L) 7.9 1.0 4.4 1.1
UVA 254 (m-1
) 35.3 4.2 12.2 3.4
SUVA (L/mg-m) 4.5 0.04 2.8 1.5
Slope ratio 0.7 0.05 1.0 0.2
Fluorescence index 1.55 0.05 1.53 0.01
Peak C1 Intensity 3.05 0.31 2.14 0.52
Peak C2 Intensity 0.32 0.05 0.21 0.03
Peak C3 Intensity 1.17 0.15 0.74 0.18
[2] SDI requires approximately 5 gallons of water per test; replicates were not performed due to limited sample volume.
[4] Calculated as average of multiple instrument readings from the same sample.
Castle Hayne Peedee
[1] Measured at treatment plant to avoid precipitation during transport. Sample collected February 2012 prior to antiscalant addition, pH adjustment.
[3] TSS meassurements for Peedee Waters were below the limit of quantification (LOQ) of 1.66 mg/L.
*Conventional parameters were calculated from technical replicates of samples collected in August 2011.
**Averages and standard deviations for dissolved inorganics were calculated from samples collected in August 2011 and February 2012.
***Averages and standard deviations for organic parameters were calculated from samples collected in August 2011 and September 2011.
17
Table 3. Approximate reduction in the values of water quality parameters (i.e. rejection) for various pretreatment alternatives tested in the laboratory.
[1] Turbidity rejection was calculated from unfiltered water (Castle Hayne: 18.2 NTU; Peedee: 0.24 NTU) and permeate water measured in the laboratory following transport.
[4] pH measurements displayed in "unfiltered - filtered" format for pH before and after filtration, respectively.
[2] SDI requires approximately 5 gallons of water per test; tests were not performed due to limited sample volume.
[3] All TSS measurements for filtered samples were below the limit of quantification (LOQ) of 1.66 mg/L.
18
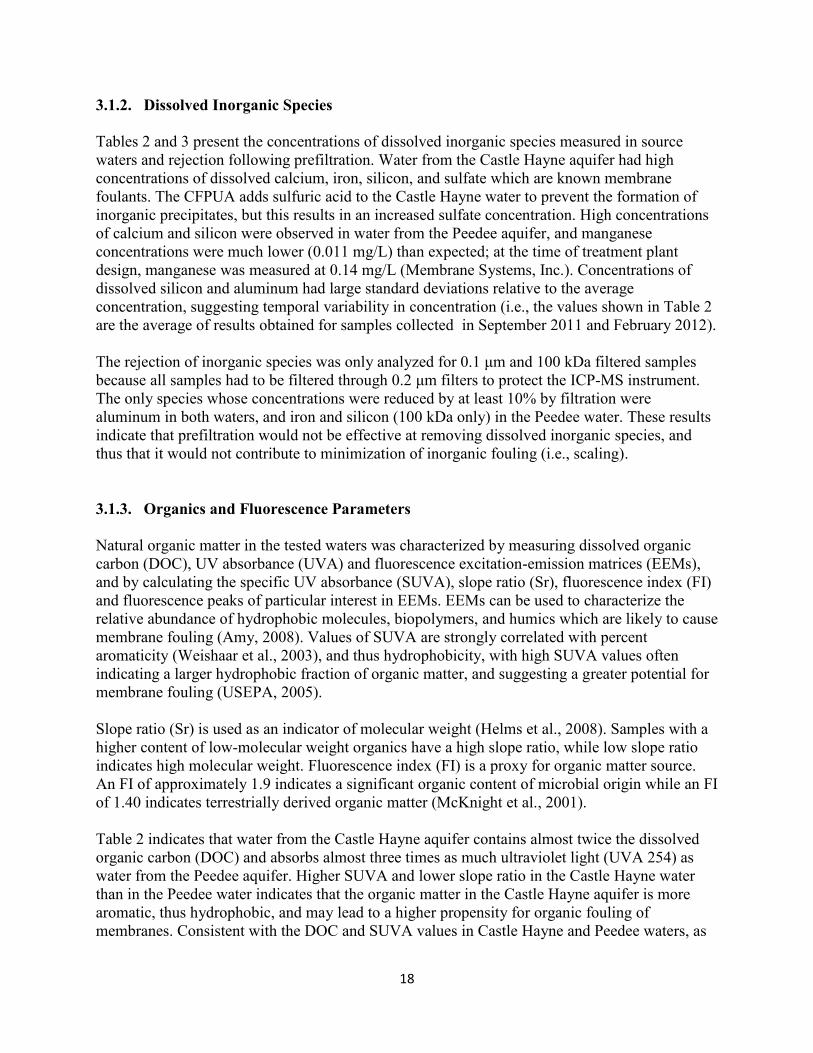
3.1.2. Dissolved Inorganic Species
Tables 2 and 3 present the concentrations of dissolved inorganic species measured in source
waters and rejection following prefiltration. Water from the Castle Hayne aquifer had high
concentrations of dissolved calcium, iron, silicon, and sulfate which are known membrane
foulants. The CFPUA adds sulfuric acid to the Castle Hayne water to prevent the formation of
inorganic precipitates, but this results in an increased sulfate concentration. High concentrations
of calcium and silicon were observed in water from the Peedee aquifer, and manganese
concentrations were much lower (0.011 mg/L) than expected; at the time of treatment plant
design, manganese was measured at 0.14 mg/L (Membrane Systems, Inc.). Concentrations of
dissolved silicon and aluminum had large standard deviations relative to the average
concentration, suggesting temporal variability in concentration (i.e., the values shown in Table 2
are the average of results obtained for samples collected in September 2011 and February 2012).
The rejection of inorganic species was only analyzed for 0.1 μm and 100 kDa filtered samples
because all samples had to be filtered through 0.2 μm filters to protect the ICP-MS instrument.
The only species whose concentrations were reduced by at least 10% by filtration were
aluminum in both waters, and iron and silicon (100 kDa only) in the Peedee water. These results
indicate that prefiltration would not be effective at removing dissolved inorganic species, and
thus that it would not contribute to minimization of inorganic fouling (i.e., scaling).
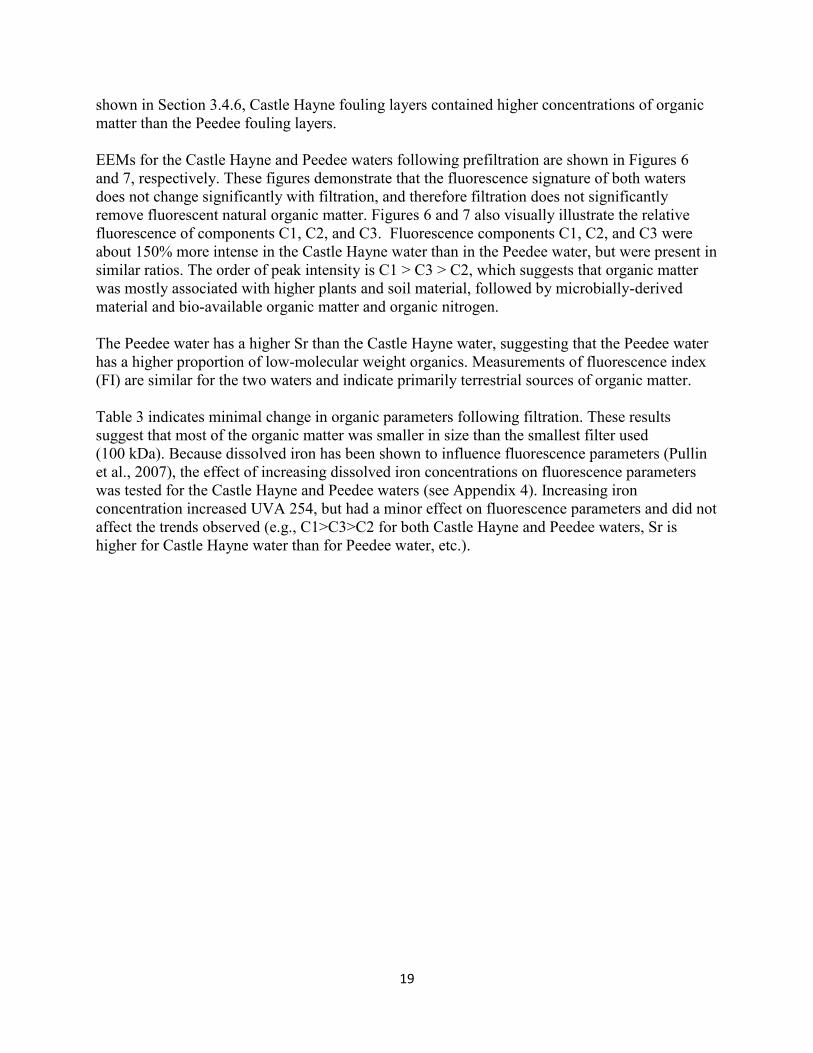
3.1.3. Organics and Fluorescence Parameters
Natural organic matter in the tested waters was characterized by measuring dissolved organic
carbon (DOC), UV absorbance (UVA) and fluorescence excitation-emission matrices (EEMs),
and by calculating the specific UV absorbance (SUVA), slope ratio (Sr), fluorescence index (FI)
and fluorescence peaks of particular interest in EEMs. EEMs can be used to characterize the
relative abundance of hydrophobic molecules, biopolymers, and humics which are likely to cause
membrane fouling (Amy, 2008). Values of SUVA are strongly correlated with percent
aromaticity (Weishaar et al., 2003), and thus hydrophobicity, with high SUVA values often
indicating a larger hydrophobic fraction of organic matter, and suggesting a greater potential for
membrane fouling (USEPA, 2005).
Slope ratio (Sr) is used as an indicator of molecular weight (Helms et al., 2008). Samples with a
higher content of low-molecular weight organics have a high slope ratio, while low slope ratio
indicates high molecular weight. Fluorescence index (FI) is a proxy for organic matter source.
An FI of approximately 1.9 indicates a significant organic content of microbial origin while an FI
of 1.40 indicates terrestrially derived organic matter (McKnight et al., 2001).
Table 2 indicates that water from the Castle Hayne aquifer contains almost twice the dissolved
organic carbon (DOC) and absorbs almost three times as much ultraviolet light (UVA 254) as
water from the Peedee aquifer. Higher SUVA and lower slope ratio in the Castle Hayne water
than in the Peedee water indicates that the organic matter in the Castle Hayne aquifer is more
aromatic, thus hydrophobic, and may lead to a higher propensity for organic fouling of
membranes. Consistent with the DOC and SUVA values in Castle Hayne and Peedee waters, as
19
shown in Section 3.4.6, Castle Hayne fouling layers contained higher concentrations of organic
matter than the Peedee fouling layers.
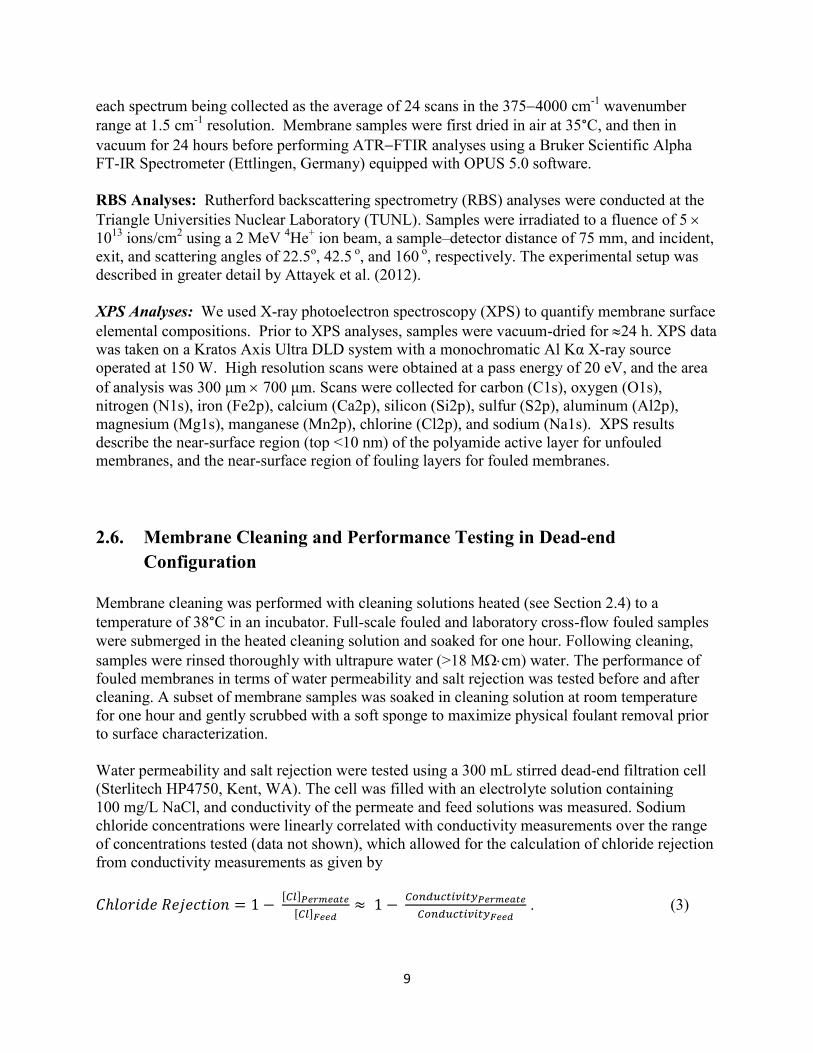
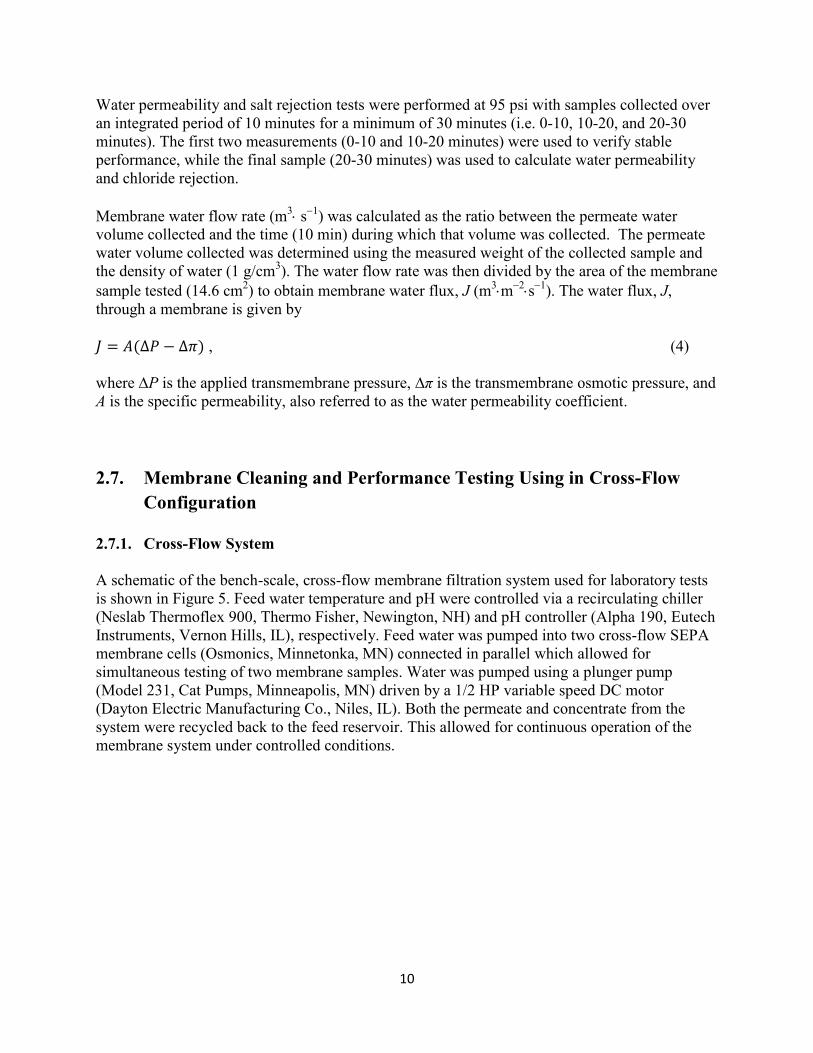
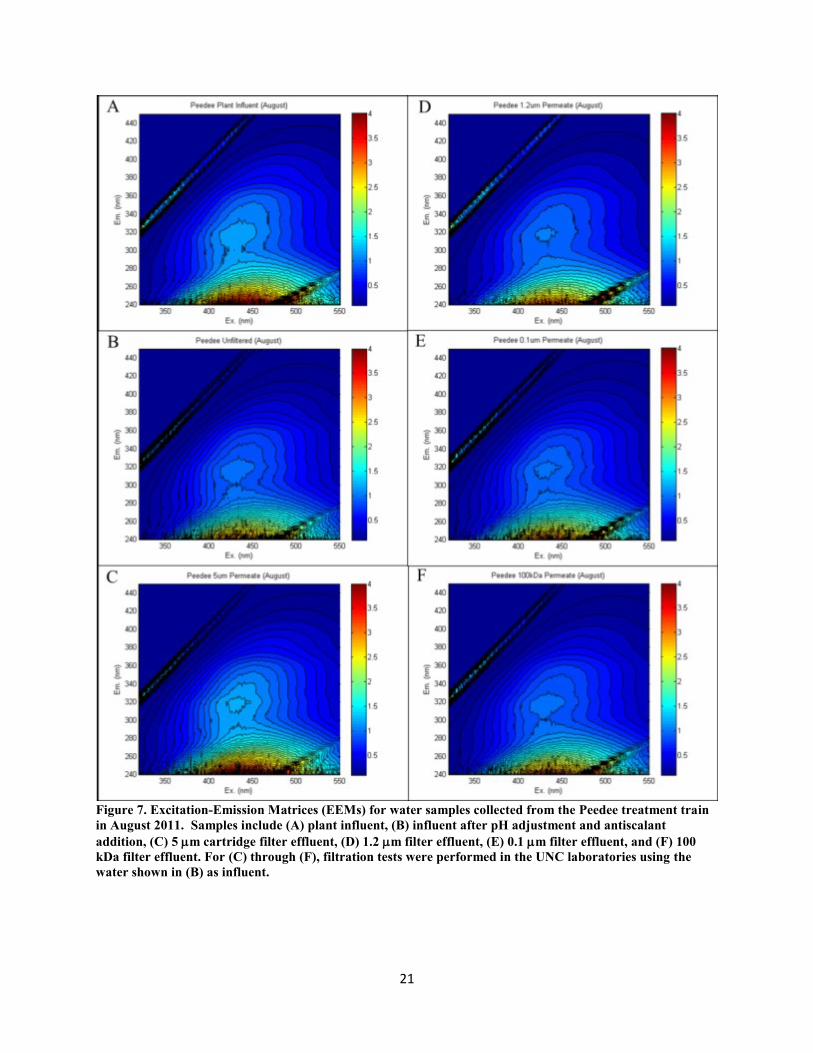
EEMs for the Castle Hayne and Peedee waters following prefiltration are shown in Figures 6
and 7, respectively. These figures demonstrate that the fluorescence signature of both waters
does not change significantly with filtration, and therefore filtration does not significantly
remove fluorescent natural organic matter. Figures 6 and 7 also visually illustrate the relative
fluorescence of components C1, C2, and C3. Fluorescence components C1, C2, and C3 were
about 150% more intense in the Castle Hayne water than in the Peedee water, but were present in
similar ratios. The order of peak intensity is C1 > C3 > C2, which suggests that organic matter
was mostly associated with higher plants and soil material, followed by microbially-derived
material and bio-available organic matter and organic nitrogen.
The Peedee water has a higher Sr than the Castle Hayne water, suggesting that the Peedee water
has a higher proportion of low-molecular weight organics. Measurements of fluorescence index
(FI) are similar for the two waters and indicate primarily terrestrial sources of organic matter.
Table 3 indicates minimal change in organic parameters following filtration. These results
suggest that most of the organic matter was smaller in size than the smallest filter used
(100 kDa). Because dissolved iron has been shown to influence fluorescence parameters (Pullin
et al., 2007), the effect of increasing dissolved iron concentrations on fluorescence parameters
was tested for the Castle Hayne and Peedee waters (see Appendix 4). Increasing iron
concentration increased UVA 254, but had a minor effect on fluorescence parameters and did not
affect the trends observed (e.g., C1>C3>C2 for both Castle Hayne and Peedee waters, Sr is
higher for Castle Hayne water than for Peedee water, etc.).
20
Figure 6. Excitation-Emission Matrices (EEMs) for water samples collected from the Castle Hayne treatment
train in August 2011. Samples include (A) plant influent, (B) influent after pH adjustment and antiscalant
addition, (C) 5 m cartridge filter effluent, (D) 1.2 m filter effluent, (E) 0.1 m filter effluent, and (F) 100
kDa filter effluent. For (C) through (F), filtration tests were performed in the UNC laboratories using the
water shown in (B) as influent.
A
B
C F
E
D
21
Figure 7. Excitation-Emission Matrices (EEMs) for water samples collected from the Peedee treatment train
in August 2011. Samples include (A) plant influent, (B) influent after pH adjustment and antiscalant
addition, (C) 5 m cartridge filter effluent, (D) 1.2 m filter effluent, (E) 0.1 m filter effluent, and (F) 100
kDa filter effluent. For (C) through (F), filtration tests were performed in the UNC laboratories using the
water shown in (B) as influent.
22
3.2. Full-Scale Membrane System Performance
Feed, permeate, and concentrate water samples were collected in February 2012 from both the
Castle Hayne and Peedee membrane treatment trains. The Castle Hayne treatment train has two
different membrane types: TFC-ULP in the first stage and TFC-S in the second stage. For this
reason, permeate water samples were collected from both stages of the Castle Hayne treatment
train whereas only total permeate (i.e., combined permeate from both stages) was collected from
the Peedee treatment train. Results from water quality analyses of the samples collected and data
from the treatment plant’s SCADA system were used to evaluate performance of the full-scale
membrane system.
3.2.1. Full-Scale Rejection of Dissolved Constituents
Permeate water samples were tested for various water quality parameters and the results were
compared to corresponding values for feed water samples to determine rejection of dissolved
constituents (see Section 2.3). Table 4 shows observed rejection of dissolved species. Recovery
of 50% from the Castle Hayne first stage, based on treatment plant design values, was used to
calculate the water quality of the influent to the Castle Hayne second membrane stage. For
example, if the Castle Hayne feed water entering the first membrane stage contained 105.5 mg/L
of calcium (see Table 2), the concentration of calcium entering the second stage would be 196.2
mg/L because the first stage had 50% recovery and 93% rejection (see Table 4).
The rejection of dissolved ions in Table 4 was comparable to the rejection reported by the
manufacturer in the specification sheets for the TFC-ULP and TFC-S membranes provided to the
CFPUA ref: 98.5% chloride rejection for TFC-ULP, and 85%, 98.5%, and 98.5% rejection of
chloride, total hardness, and magnesium sulfate, respectively for TFC-S (Koch, 2010b and
2010a). However, it should be noted that the rejection data in the manufacturer’s specifications
were collected during testing of the membrane elements with 15% water recovery, while the
CFPUA treatment plant operates at a total recovery for each the Castle Hayne and Peedee
treatment trains of 80%.
Table 4 also indicates that, in general, the rejection of monovalent ions, sodium and chloride,
was lower than rejection for polyvalent ions, as expected. We observed excellent rejection (93-
99%) of polyvalent ions such as iron, magnesium, and manganese; however, the rejection of
calcium and aluminum was relatively low with values as low as 57% for calcium and negligible
rejection for aluminum. Given that most of the hardness in Castle Hayne water comes from
calcium content (see Table 2), total hardness rejection was similarly poor. With the exception of
calcium rejection in the Castle Hayne first stage, calcium and aluminum rejection were lower
than sodium and chloride rejection in all membrane stages.
23
Table 4. Observed rejection of various water quality parameters in the membrane filtration stages of the
CFPUA Groundwater Nanofiltration Treatment Plant (Wilmington, NC) relative to feed water concentration.
Both stages of the Castle Hayne treatment train exhibited excellent rejection of DOC, UVA 254,
and all three fluorescence peaks. DOC rejection in both Castle Hayne stages was 99% or greater,
which exceeds the DOC rejection by nanofiltration membranes reported by Peiris et al. (2010)
(92.7-95.8%) and Jarusutthirak et al. (2007) (94.9-97.0%). DOC rejection by nanofiltration in the
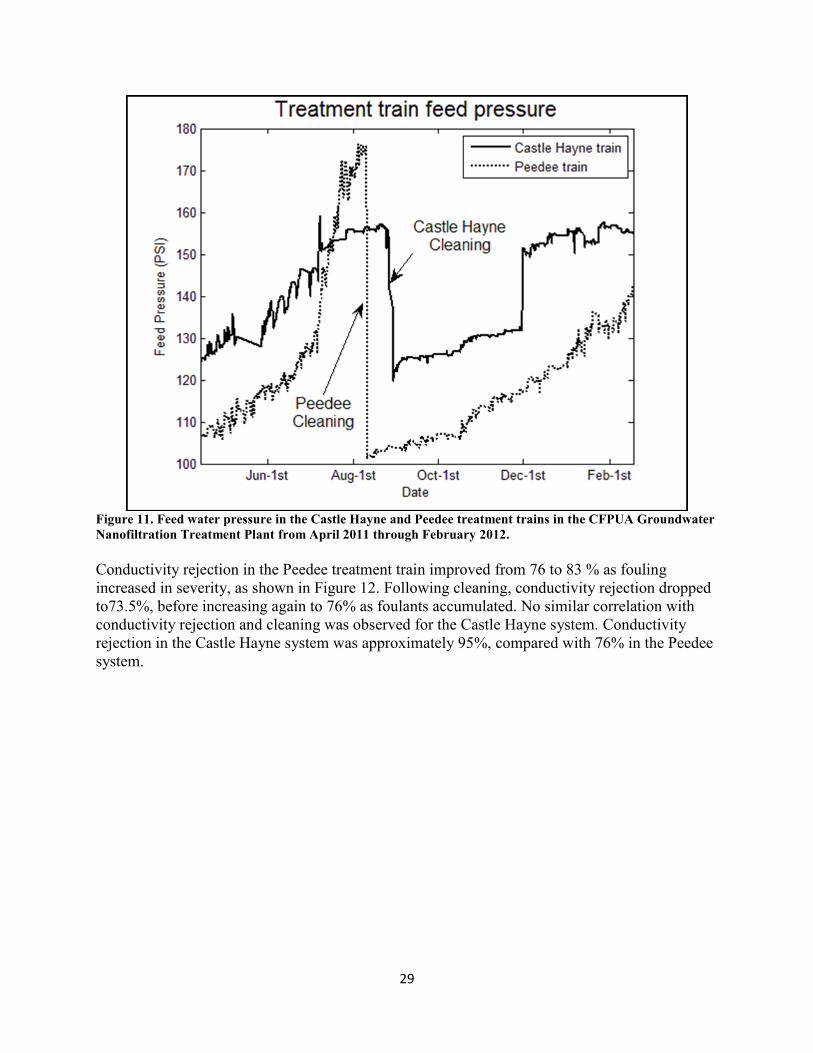
Peedee treatment train was only 77%, which is lower than rejections reported in literature. The
observed rejection of UVA by TFC-S membranes was 58% and 99% for Peedee water and
Castle Hayne water, respectively, consistent with the range of approximately 50-80% reported by
Yoon et al. (2005). The lower rejection of organics observed in the Peedee treatment train,
Pedee
Stage 1
Permeate
(TFC-ULP)
Stage 2
Permeate
(TFC-S)
Total
Permeate
(TFC-S)
Conventional Parameters
Hardness 93% 75% 60%
Conductivity 96% 95% 90%
Dissolved Inorganics
Aluminum 53% -12% 64%
Chloride BLD, >88% [1] 77% [2] 76%
Calcium 93% 71% 57%
Iron 99% 96% 93%
Magnesium 99% 97% 96%
Manganese 99% 97% 94%
Silicon 98% 88% 82%
Sodium 75% 68% 70%
Sulfate 100% 100% 99%
Organic Parameters
DOC BLD, >99% [1] 99% [3] 77%
UVA 254 99% 99% 58%
SUVA N/A [4] 7% -83%
Slope ratio -295% 33% [5] -39%
Fluorescence index -1% 4% [5] -1%
Peak C1 Intensity 100% 100% 98%
Peak C2 Intensity 99% 99% 96%
Peak C3 Intensity 100% 100% 99%
Castle Hayne
[2] First stage chloride rejection assumed to be 90%.
[4] SUVA cannot be calculated as DOC was below detection.
[5] Second stage influent assumed to be equal to first stage influent.
[3] First stage DOC rejection assumed to be 100%.
[1] Measurements that were below the limit of detection (BLD)
24
compared to in the Castle Hayne treatment train, was consistent with the higher slope ratio (0.7),
and thus lower molecular weight organics, obtained for the Peedee water compared to the slope
ratio (1.0) obtained for the Castle Hayne water (Section 3.1.1.).
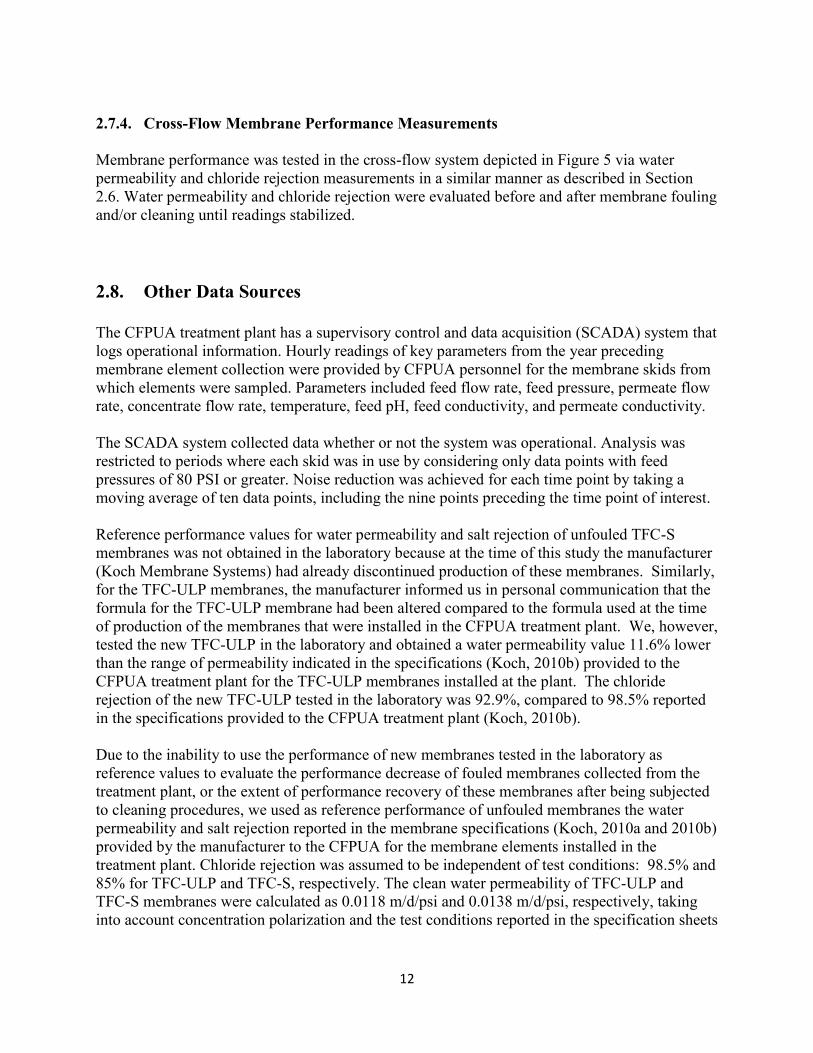
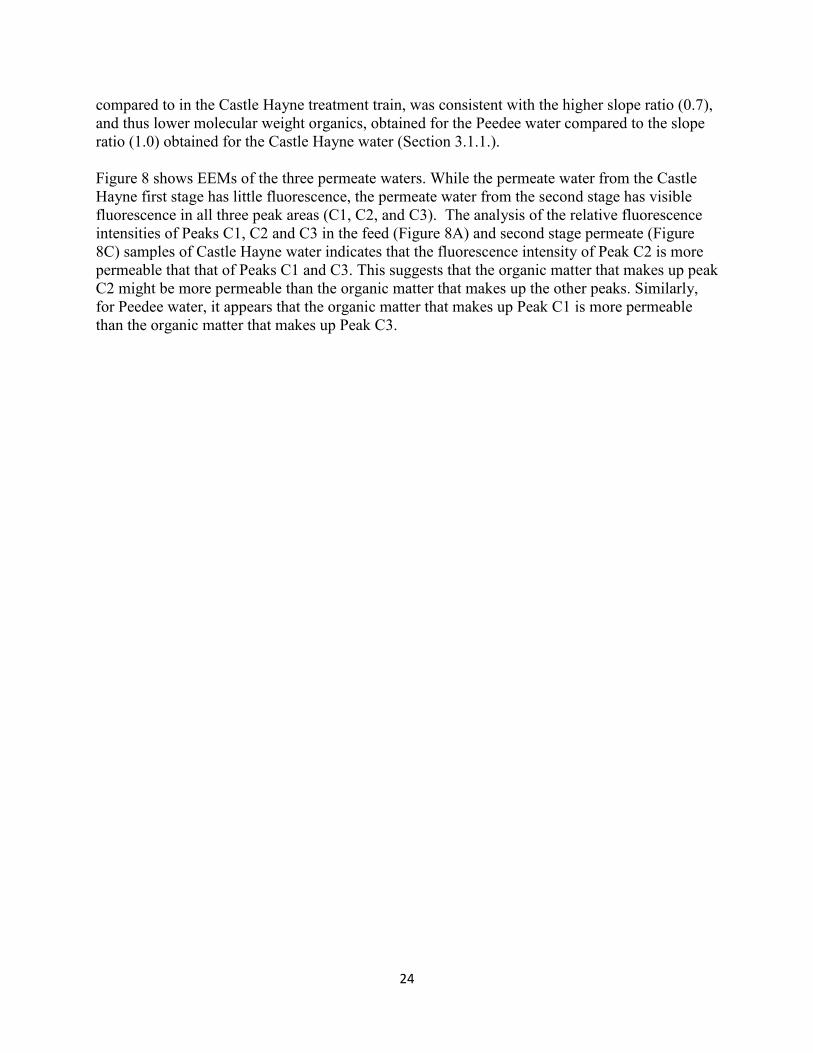
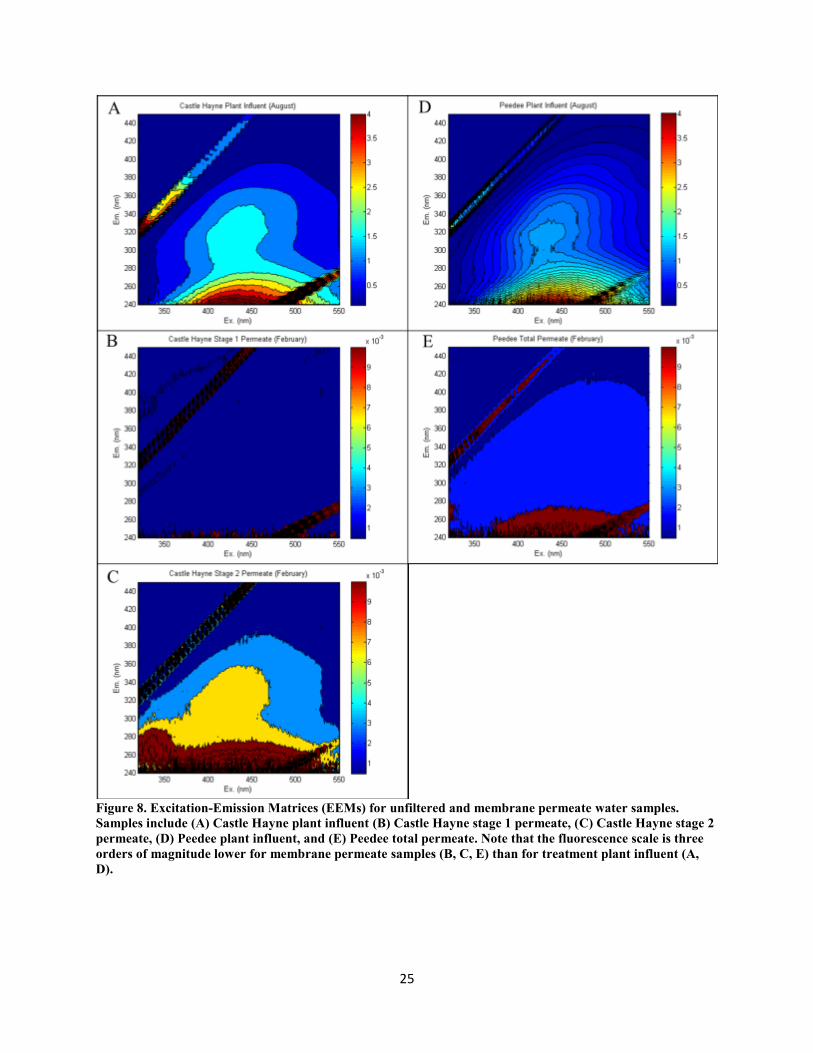
Figure 8 shows EEMs of the three permeate waters. While the permeate water from the Castle
Hayne first stage has little fluorescence, the permeate water from the second stage has visible
fluorescence in all three peak areas (C1, C2, and C3). The analysis of the relative fluorescence
intensities of Peaks C1, C2 and C3 in the feed (Figure 8A) and second stage permeate (Figure
8C) samples of Castle Hayne water indicates that the fluorescence intensity of Peak C2 is more
permeable that that of Peaks C1 and C3. This suggests that the organic matter that makes up peak
C2 might be more permeable than the organic matter that makes up the other peaks. Similarly,
for Peedee water, it appears that the organic matter that makes up Peak C1 is more permeable
than the organic matter that makes up Peak C3.
25
Figure 8. Excitation-Emission Matrices (EEMs) for unfiltered and membrane permeate water samples.
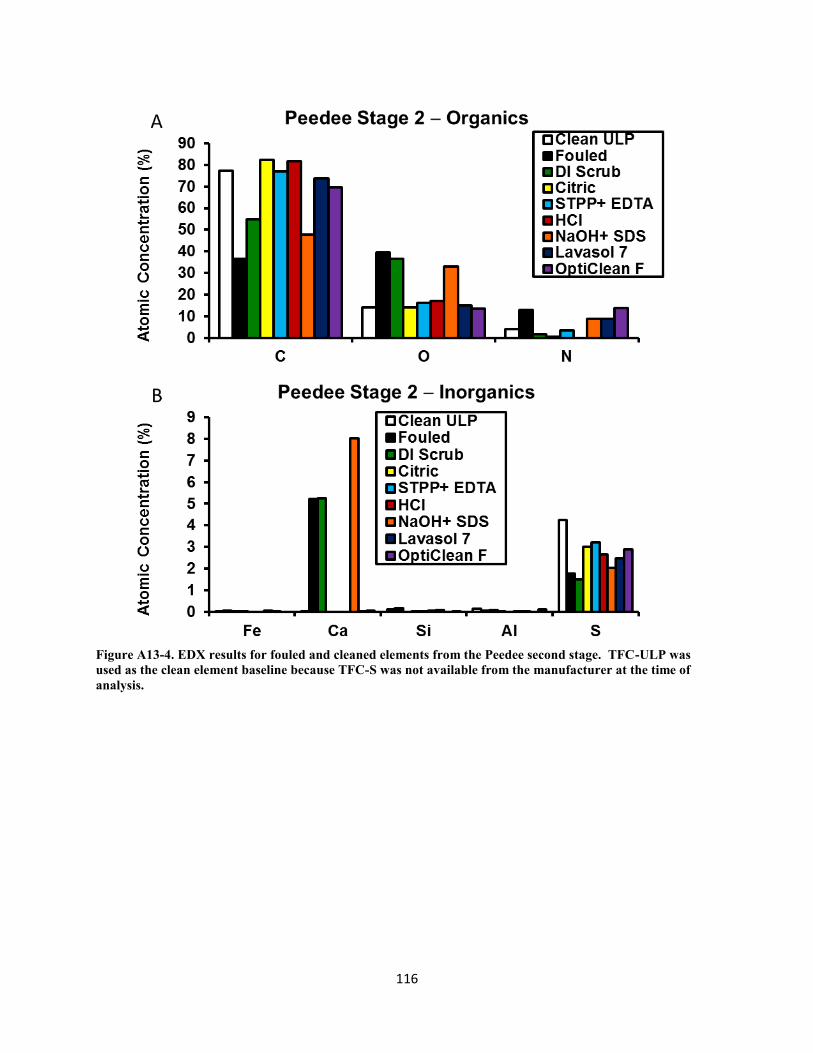
Peedee 1st Stage O>Ca>Si>Al>S>Fe O>Ca>Si>Al> Fe Si>Ca>Al>OM>Fe
Peedee 2nd
Stage O>Si>Ca>Al>Fe>S O>Ca>Si>Al>Fe Si>Ca>Al>OM>Fe *EDX cannot be used to determine the presence of sulfur in the fouling layer, as it penetrates into the polysulfone
support and signal from the support cannot be separated from the signal from the foulant layer.
**Foulant extractions cannot measure the presence of oxygen; magnesium results excluded; OM indicates organic
matter.
Extraction with sodium hydroxide may underestimate organic fouling, because increasing pH
alone may not remove organic matter as well as solutions that include a chelating agent such as
EDTA (Ang et al. 2006; Hong and Elimelech, 1997). However, organic matter extracted from
the membrane surface could not be accurately quantified in cleaning solutions containing EDTA
because EDTA is itself an organic molecule. For example, STPP+EDTA contained 0.8 percent
EDTA, or 8,000 mg/L EDTA, which is orders of magnitude larger than the organic matter
concentration in the cleaning solution due to membrane foulants (~12 mg/L of DOC in the most
concentrated sample extracted with NaOH at pH=11).
69
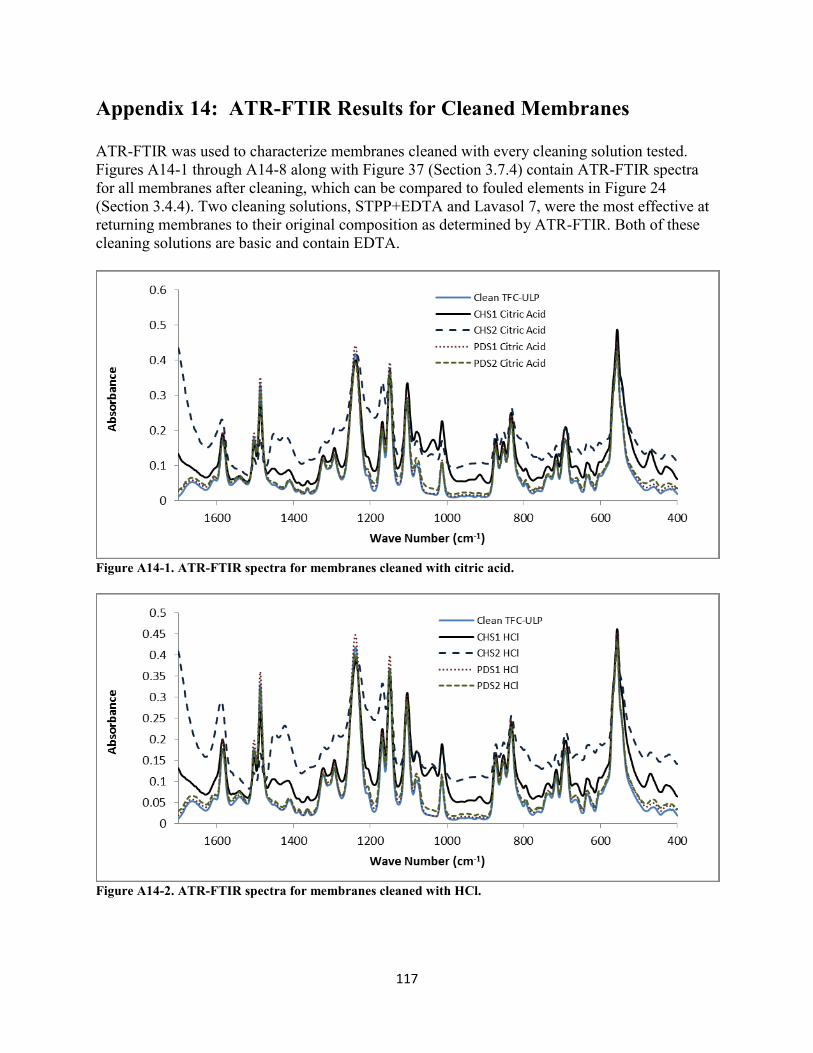
ATR-FTIR spectra of fouled elements yielded absorbance peaks at specific wave numbers
characteristic of certain bond types (see Figure 22). All fouled samples had an absorbance peak
around 1440 m-1
, which is characteristic of calcium carbonate (Stein, 2012). The Castle Hayne
first stage had absorbance peaks characteristic of Si-O, Si-O-Si, and Si-O-Al bonds. When
considered together, these bonds may represent kaolinite, a clay that could have been deposited
in colloidal form or precipitated on the membrane surface. These bonds could also be
characteristic of other aluminum and silicate colloids. Spectra for fouled elements from the
Castle Hayne first stage contained an array of absorbance peaks from a heterogeneous fouling
layer which complicate foulant identification. The other three fouled membranes tested contained
prominent peaks that could not be linked to specific molecules containing the elements identified
by EDX and XPS.
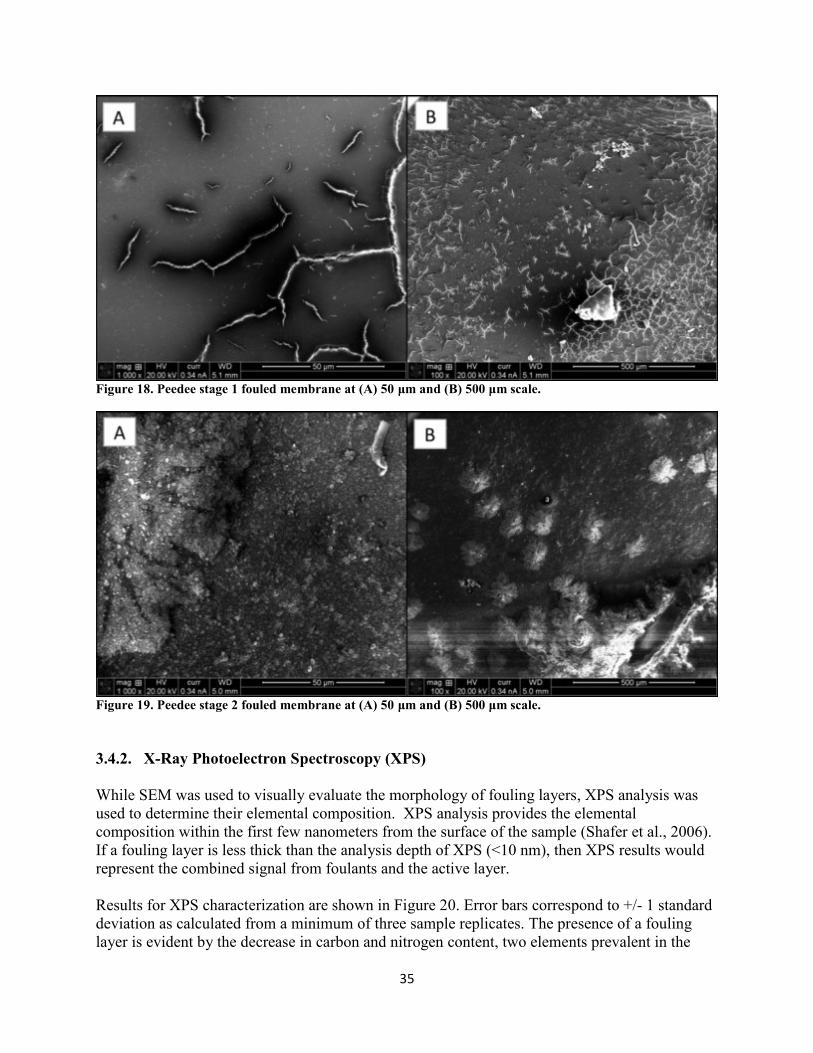
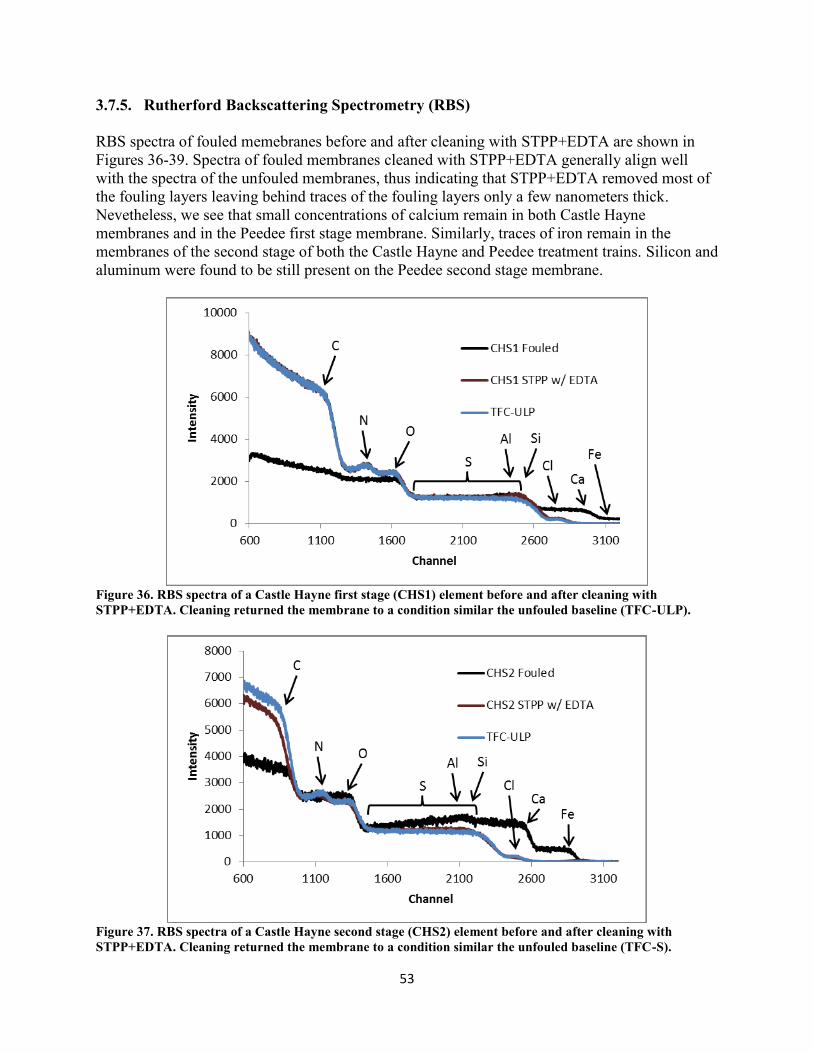
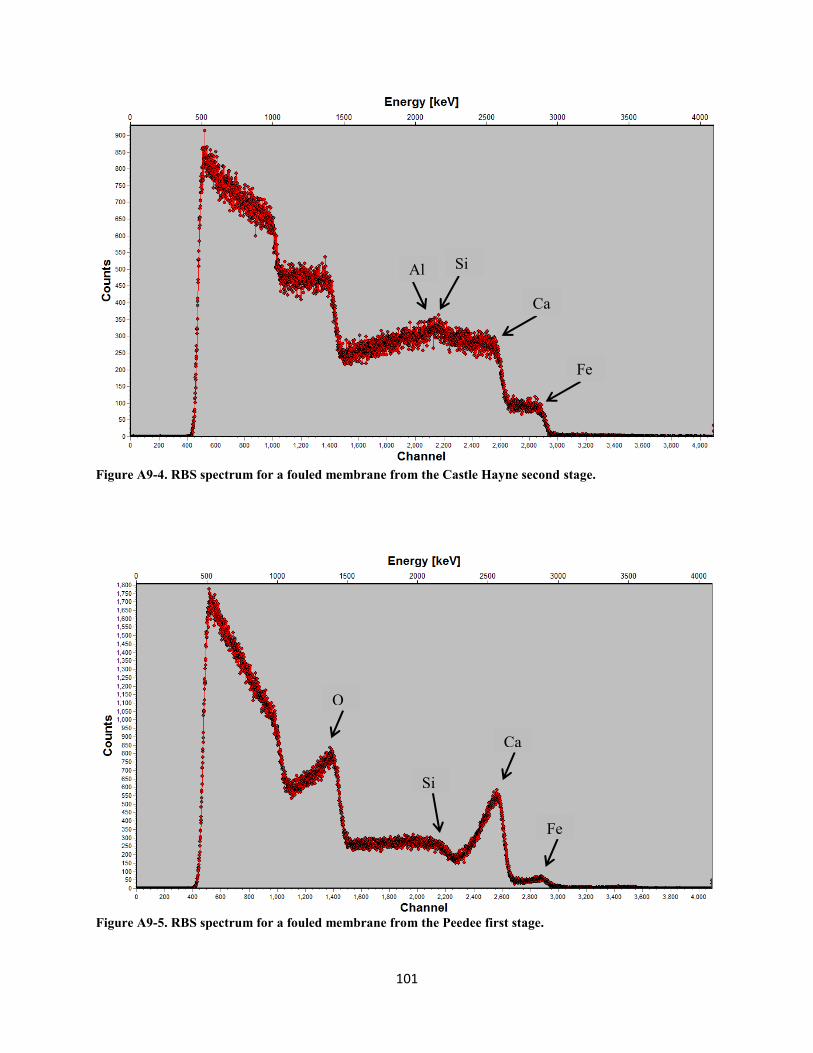
Individual elements present in fouling layers were also identified by RBS. From Figure 24, we
determined that the Peedee first stage and second stage fouling layers had thicknesses of less
than 200 nm and 300 nm, respectively. The Peedee first stage fouling layer had a relatively high
calcium content. The Peedee second stage had three distinct layers, the top layer (<40nm) having
a relatively high iron content, and the bottom two layers having a mixture of carbon, oxygen,
silicon, aluminum, calcium, and iron. The two Castle Hayne fouling layers are thicker than 2 μm
(see Figures 23 and 24). The Castle Hayne second stage fouling layer contains more iron,
calcium, and carbon than the fouling layer of the first stage. The Castle Hayne first stage fouling
layer has a thin surface layer rich in silicon less than 300-nm thick atop a thick fouling sublayer.
Compared to other polyvalent cations, calcium and aluminum were poorly rejected in the full-
scale system (see Table 4). One potential explanation for poor aluminum and calcium rejection is
concentration polarization, but concentration polarization alone would have also resulted in
similarly poor rejection of other dissolved constituents. Another explanation could be that
calcium and aluminum are preferentially present in the fouling layer at the membrane surface.
This hypothesis is supported by the observed presence of aluminum, calcium, and silicon in the
fouling layers of all membranes tested (see Section 3.4), and is consistent with studies reporting
that calcium acts as an intermolecular bridge between nanofiltration membrane surfaces and
organic matter (Li and Elimelech, 2004).
Based on the numerous methods used to characterize the membrane fouling layers, we
determined that all fouling layers contain iron, aluminum, silicon, calcium, oxygen, and carbon.
Organic foulants were detectable in all membranes, but were present in higher concentrations in
the Castle Hayne fouled elements than in the Peedee fouled elements. Significant calcium and
silicon concentrations were observed in all fouled membranes, possibly indicating silicate and
calcium carbonate fouling.
4.2. Potential Removal of Membrane Foulants by Prefiltration
Membrane foulants consisted of a variety of inorganic constituents and organic matter as was
discussed in Section 4.1. Prefiltration methods included the treatment plant’s existing 5-m
filtration as well as 1.2 μm, 0.1 μm, and 100 kDa filtration which simulated sand filtration,
70
microfiltration, and ultrafiltration, respectively. Prefiltration results shown in Section 3.1 indicate
that prefiltration removed over 99% of turbidity in Castle Hayne water, and 42-97% (depending
on the filter used) in Peedee water (see Table 3). Prefiltration also reduced SDI in both samples.
Although prefiltration reduced both turbidity and SDI, the values measured in the source waters
were already below the values specified by the manufacturer as the maximum limits that waters
should have to be apt to serve as influent to the membrane elements (Koch, 2010a and 2010b).
Of the dissolved ions tested, only aluminum was reduced by at least 20% by prefiltration; this
relatively significant aluminum removal may indicate that the aluminum present is colloidal in
nature. The other ions tested were not significantly reduced by prefiltration, and neither was the
concentration of DOC. This includes calcium, silicon, and iron, which are key inorganic foulants
found in the fouling layers, as discussed in Section 4.1.
The inability of sand filtration, microfiltration, and ultrafiltration to remove the dissolved
constituents that make up the fouling layers suggests that improving water quality of the
membrane feed via pretreatment by prefiltration methods would not significantly reduce the
membrane fouling potential of the feed waters.
4.3. Preventing Full-Scale Membrane Fouling
Given that prefiltration was ineffective at removing membrane foulants as described in
Section 4.2, other methods for preventing membrane fouling should be considered. Two methods
to prevent the formation of membrane foulants are pH control and the addition of an antiscalant.
At the treatment plant, Castle Hayne feed water is adjusted to a pH of approximately 6.0 before
treatment to prevent the precipitation of inorganic foulants. The pH of Peedee feed water is also
adjusted to a value of 6.67. Both the Castle Hayne and Peedee treatment trains use an antiscalant
as well.
Silicon was an important membrane foulant identified in all four-fouled membranes tested (see
Figures 20, 21, and 26). In the bench-scale fouled membrane, silicon was the predominant
membrane foulant and could not be efficiently removed by any of the cleaning agents tested (see
Figure 27). Given the silicon concentrations in the influent Castle Hayne and Peedee waters,
solubility limit analyses in the membrane concentrate waters indicate that fouling by silicates
potentially occurs in both the Castle Hayne and Peedee membranes. Silicate solubility at the
temperature (13°C) of influent waters to the membrane stages is approximately 100 mg/L as SiO2
at pH=7.0 (FILMTEC, 2013). At the pH conditions of the Castle Hayne (pH5.99) and Peedee
(pH6.7) waters in the membrane stages (see Table 2), silicate solubility increases to 112 and
106 mg/L as silicate for Castle Hayne water and Peedee water, respectively. Influent silicon
concentrations in the Castle Hayne and Peedee waters were found to be 8.0±8.8 mg/L as Si and
5.9±7.1 mg/L as Si, respectively (see Table 2). Using the 95% upper confidence level of silicon
solubility limits for Castle Hayne (16.8 mg/L as Si) and Peedee (13 mg/L as Si) waters, we
converted these values to 36.0 mg/L as SiO2 and 27.8 mg/L as SiO2, respectively. Given 80%
recovery in the system (see Figures 9 and 10), silicate concentrations could potentially increase
in the membrane feed channel to 180 mg/L as SiO2 in the Castle Hayne treatment train and 139
71
mg/L as SiO2 in the Peedee treatment train. Both values are above the solubility limit for silicates
in their respective waters. Decreasing solution pH only increases silicate solubility by
approximately 12% per pH unit (FILMTEC, 2013), thus silicate solubility would only be 136
mg/L at pH=4, making acidification of the feed solution impractical for controlling fouling by
silicate. The potential problem of fouling by silicates is compounded by Luo and Wang’s (2001)
observation that precipitation of silicates also occurred at concentrations below saturation during
high-pressure membrane filtration; Luo and Wang suggested catalysis by Al3+
and Fe3+
ions as
the most probable cause. Given the challenges to control silicate solubility by pH adjustment and
the possibility of silicate precipitation below saturation conditions, antiscalants are often used to
control silicate fouling.
Antiscalants disrupt one or more of the stages of scale formation by (1) increasing the
concentration of ions needed for clustering, (2) disrupting nuclei ordering or crystal structure, (3)
repelling ions from crystal surfaces to prevent growth, or chelating dissolved ions (Greenlee et
al., 2009). The CFPUA uses SpectraGuard™, produced by Professional Water Technologies™,
which is supposed to control silica fouling. Although we were unable to test alternative
antiscalants or dosing due to challenges recreating fouling in the laboratory (see Sections 3.5 and
4.8), we did see an increase in the presence of silicon in fouling layers when an antiscalant was
not added in the laboratory (Figure 27). While we cannot categorically say that the antiscalant
used by the treatment facility reduced silicate fouling, we observed significantly high silica
concentrations in fouling layers generated in the laboratory when the antiscalant was not added.
4.4. Comparison of Dead-End and Cross-Flow Systems for Testing
Membrane Performance and Cleaning Efficiency
4.4.1. Membrane Performance
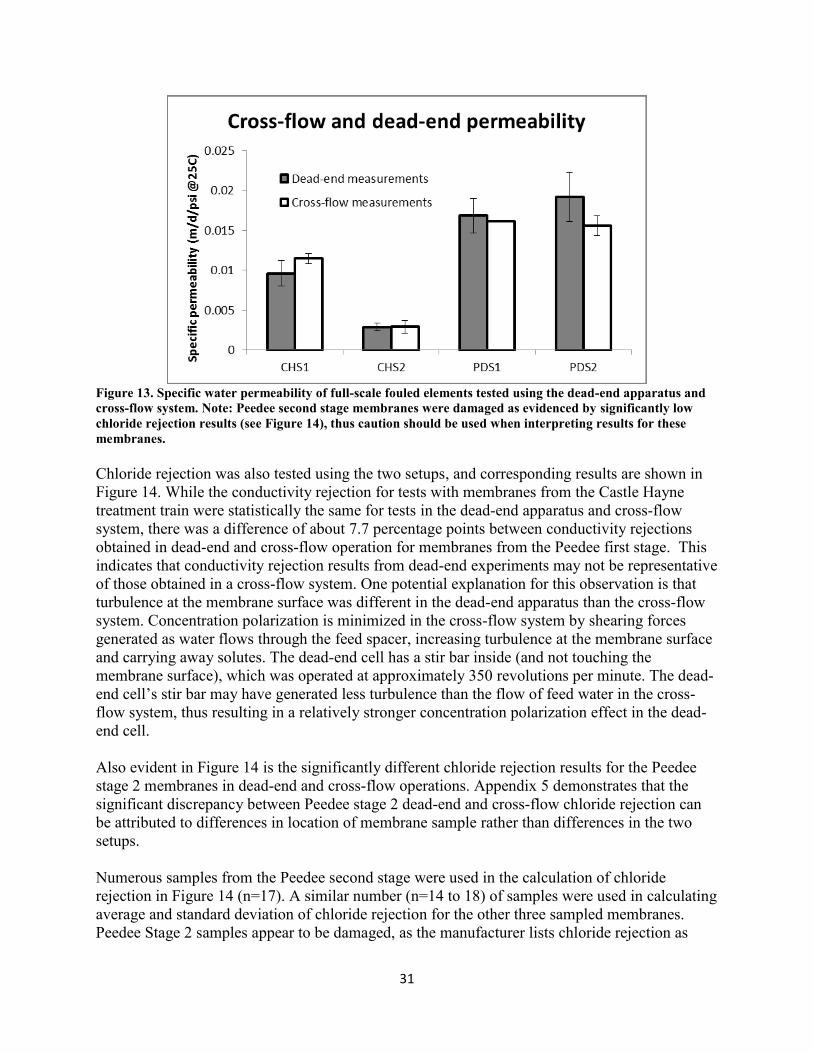
Membrane water permeability and salt rejection were measured in both dead-end and cross-flow
cells. Figure 13 in Section 3.3 shows the results for water permeability tests performed on fouled
membranes using the two setups. These results demonstrate that the dead-end and cross-flow
cells yield statistically equal values of water permeability, and therefore that water permeability
measurements in dead-end configuration are representative of corresponding measurements in
cross-flow configuration.
Figure 15 in Section 3.3 shows chloride rejection by fouled membranes using the dead-end and
cross-flow configurations. Chloride rejections obtained with both configurations wre statistically
equal for Castle Hayne fouled membranes. By contrast, dead-end chloride rejections were lower
than cross-flow chloride rejections for the Peedee fouled membranes by 8 percentage points and
29 percentage points for first stage membranes and second stage membranes, respectively. As
discussed in Section 3.3, however, the membranes from the Peedee second stage were damaged
and had a relatively high variability of performance properties with respect to membrane
sampling location in the membrane element. Nevertheless, the chloride rejection difference of 8
percentage points obtained for the fouled membranes collected form the Peedee first stage
indicate that dead-end chloride rejection may not be representative of cross-flow rejection. For
treating freshwaters where the primary constituents of concern are iron and manganese,
72
differences in chloride rejection of a few percentage points between the two setups may not be as
important as these differences would be for e.g. seawater applications.
4.4.2. Cleaning Efficiency
Water permeability was also tested after cleaning fouled membranes in the dead-end and cross-
flow configurations to determine if the two cleaning procedures were similarly effective at
recovering membrane performance. Figure 30 in Section 3.6 shows that water permeability
measurements obtained after cleaning with STPP+EDTA in dead-end and cross-flow
configurations were statistically equal. Figure 31 in Section 3.6 compares dead-end and cross-
flow cleaning with citric acid. Citric acid cleanings were only performed once in the cross-flow
system, but if we assume a standard error equal to that of STPP+EDTA cleaning for the Peedee
second stage element (see Figure 30), then the two cleaning setups yield statistically equal
permeability. The comparison of water permeability results between membranes cleaned in dead-
end configuration and membranes cleaned in cross-flow configuration demonstrate that water
permeability measurements in dead-end configuration are representative of corresponding
measurements in cross-flow configuration.
While in principle cross-flow cleaning and performance testing is preferred over dead-end
cleaning and testing because the cross-flow configuration better represents the fluid dynamics
conditions existing in treatment plants, our results above indicate that the results obtained for
cleaning efficiency and water permeability in dead-end configuration are representative of those
obtained in cross-flow configuration. As a result, we conclude that – for fresh water applications
– the dead-end configuration can be used to satisfactorily obtain performance properties of
membrane samples and cleaning efficiency of cleaning solutions. Dead-end tests have the added
benefit that they are less resource-intensive than cross-flow tests.
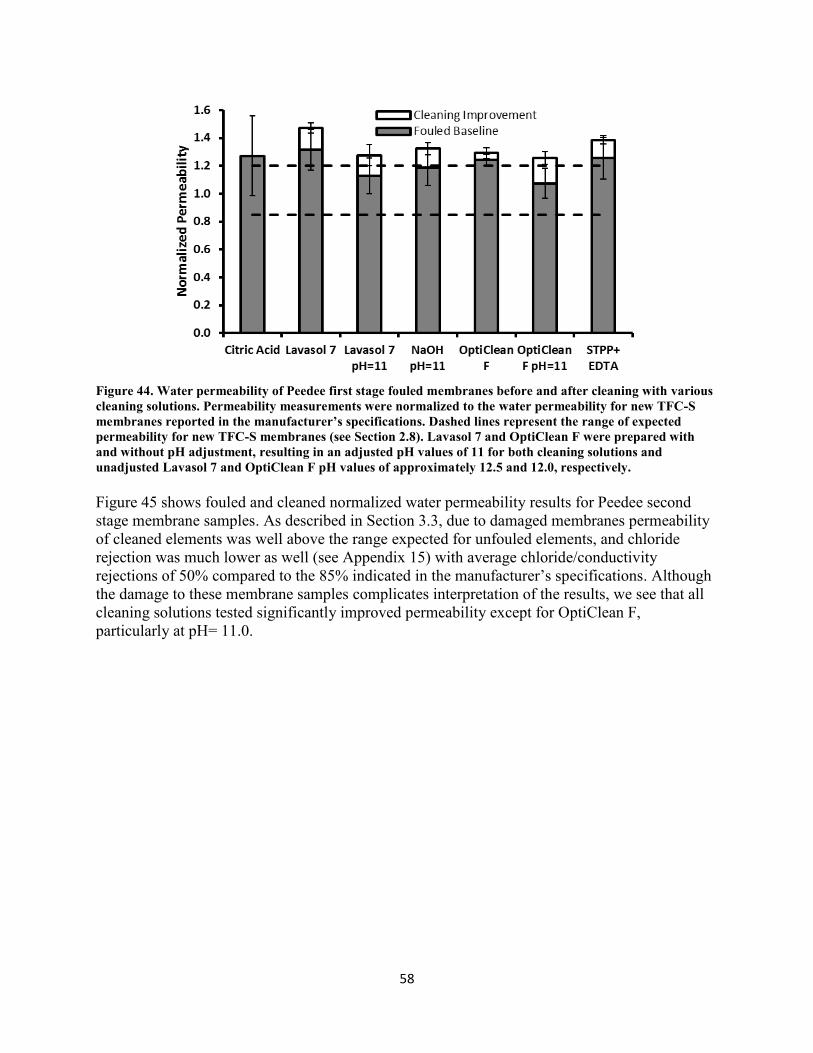
4.5. Evaluating Membrane Cleaning Solutions
To determine the effectiveness of membrane cleaning solutions, three factors were considered:
foulant removal (Section 3.7), performance recovery (Section 3.8), and long-term effects on
Nutrient retention and floodplain connectivity in restoredPiedmont streams
Basic Information
Title: Nutrient retention and floodplain connectivity in restored Piedmont streamsProject Number: 2012NC173B
Start Date: 3/1/2012End Date: 2/28/2013
Funding Source: 104BCongressional District: NC-08
Research Category: Water QualityFocus Category: Nutrients, Hydrogeochemistry, Surface Water
Descriptors: NonePrincipal Investigators: Sara K McMillan, Greg Jennings
Publications
There are no publications.
Nutrient retention and floodplain connectivity in restored Piedmont streams
Nutrient retention and floodplain connectivity in restored Piedmont streams 1
1
Nutrient Retention and Floodplain Connectivity in Restored Piedmont Streams
Sara McMillan (UNC Charlotte), Greg Noe (USGS), Greg Jennings (NCSU)
North Carolina Water Resources Research Institute
Project #12-03-W Interim Report - April 2013
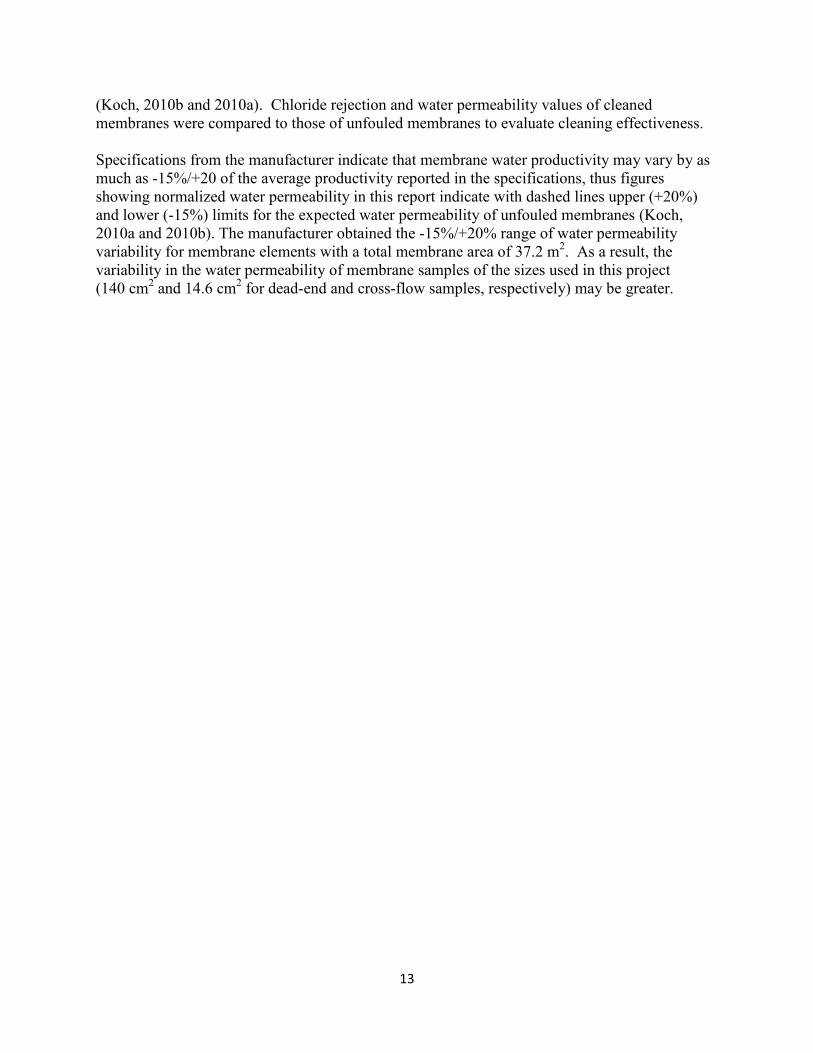
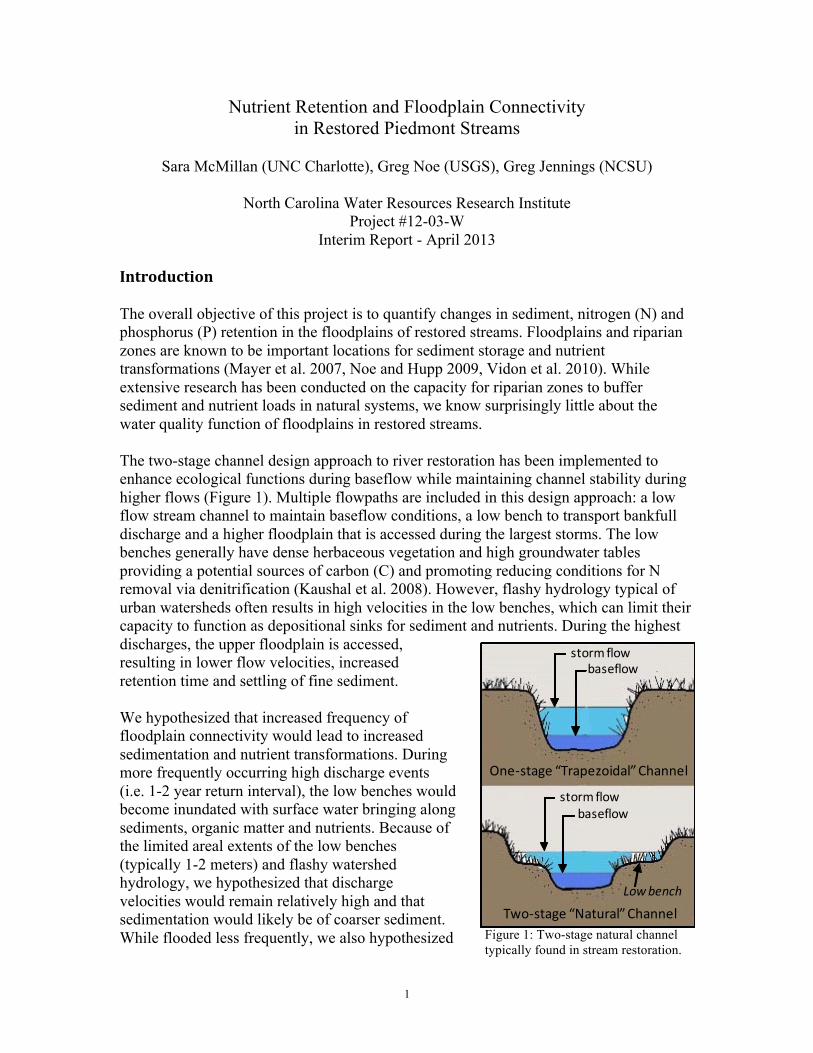
Introduction The overall objective of this project is to quantify changes in sediment, nitrogen (N) and phosphorus (P) retention in the floodplains of restored streams. Floodplains and riparian zones are known to be important locations for sediment storage and nutrient transformations (Mayer et al. 2007, Noe and Hupp 2009, Vidon et al. 2010). While extensive research has been conducted on the capacity for riparian zones to buffer sediment and nutrient loads in natural systems, we know surprisingly little about the water quality function of floodplains in restored streams. The two-stage channel design approach to river restoration has been implemented to enhance ecological functions during baseflow while maintaining channel stability during higher flows (Figure 1). Multiple flowpaths are included in this design approach: a low flow stream channel to maintain baseflow conditions, a low bench to transport bankfull discharge and a higher floodplain that is accessed during the largest storms. The low benches generally have dense herbaceous vegetation and high groundwater tables providing a potential sources of carbon (C) and promoting reducing conditions for N removal via denitrification (Kaushal et al. 2008). However, flashy hydrology typical of urban watersheds often results in high velocities in the low benches, which can limit their capacity to function as depositional sinks for sediment and nutrients. During the highest discharges, the upper floodplain is accessed, resulting in lower flow velocities, increased retention time and settling of fine sediment. We hypothesized that increased frequency of floodplain connectivity would lead to increased sedimentation and nutrient transformations. During more frequently occurring high discharge events (i.e. 1-2 year return interval), the low benches would become inundated with surface water bringing along sediments, organic matter and nutrients. Because of the limited areal extents of the low benches (typically 1-2 meters) and flashy watershed hydrology, we hypothesized that discharge velocities would remain relatively high and that sedimentation would likely be of coarser sediment. While flooded less frequently, we also hypothesized
Figure 1: Two-stage natural channel typically found in stream restoration.
Two-‐stage “Natural” Channel
One-‐stage “Trapezoidal” Channel
storm flowbaseflow
storm flowbaseflow
Low bench
2
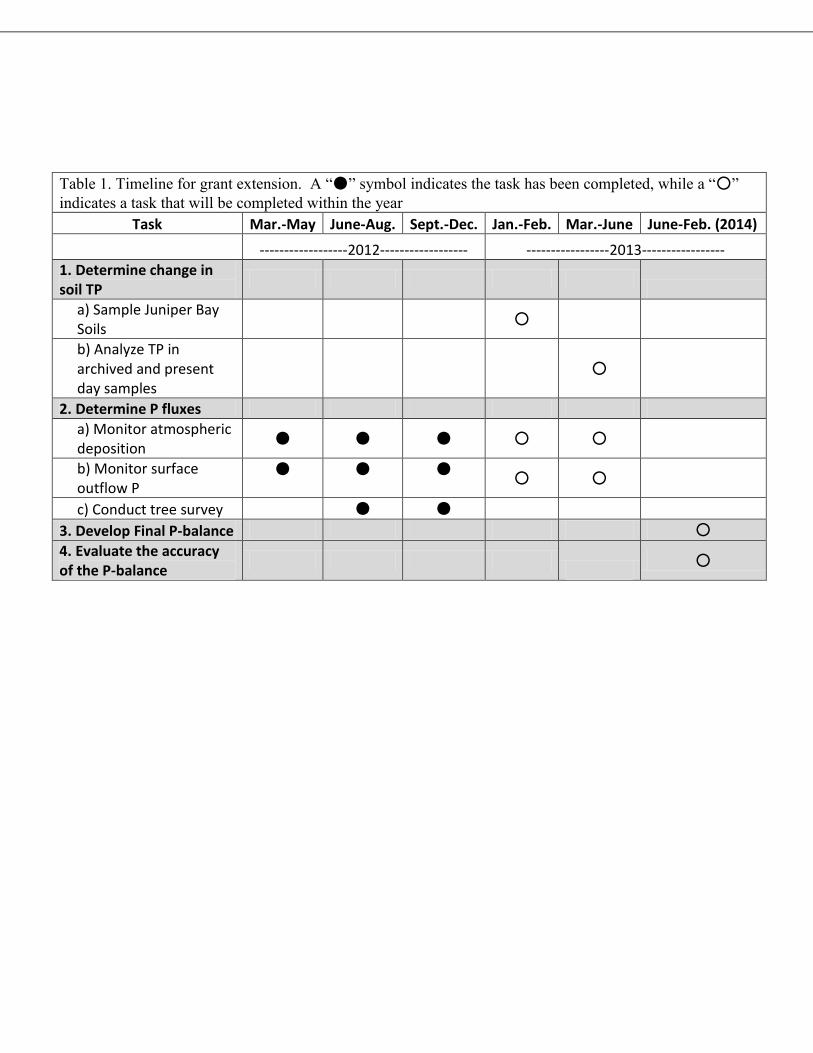
that higher floodplains would trap fine sediment due to significantly decreased flow velocities and thus be more important for particle-derived nutrient trapping. Greater nutrient content of fine organic-rich sediment could result in the upper floodplains functioning as hotspots of N sedimentation, mineralization, and denitrification. Finally, we predicted that restoration age would further enhance these effects. As the restoration project matures, establishment of riparian vegetation and enhanced biological activity in the rhizosphere of the riparian zone would accelerate soil biogeochemical processes. Methods Five study sites were selected to build upon ongoing research activities, particularly focusing on restored reaches with a range of floodplain connectivity (Table 1). To quantify the extent of connectivity, instream stage recorders were installed in June 2013. At the time of installation a preliminary geomorphic survey was completed at each site. We are currently finalizing a more detailed survey of each site that includes multiple cross sections (e.g. one for each tile location), stream pattern and longitudinal profile. For each stream, 6 locations were established (3 in the upper floodplain and 3 in the low bench) for monthly determination of sedimentation rates and inorganic nutrient loading. Monthly sedimentation rates are currently being measured by weighing the dry mass of accumulated sediment on ceramic tiles (20×20 cm). Resin bags are also being used to quantify dissolved inorganic nutrient loading to the floodplain. Both have been collected monthly since May 2012. Table 1: Restored streams included in the study.
Stream Completed Relative floodplain connectivity
Two-stage channel
Little Sugar Creek (LSC) 2004 Low Yes Dairy Branch (DB) 2006 High Yes Muddy Creek (MC) 2010 Medium No Winterfield Tributary (WT) 2011 Medium No Torrence Creek (TOR) 2012 Low Yes Net mineralization of N and P were be measured in situ in the surficial sediments (5 cm) from September through October 2012 using the resin core technique (DiStefano and Gholz 1986) modified for use in hydrologically dynamic wetland and floodplain sediments (Noe 2011). Modified resin cores allow water and gas exchange thereby tracking changes in the surrounding soil abiotic environment (Noe 2011). Mass of N and P in ambient soil were measured in a sample collected at the beginning of the one-month incubation and compared to mass at the end of the incubation. Changes in hydrology (e.g. overbank flooding and rising groundwater tables) deliver nutrients to floodplain soils. Mass loading to the soil was quantified as the mass retained in the outer resin bags of the in site core while biological transformations within the soil were captured by measuring changes in the two inner resin bags and soil core itself.
3
Potential denitrification rates were also measured during the Fall/Winter. Soils were incubated as soil/stream water slurries using the denitrification enzyme activity (DEA) assay (Tiedje et al. 1989, Groffman et al. 1999). Denitrification potential measures the intrinsic capacity for conversion of NO3
- to N2 by removing substrate limitation. Soil samples from low benches and upper floodplains were collected from November 2012 through January 2013. Sedimentation rates, nutrient loadings and denitrification rates were compared across site (n=5) and elevation (n=2) using a two-way ANOVA with Tukey’s HSD post-hoc comparison of means. Reported statistics were determined to be significant at α = 0.05. Means of measured values are presented with error shown as the standard deviation. Relationships between response variables (e.g. denitrification rates) and hypothesized causal variables were tested using simple linear regressions. Preliminary Results and Discussion Average sedimentation rates from May-September 2012 were significantly greater in the low benches (134.2±336.5 g m-2 d-1) compared to the high benches (7.84±15.4 g m-2 d-1) when all sites were lumped together (p= 0.0047, Figure 2). This difference was most evident at DB with total sediment sedimentation rates ranging from 124.0 - 1269.5 g m-2 d-1 at the locations in the low benches and 17.9 – 48.1 g m-2 d-1. However, this patterns was not universally observed, particularly at WT with similar sedimentation rates observed at all sites. Flashy hydrology and localized stream hydraulics in these urban sites controlled rates of sediment erosion and deposition.
Figure 2: Sedimentation rates in the low and high benches from May – September 2012. Data are presented on a log scale and error bars indicated one standard deviation. Letters show significantly different rates by site (p=0.0002).
0.1
1
10
100
1000
10000
WT TOR MC DB LSW
Sedi
men
tatio
n R
ate
(g m
-2 d
-1) Low bench
High bench
a
ab
a
a
b
4
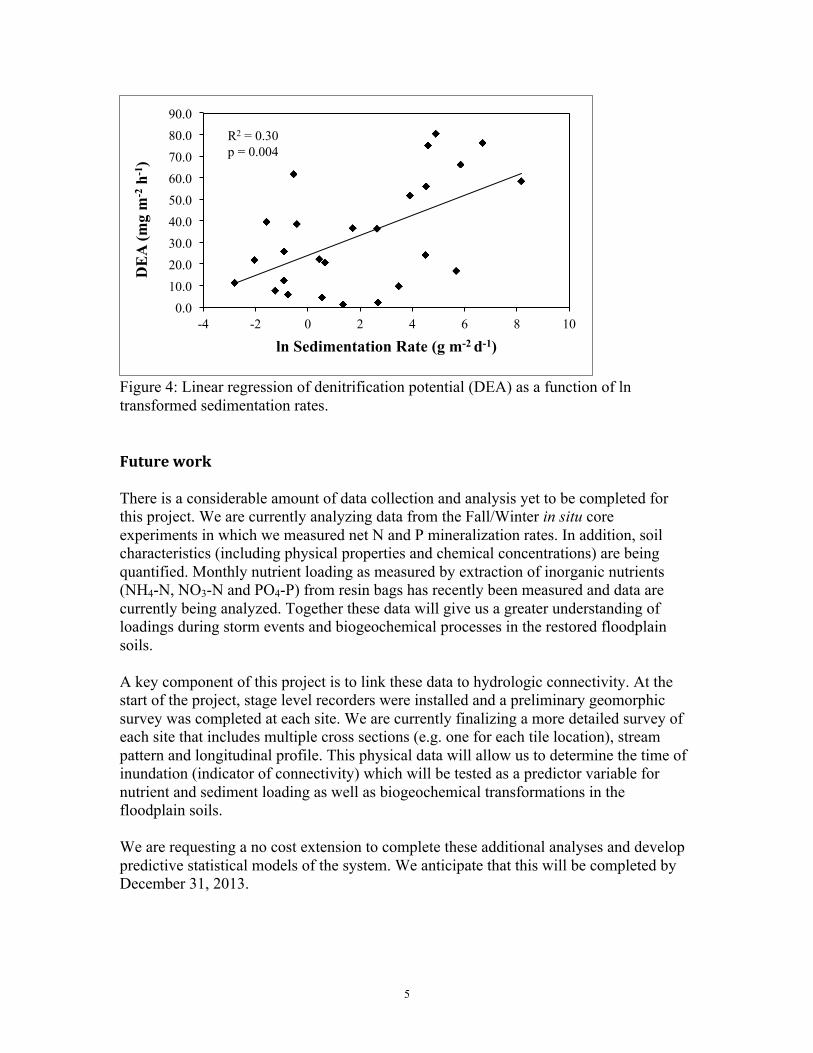
Potential denitrification rates were also measured at each of the sites during Fall/Winter 2012. Rates ranged from 1.2 – 80.4 mg m-2 h-1. No differences were observed between the low and high benches, however differences among sites were significant (p<0.0001, Figure 3). To better understand the factors controlling this variability, we performed simple linear regressions with potential causal variables. While this list is currently being expanded to include more soil and hydrologic metrics, two key variables emerged as significant. First, potential rates of denitrification were positively correlated with sedimentation rates (p=0.004; Figure 4). While the deposited sediment was not high in organic matter content, areas with high sedimentation rates also have well established vegetation and organic soils both of which contribute to increased bacterial activity in the rhizosphere. Restoration age was also an important factor controlling DEA. The oldest sites with mature vegetation exhibited highest rates of denitrification independent of elevation (R2=0.38, p<0.001). The correlation of denitrification rates with restoration age and sedimentation rates highlights the importance of vegetation and soil organic matter to fuel biogeochemical transformations.
Figure 3: Denitrification potential (DEA) with error bars representing one standard deviation. Letters show significantly different rates by site (p<0.0001).
0.0
10.0
20.0
30.0
40.0
50.0
60.0
70.0
80.0
90.0
WT TOR MC DB LSW
DE
A (m
g m
-2 h
-1)
bc c
a
b
bc
5
Figure 4: Linear regression of denitrification potential (DEA) as a function of ln transformed sedimentation rates. Future work There is a considerable amount of data collection and analysis yet to be completed for this project. We are currently analyzing data from the Fall/Winter in situ core experiments in which we measured net N and P mineralization rates. In addition, soil characteristics (including physical properties and chemical concentrations) are being quantified. Monthly nutrient loading as measured by extraction of inorganic nutrients (NH4-N, NO3-N and PO4-P) from resin bags has recently been measured and data are currently being analyzed. Together these data will give us a greater understanding of loadings during storm events and biogeochemical processes in the restored floodplain soils. A key component of this project is to link these data to hydrologic connectivity. At the start of the project, stage level recorders were installed and a preliminary geomorphic survey was completed at each site. We are currently finalizing a more detailed survey of each site that includes multiple cross sections (e.g. one for each tile location), stream pattern and longitudinal profile. This physical data will allow us to determine the time of inundation (indicator of connectivity) which will be tested as a predictor variable for nutrient and sediment loading as well as biogeochemical transformations in the floodplain soils. We are requesting a no cost extension to complete these additional analyses and develop predictive statistical models of the system. We anticipate that this will be completed by December 31, 2013.
0.0 10.0 20.0 30.0 40.0 50.0 60.0 70.0 80.0 90.0
-4 -2 0 2 4 6 8 10
DE
A (m
g m
-2 h
-1)
ln Sedimentation Rate (g m-2 d-1)
R2 = 0.30 p = 0.004
6
References DiStefano, J. F. and H. L. Gholz. 1986. A proposed use of ion exchange resins to measure nitrogen mineralization and nitrification in intact soil cores. Communications in soil science and plant analysis 17:989-998.
Groffman, P. M., E. A. Holland, D. D. Myrold, G. P. Robertson, and X. Zou. 1999. Denitrification. Pages 272-290 in G. P. Robertson, B. P. Bledsoe, D. C. Coleman, and P. Sollins, editors. Standard Soil Methods for Long-Term Ecological Research. Oxford University Press, New York.
Kaushal, S. S., P. M. Groffman, P. M. Mayer, E. Striz, and A. J. Gold. 2008. Effects of stream restoration on denitrification in an urbanizing watershed. Ecological Applications 18:789-804.
Mayer, P. M. R., S. K. McCutchen, M. D. Canfield, and J. Timothy. 2007. Meta-analysis of nitrogen removal in riparian buffers. Journal of Environmental Quality 36:1172.
Noe, G. B. 2011. Measurement of net nitrogen and phosphorus mineralization in wetland soils using a modification of the resin-core technique. Soil Science Society of America Journal 75:760-770.
Noe, G. B. and C. R. Hupp. 2009. Retention of Riverine Sediment and Nutrient Loads by Coastal Plain Floodplains. Ecosystems 12:728-746.
Tiedje, J. M., S. Simkins, and P. M. Groffman. 1989. Perspectives on measurement of denitrification in the field including recommended protocols for acetylene based methods. Plant and Soil 115:261-284.
Vidon, P., C. Allan, D. Burns, T. Duval, N. Gurwick, S. Inamdar, R. Lowrance, J. Okay, D. Scott, and S. Sebestyen. 2010. Hot spots and hot moments in riparian zones: potential for improved water quality management. Journal of the American Water Resources Association:278-298.
Information Transfer Program Introduction
The Water Resources Research Institute (WRRI) is heavily geared to providing water resources information tothe water professional. WRRI maintains a strong information transfer program by cooperating with variousstate agencies, municipalities, and professional organizations to sponsor workshops and other events and byseeking grants for relevant activities.
The professionals targeted by this program include private entrepreneurs, federal, state and local governmentstaff and officials, and representatives of industry, agriculture, consulting, and environmental groups. Themain forms of information transfer are through an Institute internet site, bi-monthly newsletter, conferences,seminars, forums, workshops, luncheons, and research publications.
The workshops conduced through WRRI’s partnership with the Department of Environment and NaturalResources Division of Energy, Mineral and Land Resources constitute the primary means by which theDivision meets its educational obligations on sediment control under the state’s Sediment Control Act.
WRRI continues to be a sponsor of continuing education credits by the NC Board of Examiners of Engineersand Surveyors as an Approved Sponsor of Continuing Professional Competency activity for ProfessionalEngineers and Surveyors licensed by the State of North Carolina. In addition, WRRI also submits informationfor approval to the N.C. Board of Landscape Architects to offer contact hours to landscape architects. Thisallows WRRI to offer Professional Development Hours (PDHs) to engineers and surveyors, and ContinuingEducation Units (CEUs) to landscape architects for attendance at the WRRI Annual Conference and otherworkshops, seminars and forums that WRRI sponsors.
During this reporting year, WRRI provided 65.5 PDHs and 55.5 CEUs to 1048 people at 12 workshops,seminars, and other events described below.
Information Transfer Program Introduction
Information Transfer Program Introduction 1
WRRI Information Transfer Program
Basic Information
Title: WRRI Information Transfer ProgramProject Number: 2012NC174B
Start Date: 3/1/2012End Date: 2/28/2013
Funding Source: 104BCongressional District: NC-02
Research Category: Not ApplicableFocus Category: None, None, None
FY 2012 Information Transfer Progress & Achievements
WRRI Sponsored Workshops, Forums and Seminars Below is a list of the educational and training events WRRI sponsored during the project year, along with a description of each and the number of attendees. In total, through these workshops, WRRI offered 65.5 Professional Development Hours, 55.5 Continuing Education Units, and reached 1048 participants. March 6, 2012 Water Audit Software Training Best-practices for Water Auditing and Loss Control, as developed by the American Water Works Association, are beginning to take hold among water systems in the Southeast and across the nation. Water Auditing and Loss Control programs are the most effective ways for a utility to conserve water, save operating expenses, and increase revenues. To this end, the AWWA Water Loss Control Committee has made available a free software application as a useful and easy way for utilities to compile a basic, preliminary audit of water supply and billing operations, and begin to measure key performance indicators for water system efficiency. Join us on January 19th to learn how to use the software, to gain a thorough understanding of the data inputs and data validity, and to understand software outputs and how to apply them to your utility. Participants will benefit from team work, paper exercises, computer work, and a small amount of lecture, and will learn using real and simulated data from large and small utilities. Attendance: 20 March 27-28, 2012 WRRI Annual Conference and NCWRA Symposium Description: The WRRI annual conference is the premier research conference focusing on North Carolina's water resource issues, solutions, and opportunities. The NC Water Resources Association was again a key partner, with the NCWRA Annual Symposium “Mitigation Policy in NC: Is the Train on the Right Track?” being an integral element of the conference program. Local and state governments are under increasing pressure to protect and restore water resources and maintain the ecological integrity of aquatic habitats. Yet, experience has shown that restoring physical habitat alone may not be sufficient to achieve thriving biological communities, and that the interactions of a vast array of environmental variables and the complexities of ecosystem science make restoration needs difficult to understand and efforts costly to plan, implement, and regulate. The goal of the symposium was to help us better understand these complexities and prepare for the future restoration and protection of NC's water resources. In addition to this portion of the agenda, the symposium sparked a flood of conference abstracts that ended up creating a session track on stream restoration that spanned the length of the conference and was very well received. The conference offered 9.5 PDHs, 9.5 CEUs, and had 210 attendees. Over a 2-day period, the conference featured 110 presentations – 63 oral presentations over 15 concurrent sessions, 12 invited speakers in special sessions, and 35 poster presentations. Attendance: 257 March 28, 2012 Progress Energy Seminar "Reality Check: Water Quality Management Perspectives from Scientists, Regulators, and the Regulated” Description: Protection and restoration of surface waters from the impacts of non-point source pollution have received significant statewide and national attention in recent years. As price tags and regulations associated with water quality impairment and watershed rehabilitation
grow, there is an increasing need for research and data on aquatic ecosystems and what policies and strategies can realistically deliver desired results. The Progress Energy seminar brings together members of the scientific and environmental communities to discuss the realities of the ecological complexity of the ecosystems we seek to manage, as well as state regulators, and local governments to provide their perspectives on the reality of enforcing and complying with regulations designed to recover these ecosystems. Attendance: 150 April 17-18, 2012 Erosion and Sedimentation Control Planning and Design Workshop Description: These workshops are structured to educate and familiarize design professionals with the NC Sedimentation Pollution Control Act (SPCA), the rules implementing the Act, design standards for erosion and sedimentation control BMPs, and elements that are necessary to submit an erosion control plan. This comes directly from the source—the NC Division of Land Resources Land Quality Section and its partners to provide professionals with the information they need to submit an erosion control plan and prevent pollution by sedimentation. Attendance: 102 May 7, 2012 NCWRA Seminar "Making Green Development a Reality in Coastal North Carolina" Description: One of few authentic green communities in North Carolina, The Village of Woodsong, a Traditional Neighborhood Development (TND) near Shallotte, received the first ever Outstanding Recognition award for environmental excellence by The Lower Cape Fear Stewardship Program. Woodsong's stormwater plan was created to meet the triple bottom line of social, financial, and environmental values as it aimed to meet regulations and improve water quality. The presenter, Mr. Buddy Milliken, discussed his experience with getting innovative development ideas through the planning and permitting process and into reality in Woodsong, as well as potential barriers to future green development in the state. Attendance: 41 September 10, 2012 NCWRA Seminar, “Water Quality Considerations for Shale Gas Development in North Carolina" Description: In May 2012, the NC Department of Environment and Natural Resources completed a study of the potential for development of shale gas in North Carolina. With the passage of Senate Bill 820 in summer 2012, the NC General Assembly lifted prohibitions on technologies needed to exploit this potential resource and directed DENR to develop regulations for the shale gas exploration and production activities. Evan Kane presented an overview of some of the water quality considerations associated with potential shale gas development in North Carolina and a preview of the regulatory development process that lies ahead.. Attendance: 103 October 10, 2012 Erosion and Sedimentation Control Planning and Design Workshop, Swansboro NC Description: These workshops are structured to educate and familiarize design professionals with the NC Sedimentation Pollution Control Act (SPCA), the rules implementing the Act, design standards for erosion and sedimentation control BMPs and elements that are necessary to submit an erosion control plan. This comes to directly from the source-the NC Division of Land Resources Land Quality Section and its partners providing you with the information you need to submit a plan and prevent pollution by sedimentation. The workshop focused on considerations
for land planning and enhancement of developing watersheds. Techniques will be discussed for channel design, conveyance of runoff, and surface dewatering. Design criteria for erosion control materials were demonstrated through use of online tools. Attendance: 39 November 15, 2012 Erosion and Sedimentation Control Planning and Design Workshop, Hickory NC Description: See description above. Attendance: 89 December 3, 2012 NCWRA Seminar “The Role of Manufacturing and Industry in Promoting and Implementing Water Reuse in North Carolina” Description: This program will focus on water reuse and non-traditional water sources such as municipal and industrial wastewater, harvested rainwater, stormwater, condensate, and remediated groundwater, and we will discuss the importance of these to holistic water supply planning and future resource management strategies for North Carolina. The presentation will include regulatory and statutory revisions enacted by the 2011 session of the General Assembly, as well as pertinent topics for upcoming sessions of the General Assembly, including Aquifer Storage & Recovery (ASRs), intrusion barriers, potable reuse, regulatory reform, and hydraulic fracturing. Local case studies of sustainable water practices implemented at commercial, institutional and industrial facilities will be highlighted. Attendance: 31 December 4, 2012 Erosion and Sedimentation Control Planning and Design Workshop, Raleigh NC Description: See description for previous Erosion and Sediment Control workshops. Attendance: 90 February 5-6, 2013 Local Programs Erosion and Sediment Control Workshop Description: The Local Programs Workshop provides training for local governments that have ordinance delegation and enforces the North Carolina Sedimentation Pollution Control Act. The training provides local programs an opportunity to be updated on the most current erosion and sedimentation control research and to get together with other local programs and exchange sedimentation and erosion control ideas and practices utilized at the local level. This training is helpful for landscape architects that may work for a local government that has an erosion and sedimentation control program. Attendance: 100 February 11, 2013 NCWRA Seminar “Clean Water Management Trust Fund: Understanding Programmatic Changes and the Future of North Carolina’s Surface Waters” Description: The Clean Water Management Trust Fund was created to provide resources to protect and restore water quality across North Carolina. Current and evolving threats make our limited water resource of great importance to sustaining our state’s ability to adapt and meet the growing demands on this resource in a balanced way. This presentation provided an overview of the Clean Water Management Trust Fund and the programs that are in place to help communities protect, restore, and enhance surface waters in North Carolina. Attendance: 26 Newsletter
Published the WRRI News four times during the reporting period (April-June 2012 Issue #378, July-Sept 2012 Issue #379, Oct-Dec 2012 Issue #380 and Jan-Mar 2013 Issue #381). The WRRI News is an 8-12 page newsletter that covers a wide range of water-related topics from current federal and state legislation and regulatory activities to new research findings, water-related workshops and conferences, and reviews of water-related publications. The WRRI News is now sent electronically to 1008 federal and state agencies, university personnel, multi-county planning regions, city and local officials, environmental groups, consultants, businesses and individuals. It is also posted on the WRRI website http://www.ncsu.edu/wrri/code/publications/currentpublications.htm Internet Services WRRI continues to maintain a website, www.ncsu.edu/wrri. Overall, the goals of our website are:
to provide access to information on upcoming events (seminars, workshops, etc) that are hosted by WRRI and other events in the state related to water resources, as well as access to materials and resources from past events;
to provide information to the research community about funding opportunities and state research priorities;
to increase dissemination of information by providing access to research reports, the WRRI newsletter, and other relevant publications;
to provide information on key organizations with which WRRI has strong partnerships and which play a key role in water resource research and management in the state;
to provide background information about WRRI at the state and federal levels, our roles, and what we can offer to different audiences throughout the state.
A related component of the website involves working with NC State University’s DH Hill Library to increase and enhance WRRI’s use of their technical reports repository for all WRRI publications. Through this collaboration, we are now able to direct people to this well organized, easily searchable site where they can access research reports from all WRRI-funded projects as far back as the 1960s. WRRI Electronic Lists WRRI maintains the following electronic mail lists (listservs) for information transfer purposes:
Water-Research list - 211 subscribers – inform water researchers from NC universities about calls for papers, grants, upcoming conferences, student internships, etc.;
WRRI-News list - 1008 subscribers - informs researchers, local governments, municipalities, interest groups etc. about calls for papers, grants, upcoming conferences and events, etc.;
NCWRA-info list - 305 subscribers - provides information of the North Carolina Water Resources Association sponsored events;
Urban Water Consortium (UWC) for Urban Water Consortium member communications;
and UWC-Stormwater Group list for the UWC Stormwater Group member communications.
NC Urban Water Consortium
WRRI administers the NC Urban Water Consortium (UWC) and meets with the members quarterly. The consortium was established in 1985 by the Institute, in cooperation with several of North Carolina's larger cities to provide a program of research and development, and technology transfer on water problems that urban areas share. Through this partnership, WRRI and the State of North Carolina help individual facilities and regions solve problems related to local environmental or regulatory circumstances. Participants support the program through annual dues and enhancement funds and guide the program through representation on an advisory board, selection of research topics, participation in design of requests for proposals, and review of proposals. There are 12 member cities/special districts in North Carolina, and several members hosted quarterly meetings on the following dates: March 9, 2012 in Raleigh; June 22, 2012 in Greenville; September 7, 2012 in Carrboro; and December 7, 2012 in Cary. The UWC also provided financial support to two research projects, which increased WRRI’s ability to fund other high quality research with 104(b) funds. The two projects funded by the UWC were:
“Bioavailability and fate of organic nitrogen loading to Neuse River Estuary phytoplankton” by PI Hans Paerl, UNC-Chapel Hill
“Fats, Oil, and Grease Communications Implementation” by PI Regina Guyer, UNC-Charlotte
NC Urban Water Consortium - Stormwater Group In 1998, several members of the NC UWC partnership formed a special group to sponsor research and technology transfer on issues related to urban stormwater and management. The Urban Water Consortium (UWC) Stormwater Group is administered by WRRI. Participants support the program through annual dues and enhancement funds. They guide the program through selective representation on the WRRI advisory board, determining stormwater-related research priorities, participation in the design of requests for proposals and review of proposals submitted to WRRI directly or to the SWG. During this reporting year, the SWG added their ninth member, the City of Burlington, to their membership. Quarterly meetings were held on the following dates: March 8, 2012 in Raleigh; June 21, 2012 in Greensboro; October 11, 2012 in High Point; and December 6, 2012 in Charlotte. Individual members of the UWC-SWG provided funding for three research projects as enhancement projects through WRRI entitled:
- “Evaluating the Hydrologic and Water Quality Performance of Infiltrating Wet Ponds and Development of Supplemental Infiltrating Pond Design Guidance” by PI William Hunt
- “Implementing Permeable Pavement in Triassic Soils and Statewide to Reduce Runoff Volume and Nutrient Loads” by PI William Hunt
- “Downspout Disconnection & Rain Catchers Assistance” by PI William Hunt
USGS Summer Intern Program
None.
USGS Summer Intern Program 1
Student Support
Category Section 104 BaseGrant
Section 104 NCGPAward
NIWR-USGSInternship
SupplementalAwards Total
Undergraduate 7 0 0 0 7Masters 3 0 0 0 3
Ph.D. 1 0 0 0 1Post-Doc. 0 0 0 0 0
Total 11 0 0 0 11
1
Notable Awards and Achievements
1. Dr. Susan White Named New Director of NC WRRI and NC Sea Grant
Ecologist Susan N. White was named the new executive director for Water Resources Research Institute ofthe University of North Carolina and North Carolina Sea Grant upon the retirement of Michael P. Voiland inDecember 2012.
"Susan brings a strong science background, as well as leadership working with a mix of partners andstakeholders," notes Vice Chancellor Terri L. Lomax of North Carolina State University, where the twostate/federal partnership programs are headquartered.
"She will be a great leader for WRRI and Sea Grant programs here that have strong traditions of assisting andguiding communities, businesses, organizations and the public," Lomax adds. Sea Grant focuses on theecosystems and economies of the coastal region, while WRRI supports research and training related tofreshwater topics statewide.
White, who earned a doctorate from the University of Georgia, is returning to her home state. She grew up inOrange County and graduated from Duke University. She is eager to lead both University of North Carolinasystem programs that provide targeted research, outreach and education projects.
"I am excited to have this opportunity to work with the excellent teams associated with North Carolina SeaGrant and WRRI to continue to address the current and future critical coastal, ocean, and water resourceissues in the state and within the region," she says.
White’s previous position was with the National Oceanic and Atmospheric Administration's Hollings MarineLaboratory in Charleston, SC. The Hollings lab is a Center of Excellence in Oceans and Human Health,working in partnership with the College of Charleston, Medical University of South Carolina, South CarolinaDepartment of Natural Resources, and the National Institute of Standards and Technology.
As Hollings director since 2010, White had provided research vision and organizational management,including strategic planning with the partner agencies and universities. She previously served as deputydirector, responsible for budgets and administration, with a focus on accountability and performancemeasures. The interdisciplinary facility provides science and technology research on coastal ecosystems, withan emphasis on linkages between the condition of coastal environments and human health and well-being.
"Her watershed approach — from the mountains to the sea — is a great fit for North Carolina, along with herknowledge of rapid-detection tools and technologies, and coastal health early warning systems," Lomax adds.
Formerly the national research coordinator for NOAA's Estuarine Reserves Division and National EstuarineResearch Reserve System, White is a board member of The Coastal Society. She has served on national andregional steering committees on topics including technology transfer, integrated drought monitoring and earlywarning, and climate's connections to health.
"We are very fortunate to have a scientist, administrator and native North Carolinian of Susan's caliber andexperience take on the leadership for Sea Grant and WRRI. I am most confident that she will serve bothprograms well," notes Voiland, who has served with White on the NOAA in the Carolinas executive andsteering committees.
Notable Awards and Achievements 1
2. NC WRRI Coordinator for Research and Outreach Accepted to Fellowship Program Nicole Wilkinson, theCoordinator for Research and Outreach at NC WRRI was accepted as a fellow in the Natural ResourcesLeadership Institute (NRLI) program in January 2013. NRLI brings together people from across NorthCarolina to develop leadership competencies for effectively engaging in today’s complex, and oftencontroversial policy environment. Since 1995, hundreds of professionals who are involved in naturalresources policy, planning, education, and management have participated in the Institute, building skills andknowledge in conflict resolution and multi-party negotiation, critical thinking, and collaborative problemsolving. The goal of the program is to enhance leadership in environmental management and policydevelopment, leadership that will influence workable solutions to complex, often contentious environmentalissues. The curriculum spans 18 months and includes approximately 140 hours of instruction time, as well astime spent outside of the classroom on a practicum project related to WRRI’s work and priorities. Mrs.Wilkinson will graduate from NRLI in June 2014.
3. WRRI Hires New Newsletter Editor Science writer and editor Rhett Register recently joined the NorthCarolina Water Resources Research Institute. His duties also include writing for North Carolina Sea Grant’sCoastwatch magazine. “We were lucky to find someone like Rhett with a strong background in science, policyand writing who also has the capacity to cover the range of issues – from the mountains to the coast – that ourstate and WRRI must contend with,” says Nicole Wilkinson, Coordinator for Research and Outreach atWRRI. “Most people specialize in either freshwater or saltwater, so Rhett’s diversity makes him a great fit forthis position that we share with NC Sea Grant,” she adds.
Register credits his birthplace, Jacksonville, Fla., for marking him with an early love for watery environments,with its easy access to beaches, rivers and Florida’s massive springs. He has a background in writing aboutcoastal planning and water resource issues. “Working with WRRI and NC Sea Grant and has allowed me tocombine my love for the aquatic environment with my interest in writing and communications,” Register says.
Prior to joining WRRI, Register worked as a researcher with National Geographic magazine and at NationalGeographic Traveler, researching and covering topics as varied as the American Civil War and marineprotected areas. He also has worked with Oregon Sea Grant and a community newspaper. He has taughtEnglish, including three years in Japan. Register holds an undergraduate degree in English from theUniversity of North Florida, and a master’s degree from the marine resource management, or MRM, programat Oregon State University.
He joins the team as Jeri Gray, long-time newsletter editor and previous WRRI education coordinator, leavesWRRI. While Ms. Gray officially retired from WRRI many years ago, she has stayed on as the organization’snewsletter editor, covering water resource issues in our state with great skill, depth, and detailed analysis thathas served to inform the state about priority topics for many years.
4. WRRI Co-Produces Erosion and Sediment Control Needs Assessment WRRI has had a long-standingrelationship with North Carolina’s Division of Energy, Mineral and Land Resources (DEMLR, previously theDivision of Land Resources) in the state’s Department of Environment and Natural Resources (DENR).WRRI co-hosts annual erosion and sediment control workshops that help the division satisfy its mandate toprovide education pursuant to the Sedimentation Pollution Control Act of 1973. As development slowed inthe state during the economic downturn beginning in 2008, participation in training events decreased andprofessional needs changed as design professionals found themselves either without work or with increasedjob responsibilities where they needed to learn new skills and wear new hats. In order to ensure that theerosion and sediment control workshops continued to meet the present needs of professionals and continue tosatisfy DEMLR’s education provider requirements, WRRI worked with the Center for Urban and CommunityServices at NC State University to conduct a statewide training needs assessment for erosion and sedimentcontrol professionals. A total of 713 respondents participated in the assessment, and the results have been usedto inform the design and implementation of training in FY 12. While registration numbers were still low,
Notable Awards and Achievements 2
participant feedback indicated that presentation topics were very appropriate to the issues and training needsthat professionals are faced with in today’s environment. The assessment findings will continue to informfuture trainings and it has been a very valuable resource at a time when funding and support for continuingeducation is tenuous.
5. Student Supported By USGS Funding Joins Wildlands Engineering Alea Tuttle, a graduate studentsupported by USGS Funds for project 2012NC173B “Nutrient retention and floodplain connectivity inrestored Piedmont streams”, under PI Sara McMillan, was hired as Project Scientist at Wildlands Engineering,an ecological engineering firm specializing in stream and wetland restoration. Ms. Tuttle’s work with Dr.McMillan has been presented at WRRI’s annual research conference.
Notable Awards and Achievements 3
Publications from Prior Years
2010NC147B ("Microbial Contaminants Associated with Urbanization of a Drinking WaterReservoir") - Articles in Refereed Scientific Journals - Rowny, JG and JR Stewart (2012).Characterization of nonpoint source microbial contamination in an urbanizing watershed serving as amunicipal water supply. Water Research. 46(18):6143-6153.
1.
2010NC147B ("Microbial Contaminants Associated with Urbanization of a Drinking WaterReservoir") - Articles in Refereed Scientific Journals - Gentry-Shields, J, JG Rowny and JR Stewart(2012). HuBac and nifH source tracking markers display a relationship to land use but not rainfall.Water Research. 46(18):6163-6174.
2.
2010NC147B ("Microbial Contaminants Associated with Urbanization of a Drinking WaterReservoir") - Articles in Refereed Scientific Journals - Gentry-Shields, J, A Wang, RM Cory and JRStewart (2013). Determination of specific types and relative levels of qPCR inhibitors inenvironmental water samples using excitation-emission matrix spectroscopy and PARAFAC. WaterResearch. Accepted. doi: 10.1016/j.watres.2013.03.049.