24
Technical Report and Qualitative Risk Assessment ESC 30020: Water Resources Lin-z Tello 2/29/2012 Word count: 2,490
| Date post: | 17-Aug-2015 |
| Category: |
Environment |
| Upload: | lindsey-tello |
| View: | 11 times |
| Download: | 1 times |
Technical Report and Qualitative Risk Assessment ESC 30020: Water Resources
Lin-z Tello 2/29/2012 Word count: 2,490
Introduction This technical report provides a qualitative risk assessment regarding the risk to surface water and
groundwater sources in the area surrounding a proposed landfill near Betley, Cheshire. In order to fully
assess the risk of pollution, many sources of information were consulted, such as data on the geology,
hydrology, and hydrogeology of the area, as well as water quality data for both groundwater and surface
water.
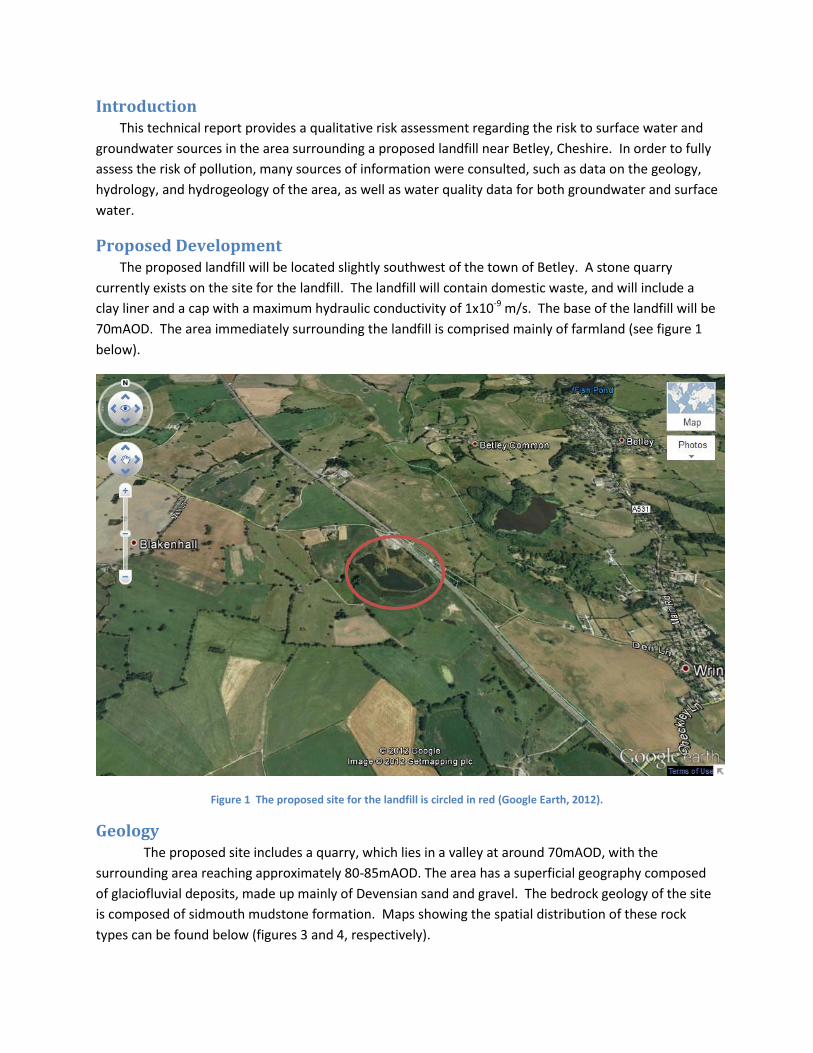
Proposed Development The proposed landfill will be located slightly southwest of the town of Betley. A stone quarry
currently exists on the site for the landfill. The landfill will contain domestic waste, and will include a
clay liner and a cap with a maximum hydraulic conductivity of 1x10⁻⁹ m/s. The base of the landfill will be
70mAOD. The area immediately surrounding the landfill is comprised mainly of farmland (see figure 1
below).
Figure 1 The proposed site for the landfill is circled in red (Google Earth, 2012).
Geology The proposed site includes a quarry, which lies in a valley at around 70mAOD, with the
surrounding area reaching approximately 80-85mAOD. The area has a superficial geography composed
of glaciofluvial deposits, made up mainly of Devensian sand and gravel. The bedrock geology of the site
is composed of sidmouth mudstone formation. Maps showing the spatial distribution of these rock
types can be found below (figures 3 and 4, respectively).

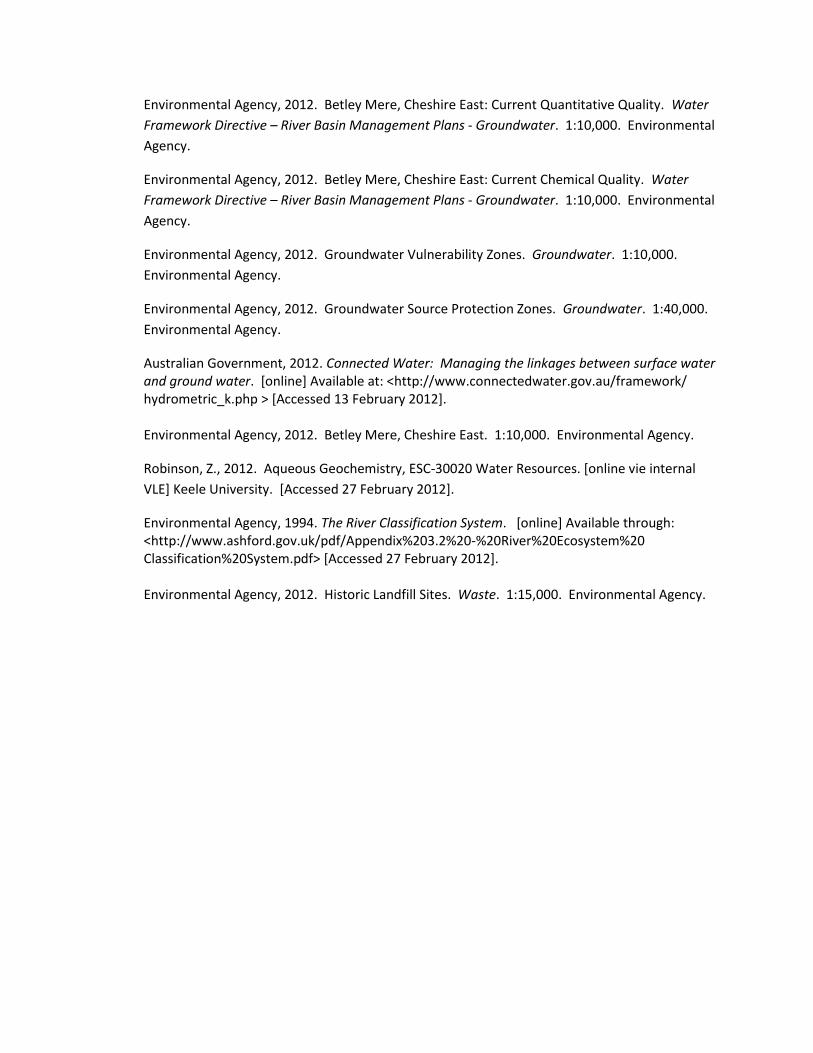
Data collected from boreholes 1, 2 and 3 also indicate that the area has a superficial geography
comprised of diamicton mixed with sands and gravels (see appendix 1). These superficial deposits
persist to 20mbgl.
A geological map of the site concludes that the area surrounding the proposed landfill site
mainly consists of glacial till and glacial sand and gravel. Two faults exist in fairly close proximity to the
landfill site, showing that there is a potential for seismic activity in the area (Speake, 1980).
Figure 2 Geological map of the Betley area, with the proposed landfill site circled in red. This map shows the distribution of superficial geological deposits (Environmental Agency, 2012). The light pink color denotes that the area has a “Secondary A”
classification of superficial deposits (Environmental Agency, 2012).
Figure 3 Geological map of the area surrounding the proposed landfill site. The site has been circled in red. This map displays the distribution of bedrock deposits. The orange color designates that the site has a "Secondary B" category of
bedrock (Environmental Agency, 2012).
Hydrology
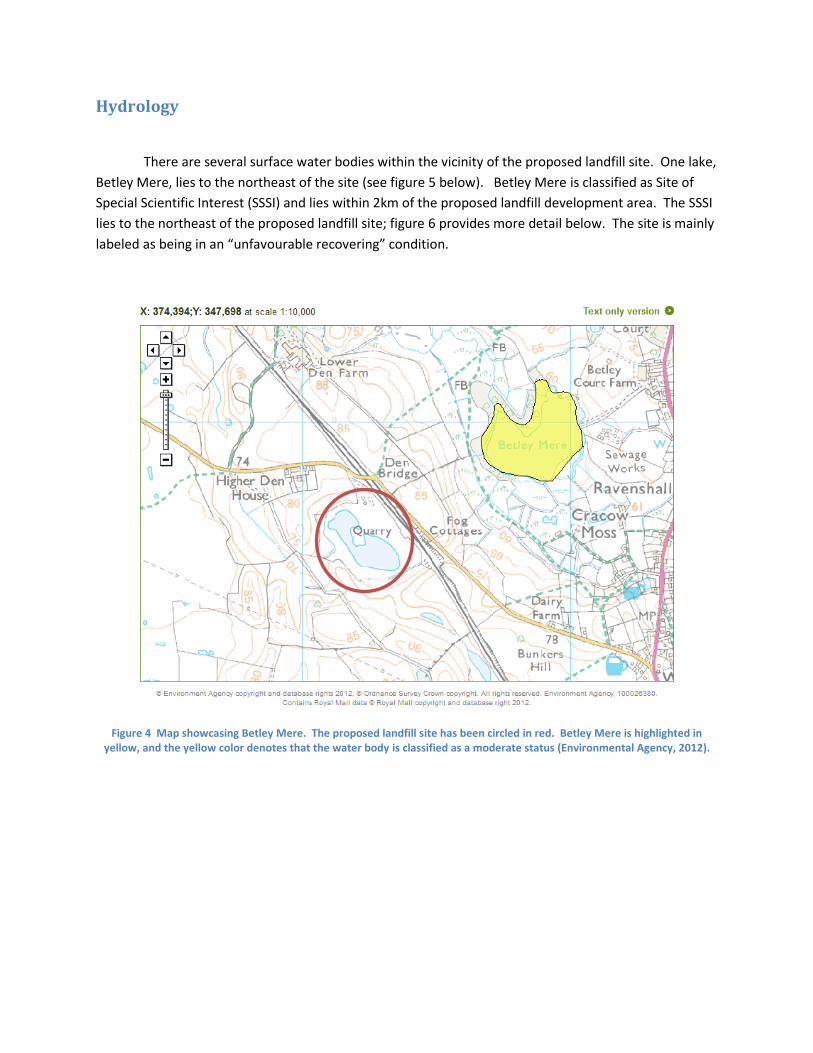
There are several surface water bodies within the vicinity of the proposed landfill site. One lake,
Betley Mere, lies to the northeast of the site (see figure 5 below). Betley Mere is classified as Site of
Special Scientific Interest (SSSI) and lies within 2km of the proposed landfill development area. The SSSI
lies to the northeast of the proposed landfill site; figure 6 provides more detail below. The site is mainly
labeled as being in an “unfavourable recovering” condition.
Figure 4 Map showcasing Betley Mere. The proposed landfill site has been circled in red. Betley Mere is highlighted in yellow, and the yellow color denotes that the water body is classified as a moderate status (Environmental Agency, 2012).
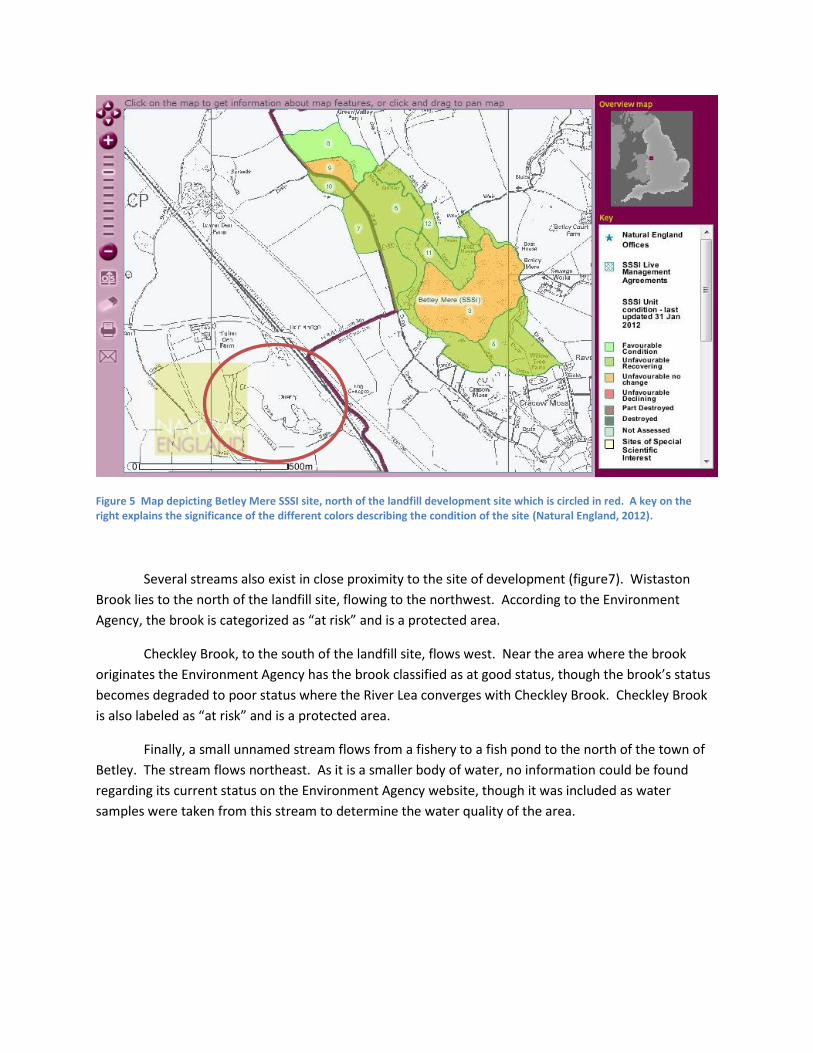
Figure 5 Map depicting Betley Mere SSSI site, north of the landfill development site which is circled in red. A key on the right explains the significance of the different colors describing the condition of the site (Natural England, 2012).
Several streams also exist in close proximity to the site of development (figure7). Wistaston
Brook lies to the north of the landfill site, flowing to the northwest. According to the Environment
Agency, the brook is categorized as “at risk” and is a protected area.
Checkley Brook, to the south of the landfill site, flows west. Near the area where the brook
originates the Environment Agency has the brook classified as at good status, though the brook’s status
becomes degraded to poor status where the River Lea converges with Checkley Brook. Checkley Brook
is also labeled as “at risk” and is a protected area.
Finally, a small unnamed stream flows from a fishery to a fish pond to the north of the town of
Betley. The stream flows northeast. As it is a smaller body of water, no information could be found
regarding its current status on the Environment Agency website, though it was included as water
samples were taken from this stream to determine the water quality of the area.
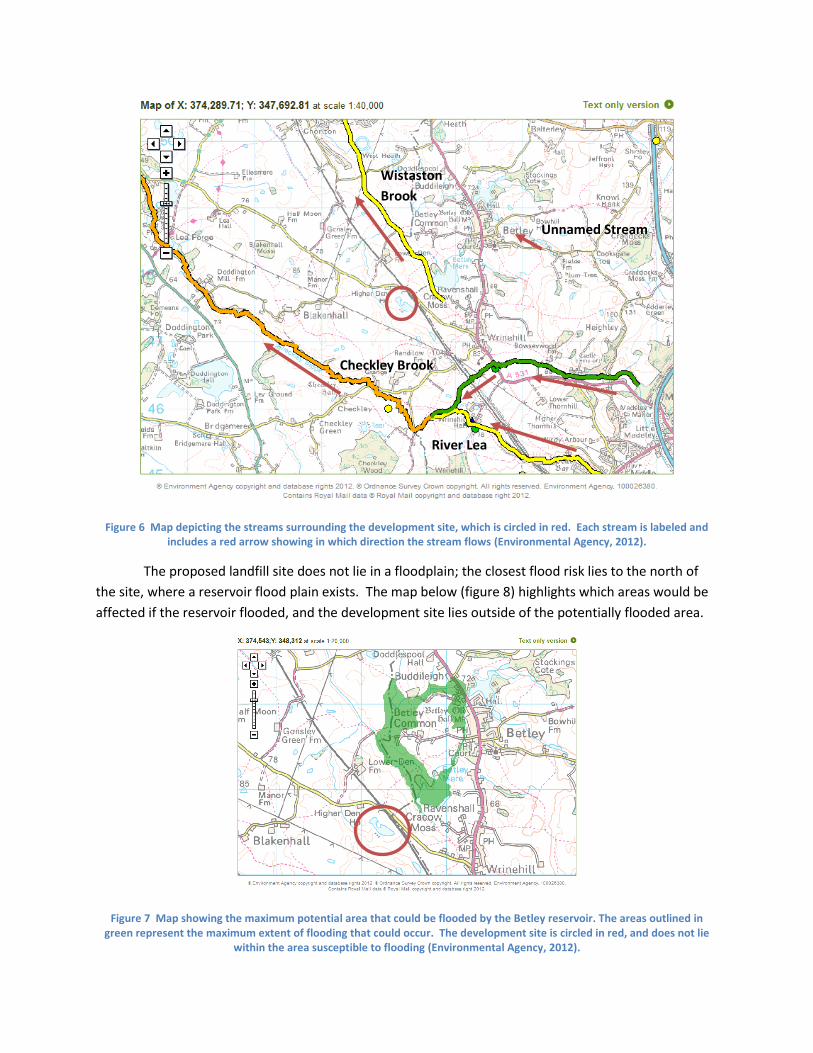
Figure 6 Map depicting the streams surrounding the development site, which is circled in red. Each stream is labeled and includes a red arrow showing in which direction the stream flows (Environmental Agency, 2012).
The proposed landfill site does not lie in a floodplain; the closest flood risk lies to the north of
the site, where a reservoir flood plain exists. The map below (figure 8) highlights which areas would be
affected if the reservoir flooded, and the development site lies outside of the potentially flooded area.
Figure 7 Map showing the maximum potential area that could be flooded by the Betley reservoir. The areas outlined in green represent the maximum extent of flooding that could occur. The development site is circled in red, and does not lie
within the area susceptible to flooding (Environmental Agency, 2012).
Wistaston
Brook
Checkley Brook
River Lea
Unnamed Stream
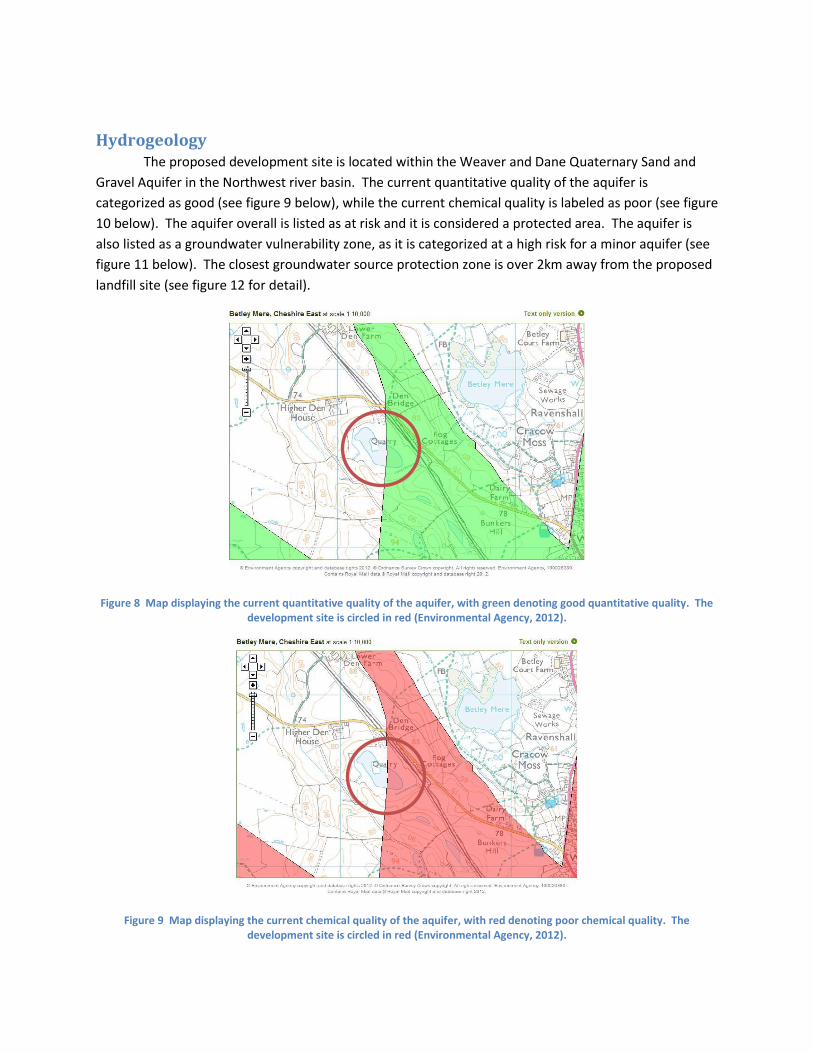
Hydrogeology The proposed development site is located within the Weaver and Dane Quaternary Sand and
Gravel Aquifer in the Northwest river basin. The current quantitative quality of the aquifer is
categorized as good (see figure 9 below), while the current chemical quality is labeled as poor (see figure
10 below). The aquifer overall is listed as at risk and it is considered a protected area. The aquifer is
also listed as a groundwater vulnerability zone, as it is categorized at a high risk for a minor aquifer (see
figure 11 below). The closest groundwater source protection zone is over 2km away from the proposed
landfill site (see figure 12 for detail).
Figure 8 Map displaying the current quantitative quality of the aquifer, with green denoting good quantitative quality. The development site is circled in red (Environmental Agency, 2012).
Figure 9 Map displaying the current chemical quality of the aquifer, with red denoting poor chemical quality. The development site is circled in red (Environmental Agency, 2012).
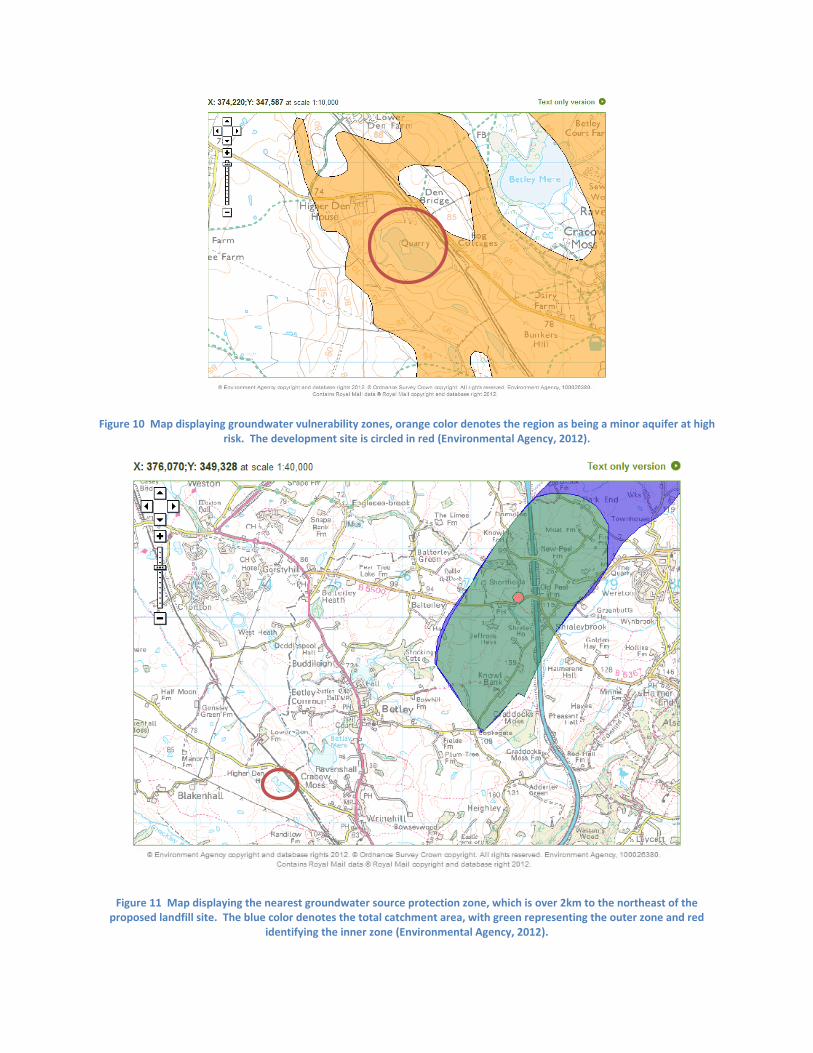
Figure 10 Map displaying groundwater vulnerability zones, orange color denotes the region as being a minor aquifer at high risk. The development site is circled in red (Environmental Agency, 2012).
Figure 11 Map displaying the nearest groundwater source protection zone, which is over 2km to the northeast of the proposed landfill site. The blue color denotes the total catchment area, with green representing the outer zone and red
identifying the inner zone (Environmental Agency, 2012).
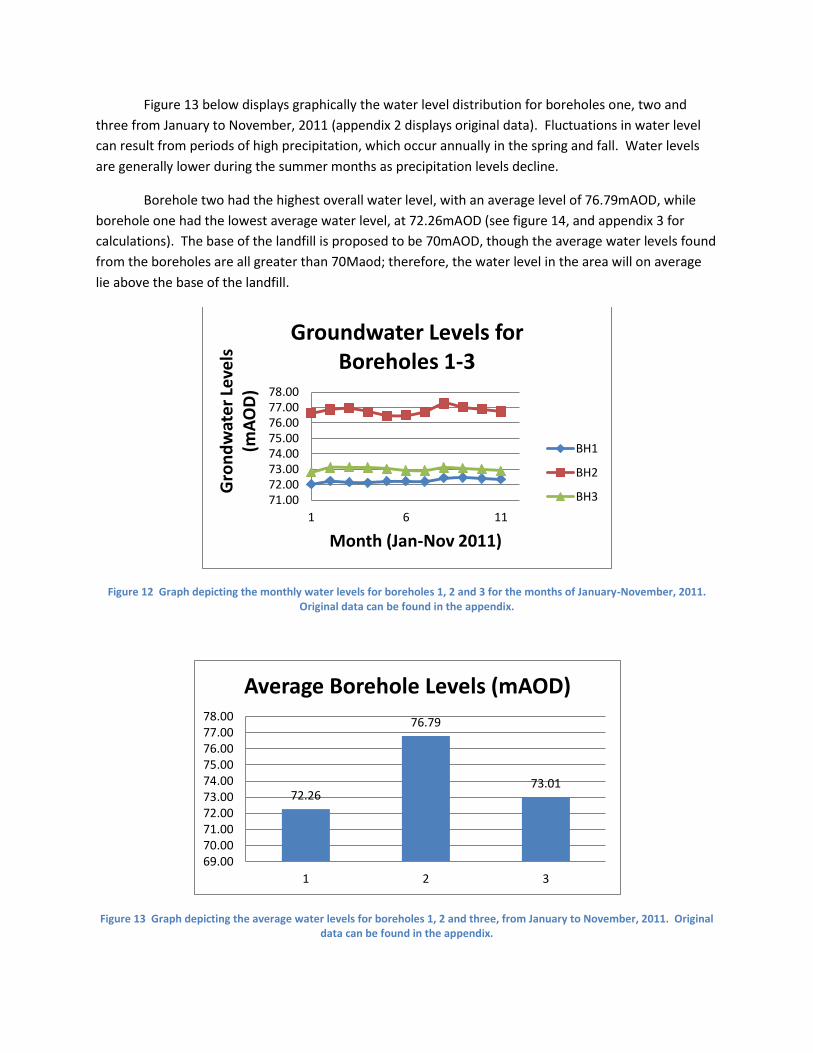
Figure 13 below displays graphically the water level distribution for boreholes one, two and
three from January to November, 2011 (appendix 2 displays original data). Fluctuations in water level
can result from periods of high precipitation, which occur annually in the spring and fall. Water levels
are generally lower during the summer months as precipitation levels decline.
Borehole two had the highest overall water level, with an average level of 76.79mAOD, while
borehole one had the lowest average water level, at 72.26mAOD (see figure 14, and appendix 3 for
calculations). The base of the landfill is proposed to be 70mAOD, though the average water levels found
from the boreholes are all greater than 70Maod; therefore, the water level in the area will on average
lie above the base of the landfill.
Figure 12 Graph depicting the monthly water levels for boreholes 1, 2 and 3 for the months of January-November, 2011. Original data can be found in the appendix.
Figure 13 Graph depicting the average water levels for boreholes 1, 2 and three, from January to November, 2011. Original data can be found in the appendix.
71.0072.0073.0074.0075.0076.0077.0078.00
1 6 11
Gro
nd
wat
er L
eve
ls
(mA
OD
)
Month (Jan-Nov 2011)
Groundwater Levels for Boreholes 1-3
BH1
BH2
BH3
72.26
76.79
73.01
69.0070.0071.0072.0073.0074.0075.0076.0077.0078.00
1 2 3
Average Borehole Levels (mAOD)
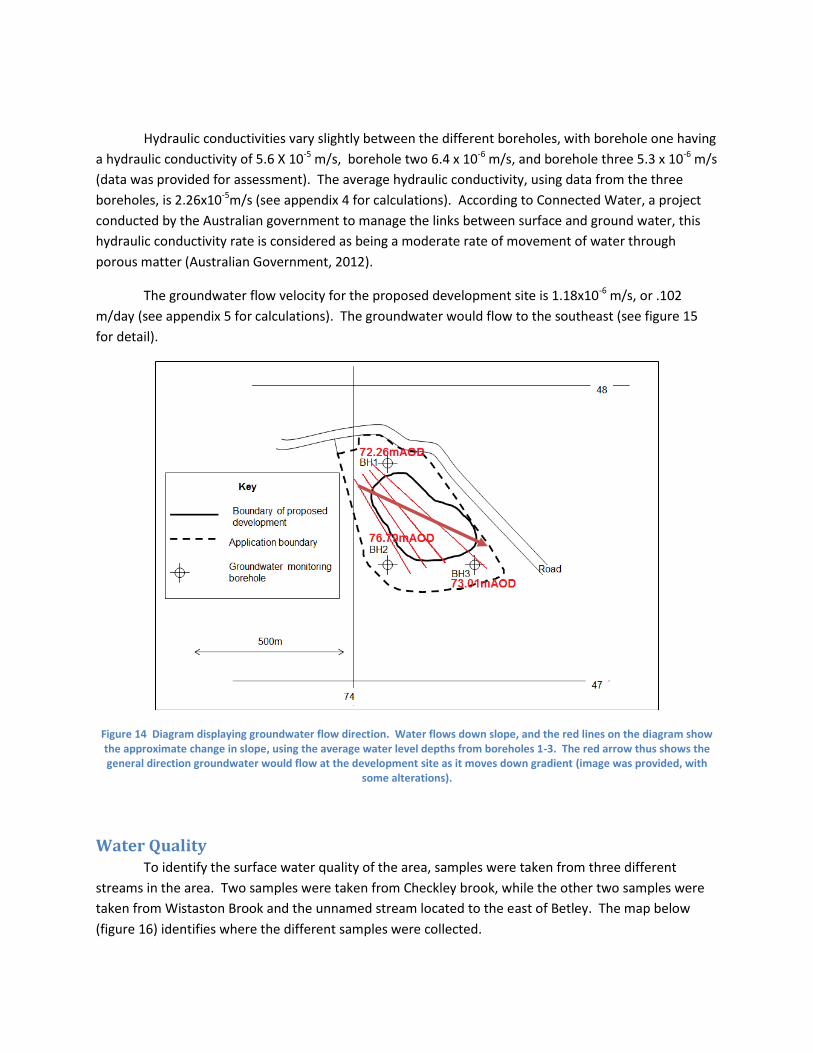
Hydraulic conductivities vary slightly between the different boreholes, with borehole one having
a hydraulic conductivity of 5.6 X 10⁻⁵ m/s, borehole two 6.4 x 10⁻⁶ m/s, and borehole three 5.3 x 10⁻⁶ m/s
(data was provided for assessment). The average hydraulic conductivity, using data from the three
boreholes, is 2.26x10⁻⁵m/s (see appendix 4 for calculations). According to Connected Water, a project
conducted by the Australian government to manage the links between surface and ground water, this
hydraulic conductivity rate is considered as being a moderate rate of movement of water through
porous matter (Australian Government, 2012).
The groundwater flow velocity for the proposed development site is 1.18x10⁻⁶ m/s, or .102
m/day (see appendix 5 for calculations). The groundwater would flow to the southeast (see figure 15
for detail).
Figure 14 Diagram displaying groundwater flow direction. Water flows down slope, and the red lines on the diagram show the approximate change in slope, using the average water level depths from boreholes 1-3. The red arrow thus shows the general direction groundwater would flow at the development site as it moves down gradient (image was provided, with
some alterations).
Water Quality To identify the surface water quality of the area, samples were taken from three different
streams in the area. Two samples were taken from Checkley brook, while the other two samples were
taken from Wistaston Brook and the unnamed stream located to the east of Betley. The map below
(figure 16) identifies where the different samples were collected.
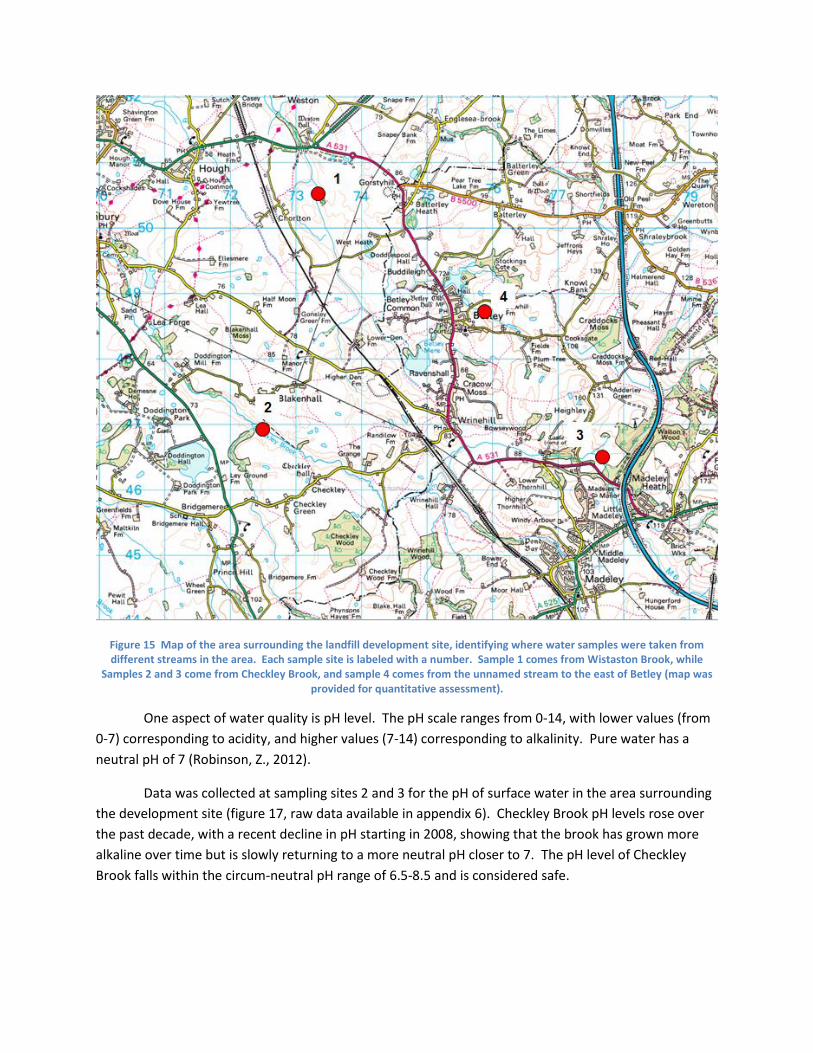
Figure 15 Map of the area surrounding the landfill development site, identifying where water samples were taken from different streams in the area. Each sample site is labeled with a number. Sample 1 comes from Wistaston Brook, while
Samples 2 and 3 come from Checkley Brook, and sample 4 comes from the unnamed stream to the east of Betley (map was provided for quantitative assessment).
One aspect of water quality is pH level. The pH scale ranges from 0-14, with lower values (from
0-7) corresponding to acidity, and higher values (7-14) corresponding to alkalinity. Pure water has a
neutral pH of 7 (Robinson, Z., 2012).
Data was collected at sampling sites 2 and 3 for the pH of surface water in the area surrounding
the development site (figure 17, raw data available in appendix 6). Checkley Brook pH levels rose over
the past decade, with a recent decline in pH starting in 2008, showing that the brook has grown more
alkaline over time but is slowly returning to a more neutral pH closer to 7. The pH level of Checkley
Brook falls within the circum-neutral pH range of 6.5-8.5 and is considered safe.
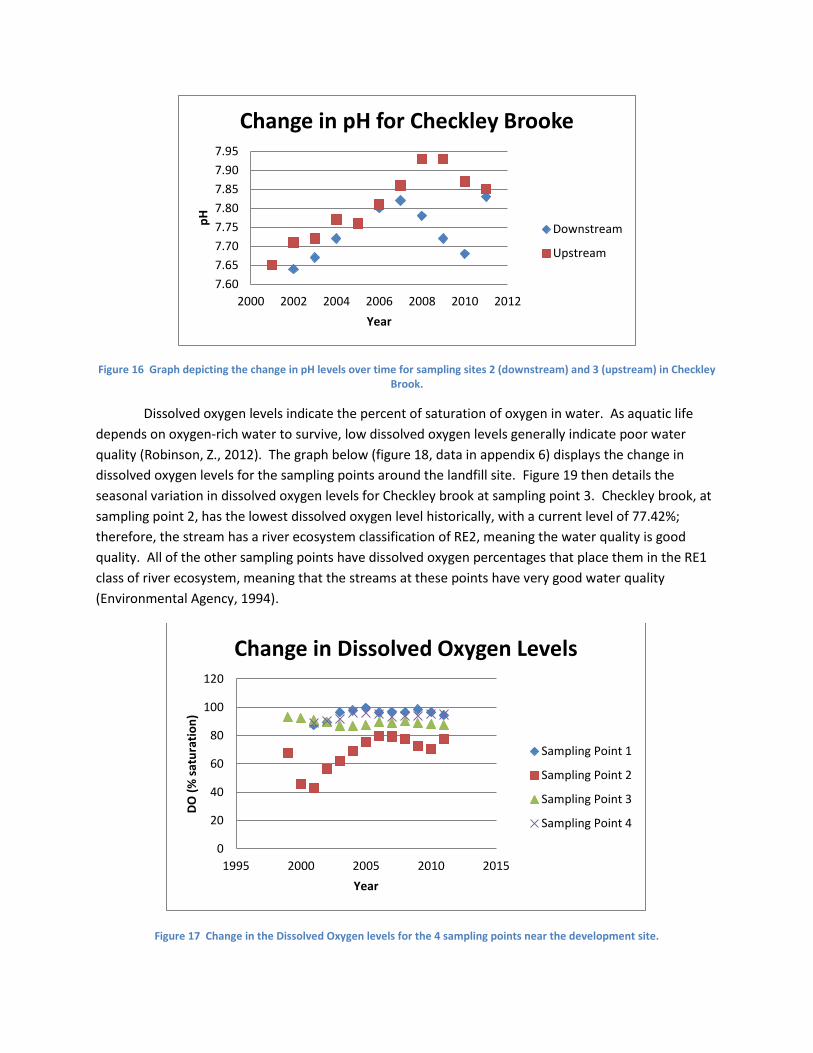
Figure 16 Graph depicting the change in pH levels over time for sampling sites 2 (downstream) and 3 (upstream) in Checkley Brook.
Dissolved oxygen levels indicate the percent of saturation of oxygen in water. As aquatic life
depends on oxygen-rich water to survive, low dissolved oxygen levels generally indicate poor water
quality (Robinson, Z., 2012). The graph below (figure 18, data in appendix 6) displays the change in
dissolved oxygen levels for the sampling points around the landfill site. Figure 19 then details the
seasonal variation in dissolved oxygen levels for Checkley brook at sampling point 3. Checkley brook, at
sampling point 2, has the lowest dissolved oxygen level historically, with a current level of 77.42%;
therefore, the stream has a river ecosystem classification of RE2, meaning the water quality is good
quality. All of the other sampling points have dissolved oxygen percentages that place them in the RE1
class of river ecosystem, meaning that the streams at these points have very good water quality
(Environmental Agency, 1994).
Figure 17 Change in the Dissolved Oxygen levels for the 4 sampling points near the development site.
7.60
7.65
7.70
7.75
7.80
7.85
7.90
7.95
2000 2002 2004 2006 2008 2010 2012
pH
Year
Change in pH for Checkley Brooke
Downstream
Upstream
0
20
40
60
80
100
120
1995 2000 2005 2010 2015
DO
(%
sat
ura
tio
n)
Year
Change in Dissolved Oxygen Levels
Sampling Point 1
Sampling Point 2
Sampling Point 3
Sampling Point 4
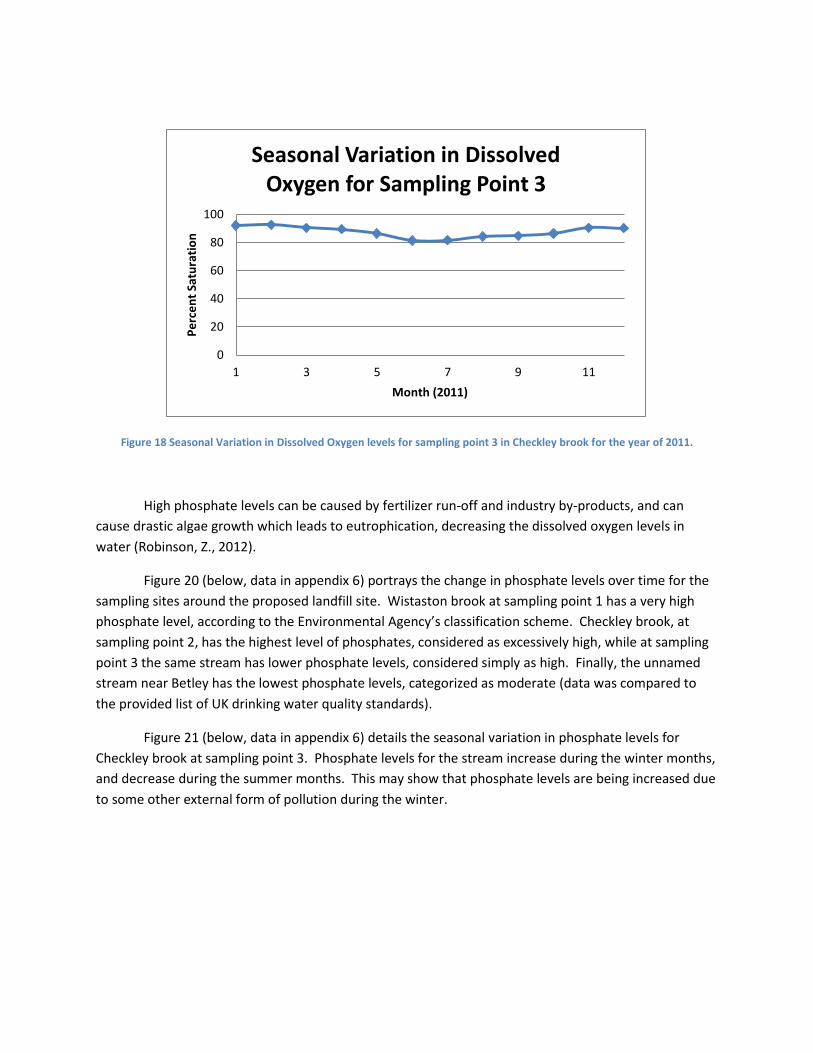
Figure 18 Seasonal Variation in Dissolved Oxygen levels for sampling point 3 in Checkley brook for the year of 2011.
High phosphate levels can be caused by fertilizer run-off and industry by-products, and can
cause drastic algae growth which leads to eutrophication, decreasing the dissolved oxygen levels in
water (Robinson, Z., 2012).
Figure 20 (below, data in appendix 6) portrays the change in phosphate levels over time for the
sampling sites around the proposed landfill site. Wistaston brook at sampling point 1 has a very high
phosphate level, according to the Environmental Agency’s classification scheme. Checkley brook, at
sampling point 2, has the highest level of phosphates, considered as excessively high, while at sampling
point 3 the same stream has lower phosphate levels, considered simply as high. Finally, the unnamed
stream near Betley has the lowest phosphate levels, categorized as moderate (data was compared to
the provided list of UK drinking water quality standards).
Figure 21 (below, data in appendix 6) details the seasonal variation in phosphate levels for
Checkley brook at sampling point 3. Phosphate levels for the stream increase during the winter months,
and decrease during the summer months. This may show that phosphate levels are being increased due
to some other external form of pollution during the winter.
0
20
40
60
80
100
1 3 5 7 9 11
Pe
rce
nt
Satu
rati
on
Month (2011)
Seasonal Variation in Dissolved Oxygen for Sampling Point 3
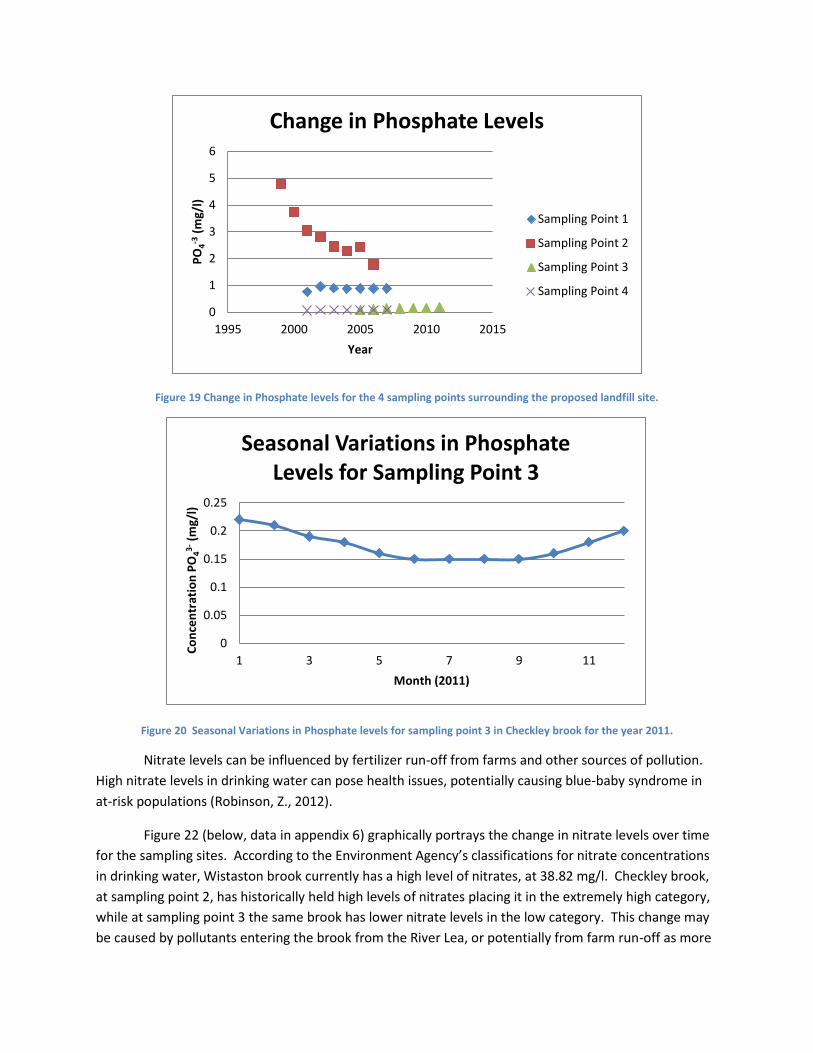
Figure 19 Change in Phosphate levels for the 4 sampling points surrounding the proposed landfill site.
Figure 20 Seasonal Variations in Phosphate levels for sampling point 3 in Checkley brook for the year 2011.
Nitrate levels can be influenced by fertilizer run-off from farms and other sources of pollution.
High nitrate levels in drinking water can pose health issues, potentially causing blue-baby syndrome in
at-risk populations (Robinson, Z., 2012).
Figure 22 (below, data in appendix 6) graphically portrays the change in nitrate levels over time
for the sampling sites. According to the Environment Agency’s classifications for nitrate concentrations
in drinking water, Wistaston brook currently has a high level of nitrates, at 38.82 mg/l. Checkley brook,
at sampling point 2, has historically held high levels of nitrates placing it in the extremely high category,
while at sampling point 3 the same brook has lower nitrate levels in the low category. This change may
be caused by pollutants entering the brook from the River Lea, or potentially from farm run-off as more
0
1
2
3
4
5
6
1995 2000 2005 2010 2015
PO
4-3 (
mg/
l)
Year
Change in Phosphate Levels
Sampling Point 1
Sampling Point 2
Sampling Point 3
Sampling Point 4
0
0.05
0.1
0.15
0.2
0.25
1 3 5 7 9 11
Co
nce
ntr
atio
n P
O43
- (m
g/l)
Month (2011)
Seasonal Variations in Phosphate Levels for Sampling Point 3
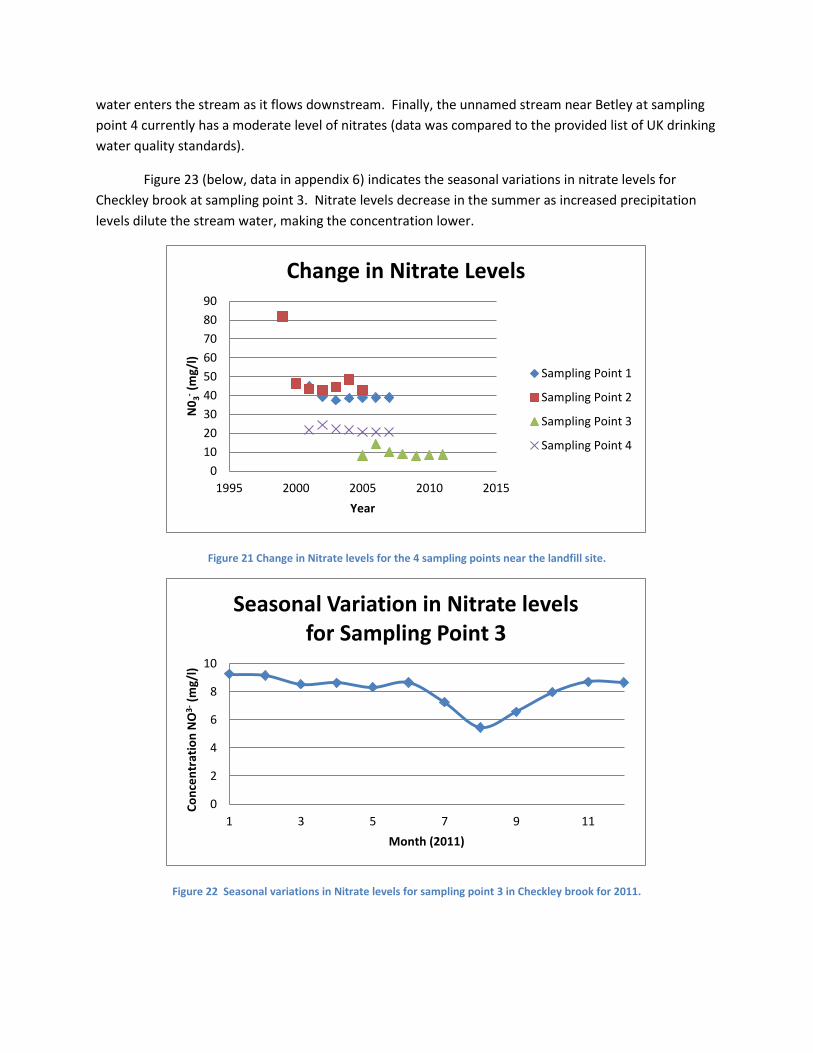
water enters the stream as it flows downstream. Finally, the unnamed stream near Betley at sampling
point 4 currently has a moderate level of nitrates (data was compared to the provided list of UK drinking
water quality standards).
Figure 23 (below, data in appendix 6) indicates the seasonal variations in nitrate levels for
Checkley brook at sampling point 3. Nitrate levels decrease in the summer as increased precipitation
levels dilute the stream water, making the concentration lower.
Figure 21 Change in Nitrate levels for the 4 sampling points near the landfill site.
Figure 22 Seasonal variations in Nitrate levels for sampling point 3 in Checkley brook for 2011.
0
10
20
30
40
50
60
70
80
90
1995 2000 2005 2010 2015
N0
3- (
mg/
l)
Year
Change in Nitrate Levels
Sampling Point 1
Sampling Point 2
Sampling Point 3
Sampling Point 4
0
2
4
6
8
10
1 3 5 7 9 11
Co
nce
ntr
atio
n N
O3-
(m
g/l)
Month (2011)
Seasonal Variation in Nitrate levels for Sampling Point 3
Overall, Checkley brook (at sampling point 2) has the lowest water quality of the three streams
that were tested. This is mirrored in figure 6 from earlier in the assessment, which showed that
Checkley brook, downstream from where the brook converges with the waters of River Lea, is
determined to have poor water quality. Upstream from River Lea Checkley brook has good water
quality, so pollutants must be entering the water body somewhere after the waters converge.
Wistaston brook, which was sampled at point 1, has moderate water quality, with acceptable BOD and
DO levels, although the brook has high nitrate and phosphate levels, potentially stemming from fertilizer
run-off. The unnamed stream which was sampled at site 4 has a relatively good water quality, as it has
acceptable BOD and DO levels as well as reasonable phosphate and nitrate levels.
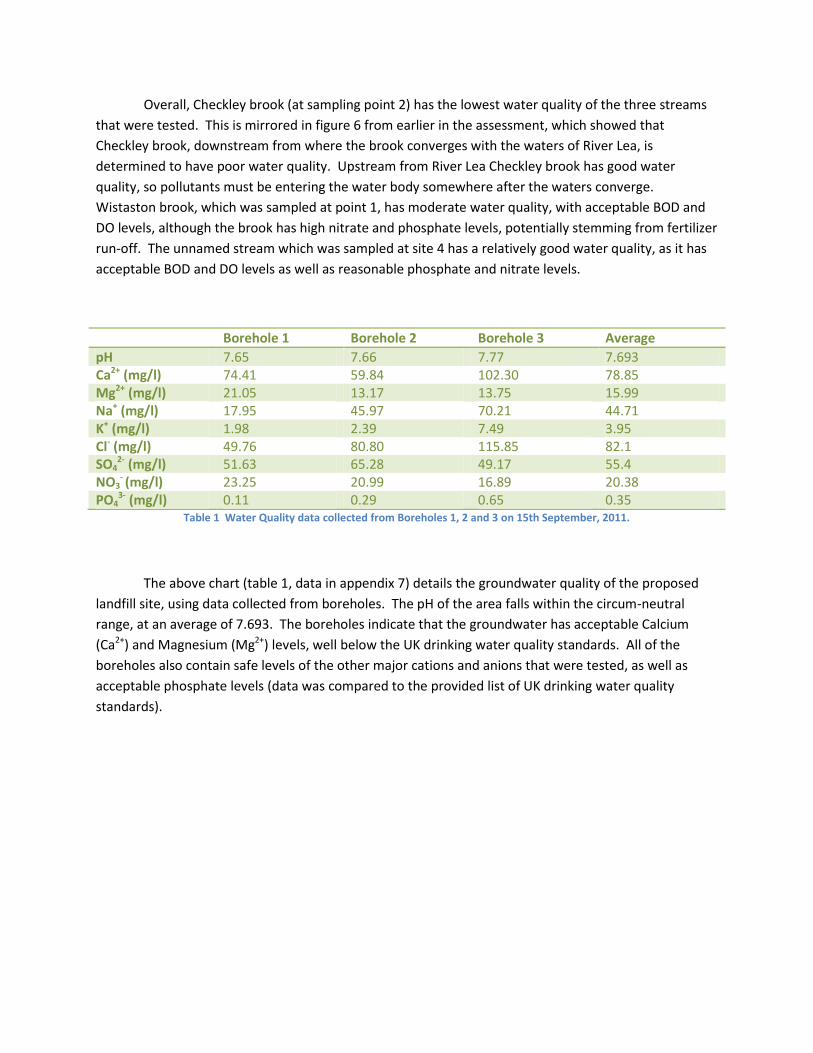
Borehole 1 Borehole 2 Borehole 3 Average
pH 7.65 7.66 7.77 7.693 Ca2+ (mg/l) 74.41 59.84 102.30 78.85 Mg2+ (mg/l) 21.05 13.17 13.75 15.99 Na+ (mg/l) 17.95 45.97 70.21 44.71 K+ (mg/l) 1.98 2.39 7.49 3.95 Cl- (mg/l) 49.76 80.80 115.85 82.1 SO4
2- (mg/l) 51.63 65.28 49.17 55.4 NO3
- (mg/l) 23.25 20.99 16.89 20.38 PO4
3- (mg/l) 0.11 0.29 0.65 0.35 Table 1 Water Quality data collected from Boreholes 1, 2 and 3 on 15th September, 2011.
The above chart (table 1, data in appendix 7) details the groundwater quality of the proposed
landfill site, using data collected from boreholes. The pH of the area falls within the circum-neutral
range, at an average of 7.693. The boreholes indicate that the groundwater has acceptable Calcium
(Ca2+) and Magnesium (Mg2+) levels, well below the UK drinking water quality standards. All of the
boreholes also contain safe levels of the other major cations and anions that were tested, as well as
acceptable phosphate levels (data was compared to the provided list of UK drinking water quality
standards).
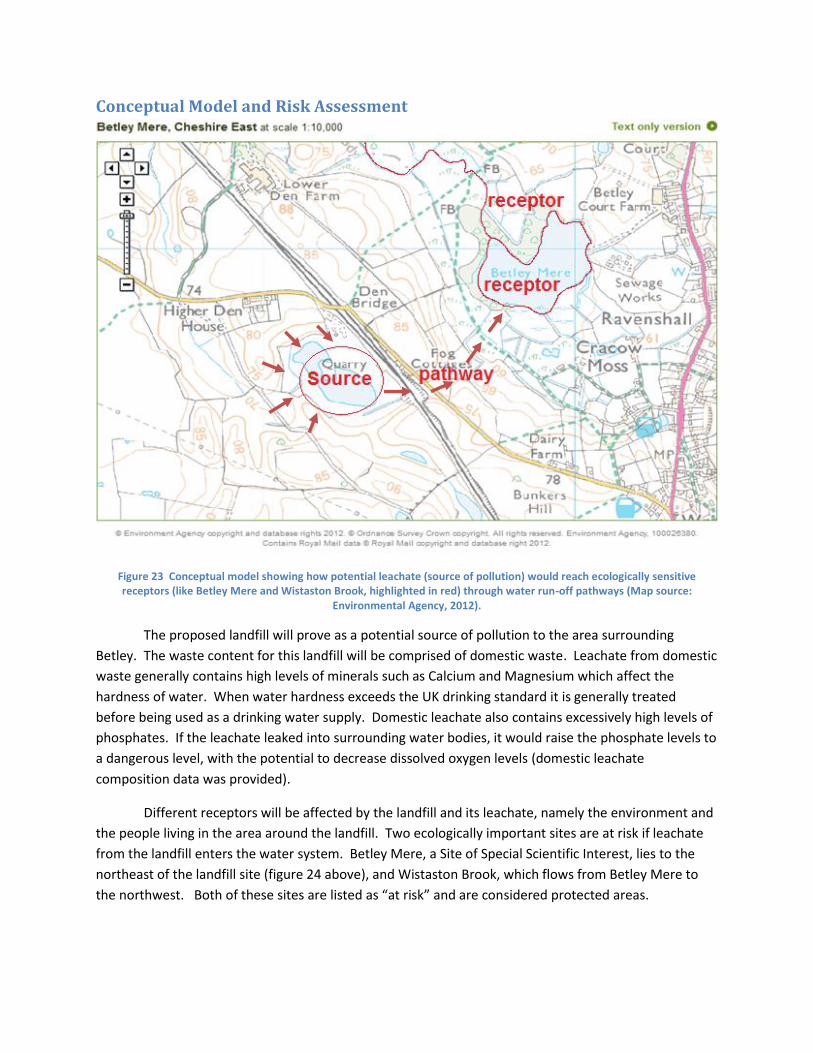
Conceptual Model and Risk Assessment
Figure 23 Conceptual model showing how potential leachate (source of pollution) would reach ecologically sensitive receptors (like Betley Mere and Wistaston Brook, highlighted in red) through water run-off pathways (Map source:
Environmental Agency, 2012).
The proposed landfill will prove as a potential source of pollution to the area surrounding
Betley. The waste content for this landfill will be comprised of domestic waste. Leachate from domestic
waste generally contains high levels of minerals such as Calcium and Magnesium which affect the
hardness of water. When water hardness exceeds the UK drinking standard it is generally treated
before being used as a drinking water supply. Domestic leachate also contains excessively high levels of
phosphates. If the leachate leaked into surrounding water bodies, it would raise the phosphate levels to
a dangerous level, with the potential to decrease dissolved oxygen levels (domestic leachate
composition data was provided).
Different receptors will be affected by the landfill and its leachate, namely the environment and
the people living in the area around the landfill. Two ecologically important sites are at risk if leachate
from the landfill enters the water system. Betley Mere, a Site of Special Scientific Interest, lies to the
northeast of the landfill site (figure 24 above), and Wistaston Brook, which flows from Betley Mere to
the northwest. Both of these sites are listed as “at risk” and are considered protected areas.
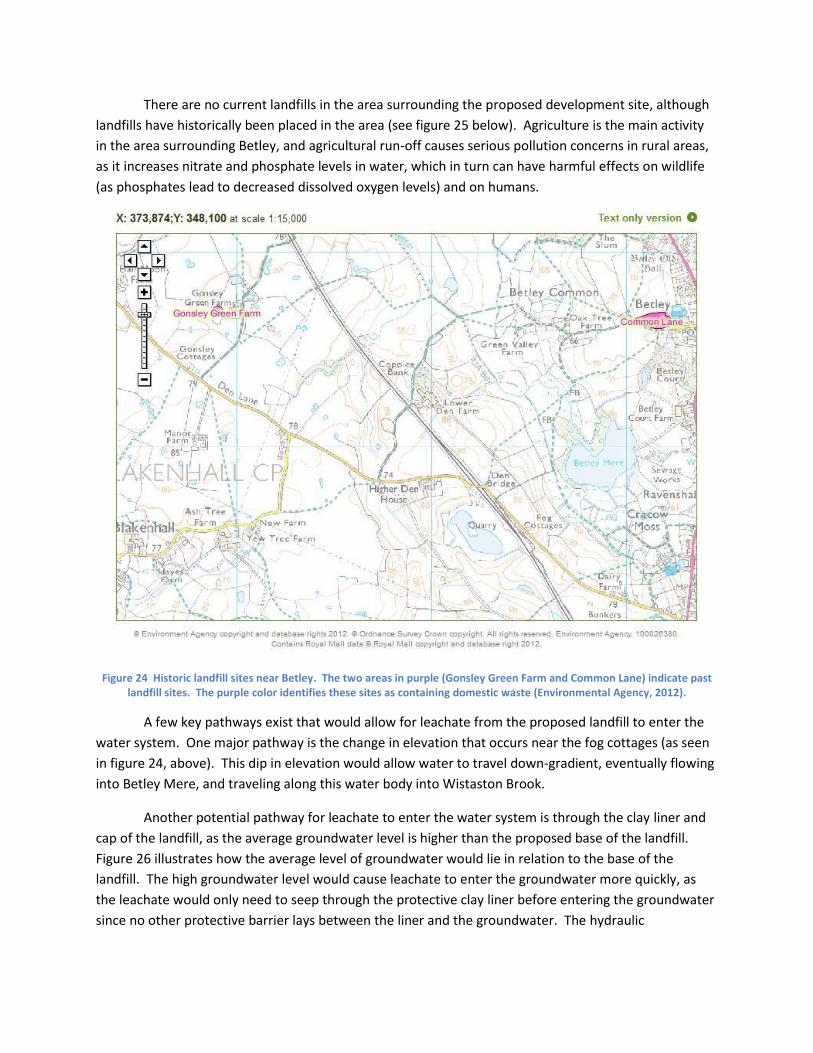
There are no current landfills in the area surrounding the proposed development site, although
landfills have historically been placed in the area (see figure 25 below). Agriculture is the main activity
in the area surrounding Betley, and agricultural run-off causes serious pollution concerns in rural areas,
as it increases nitrate and phosphate levels in water, which in turn can have harmful effects on wildlife
(as phosphates lead to decreased dissolved oxygen levels) and on humans.
Figure 24 Historic landfill sites near Betley. The two areas in purple (Gonsley Green Farm and Common Lane) indicate past landfill sites. The purple color identifies these sites as containing domestic waste (Environmental Agency, 2012).
A few key pathways exist that would allow for leachate from the proposed landfill to enter the
water system. One major pathway is the change in elevation that occurs near the fog cottages (as seen
in figure 24, above). This dip in elevation would allow water to travel down-gradient, eventually flowing
into Betley Mere, and traveling along this water body into Wistaston Brook.
Another potential pathway for leachate to enter the water system is through the clay liner and
cap of the landfill, as the average groundwater level is higher than the proposed base of the landfill.
Figure 26 illustrates how the average level of groundwater would lie in relation to the base of the
landfill. The high groundwater level would cause leachate to enter the groundwater more quickly, as
the leachate would only need to seep through the protective clay liner before entering the groundwater
since no other protective barrier lays between the liner and the groundwater. The hydraulic
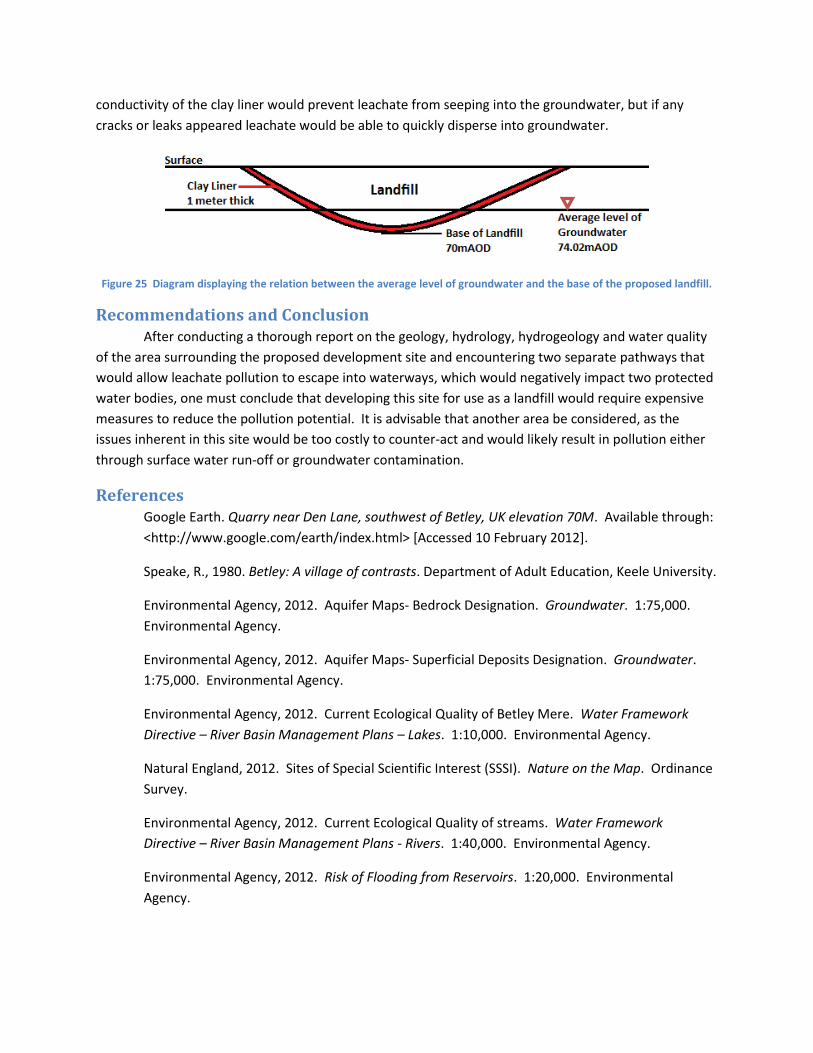
conductivity of the clay liner would prevent leachate from seeping into the groundwater, but if any
cracks or leaks appeared leachate would be able to quickly disperse into groundwater.
Figure 25 Diagram displaying the relation between the average level of groundwater and the base of the proposed landfill.
Recommendations and Conclusion After conducting a thorough report on the geology, hydrology, hydrogeology and water quality
of the area surrounding the proposed development site and encountering two separate pathways that
would allow leachate pollution to escape into waterways, which would negatively impact two protected
water bodies, one must conclude that developing this site for use as a landfill would require expensive
measures to reduce the pollution potential. It is advisable that another area be considered, as the
issues inherent in this site would be too costly to counter-act and would likely result in pollution either
through surface water run-off or groundwater contamination.
References Google Earth. Quarry near Den Lane, southwest of Betley, UK elevation 70M. Available through:
<http://www.google.com/earth/index.html> [Accessed 10 February 2012].
Speake, R., 1980. Betley: A village of contrasts. Department of Adult Education, Keele University.
Environmental Agency, 2012. Aquifer Maps- Bedrock Designation. Groundwater. 1:75,000.
Environmental Agency.
Environmental Agency, 2012. Aquifer Maps- Superficial Deposits Designation. Groundwater.
1:75,000. Environmental Agency.
Environmental Agency, 2012. Current Ecological Quality of Betley Mere. Water Framework
Directive – River Basin Management Plans – Lakes. 1:10,000. Environmental Agency.
Natural England, 2012. Sites of Special Scientific Interest (SSSI). Nature on the Map. Ordinance
Survey.
Environmental Agency, 2012. Current Ecological Quality of streams. Water Framework
Directive – River Basin Management Plans - Rivers. 1:40,000. Environmental Agency.
Environmental Agency, 2012. Risk of Flooding from Reservoirs. 1:20,000. Environmental
Agency.
Environmental Agency, 2012. Betley Mere, Cheshire East: Current Quantitative Quality. Water
Framework Directive – River Basin Management Plans - Groundwater. 1:10,000. Environmental
Agency.
Environmental Agency, 2012. Betley Mere, Cheshire East: Current Chemical Quality. Water
Framework Directive – River Basin Management Plans - Groundwater. 1:10,000. Environmental
Agency.
Environmental Agency, 2012. Groundwater Vulnerability Zones. Groundwater. 1:10,000.
Environmental Agency.
Environmental Agency, 2012. Groundwater Source Protection Zones. Groundwater. 1:40,000.
Environmental Agency.
Australian Government, 2012. Connected Water: Managing the linkages between surface water and ground water. [online] Available at: <http://www.connectedwater.gov.au/framework/ hydrometric_k.php > [Accessed 13 February 2012]. Environmental Agency, 2012. Betley Mere, Cheshire East. 1:10,000. Environmental Agency.
Robinson, Z., 2012. Aqueous Geochemistry, ESC-30020 Water Resources. [online vie internal
VLE] Keele University. [Accessed 27 February 2012].
Environmental Agency, 1994. The River Classification System. [online] Available through: <http://www.ashford.gov.uk/pdf/Appendix%203.2%20-%20River%20Ecosystem%20 Classification%20System.pdf> [Accessed 27 February 2012]. Environmental Agency, 2012. Historic Landfill Sites. Waste. 1:15,000. Environmental Agency.
Appendices
Appendix 1 Borehole data logs provided for quantitative assess
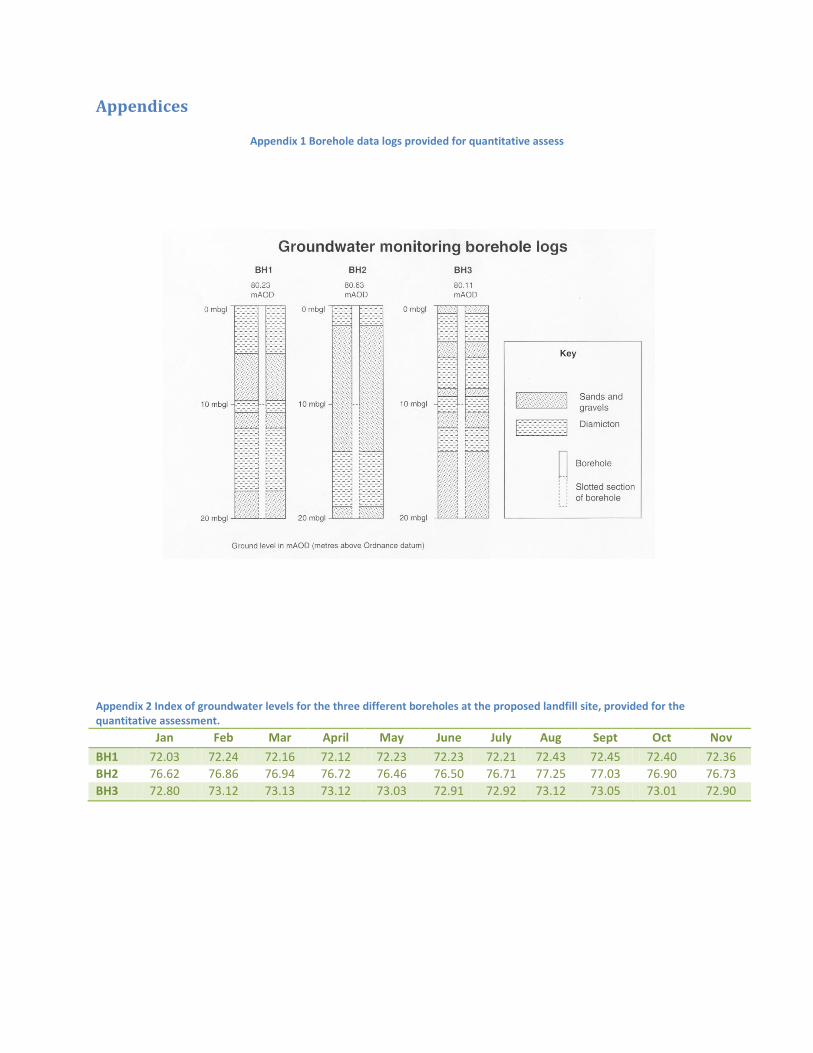
Appendix 2 Index of groundwater levels for the three different boreholes at the proposed landfill site, provided for the quantitative assessment.
Jan Feb Mar April May June July Aug Sept Oct Nov
BH1 72.03 72.24 72.16 72.12 72.23 72.23 72.21 72.43 72.45 72.40 72.36
BH2 76.62 76.86 76.94 76.72 76.46 76.50 76.71 77.25 77.03 76.90 76.73
BH3 72.80 73.12 73.13 73.12 73.03 72.91 72.92 73.12 73.05 73.01 72.90
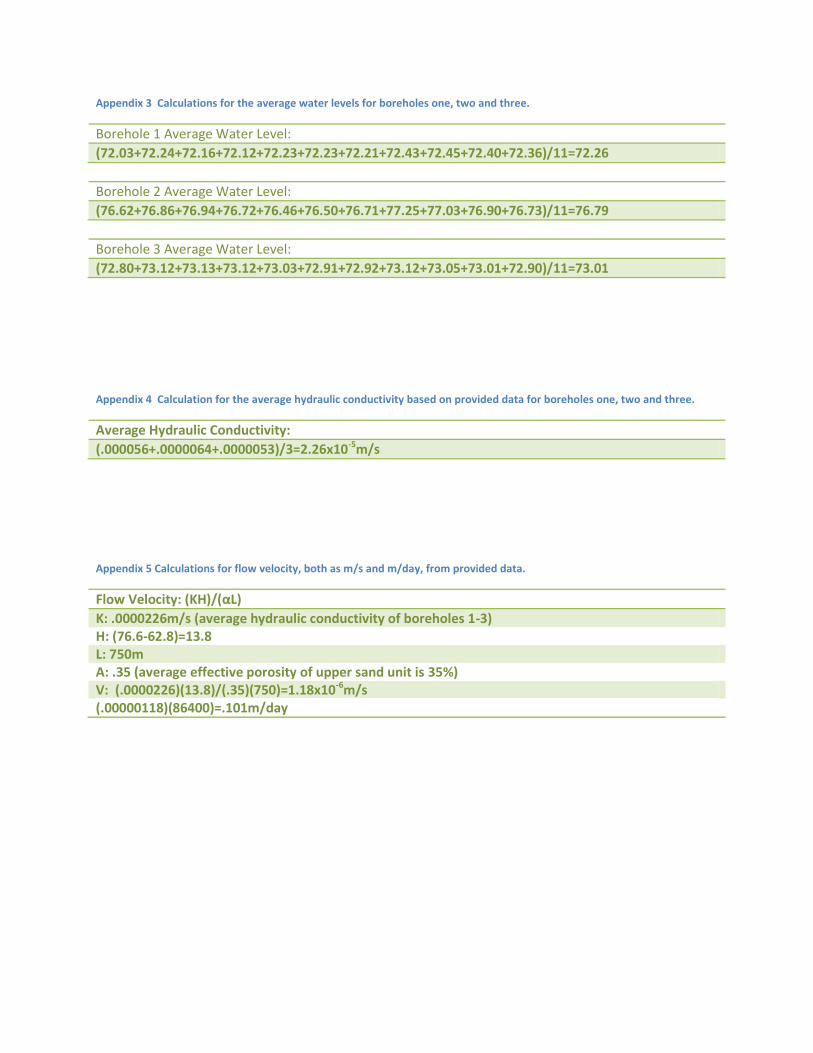
Appendix 3 Calculations for the average water levels for boreholes one, two and three.
Borehole 1 Average Water Level:
(72.03+72.24+72.16+72.12+72.23+72.23+72.21+72.43+72.45+72.40+72.36)/11=72.26
Borehole 2 Average Water Level:
(76.62+76.86+76.94+76.72+76.46+76.50+76.71+77.25+77.03+76.90+76.73)/11=76.79
Borehole 3 Average Water Level:
(72.80+73.12+73.13+73.12+73.03+72.91+72.92+73.12+73.05+73.01+72.90)/11=73.01
Appendix 4 Calculation for the average hydraulic conductivity based on provided data for boreholes one, two and three.
Average Hydraulic Conductivity:
(.000056+.0000064+.0000053)/3=2.26x10-5m/s
Appendix 5 Calculations for flow velocity, both as m/s and m/day, from provided data.
Flow Velocity: (KH)/(αL)
K: .0000226m/s (average hydraulic conductivity of boreholes 1-3) H: (76.6-62.8)=13.8 L: 750m Α: .35 (average effective porosity of upper sand unit is 35%) V: (.0000226)(13.8)/(.35)(750)=1.18x10-6m/s (.00000118)(86400)=.101m/day
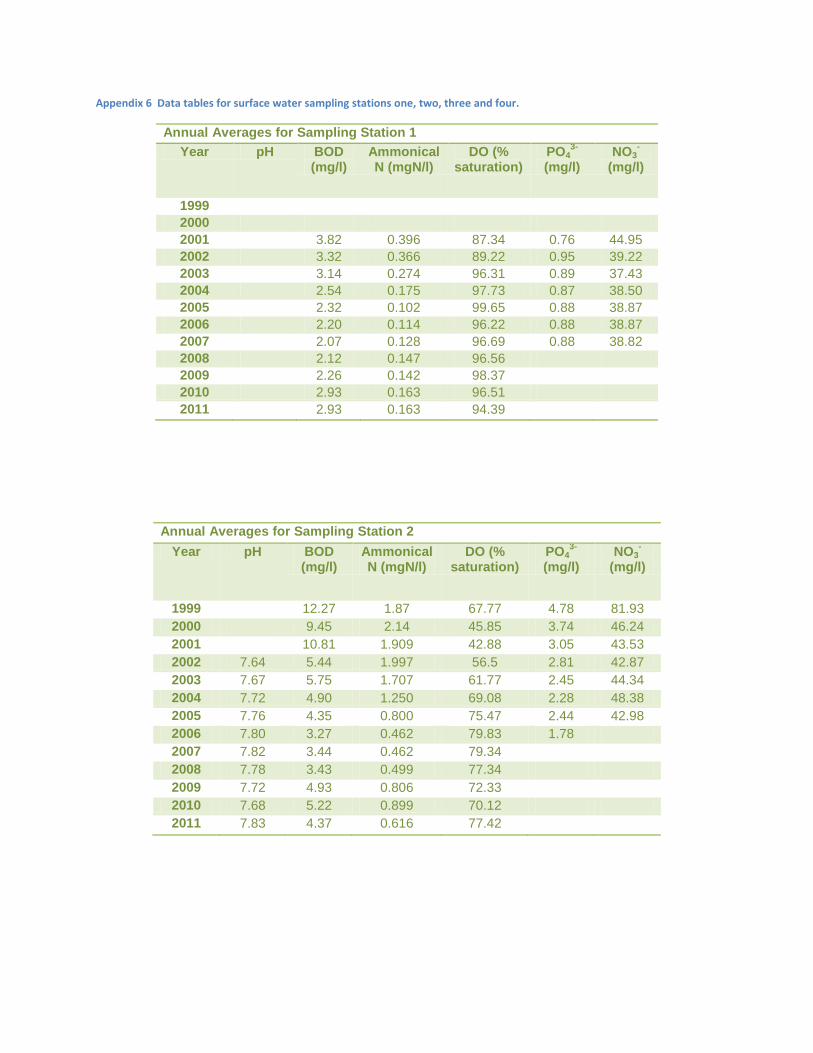
Appendix 6 Data tables for surface water sampling stations one, two, three and four.
Annual Averages for Sampling Station 1
Year pH BOD (mg/l)
Ammonical N (mgN/l)
DO (% saturation)
PO43-
(mg/l) NO3
-
(mg/l)
1999
2000
2001 3.82 0.396 87.34 0.76 44.95
2002 3.32 0.366 89.22 0.95 39.22
2003 3.14 0.274 96.31 0.89 37.43
2004 2.54 0.175 97.73 0.87 38.50
2005 2.32 0.102 99.65 0.88 38.87
2006 2.20 0.114 96.22 0.88 38.87
2007 2.07 0.128 96.69 0.88 38.82
2008 2.12 0.147 96.56
2009 2.26 0.142 98.37
2010 2.93 0.163 96.51
2011 2.93 0.163 94.39
Annual Averages for Sampling Station 2
Year pH BOD (mg/l)
Ammonical N (mgN/l)
DO (% saturation)
PO43-
(mg/l) NO3
-
(mg/l)
1999 12.27 1.87 67.77 4.78 81.93
2000 9.45 2.14 45.85 3.74 46.24
2001 10.81 1.909 42.88 3.05 43.53
2002 7.64 5.44 1.997 56.5 2.81 42.87
2003 7.67 5.75 1.707 61.77 2.45 44.34
2004 7.72 4.90 1.250 69.08 2.28 48.38
2005 7.76 4.35 0.800 75.47 2.44 42.98
2006 7.80 3.27 0.462 79.83 1.78
2007 7.82 3.44 0.462 79.34
2008 7.78 3.43 0.499 77.34
2009 7.72 4.93 0.806 72.33
2010 7.68 5.22 0.899 70.12
2011 7.83 4.37 0.616 77.42
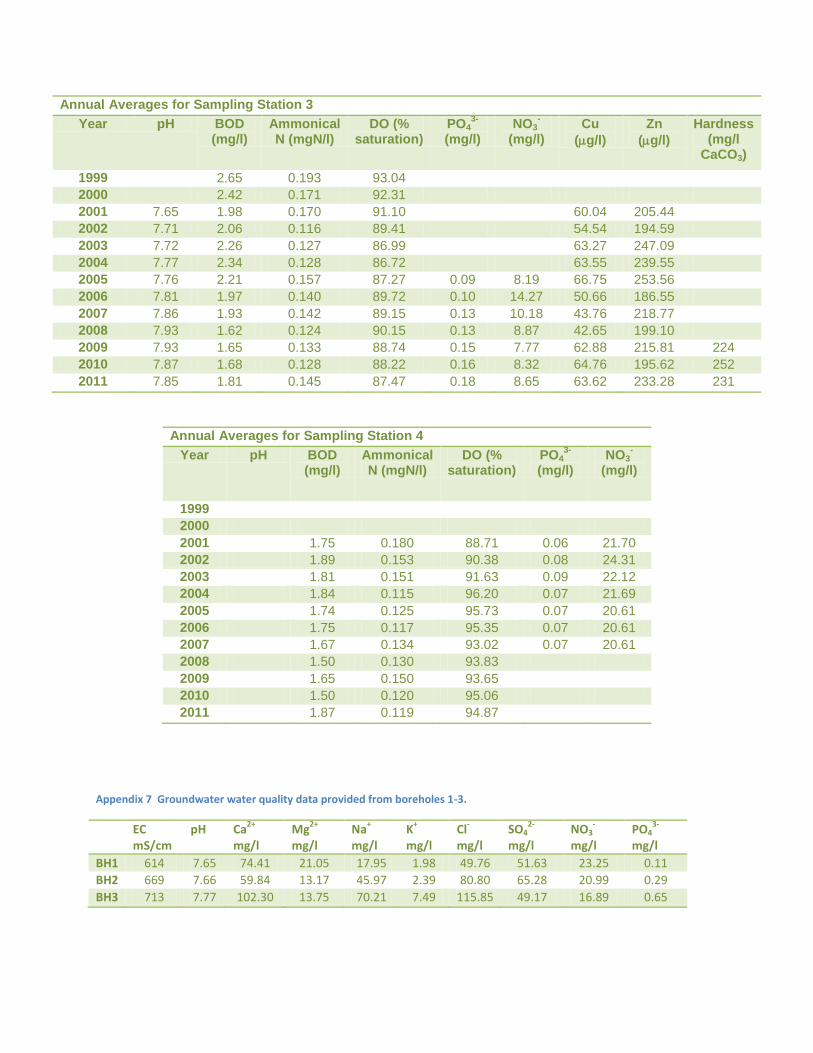
Annual Averages for Sampling Station 3
Year pH BOD (mg/l)
Ammonical N (mgN/l)
DO (% saturation)
PO43-
(mg/l) NO3
-
(mg/l) Cu
(g/l)
Zn
(g/l)
Hardness (mg/l
CaCO3)
1999 2.65 0.193 93.04
2000 2.42 0.171 92.31
2001 7.65 1.98 0.170 91.10 60.04 205.44
2002 7.71 2.06 0.116 89.41 54.54 194.59
2003 7.72 2.26 0.127 86.99 63.27 247.09
2004 7.77 2.34 0.128 86.72 63.55 239.55
2005 7.76 2.21 0.157 87.27 0.09 8.19 66.75 253.56
2006 7.81 1.97 0.140 89.72 0.10 14.27 50.66 186.55
2007 7.86 1.93 0.142 89.15 0.13 10.18 43.76 218.77
2008 7.93 1.62 0.124 90.15 0.13 8.87 42.65 199.10
2009 7.93 1.65 0.133 88.74 0.15 7.77 62.88 215.81 224
2010 7.87 1.68 0.128 88.22 0.16 8.32 64.76 195.62 252
2011 7.85 1.81 0.145 87.47 0.18 8.65 63.62 233.28 231
Annual Averages for Sampling Station 4
Year pH BOD (mg/l)
Ammonical N (mgN/l)
DO (% saturation)
PO43-
(mg/l) NO3
-
(mg/l)
1999
2000
2001 1.75 0.180 88.71 0.06 21.70
2002 1.89 0.153 90.38 0.08 24.31
2003 1.81 0.151 91.63 0.09 22.12
2004 1.84 0.115 96.20 0.07 21.69
2005 1.74 0.125 95.73 0.07 20.61
2006 1.75 0.117 95.35 0.07 20.61
2007 1.67 0.134 93.02 0.07 20.61
2008 1.50 0.130 93.83
2009 1.65 0.150 93.65
2010 1.50 0.120 95.06
2011 1.87 0.119 94.87
Appendix 7 Groundwater water quality data provided from boreholes 1-3.
EC mS/cm
pH Ca2+
mg/l
Mg2+
mg/l
Na+
mg/l K
+
mg/l Cl
-
mg/l SO4
2-
mg/l NO3
-
mg/l PO4
3-
mg/l
BH1 614 7.65 74.41 21.05 17.95 1.98 49.76 51.63 23.25 0.11
BH2 669 7.66 59.84 13.17 45.97 2.39 80.80 65.28 20.99 0.29
BH3 713 7.77 102.30 13.75 70.21 7.49 115.85 49.17 16.89 0.65


