jo u r nal homep age: www.elsev ier .com/ locate /snb
ater salinity detection using a smartphone
ftak Hussain a, Munmun Das a, Kamal Uddin Ahamad b, Pabitra Nath a,∗
Applied photonics and Nano-Photonics Laboratory, Department of Physics, Tezpur University, Assam, 784028, IndiaDepartment of Civil Engineering, Tezpur University, Tezpur, Assam 784028, India
r t i c l e i n f o
rticle history:eceived 8 April 2016eceived in revised form 16 August 2016ccepted 18 August 2016vailable online 18 August 2016
This paper demonstrates the operation of a smartphone based platform salinity sensor for accurate andreliable monitoring of salinity level in oceanic water environment. To measure water salinity level usingthe smartphone, two different approaches have been proposed and their sensing performances havebeen compared. The first approach is based on Beer-Lambert principle where collimated light beam froman optical source while passing through the medium gets attenuated due to absorption by the mediumwhich can be detected and analyzed by the smartphone. The second approach is based on evanescentfield absorption from an uncladed U-bent sensing region of an optical fiber. Variation in salinity levelof the surrounding medium of the fiber sensing region affects the absorption of evanescent field andthis can be monitored by the smartphone. Two freely available android applications have been used for
ensitivitymbient light sensor (ALS)
detection and analysis of salinity level. The designed smartphone sensor has an ability to measure salinitylevel variation as low as 0.1 parts per thousand (ppt) with high accuracy and repeatability. We envisionthat owing to its compact size, low-cost and truly user-friendly in nature, the sensing techniques couldemerge as potential alternative to existing salinity sensors that would be useful for different in-fieldapplications.
Salinity is defined as the dissolved salt content in water [1].n general, presence of dissolved salt elements such as sodiumhloride (NaCl), potassium chloride (KCl) and magnesium chlo-ide (MgCl2) in water are responsible for salinity of the medium.he physical characteristics of environmental water bodies suchs density and heat capacity are governed by salinity along withemperature and pressure. In oceanography, the measurement ofalinity is considered to be one of the most important parameteror monitoring marine environment. Every marine species adaptedhem to a certain salinity level. Salinity level above the normalange may affect dissolved oxygen concentrations and osmosis reg-lation [2] which may result extinction of some species. Salinityeasurement is also used for detection of saltwater intrusion in
ormal water plants. Presence of low level of salinity in drinkingater may not pose significant health risk but it can have certain
mpact on diabetic and renal dialysis patients since they have toontrol their daily salt intake [3]. The conventional method for mea-uring salinity is to measure conductivity of the solution but this
method is susceptible to electromagnetic interference [4]. Opticaltechniques based on various fiber optic sensors have been pro-posed for in-situ monitoring of water salinity [5–8]. The use ofseparate opto-electronic components such as laser source, photo-detector, microcontroller and microprocessor make such sensingsystems relatively costly and for transfer of in-field data fromremote location to central laboratory, a separate communicationset-up is needed. Since, refractive index of a medium increases withits salinity level, refractive index based salinity sensors has alsobeen demonstrated [9]. The refractive index measurement gives arelative measure of water salinity and one has to convert the salinitylevel through an intermediate calibration step.
With tremendous improvement both in hardware and software,smart built-in sensors, good user interface and freely availableapplications there has been an ever-increasing demand for smart-phones across the globe. According to Cisco Visual NetworkingIndex (VNI), 563 million mobile devices and new connections wereadded in 2015 [10]. Incorporation of high speed CPU, increase indevice memory unit and in-built communication facility enablesreal time data analysis and interpretation within the smartphoneitself that make smartphones a primary choice for researchers
across the globe to convert it as a low cost, automated sensingtools for different physical, chemical and biological sensing appli-cations [11–17]. With high megapixel imaging sensor and ability
o do real time image processing, smartphone finds its applicationsn imaging, detection and analysis of different biological samples18–24]. In most of the smartphone based platform sensing sys-ems, the CMOS image sensor of the phone has been explicitly usedor sensing of different chemical and biological samples.
The ambient light sensor (ALS) embedded in front panel of themartphone is meant for optimizing battery power consumptionf the phone by controlling brightness of the display panel auto-atically in accordance with the surrounding environment. Almost
ll branded smartphones contain Avago APDS-9930 or ams AGTAOS) TMD2771 integrated ambient light and proximity sensorhip [25,26]. This integrated sensor assembly is composed of oneow power infra-red (IR) LED and two photodiodes in which ones sensitive to both visible and infra-red light and the second pho-odiode is sensitive primarily to IR light for proximity detection.he sensor module includes two built-in ADC for each photodi-de channel for conversion of photodiode current into a digitalalue. The digital data is then transferred to a register and a built-n microprocessor reads the digital input signal. Thus, photodiode’signal intensity converts into corresponding digital output whichan be displayed in the monitor of the smartphone by using suit-ble smartphone applications. Since the digitally converted outputs proportional to the photocurrent generated in the photodiodef the smartphone, this easily readable output can be exploitedor various photo-sensitive measurements. Freely available appli-ations such as ‘Light meter app’ for photo-detection and ‘stanXYpp’ [27,28] for calibrations and data analysis for android platformmartphones can be a used for direct sensing or measurement ofarious parameters. Using the ‘Light meter app’ a large dynamicange 0–20,000 LUX of the smartphone ALS sensor can be recordedhich eventually can be utilized for intensity modulation based
ensing investigations. Again, using the existing mobile networkacility it is possible to transfer data from remote location to any-
here in the world and real time data analysis can be performedrom the central laboratory. Very recently, we have demonstratedhat using ALS sensor of the smartphone and by using the abovepplications, turbidity in drinking water and different environmen-al water bodies can be estimated reliably [29]. Using the integratedash lamp and the ALS of the smartphone, an optical set-up can beesigned by which one can easily monitor the presence of chemicalnd other toxic elements in water sample [30]. In the present work,e primarily exploit the embedded flash lamp and the ALS of the
martphone for salinity level detection and analysis of sea water.n order to estimate the salinity level in sea water we propose twomartphone optical set-up approaches. While the first techniques based on Beer-Lambert principle where the intensity of the col-imated light beam after passing through the saline medium getsttenuated due to absorption by the medium and the intensity ofhe transmitted beam depends on salinity level (or concentration)f the medium which can be measured accurately and reliably byhe smartphone sensor. The other approach is based on evanes-ent field absorption from a U-shaped fiber optic sensor which isoupled to the flash lamp and the ALS of the smartphone. The per-ormances of both the techniques have been compared in terms ofts sensitivity, reproducibility, and its dynamic range. Further, thexperimental data of the sensor responses have been comparedith the standard conductivity meter often used for such purpose.
or both the schemes, the experimentally obtained data have beennalysed in the phone itself using freely available applications.wing to its compact size, relatively inexpensive for developmentf the sensor, user friendly apps for handling of the sensing systemsnd ability to share in-field data through the existing mobile net-
ork, we envision that the proposed techniques could emerge as a
otential alternative tool over the existing commercially availablealinometers in the market.
ors B 239 (2017) 1042–1050 1043
2. Working principle
2.1. Working principle of smartphone based direct transmissionsalinity sensor
Consider a collimated beam passes through an optical medium.The beam gets attenuated due to absorption by the medium andthe magnitude of absorption depends on the path length and theconcentration of the medium. According to Beer-Lambert principle[31,32] the intensity of the transmitted light IT can be expressed as
IT = I0 exp (−εcl) (1)
where, I0 is the intensity of the incident light propagating throughthe absorbing medium of path length l, c is the concentration of thesolution and ε is the molar absorption co-efficient. From Eq. (1) itcan be inferred that for fixed optical path length, the intensity ofthe transmitted light depends on concentration of the medium. Inthe first sensing approach, we primarily exploit this principle forestimating the salinity level of water medium.
2.2. Working principle of smartphone based evanescent fieldabsorption salinity sensor
In the second sensing scheme, the exponentially decayingevanescent field from the fiber core-air interface of an uncladdedU-shaped optical fiber has been utilized for development of thesmartphone salinity sensor. Evanescent wave absorption in anexternal medium is obtained by removing a certain region of thecladding of an optical fiber and then bent it to form a U-shapedfiber probe [33]. If the refractive index of the absorbing medium isless than the refractive index of the core then the evanescent wavepenetrates a short distance into the low index medium when totalinternal reflection occurs at a dielectric interface. The penetrationdepth dp is the perpendicular distance from the interface at whichthe electric field amplitude E, deceases by 1/e of its value, E0 in theinterface [34]. We can write
E = E0 exp
(− z
dp
)(2)
The transmitted power P, of the optical fiber in which thecladding of length l is locally replaced by an absorbing mediumand is given by
P = P0exp (−�cl) (3)
where, P0 is the power transmitted without the absorbing medium,� is the evanescent wave absorption co-efficient and c is theconcentration of the medium. The evanescent field absorptionco-efficient for a ray making an angle � with the normal to thecore-cladding interface is given by [35]
� = ε�n2Cos�Cot�
2��n21cos
2�c(sin2� − sin2�c
)1/2(4)
where, ε is the bulk absorption co-efficient of the absorbing mate-rial, � is the wavelength of light source, � is the radius of the fibercore, n1 and n2 are the refractive index of core and cladding, �is the incident angle at the core-cladding interface and �c is thecritical angle of incidence. Since the bulk absorption co-efficient εis proportional to the concentration of the medium therefore fora controlled launching condition the evanescent wave absorptionco-efficient can be related to the concentration of the absorbing
medium. If the sensing region of the optical fiber is bend to a U-shaped probe then the bending decreases the incident angle ofthe ray with the normal to the interface and the incident angleapproaches closer to the critical angle. Thus, from Eqs. (3) and (4)
1044 I. Hussain et al. / Sensors and Actuators B 239 (2017) 1042–1050
ission
ie
3
fpdiSptoTsfesi
4
4t
iHstsmalvlsfnpwfltAd
Fig 1. (a) Schematic of smartphone based direct transm
t can be seen that using a U shaped probe the sensitivity of thevanescent field absorption can be enhanced significantly [33].
. Materials and method
Laboratory grade Sodium Chloride salt (NaCl) was procuredrom SRL, India and artificial sea salt (Red sea coral pro salt) wasrocured from amazon, India (product no. B00NBI0KW6). Stan-ard saline solutions of different salinity level have been prepared
n reagent grade distilled water in parts per thousand (ppt) units.aline solution samples of different concentrations of have beenrepared in three different ranges (i) 0 ppt–1 ppt in step incremen-al value of 0.1 ppt, (ii) 1 ppt–10 ppt with step incremental valuef 1 ppt and (iii) 10 ppt–100 in step incremental value of 10 ppt.o evaluate the sensor performance for environmental sea water,aline solutions of different concentrations have been preparedrom the procured artificial sea salt since it contains all the min-rals that can be found in real oceanic environment. These salineamples have been prepared in the range 5 ppt–95 ppt with stepncremental value of 10 ppt.
. Experimental set-up
.1. Experimental design of smartphone based directransmission salinity sensor
The schematic of the proposed smartphone sensor whose work-ng principle is based Beer-Lambert principle is shown in Fig. 1(a).ere, we have used Sony Xperia E3 smartphone for both the sen-
or modules. The specification of this phone has been provided inhe Supplementary material. Light signal from the flash LED of themartphone is coupled to a Poly (methyl methacrylate) (PMMA)ultimode optical fiber of diameter 980/1000 �m and numerical
perture 0.51 (product id. 02534, Edmund optics) and the outputight signal from this fiber is coupled to the ALS of the smartphoneia a pair of collimating and focusing lens arrangement which is fol-owed by a diffuser. A quartz cuvette that contains the saline waterample is placed in the optical path between the collimating and theocusing lens of the designed set-up. A ground glass diffuser (Modelo. HO-DF-50S-32, Holmarc optics, India) is placed in the opticalath between the focusing lens and the ALS of the smartphonehich effectively eliminates the error that occurs due to intensity
uctuations over the photosensitive area of the ALS. Fig. 1 (b) showshe photo image of the designed smartphone based salinity sensor.
coin cell battery is included for dimensional impression of theesigned set-up.
salinity sensor, (b) photo image of the proposed sensor.
4.2. Experimental design of smartphone based evanescent fieldabsorption salinity sensor
For the second sensing scheme, a 980/1000 �m plastic opticalfiber (Product id. 02534, Edmund optics) has been chosen. Approx-imately 20 mm of the optical fiber cladding has been removed bypolishing it gently with a zero emery paper and then bent in to forma U-shaped probe. This uncladded U-shaped fiber probe essentiallyforms the sensing region for the second sensing approach for oursmartphone based platform salinometer. The fiber probe is thenfixed in the lid of a sample container. Light signal from flash lampof the smartphone is coupled to one end of the fiber while the otherend of it is coupled to the detector via a diffuser in the opticalpath between the fiber end and the ALS of the smartphone. Theevanescent field at the sensing region of the fiber interacts effec-tively with the surrounding medium with enhanced sensitivity andthis can be detected by the ALS of the smartphone. Fig. 2(a) showsthe schematic of the sensing set-up and Fig. 2(b) shows the photoimage of the proposed smartphone sensing set-up.
In order to measure salinity of a medium directly by the phonetwo freely available android platform applications, ‘light meter’ and‘stanXY’ have been used for data acquisition and analysis. All opti-cal components including the smartphone have been mounted in acustom developed plastic holder which is made of Nylon. The innerwall of the Nylon block is blackened so that affect of the ambi-ent light can be neglected. Low cost, high mechanical strength andsuperior resistance to wear from chemicals make Nylon materiala primary choice for fabricating the optical holder in the presentinvestigation. The overall dimension of the setup is measured tobe 140 mm in length, 80 mm in both breadth and 40 mm in widthand the weight of the designed sensor along with the phone isapproximately 250 g.
5. Workflow of the smartphone applications
Fig. 3 shows the process flow of the proposed smartphone basedsalinity measuring device. The freely available ‘Light meter’ app forandroid smartphone measures the intensity of the light beam trans-mitted through the sample in LUX unit. This specific app measuresthe average value through recording of minimum and the maxi-mum variation of the intensity for a specific period of time. Thedigital output is then normalized by dividing with the intensityvalue when the sample holder contains only distilled water andnormalized sensor response was computed. To plot the variationof sensor data with change in salinity level of the medium another
free app ‘stanXY’ has been used in the present work. Using thisapp a calibration curve of the absorbance values for standard salinemedia was first obtained. To estimate the salinity of an unknownmedium, the observed sensor data is then plotted in the standard
I. Hussain et al. / Sensors and Actuators B 239 (2017) 1042–1050 1045
bsorp
cmte
6
pwloooddtt
Fig. 2. (a) Schematic of smartphone based evanescent field a
alibration curve and from the plotted data, the salinity value of aedium has been estimated. Thus, using simple optical set-up and
wo free applications, the salinity of any unknown samples can bestimated easily with both of the designed sensing set-ups.
. Results and discussion
Prior to start of the investigation, the performance of the smart-hone ALS sensor has been evaluated for different incident lightavelength. Three different optical filters with optical pass wave-
ength of 460 nm, 540 nm and 635 nm have been placed one byne in the optical set-up of Fig. 1.We then introduce 10 samplesf different salinity level in the range 0–100 ppt in the optical pathf the set-up and the sensor responses have been recorded. Fig. 4
escribes the sensor response curves for the three different inci-ent wavelengths recorded by the designed sensing system for allhe considered samples. These experimental data clearly indicatehat as compared to 460 nm and 540 nm incident wavelength light
Fig. 3. Workflow of the smartphone applications
tion salinity sensor, (b) photo image of the designed sensor.
signal, the response of the designed sensor is found to be more sen-sitive for 635 nm incident light signal. This is attributed to the peakspectral response of the embedded photo detector of the ALS of thesmartphone, which is found to be highest in the wavelength range600–700 nm and a 635 nm incident radiation overlaps fairly withthe peak spectral response of the embedded photo-detector. Thispreliminary investigation infers that a 635 nm incident radiationwould be suitable for the present sensing studies.
6.1. Evaluation of sensor performance for both the sensormodules
Upon confirming the incident radiation wavelength suitable forthe present sensing investigation the sensor performances have
been evaluated for both the schemes described in Figs. 1 and 2.Fig. 5 describes the sensor responses measured by the smartphonefor both approaches for the considered samples. We observe sim-ilar trend in sensor responses for both the schemes. Compared to
for salinity measurement of water samples.
1046 I. Hussain et al. / Sensors and Actuat
Fl
dfisi
ig. 4. The response characteristic curve of smartphone ALS for different wave-ength.
irect transmission scheme, the sensitivity for the U-bent opticalber probe is however found to be higher. The responses of theensors are found to be piece-wise linear for both the schemes. Thenset in the same figure shows the zoom-in view of the sensors
Fig. 5. Response curve for both the sensor m
ors B 239 (2017) 1042–1050
responses for both the schemes for media with salinity value rang-ing from 0 to 1 ppt. Clearly, as compared to direct coupling scheme,with U-bent fiber sensing probe a higher sensitivity (which is theratio of the change in sensor response to change in salinity level) hasbeen observed. The higher sensitivity for the U-shaped fiber probeis attributed to the enhanced evanescent light signal coupling fromthe sensing region to the surrounding absorbing medium. Further,among the two designed schemes, the linearity in sensor responsefor U-shaped fiber probe is found to better (with correlation coef-ficient r ∼ 0.99386) than the first scheme (correlation coefficientr ∼ 0.93608) in the salinity range 0–1 ppt. The error bars shownin this figure represents the standard deviations for 5 consecutivemeasurements of each sample.
6.2. Evaluation of sensor characteristics for both the proposedsensing schemes
The evaluation of sensor characteristics for both the sensor mod-ules have been carried out and corresponding sensor parametershas been compared. The Detailed analysis of all the necessary sens-ing parameters has been discussed in the sub-sections given below:
odule for salinity range 0 ppt–100 ppt.
I. Hussain et al. / Sensors and Actuators B 239 (2017) 1042–1050 1047
Fr
6
uf
S
wstfipw
6
fbvhirsmscsa
6
tlimoostmtss
as
DL = 3.3/s (6)
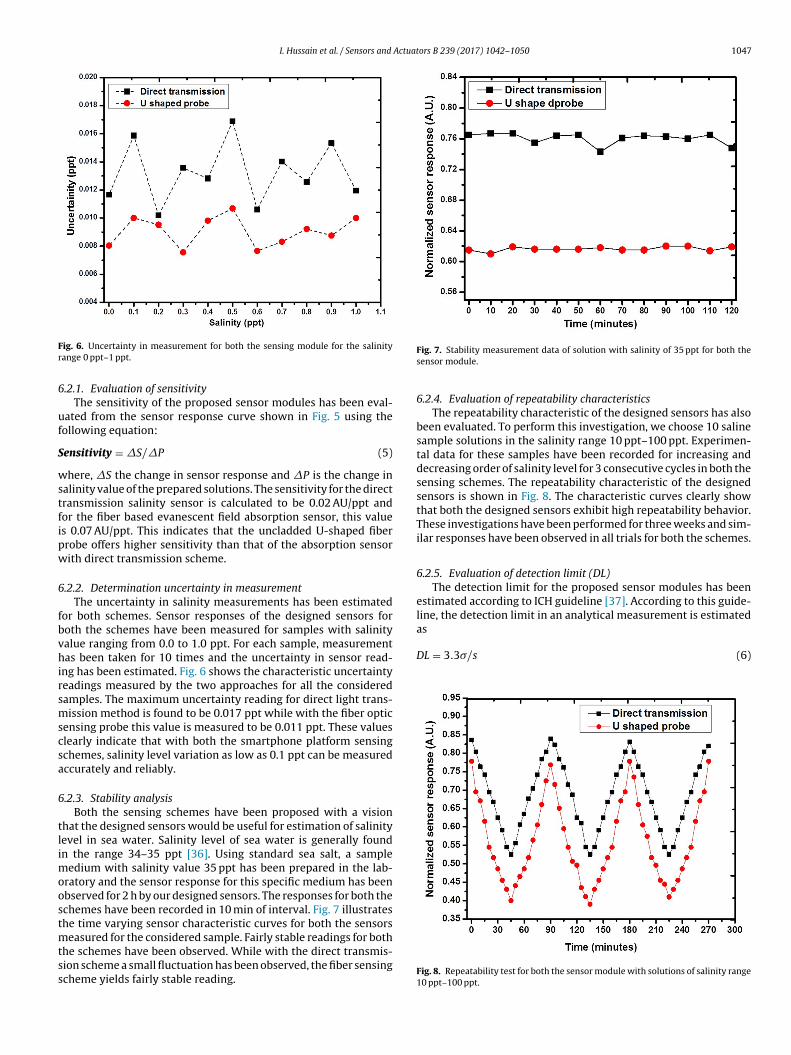
ig. 6. Uncertainty in measurement for both the sensing module for the salinityange 0 ppt–1 ppt.
.2.1. Evaluation of sensitivityThe sensitivity of the proposed sensor modules has been eval-
ated from the sensor response curve shown in Fig. 5 using theollowing equation:
ensitivity = �S/�P (5)
here, �S the change in sensor response and �P is the change inalinity value of the prepared solutions. The sensitivity for the directransmission salinity sensor is calculated to be 0.02 AU/ppt andor the fiber based evanescent field absorption sensor, this values 0.07 AU/ppt. This indicates that the uncladded U-shaped fiberrobe offers higher sensitivity than that of the absorption sensorith direct transmission scheme.
.2.2. Determination uncertainty in measurementThe uncertainty in salinity measurements has been estimated
or both schemes. Sensor responses of the designed sensors foroth the schemes have been measured for samples with salinityalue ranging from 0.0 to 1.0 ppt. For each sample, measurementas been taken for 10 times and the uncertainty in sensor read-
ng has been estimated. Fig. 6 shows the characteristic uncertaintyeadings measured by the two approaches for all the consideredamples. The maximum uncertainty reading for direct light trans-ission method is found to be 0.017 ppt while with the fiber optic
ensing probe this value is measured to be 0.011 ppt. These valueslearly indicate that with both the smartphone platform sensingchemes, salinity level variation as low as 0.1 ppt can be measuredccurately and reliably.
.2.3. Stability analysisBoth the sensing schemes have been proposed with a vision
hat the designed sensors would be useful for estimation of salinityevel in sea water. Salinity level of sea water is generally foundn the range 34–35 ppt [36]. Using standard sea salt, a sample
edium with salinity value 35 ppt has been prepared in the lab-ratory and the sensor response for this specific medium has beenbserved for 2 h by our designed sensors. The responses for both thechemes have been recorded in 10 min of interval. Fig. 7 illustrateshe time varying sensor characteristic curves for both the sensors
easured for the considered sample. Fairly stable readings for bothhe schemes have been observed. While with the direct transmis-ion scheme a small fluctuation has been observed, the fiber sensingcheme yields fairly stable reading.
Fig. 7. Stability measurement data of solution with salinity of 35 ppt for both thesensor module.
6.2.4. Evaluation of repeatability characteristicsThe repeatability characteristic of the designed sensors has also
been evaluated. To perform this investigation, we choose 10 salinesample solutions in the salinity range 10 ppt–100 ppt. Experimen-tal data for these samples have been recorded for increasing anddecreasing order of salinity level for 3 consecutive cycles in both thesensing schemes. The repeatability characteristic of the designedsensors is shown in Fig. 8. The characteristic curves clearly showthat both the designed sensors exhibit high repeatability behavior.These investigations have been performed for three weeks and sim-ilar responses have been observed in all trials for both the schemes.
6.2.5. Evaluation of detection limit (DL)The detection limit for the proposed sensor modules has been
estimated according to ICH guideline [37]. According to this guide-line, the detection limit in an analytical measurement is estimated
Fig. 8. Repeatability test for both the sensor module with solutions of salinity range10 ppt–100 ppt.
1048 I. Hussain et al. / Sensors and Actuators B 239 (2017) 1042–1050
Table 1Comparison of different sensing parameters for both the sensor module.
Sensitivity 0.02 AU/ppt 0.07 AU/pptResidual standard deviation (RSD) 0.0008 AU 0.0009 AUUncertainty 0.017 ppt 0.011 ppt
wrbitEte
6
wmdhomtc0c
dept
ba
Fs
Linearity (r) Sensing range 93%1–100 ppt
Detection limit (DL) 0.13 ppt
here, and s are the residual standard deviation (RSD) of theesponse and slope of the calibration curve. To measure the DL foroth the sensors, we consider the calibration curve shown in Fig. 5
n the range 0–1 ppt. The RSD and slope has been evaluated fromhis curve and the DL of the designed sensor is estimated using theq. (6). The DL for the direct transmission salinity sensor is foundo be 0.13 ppt while for the U-shaped fiber optic probe this value isstimated to be 0.04 ppt.
.2.6. Evaluation of sensing range for both the sensor modulesThe evaluation of uncertainty in measurements signifies that
ith direct transmission based sensing scheme, a higher measure-ent error is obtained in the range 0–1 ppt with co-efficient of
etermination R2 = 0.90322. It shows piece-wise linear trend forigher salinity values. The sensing range for this specific scheme isbserved to be sensitive in the range 1–100 ppt. The uncertainty ineasurement for U-shaped fiber sensing probe is however found
o be much less than the direct light coupling sensing scheme witho-efficient of determination R2 = 0.98488 in the salinity range of–1 ppt. This indicates that the sensing range for the former schemeould be suitable for 0–100 ppt.
Important sensing parameters such as sensitivity, residual stan-ard deviation, uncertainty, sensing range and DL have beenvaluated for both the designed sensors. Table 1 summarizes theerformance comparison for these parameters as yielded by both
he schemes.
Finally, the performances of both the sensing schemes haveeen compared with the laboratory grade conductivity meter usu-lly used for estimating the salinity level of sea water. Saline
ig. 9. Histogram representation of comparison of salinity measurement of prepared wensing module.
99%0–100 ppt0.04 ppt
solutions of random salinity value using artificial sea salt have beenprepared in the laboratory and the salinity level of the preparedsamples has been initially measured with the standard conductivitymeter (3540 Bench conductivity meter, Bibby Scientific) in �s/cmand then converted the value into corresponding salinity ppt units[38]. The salinity of the prepared samples were then measured byour designed sensing systems. Fig. 9 describes the histogram repre-sentation of the experimental sensor data for the two smartphoneplatform sensors and the standard tool. These data again clearlyindicate that almost similar sensor response have been observedfor all the three situations. For direct light coupling scheme, theerror associated with the experimental data is found to be high inlow level of saline medium. This is attributed to low absorbanceof the medium for low salinity level due to which a relatively highintensity of light signal is being received by the smartphone ALS.This may cause fluctuations in the sensor readings. On the otherhand, with fiber optic sensing set-up we observe fairly linear andcomparable data as that of the standard tool-conductivity meterused for the present work.
The proposed two smartphone sensing schemes are useful intransmitting the in-field experimental data from remote locationto the central laboratory or anywhere in the world through theexisting mobile network facility. Owing to the involvement of rel-atively low cost components and relatively simple optical set-upwe envision that the designed sensing system could emerge as aninexpensive alternative to its commercially available counterparts
with added advantages of having ability to monitor and analyzein-field sensing data from the central laboratory. Fluctuations oftemperature and pressure may affect the measurement data, since
ater samples by the standard conductivity meter and by our smartphone salinity
Actuat
sstrfsss
7
ssbpmpanwmsmidwbcp
A
fvKseDwUf2
A
t
R
[
[
[
[
[
[
[
[
[
[
[
[
[
[
[
[
[
[ hl=en
[
[
[
[
[
[
[[
[
[
I. Hussain et al. / Sensors and
alinity variation depends on the temperature and pressure. On-ite calibration and detection in ambient environment may reducehe error due to fluctuations of such physical parameters. In envi-onmental water samples presence of turbidity may be an issueor false measurement since presence of suspended particle maycatter light signal and hence may affect the sensor data. Neces-ary filtration of such water samples is required before measuringalinity levels using the proposed designed sensors.
. Conclusion
In summary, the workings of smartphone integrated salinityensors using two different sensing modalities have been demon-trated. The in-built flash lamp and ALS of the smartphone haveeen used as source and detector, which eventually makes theroposed sensors as a stand-alone salinity sensor for in-situ deter-ination of salinity in water medium. Two different android
latform applications have been used for detection and datanalysis. Use of smartphone makes it possible for real time commu-ication and data sharing from any remote location to the centralater quality monitoring unit. The salinity values of different salineedium ranging from 0 to 100 ppt have been successfully mea-
ured by both the proposed sensing systems. The designed sensorodules are suitable for salinity monitoring in oceanographic stud-
es and also can be used by diabetic patients for monitoring theiraily salt intake. The performance of the sensor has been comparedith the commercial conductivity meter and good correlation has
een observed. The proposed sensing device may also finds appli-ations in other clinical and biological investigations which will beerformed in the future course of work.
cknowledgement
P. Nath gratefully acknowledges the valuable guidance receivedrom B. Cunningham on similar line of work during visit to Uni-ersity of Illinois at Urbane Champaign, USA. Authors thank P.alita, Department of Civil Engineering (TU) for assistance with thetandard conductivity meter measurements. Authors also acknowl-dge the support received from Workshop, Mechanical Engineeringepartment (TU) for developing of the plastic holder for the presentork. I. Hussain acknowledges the financial support received fromGC, New Delhi for awarding Maulana Azad National fellowship
or Minority students 2014–15 (Grant no.F117.1/201415/MANF-01415- MUS-ASS-34147).
ppendix A. Supplementary data
Supplementary data associated with this article can be found, inhe online version, at http://dx.doi.org/10.1016/j.snb.2016.08.102.
[2] G. Boeuf, P. Payan, How should salinity influence fish growth? Comp.Biochem. Phys. C 130 (2001) 411–423.
[3] E.I. Ekinci, S. Clarke, M.C. Thomas, J.L. Moran, K. Cheong, R.J. MacIsaac, et al.,Dietary salt intake and mortality in patients with type 2 diabetes, DiabetesCare 34 (2011) 703–709.
[4] M. Hayashi, Temperature-electrical conductivity relation of water forenvironmental monitoring and geophysical data inversion, Environ. Monit.Assess. 96 (2004) 119–128.
[5] Q.Q. Meng, X.Y. Dong, K. Ni, Y. Li, B. Xu, Z.M. Chen, Optical fiber laser salinity
sensor based on multimode interference effect, IEEE Sens. J. 14 (2014)1813–1816.
[6] H.A. Rahman, S.W. Harun, M. Yasin, H. Ahmad, Fiber-optic salinity sensorusing fiber-optic displacement measurement with flat and concave mirror,IEEE J. Sel. Top. Quant. 18 (2012) 1529–1533.
[
ors B 239 (2017) 1042–1050 1049
[7] H.A. Rahman, S.W. Harun, M. Yasin, S.W. Phang, S.S.A. Damanhuri, H. Arof,et al., Tapered plastic multimode fiber sensor for salinity detection, Sens.Actuators A Phys. 171 (2011) 219–222.
[8] Y. Zhao, Y.B. Liao, Novel optical fiber sensor for simultaneous measurement oftemperature and salinity, Sens. Actuators B-Chem. 86 (2002) 63–67.
[9] X. Quan, E.S. Fry, Empirical equation for the index of refraction of seawater,Appl. Opt. 34 (1995) 3477–3480.
10] Cisco Visual Networking Index: Global Mobile Data Traffic Forecast Update2015–2020 White Paper,http://www.cisco.com/c/en/us/solutions/collateral/service-provider/visual-networking-index-vni/mobile-white-paper-c11-520862. html (accessed11.02.2016).
12] D. Gallegos, K.D. Long, H.J. Yu, P.P. Clark, Y.X. Lin, S. George, et al., Label-freebiodetection using a smartphone, Lab Chip 13 (2013) 2124–2132.
13] I. Hussain, P. Nath, Smartphone-based platform optical setup measuringpi/256 optical phase difference in an interference process, Appl. Opt. 54(2015) 5739–5742.
14] D.M. Zhang, J. Jiang, J.Y. Chen, Q. Zhang, Y.L. Lu, Y. Yao, et al.,Smartphone-based portable biosensing system using impedancemeasurement with printed electrodes for 2, 4, 6-trinitrotoluene (TNT)detection, Biosens. Bioelectron. 70 (2015) 81–88.
15] S. Dutta, A. Choudhury, P. Nath, Evanescent wave coupled spectroscopicsensing using smartphone, IEEE Photonic Technol. L 26 (2014) 568–570.
16] S. Dutta, D. Sarma, P. Nath, Ground and river water quality monitoring using asmartphone-based pH sensor, AIP Adv. 5 (2015).
17] X. Yang, Y. Wang, W. Liu, Y. Zhang, F. Zheng, S. Wang, et al., A portable systemfor on-site quantification of formaldehyde in air based on G-quadruplexhalves coupled with a smartphone reader, Biosens. Bioelectron. 75 (2016)48–54.
18] A. Ozcan, Mobile phones democratize and cultivate next-generation imaging,diagnostics and measurement tools, Lab Chip 14 (2014) 3187–3194.
19] H.C. Koydemir, Z. Gorocs, D. Tseng, B. Cortazar, S. Feng, R.Y.L. Chan, et al.,Rapid imaging, detection and quantification of Giardia lamblia cysts usingmobile-phone based fluorescent microscopy and machine learning, Lab Chip15 (2015) 1284–1293.
20] S.C.B. Gopinath, T.H. Tang, Y. Chen, M. Citartan, T. Lakshmipriya, Bacterialdetection: from microscope to smartphone, Biosens. Bioelectron. 60 (2014)332–342.
21] S. Dutta, D. Sarma, A. Patel, P. Nath, Dye-assisted pH sensing using asmartphone, IEEE Photonic Technol. L 27 (2015) 2363–2366.
22] S. Dutta, K. Saikia, P. Nath, Smartphone based LSPR sensing platform forbio-conjugation detection and quantification, RSC Adv. 26 (2016)21871–21880.
23] C. Zhang, G. Cheng, P. Edwards, M.D. Zhou, S. Zheng, Z. Liu, G-Fresnelsmartphone spectrometer, Lab. Chip 16 (2016) 246–250.
24] J.P. Devadhasan, H. Oh, C.S. Choi, S. Kim, Whole blood glucose analysis basedon smartphone camera module, J. Biomed. Opt. 20 (2015) 117001.
29] I. Hussain, K.U. Ahamad, P. Nath, Water turbidity sensing using a smartphone,RSC Adv. 27 (2016) 22374–22382.
30] I. Hussain, S.I. Tauhidi, K.U. Ahamad , P. Nath, Smartphone based system fordetection and measurement of chemical and biological species in liquids(Indian patent, application pending).
31] R.W. Ricci, M.A. Ditzler, L.P. Nestor, Discovering the Beer-Lambert law, J.Chem. Educ. 71 (1994) 983–985.
32] I. Husain, A. Choudhury, P. Nath, Fiber-optic volumetric sensor based onBeer-Lambert principle, IEEE Sens. J. 13 (2013) 3345–3346.
33] S.K. Khijwania, B.D. Gupta, Fiber optic evanescent field absorption sensor:effect of fiber parameters and geometry of the probe, Opt. Quant. Electron. 31(1999) 625–636.
34] G. Keiser, Optical Fiber Communications, McGraw Hill, New York, 2003.35] V. Ruddy, B.D. Maccraith, J.A. Murphy, Evanescent wave
absorption-spectroscopy using multimode fibers, J. Appl. Phys. 67 (1990)6070–6074.
36] T.R.S. Wilson, Salinity and the major elements of sea water, Chem. Oceanogr.1 (2) (1975) 365–413.
University of Illinois at Urbana Champaign, Urbana, through BOYSCAST fellowshipprogram 2010–2011 sponsored by the Department of Science and Technology, Gov-ernment of India. His current research interests include fiber optics sensors andsystem, Smartphone platform sensing systems, SERS and optical bio-sensing sys-tems.
050 I. Hussain et al. / Sensors and
iographies
ftak Hussain received the M.Sc degree in Physics from Tezpur University, Napaam,ndia, and currently pursuing his PhD degree from Tezpur University. His currentesearch interests include design and development of smartphone integrated sen-ors for water quality monitoring and fiber optic sensor design.
unmun Das has completed her master of science (M.Sc) in Physics from Tezpurniversity, in 2016. Her current research interests include fiber optic sensors, Smart-hone platform sensing systems and optical devices.
amal Uddin Ahamad received B. Tech degree from NIT Bhopal M. Tech and PhDegree both from IIT Guwahati. He is currently an Assistant Professor with theepartment of Civil Engineering, Tezpur University. His current research interests
nclude Water treatment, Low-cost treatment Technology, Water Quality, Wasteanagement.
ors B 239 (2017) 1042–1050
Pabitra Nath received the M.Sc degree in Physics from Tezpur University, Napaam,India, and the Ph.D. degree in electronics science from Gauhati University, Guwahati,India, in 2000 and 2009, respectively. He is currently an Associate Professor with theDepartment of Physics, Tezpur University. He has visited Micro and Nano Tech-nology Laboratory (MNTL), Department of Electrical and Computer Engineering,