41
WATER, SANITATION AND HYGIENE (WASH) MASTERPLAN Asutifi North District, Ghana March 2018
WATER, SANITATION AND HYGIENE (WASH) MASTERPLANAsutifi North District, GhanaMarch 2018
WATER, SANITATION AND HYGIENE (WASH) MASTERPLANAsutifi North District, GhanaMarch 2018
© 2018 Asutifi North District AssemblyPermission is hereby granted for sharing and adaptation of this material, in whole or in part, for non-commercial use, educational, scientific or development-related purposes, provided that the appropriate and full citation is given.
Photos used in this publication are the work of IRC Ghana
Editor: IRC Design and layout: Punt Grafisch Ontwerp, Utrecht, The Netherlands
Cite this publication as follows: Asutifi North District Assembly, 2018. Water Sanitation and Hygiene (WASH) Masterplan, Kenyasi - Ghana
Water, Sanitation and Hygiene (WASH) Masterplan 5
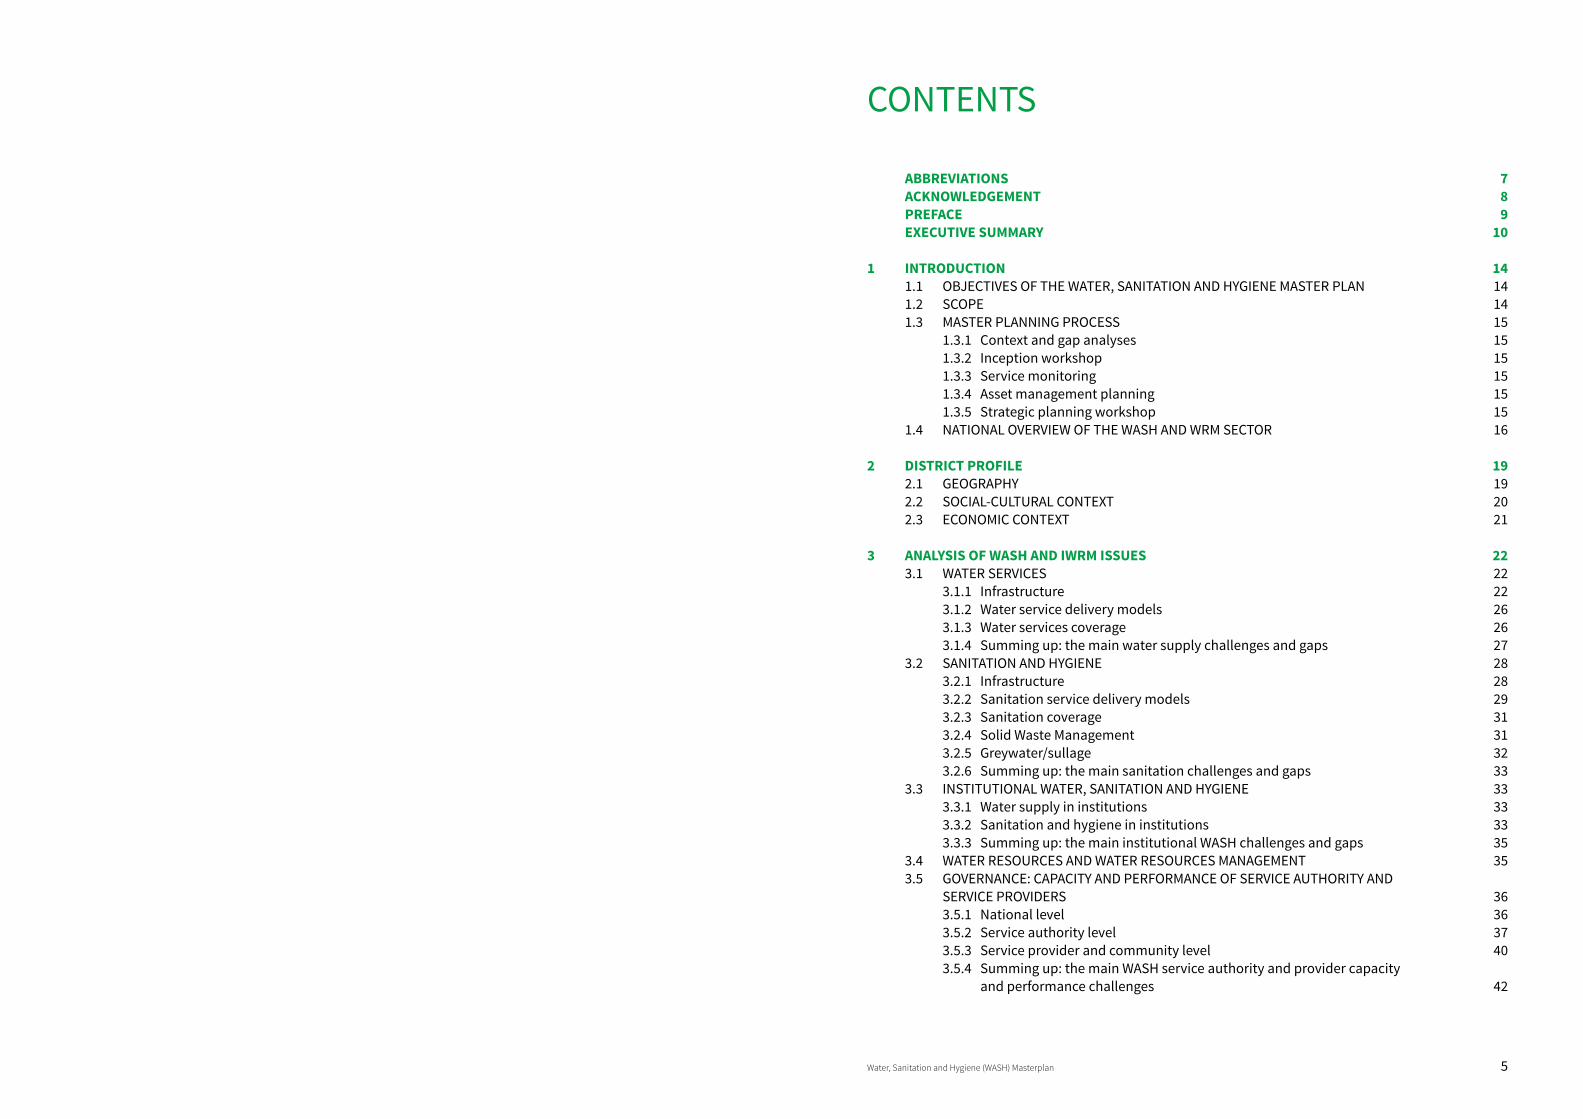
CONTENTS
ABBREVIATIONS 7 ACKNOWLEDGEMENT 8 PREFACE 9 EXECUTIVE SUMMARY 10
1 INTRODUCTION 141.1 OBJECTIVES OF THE WATER, SANITATION AND HYGIENE MASTER PLAN 141.2 SCOPE 141.3 MASTER PLANNING PROCESS 15 1.3.1 Context and gap analyses 15 1.3.2 Inception workshop 15 1.3.3 Service monitoring 15 1.3.4 Asset management planning 15 1.3.5 Strategic planning workshop 151.4 NATIONAL OVERVIEW OF THE WASH AND WRM SECTOR 16
2 DISTRICT PROFILE 192.1 GEOGRAPHY 192.2 SOCIAL-CULTURAL CONTEXT 202.3 ECONOMIC CONTEXT 21
3 ANALYSIS OF WASH AND IWRM ISSUES 223.1 WATER SERVICES 22 3.1.1 Infrastructure 22 3.1.2 Water service delivery models 26 3.1.3 Water services coverage 26 3.1.4 Summing up: the main water supply challenges and gaps 273.2 SANITATION AND HYGIENE 28 3.2.1 Infrastructure 28 3.2.2 Sanitation service delivery models 29 3.2.3 Sanitation coverage 31 3.2.4 Solid Waste Management 31 3.2.5 Greywater/sullage 32 3.2.6 Summing up: the main sanitation challenges and gaps 333.3 INSTITUTIONAL WATER, SANITATION AND HYGIENE 33 3.3.1 Water supply in institutions 33 3.3.2 Sanitation and hygiene in institutions 33 3.3.3 Summing up: the main institutional WASH challenges and gaps 353.4 WATER RESOURCES AND WATER RESOURCES MANAGEMENT 353.5 GOVERNANCE: CAPACITY AND PERFORMANCE OF SERVICE AUTHORITY AND SERVICE PROVIDERS 36 3.5.1 National level 36 3.5.2 Service authority level 37 3.5.3 Service provider and community level 40 3.5.4 Summing up: the main WASH service authority and provider capacity and performance challenges 42
6 Water, Sanitation and Hygiene (WASH) Masterplan Water, Sanitation and Hygiene (WASH) Masterplan 7
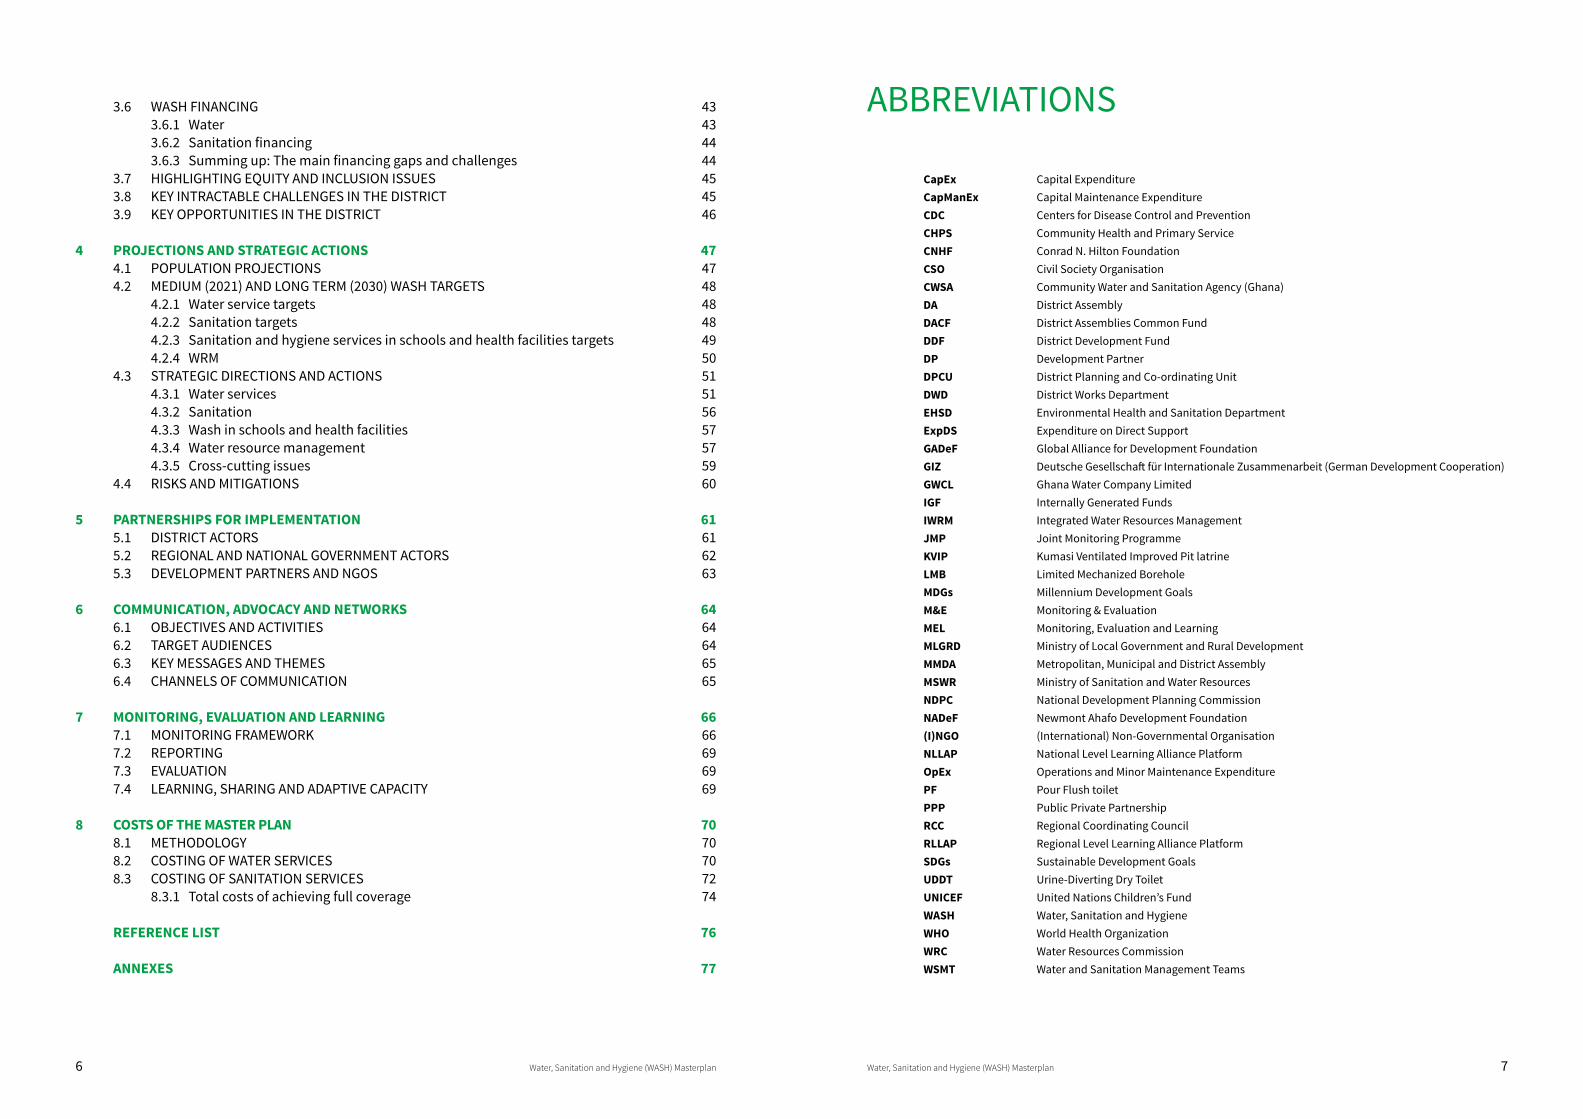
ABBREVIATIONS
CapEx Capital ExpenditureCapManEx Capital Maintenance ExpenditureCDC Centers for Disease Control and PreventionCHPS Community Health and Primary ServiceCNHF Conrad N. Hilton FoundationCSO Civil Society OrganisationCWSA Community Water and Sanitation Agency (Ghana)DA District AssemblyDACF District Assemblies Common FundDDF District Development FundDP Development PartnerDPCU District Planning and Co-ordinating UnitDWD District Works DepartmentEHSD Environmental Health and Sanitation Department ExpDS Expenditure on Direct Support GADeF Global Alliance for Development FoundationGIZ Deutsche Gesellschaft für Internationale Zusammenarbeit (German Development Cooperation)GWCL Ghana Water Company LimitedIGF Internally Generated FundsIWRM Integrated Water Resources ManagementJMP Joint Monitoring ProgrammeKVIP Kumasi Ventilated Improved Pit latrineLMB Limited Mechanized BoreholeMDGs Millennium Development GoalsM&E Monitoring & EvaluationMEL Monitoring, Evaluation and LearningMLGRD Ministry of Local Government and Rural DevelopmentMMDA Metropolitan, Municipal and District AssemblyMSWR Ministry of Sanitation and Water ResourcesNDPC National Development Planning CommissionNADeF Newmont Ahafo Development Foundation(I)NGO (International) Non-Governmental OrganisationNLLAP National Level Learning Alliance PlatformOpEx Operations and Minor Maintenance ExpenditurePF Pour Flush toiletPPP Public Private PartnershipRCC Regional Coordinating CouncilRLLAP Regional Level Learning Alliance PlatformSDGs Sustainable Development GoalsUDDT Urine-Diverting Dry ToiletUNICEF United Nations Children’s FundWASH Water, Sanitation and HygieneWHO World Health OrganizationWRC Water Resources CommissionWSMT Water and Sanitation Management Teams
3.6 WASH FINANCING 43 3.6.1 Water 43 3.6.2 Sanitation financing 44 3.6.3 Summing up: The main financing gaps and challenges 443.7 HIGHLIGHTING EQUITY AND INCLUSION ISSUES 453.8 KEY INTRACTABLE CHALLENGES IN THE DISTRICT 453.9 KEY OPPORTUNITIES IN THE DISTRICT 46
4 PROJECTIONS AND STRATEGIC ACTIONS 474.1 POPULATION PROJECTIONS 474.2 MEDIUM (2021) AND LONG TERM (2030) WASH TARGETS 48 4.2.1 Water service targets 48 4.2.2 Sanitation targets 48 4.2.3 Sanitation and hygiene services in schools and health facilities targets 49 4.2.4 WRM 504.3 STRATEGIC DIRECTIONS AND ACTIONS 51 4.3.1 Water services 51 4.3.2 Sanitation 56 4.3.3 Wash in schools and health facilities 57 4.3.4 Water resource management 57 4.3.5 Cross-cutting issues 594.4 RISKS AND MITIGATIONS 60
5 PARTNERSHIPS FOR IMPLEMENTATION 615.1 DISTRICT ACTORS 615.2 REGIONAL AND NATIONAL GOVERNMENT ACTORS 625.3 DEVELOPMENT PARTNERS AND NGOS 63
6 COMMUNICATION, ADVOCACY AND NETWORKS 646.1 OBJECTIVES AND ACTIVITIES 646.2 TARGET AUDIENCES 646.3 KEY MESSAGES AND THEMES 656.4 CHANNELS OF COMMUNICATION 65
7 MONITORING, EVALUATION AND LEARNING 667.1 MONITORING FRAMEWORK 667.2 REPORTING 697.3 EVALUATION 697.4 LEARNING, SHARING AND ADAPTIVE CAPACITY 69
8 COSTS OF THE MASTER PLAN 708.1 METHODOLOGY 708.2 COSTING OF WATER SERVICES 708.3 COSTING OF SANITATION SERVICES 72 8.3.1 Total costs of achieving full coverage 74
REFERENCE LIST 76
ANNEXES 77
8 Water, Sanitation and Hygiene (WASH) Masterplan Water, Sanitation and Hygiene (WASH) Masterplan 9
The Asutifi North District Assembly over the years has made modest gains in water and sanitation delivery. However, due to inadequate funding, the Assembly still faces a huge challenge in achieving the perceived health benefits from quality water supply, sanitation and hygiene services. The poor and the disadvantaged communities are the most affected, with children and women being worse off.
The current statistics for WASH coverage in the District are gloomy and disturbing. Only 15.6% and 61% of the people in the District have access to basic sanitation and water services respectively.
Pursuant to the Local Governance Act, 2016 (Act 936), the Asutifi North District Assembly is mandated to formulate and execute plans, programmes and strategies for the effective mobilisation of resources necessary for the overall development of its areas of jurisdiction. In fulfilling this mandate, and responding to the challenge of low WASH service provision as well as taking cognizance of relevant national policies and planning framework, this Water, Sanitation and Hygiene (WASH) Master Plan has been developed. The master plan represents the resolve of the Assembly to leverage resources and expertise of strategic partners to achieve a common vision for universal access to WASH services by the year 2030. It will also provide a platform for dialogue among WASH actors, and the standard by which collective progress towards a better future for WASH in the District will be measured.
In preparing the master plan, the District took account of existing WASH challenges in households, schools, health institutions and other public places. Emerging threats to water resource management, and the capacity of the District Assembly to deliver on its Service Authority mandate were also analysed. We made realistic projections for the proportion of households and institutions that should have access to ‘basic’ and ‘safely-managed’ water and sanitation services, and these targets were clearly disaggregated for the rural and urban population in the District. As a District we will provide leadership and own the plan implementation process through targeted capacity building programmes.
A wide range of consultations were carried out with various communities, development partners, regional and national level stakeholders to seek feedback and input to develop the master plan. We duly acknowledge the financial and technical contributions of the following organisations during the preparation of the master plan: Conrad N. Hilton Foundation, IRC, Safe Water Network, World Vision International, Traditional Authorities and relevant Departments and Agencies in the Brong Ahafo Region.
The Assembly is fully committed to working actively with all development partners, both local and international to embark on this 13-year journey to achieve WASH full coverage.
We anticipate your support to achieve this laudable objective.
Hon. Anthony MensahDistrict Chief Executive Asutifi North District Assembly
March, 2018
PREFACE
The Asutifi North District Assembly wishes to express its profound gratitude to all individuals, development partners and institutions who contributed in diverse ways to the development of this master plan.
We acknowledge the financial support of the Conrad N. Hilton Foundation towards the preparation of this document. We recognise and appreciate IRC for its support to the Assembly, and for its leadership role in coalescing efforts of other Conrad N. Hilton Foundation grantee partners in the preparation of the plan. The technical inputs of IRC staff and associates in the formulation of the plan is highly appreciated.
The involvement and contributions made by the other Conrad N. Hilton Foundation’s grantees and development partners in Ghana towards the preparation of this document is worth recognising. We are most grateful to World Vision International, Safe Water Network, Necentric Campaigns and Aquaya Institute and the GiZ for their participation and technical inputs in the process.
We also acknowledge the contributions of the Chiefs, Civil Society Organisations, Honourable Assembly Members, Heads of Departments of the Assembly, Newmont Gold Ghana Limited, and the Newmont Ahafo Development Foundation for their participation and interest in the development of the master plan. We are also indebted to the communities for availing themselves for the interviews and visits. Finally, we owe special thanks to the Brong Ahafo Regional Coordinating Council, Community Water and Sanitation Agency, National Development Planning Commission, Office of the Head of Local Government Service, Ghana Statistical Services’ District Analytical Reports, Ministry of Sanitation and Water Resources and the Water Resources Commission for their expert advice and guidance in aligning the master plan with strategic sector goals and guidelines.
ACKNOWLEDGEMENT
10 Water, Sanitation and Hygiene (WASH) Masterplan Water, Sanitation and Hygiene (WASH) Masterplan 11
Every person in the Asutifi North District will have access to sustainable safe water, sanitation and hygiene services in a conducive environment where water resources are sustainably managed.
BACKGROUND This master plan contains the broad vision, programmes and strategies of the Asutifi North District and its key development partners for the implementation of a 13-year initiative called the Asutifi North District Ahonidie Mpontuo (ANAM). This is an initiative which seeks to promote universal access to safe water, basic sanitation and hygiene services to about 84,423 people by the year 2030. The master plan is informed by guidelines of the National Development Planning Commission of Ghana, and framed within targets of the United Nations’ Sustainable Development Goal 6.
The master plan provides a framework for coordinating and aligning efforts of all actors towards achieving the stated goal and vision for WASH in the District. The process of developing the plan was participatory. It involved stakeholders at local, regional and national levels. The National Development Planning Commission, IRC, Safe Water Network, World Vision International, Community Water and Sanitation Agency, chiefs, and the Asutifi North District Assembly played various roles in preparing the document. The plan preparation process was completed within a year (January to December 2017).
PROFILE OF THE ASUTIFI NORTH DISTRICT Created under L.I. 2093 of 2012, the Asutifi North District is located in the southwestern part of the Brong Ahafo Region, with Kenyasi as its capital. It has an estimated population of 62,817 in 2017, with 68% of the population residing in rural areas. The District has a total land surface area of 936 square kilometers. There are over 149 settlements in the District, with major towns being Kenyasi No. 1, Kenyasi No. 2, Ntotroso, Wamahinso, Gyedu and Gambia No.2. There is a growing urban population in the District with increasing demand for access to high levels of WASH services. The District’s economy is predominantly agrarian with 58% of the population depending on it for their livelihoods.
CHALLENGES: ANALYSIS OF WASH AND WATER RESOURCE MANAGEMENT ISSUESWater: The main challenges related to water service provision in the District are summarised as follows: • Lack of improved (communal) water services for 58% of the District’s rural population;• Low levels of “safely-managed” water supply: only 11% of urban population and 3.6% of total District population
have household connections;• Intermittent supply of water in towns and low quantity of water use. Quantity of water used in Kenyasi for
example is 8 lpcd, and 19.8 lpcd in Ntotroso;• 36% of handpumps break down more than 18 days per year.
Sanitation: The main challenges related to sanitation service provision in the District are as follows:• Low coverage of basic sanitation: only 15.6% of the population use improved household latrines;• About 50% of the population use public latrines; and 77% (55 out of 71) of those public latrines are in rural areas;• However, 60% (33 out of 55) of public latrines in rural areas have unimproved sanitation facilities;• Lack of facilities for collecting, transporting, treating and disposing of liquid waste;• Lack of well-managed dumping sites for solid waste, especially in the rural areas; • Lack of facilities for grey water disposal.
WASH in Schools and Health Facilities: More than half of the schools and almost half of the health facilities in the District have dirty latrines. Handwashing facilities are also lacking in some health facilities and in most schools.
Water Resource Management: Asutifi North is part of two transboundary river basins: the Bia river basin and the Tano river basin. The Tano Basin Board (TBB) was inaugurated in 2012 with the responsibility for coordinating activities and initiating interventions for the ecological health of the Basin. At the moment, the linkage between the Board and WASH in the District is not very strong. Pollution of water resources is considered one of the greatest challenges for WASH in the District.
Capacity of District and Service Providers: The District lacks capacity in specific areas like hydrological analysis, protection of water sources and water quality monitoring. The District’s Medium-Term Development Plan and the District Water and Sanitation Plan do not routinely include activities and budget for rehabilitation and major repairs of WASH facilities, partly because effective asset management is not being practised yet. The mechanisms for ensuring that monitoring data are kept up-to-date and are being used to inform corrective actions, planning and regulation are lacking. There are currently no platforms for sharing lessons, and undertaking joint reflection in the District.
At the service provider (community) level, 56% of handpumps are being managed by Water and Sanitation Management Teams while 17% do not have a management structure. The remaining handpumps are mainly managed by private persons, elders or unit committees. Most of the existing WSMTs are, however, found to be poorly constituted, and are performing poorly on indicators such as governance, operation and especially financial management. School and health management committees are found to have limited knowledge on WASH facility management.
WASH Financing: Lack of financing is regarded as one of the key challenges related to WASH service provision. There is little clarity in the District on the actual cost of capital investment required for attaining full coverage, as well as on the ongoing annual costs needed for sustaining WASH services. Data and information on current levels of actual expenditure are not readily available. This makes it difficult to give an accurate analysis of the current challenges and gaps related to WASH financing. The Life-Cycle Cost Approach (LCCA) provides useful frameworks, tools and methodologies for providing better insight into this in the future.
Equity and Inclusion: Concerning water services, the unserved are mainly found in the poorer and rural areas of the District. These rural areas also mainly have unimproved public latrines. Good solid waste management practices such as house-to-house collection are limited to some urban areas. Most of the WSMTs in the District are not gender-balanced, with less than 30% of members being women.
EXECUTIVE SUMMARY
12 Water, Sanitation and Hygiene (WASH) Masterplan Water, Sanitation and Hygiene (WASH) Masterplan 13
PROJECTIONS AND STRATEGIC ACTIONS The District’s rural and urban populations are separately projected on an annual basis from 2017 to 2030, to determine the coverage and gaps in access to WASH services over the period. By the end of 2030, the proportion of the urban households with access to safely managed water is expected to increase from 11% (2017) to 50% by 2030. The remaining 50% of urban households will have access to basic water services within a 30-minute round trip. In rural areas, the 2030 target is that 20% of rural households have safely managed water. The remaining 80% will have access to basic water services.
The target for sanitation is that, by 2030, all urban households will make use of safely managed household latrines, with either safe onsite or offsite treatments. For rural sanitation, the target is to provide access to at least basic sanitation for all households by 2030.
All schools and health institutions in the District will have basic access to both sanitation and water services by 2030, and these facilities (both institutional and communal) will be sustainably managed by well-trained staff.
The target for Water Resource Management is that by 2030, water resources are managed sustainably to guarantee water availability of acceptable quality for commercial, industrial and domestic uses. The plan will work towards ensuring that there is no pollution of surface and ground water, no illegal mining activities, reclamation of degraded lands, and no pollution of surface and ground water resources from agrochemicals.
There are strategic actions for responding to the challenges identified, and for meeting the medium to long-term targets of full WASH coverage in the District. Options will be explored for the provision of water facilities for the 49 currently unserved communities. In under-served communities, additional facilities will be provided, and services improved in served communities to meet set targets. Steps will be taken to ensure the sustainability of WASH facilities through the establishment of Water Sanitation Management Teams; enhancing capacity of area mechanics; control over the quality of construction activities; and the payment of WASH facility user fees at community level. A combination of strategies, including the use of Community Led Total Sanitation, training of local artisans, enforcement of local by-laws, and operationalisation of liquid waste management facilities will be adopted to improve access to sanitation.
PARTNERSHIPS FOR IMPLEMENTATION The District will utilise its internal coordinating arrangements – the various decentralised departments and the General Assembly - to manage the implementation of the WASH master plan. Partnerships will also be forged with identifiable district level actors in the WASH sector such as Civil Society Organisations; Traditional Authorities; Private Sector; Newmont Gold Ghana Limited; and Newmont Ahafo Development Foundation. Apart from these, the District will develop mechanisms for engaging external partners such as ministries, departments and agencies at the regional and national levels; and development partners, including, IRC, Safe Water Network, World Vision International, Netcentric and the Aquaya Institute, to support the implementation of the plan.
COMMUNICATION, ADVOCACY AND NETWORK In the course of planning and implementation of the district-based initiative, a stakeholder-focused network will be created using both existing and new platforms to support WASH and allied actions, advocacy and engagement to influence behaviour and attitudinal change. Communication messages will be couched around ‘Equity and inclusion in WASH delivery’; ‘Payment of tariff for WASH services’; ‘Funding and prioritisation of WASH’; ‘Business opportunities in WASH’; and ‘Financial accountability of duty bearers and right holders’. The main communication tools will be face-to-face interactions, hosting of websites, the use of social media, radio, video and television (TV), newspapers, community durbar, Town Hall meetings, among others. These will be deployed on a case-by-case basis, and in a manner that will ensure they produce the desired outcomes.
MONITORING AND EVALUATIONA monitoring, evaluation and learning (MEL) framework has been developed to provide comprehensive information on the reporting mechanisms needed by stakeholders to monitor the performance of the WASH delivery process. The framework will list key performance indicators, units of measurement, baseline values, cumulative targets, and output levels, identify areas requiring attention, and assess the relative impact of the different strategic objectives to inform the public on overall progress and improvements in WASH services. Documentation and sharing of lessons, best practices and new insights will be an integral part of the implementation process of the plan.
COSTS OF THE MASTER PLAN The costing approach considers the existing and projected population, technologies needed for the full WASH service delivery and the unit costs for providing sustainable WASH services. The plan anticipates a progressive annual increase in WASH coverage, from 2017 to 2030. The combined costs of new investments, rehabilitation and expansion as well as direct support for water service by the year 2030 is estimated at US$ 11,089,951. For sanitation, the cost is estimated at US$ 59,908,471.
FUNDS FOR IMPLEMENTATION OF THE MASTER PLANFunds for the implementation of the master plan will come from three major sources. The District Assembly will make funds available through the District Assemblies Common Fund, District Development Fund, royalties and other forms of internally generated funds. The partners involved in the implementation of the initiative will also provide complementary financial resources, and various forms of technical support. User fees will be generated at community level for use of the WASH facilities. This will finance routine operational costs.

14 Water, Sanitation and Hygiene (WASH) Masterplan Water, Sanitation and Hygiene (WASH) Masterplan 15
1 INTRODUCTION
1.1 OBJECTIVES OF THE WATER, SANITATION AND HYGIENE MASTER PLANThe Asutifi North District through the WASH master plan, will advance a collective stakeholder vision that “Every person in Asutifi North District, approximately 84,423 in 2030 will have access to sustainable safe water, sanitation and hygiene services in a conducive environment where water resources are sustainably managed”
This master plan provides a framework for interventions in the WASH sector of the District covering a period of 13 years (2017-2030). Additionally, the plan will enable the District to better coordinate and ensure development partners align their efforts towards achieving the collective WASH of the District. It will also provide the basis for tracking progress towards the realisation of the WASH vision of the District.
1.2 SCOPEThe WASH Master Plan focuses on the following thematic areas:• Water supply and water quality - support the attainment of universal access to sustainable basic water services by
everyone in Asutifi North District by 2030. It defines the service delivery models, financing mechanisms for cost recovery and strategic actions for achieving the objectives and set targets.
• Sanitation and hygiene – aims to increase access to improved and reliable environmental sanitation services by 2030. It defines the service delivery models, financing mechanisms and cost recovery and strategic actions for achieving the objectives and set targets.
• Sanitation and hygiene in schools, health facilities, and markets – would support the attainment of basic hygiene services on site in all educational and health institutions as well as markets.
• Integrated water resources management - increase the pace of implementation of water and resource management strategies in the District to ensure sustainable water quality.
• Drainage – support the improvement in land use planning and minimize flooding by 2030.• District capacity development – support orientation, capacity building and technical assistance to streamline roles
and strengthen capacities of the District for effective plan implementation and monitoring and evaluation.• Communication, advocacy and networks – focuses on communication, advocacy, and network strategy for the
plan including key messages, audiences, communication channels and key strategic actions.• Partnerships and implementation arrangements - determines the role of various actors and the coordination
mechanisms for the plan implementation.• Monitoring, evaluation and learning - defines the monitoring, evaluation and learning framework for the plan
implementation and accountability.• Equity and inclusion - describes the disparities and inequalities in WASH service delivery and how the effect on the
vulnerable population will be mitigated.
1.3 MASTER PLANNING PROCESSThe master plan development process took a year to complete starting from January to December 2017. The process was participatory and involved multi-stakeholders at local, regional and national level. The planning process combined a response to the long-term challenges of the District WASH sector with medium- and short-term interventions. The participatory process adopted gave space to all key stakeholders at the local level and strategic partners at the national level and ensured alignment with national planning policies and processes.
The process followed the following steps:
1.3.1 CONTEXT AND GAP ANALYSESDetailed context and gap analyses were done to take stock of the existing WASH situation in the District and identify the needs and requirements for full WASH coverage. The process focused on key areas of WASH delivery including: district profile, policy environment, capacity for WASH delivery, operational and service delivery issues and key opportunities, success factors and challenges. In addition, a stakeholder analysis was carried out to map all the key stakeholders in the District and outside, and opportunities to build partnerships to leverage support for the initiative.
1.3.2 INCEPTION WORKSHOPAn inception workshop was held on March 16, 2017, which drew stakeholders from government, private sector, service providers, private operators, development partners, service users, traditional authorities among others from the WASH sector in and outside the District. IRC, Safe Water Network, Asutifi North District Assembly and partners, with the support of the Conrad N. Hilton Foundation, launched the District Based Full WASH Coverage start-up initiative in Kenyasi. Key stakeholders at the workshop welcomed the initiative and pledged to cooperate with all the partners and participate actively in the development of the master plan and its implementation.
1.3.3 SERVICE MONITORINGThe water and sanitation service monitoring assessed the status of water service provision in May 2017. Data was collected from all handpumps, solar pumps, limited mechanized boreholes and small-town piped schemes and sanitation facilities. In addition, data was collected from all management units involved in the operation and maintenance of these water supply facilities. Data was collected by district-based staff using CWSA’s data collection forms, available through mobile phone technology (Akvo FLOW). The data was used to assess the functionality, level of service and performance of service providers as per CWSA’s monitoring framework.
1.3.4 ASSET MANAGEMENT PLANNINGStaff from key departments including Planning, Finance, Internal Audit, Works, and Environmental Health of the Asutifi North District were trained and supported to prepare WASH asset registers, and plans to inform planning, budgeting and investments using the service monitoring data. This process informed the life-cycle costing of existing and future water and sanitation service delivery. The asset plans define the District WASH asset, present conditions and value, projected value adjusted by inflation, wear and tear, and expected asset maintenance, renewal and replacement costs.
1.3.5 STRATEGIC PLANNING WORKSHOPThe strategic planning workshops established the needs, vision, defined outcomes, strategies, implementation arrangements and funding mechanisms towards achieving full WASH coverage. The forum provided a common platform for discussions on the challenges and opportunities of achieving full coverage of WASH in the District by 2030. The discussions were informed by the service monitoring data and context analyses reports that formed the basis for the master plan. Over 70 participants attended the workshops and were drawn from government; District Assembly and departments, Regional Coordinating Council, Ministry of Sanitation and Water Resources, CWSA, WRC, Ministry of Planning, National Development Planning Commission, traditional authorities. private sector actors, development partners, CSOs and NGOs.
16 Water, Sanitation and Hygiene (WASH) Masterplan Water, Sanitation and Hygiene (WASH) Masterplan 17
1.4 NATIONAL OVERVIEW OF THE WASH AND WRM SECTORThe Government of Ghana has an ambition to make water, sanitation and hygiene services universally accessible for all people resident in Ghana, and to manage water resources sustainably for multiple purposes.
Ghana’s population currently stands at approximately 27 million, and is experiencing rapid urbanisation with the urban population reaching 50% for the first time since 2009 and rising to over 54% as of 2016. The population is estimated to reach 35 million by 2025, with a projected 63% of that number living in urban areas. One of the implications of these population statistics is a rapid rise in the demand for water and sanitation services, particularly in urban areas.1
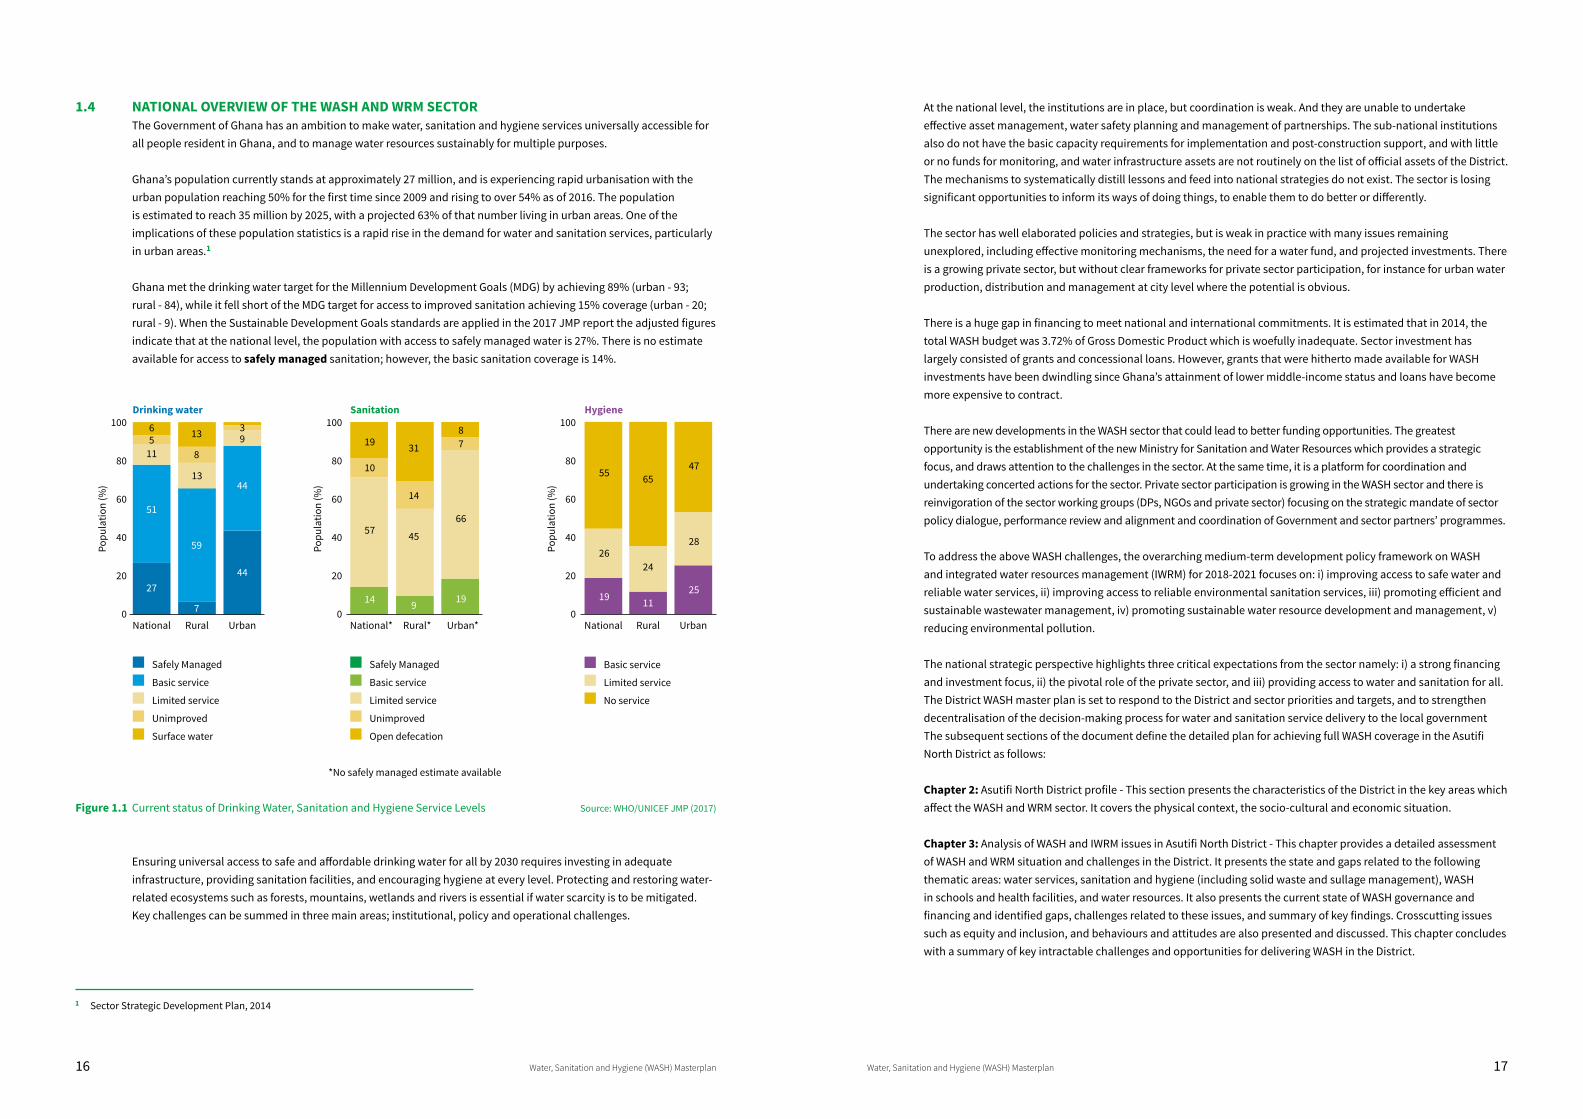
Ghana met the drinking water target for the Millennium Development Goals (MDG) by achieving 89% (urban - 93; rural - 84), while it fell short of the MDG target for access to improved sanitation achieving 15% coverage (urban - 20; rural - 9). When the Sustainable Development Goals standards are applied in the 2017 JMP report the adjusted figures indicate that at the national level, the population with access to safely managed water is 27%. There is no estimate available for access to safely managed sanitation; however, the basic sanitation coverage is 14%.
Figure 1.1 Current status of Drinking Water, Sanitation and Hygiene Service Levels Source: WHO/UNICEF JMP (2017)
Ensuring universal access to safe and affordable drinking water for all by 2030 requires investing in adequate infrastructure, providing sanitation facilities, and encouraging hygiene at every level. Protecting and restoring water-related ecosystems such as forests, mountains, wetlands and rivers is essential if water scarcity is to be mitigated. Key challenges can be summed in three main areas; institutional, policy and operational challenges.
At the national level, the institutions are in place, but coordination is weak. And they are unable to undertake effective asset management, water safety planning and management of partnerships. The sub-national institutions also do not have the basic capacity requirements for implementation and post-construction support, and with little or no funds for monitoring, and water infrastructure assets are not routinely on the list of official assets of the District. The mechanisms to systematically distill lessons and feed into national strategies do not exist. The sector is losing significant opportunities to inform its ways of doing things, to enable them to do better or differently.
The sector has well elaborated policies and strategies, but is weak in practice with many issues remaining unexplored, including effective monitoring mechanisms, the need for a water fund, and projected investments. There is a growing private sector, but without clear frameworks for private sector participation, for instance for urban water production, distribution and management at city level where the potential is obvious.
There is a huge gap in financing to meet national and international commitments. It is estimated that in 2014, the total WASH budget was 3.72% of Gross Domestic Product which is woefully inadequate. Sector investment has largely consisted of grants and concessional loans. However, grants that were hitherto made available for WASH investments have been dwindling since Ghana’s attainment of lower middle-income status and loans have become more expensive to contract.
There are new developments in the WASH sector that could lead to better funding opportunities. The greatest opportunity is the establishment of the new Ministry for Sanitation and Water Resources which provides a strategic focus, and draws attention to the challenges in the sector. At the same time, it is a platform for coordination and undertaking concerted actions for the sector. Private sector participation is growing in the WASH sector and there is reinvigoration of the sector working groups (DPs, NGOs and private sector) focusing on the strategic mandate of sector policy dialogue, performance review and alignment and coordination of Government and sector partners’ programmes.
To address the above WASH challenges, the overarching medium-term development policy framework on WASH and integrated water resources management (IWRM) for 2018-2021 focuses on: i) improving access to safe water and reliable water services, ii) improving access to reliable environmental sanitation services, iii) promoting efficient and sustainable wastewater management, iv) promoting sustainable water resource development and management, v) reducing environmental pollution.
The national strategic perspective highlights three critical expectations from the sector namely: i) a strong financing and investment focus, ii) the pivotal role of the private sector, and iii) providing access to water and sanitation for all.The District WASH master plan is set to respond to the District and sector priorities and targets, and to strengthen decentralisation of the decision-making process for water and sanitation service delivery to the local governmentThe subsequent sections of the document define the detailed plan for achieving full WASH coverage in the Asutifi North District as follows:
Chapter 2: Asutifi North District profile - This section presents the characteristics of the District in the key areas which affect the WASH and WRM sector. It covers the physical context, the socio-cultural and economic situation.
Chapter 3: Analysis of WASH and IWRM issues in Asutifi North District - This chapter provides a detailed assessment of WASH and WRM situation and challenges in the District. It presents the state and gaps related to the following thematic areas: water services, sanitation and hygiene (including solid waste and sullage management), WASH in schools and health facilities, and water resources. It also presents the current state of WASH governance and financing and identified gaps, challenges related to these issues, and summary of key findings. Crosscutting issues such as equity and inclusion, and behaviours and attitudes are also presented and discussed. This chapter concludes with a summary of key intractable challenges and opportunities for delivering WASH in the District.
1 Sector Strategic Development Plan, 2014
100
80
60
40
20
0
Popu
latio
n (%
)
Drinking water
National Rural Urban
Safely Managed
Basic service
Limited service
Unimproved
Surface water
27
51
1156 13
8
13
59
7
39
44
44
National* Rural* Urban*
100
80
60
40
20
0
Popu
latio
n (%
)
Safely Managed
Basic service
Limited service
Unimproved
Open defecation
Sanitation
*No safely managed estimate available
14
57
10
19
9
45
31
14
19
66
87
100
80
60
40
20
0
Popu
latio
n (%
)
National Rural Urban
Basic service
Limited service
No service
Hygiene
19
26
55
11
24
65
25
28
47
18 Water, Sanitation and Hygiene (WASH) Masterplan Water, Sanitation and Hygiene (WASH) Masterplan 19
Chapter 4: Projections and strategic actions- This chapter presents the population projections for the next 13 years and implications for addressing the WASH needs of the District. It deduces the targets for WASH from the current baseline to the medium (2021) and long term (2030) as per the following thematic areas: water; sanitation, WASH in institutions, and IWRM. The strategic actions to meet the targets as well as the risk and mitigation measures are also presented.
Chapter 5: Partnerships for implementation - This chapter describes the roles of the various actors for the delivery of the WASH master plan.
Chapter 6: Communication, advocacy and networks - This section sets out a communication, advocacy and network strategy for the District WASH master plan.
Chapter 7: Monitoring, Evaluation, and Learning - This chapter presents the framework for the monitoring, evaluation, and learning of the plan.
Chapter 8: Costs of the masterplan – This section looks at the cost estimates for covering the investments in infrastructure for providing full WASH coverage.
2 DISTRICT PROFILE
This section presents the characteristics of the District in the key areas that affect the WASH sector and covers the physical context, the social-cultural and economic situation.
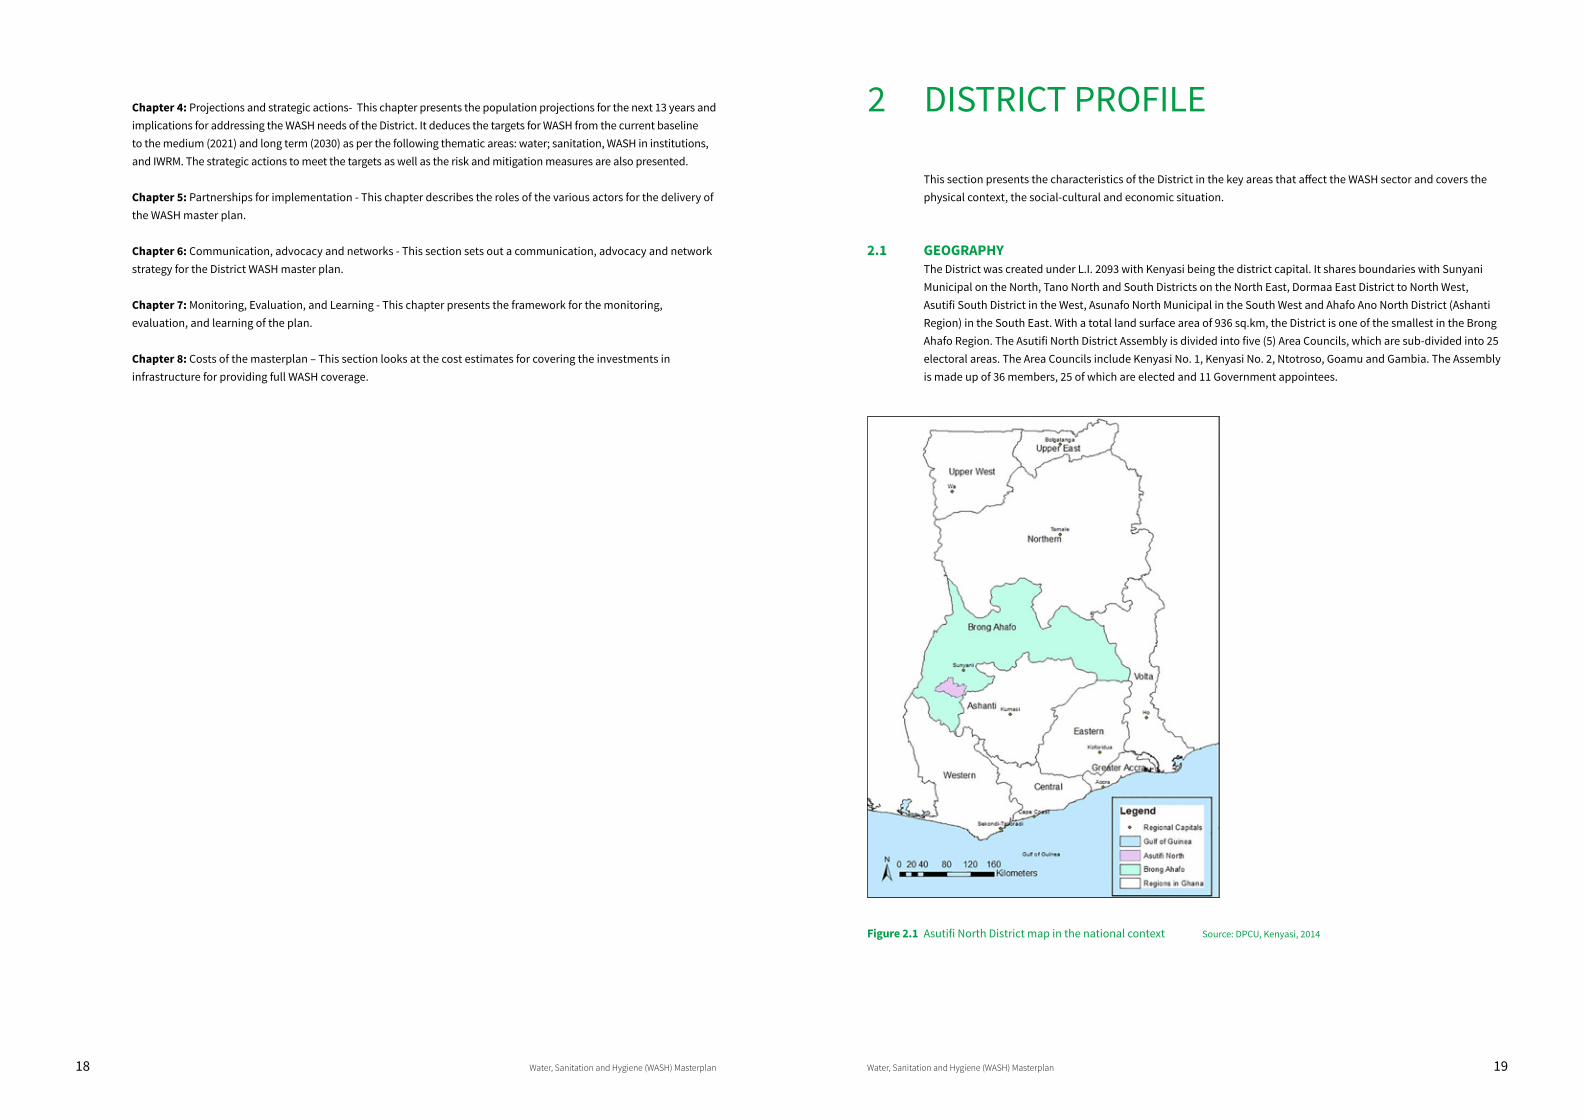
2.1 GEOGRAPHY The District was created under L.I. 2093 with Kenyasi being the district capital. It shares boundaries with Sunyani Municipal on the North, Tano North and South Districts on the North East, Dormaa East District to North West, Asutifi South District in the West, Asunafo North Municipal in the South West and Ahafo Ano North District (Ashanti Region) in the South East. With a total land surface area of 936 sq.km, the District is one of the smallest in the Brong Ahafo Region. The Asutifi North District Assembly is divided into five (5) Area Councils, which are sub-divided into 25 electoral areas. The Area Councils include Kenyasi No. 1, Kenyasi No. 2, Ntotroso, Goamu and Gambia. The Assembly is made up of 36 members, 25 of which are elected and 11 Government appointees.
Figure 2.1 Asutifi North District map in the national context Source: DPCU, Kenyasi, 2014
20 Water, Sanitation and Hygiene (WASH) Masterplan Water, Sanitation and Hygiene (WASH) Masterplan 21
The location of the District in Brong Ahafo Region offers it the opportunity to interact or co-operate with two other regions of Ghana, namely Ashanti and Western, and even exchange goods and services with the neighbouring Ivory Coast. The location of the District in the wet equatorial climatic region ensures rainfall throughout the year, well distributed with some rainfall in every month. The rain feeds the watershed including key rivers in Ghana such as Tano and Offin that flow through the District. These rivers and many other streams provide water for water provision systems and sources.
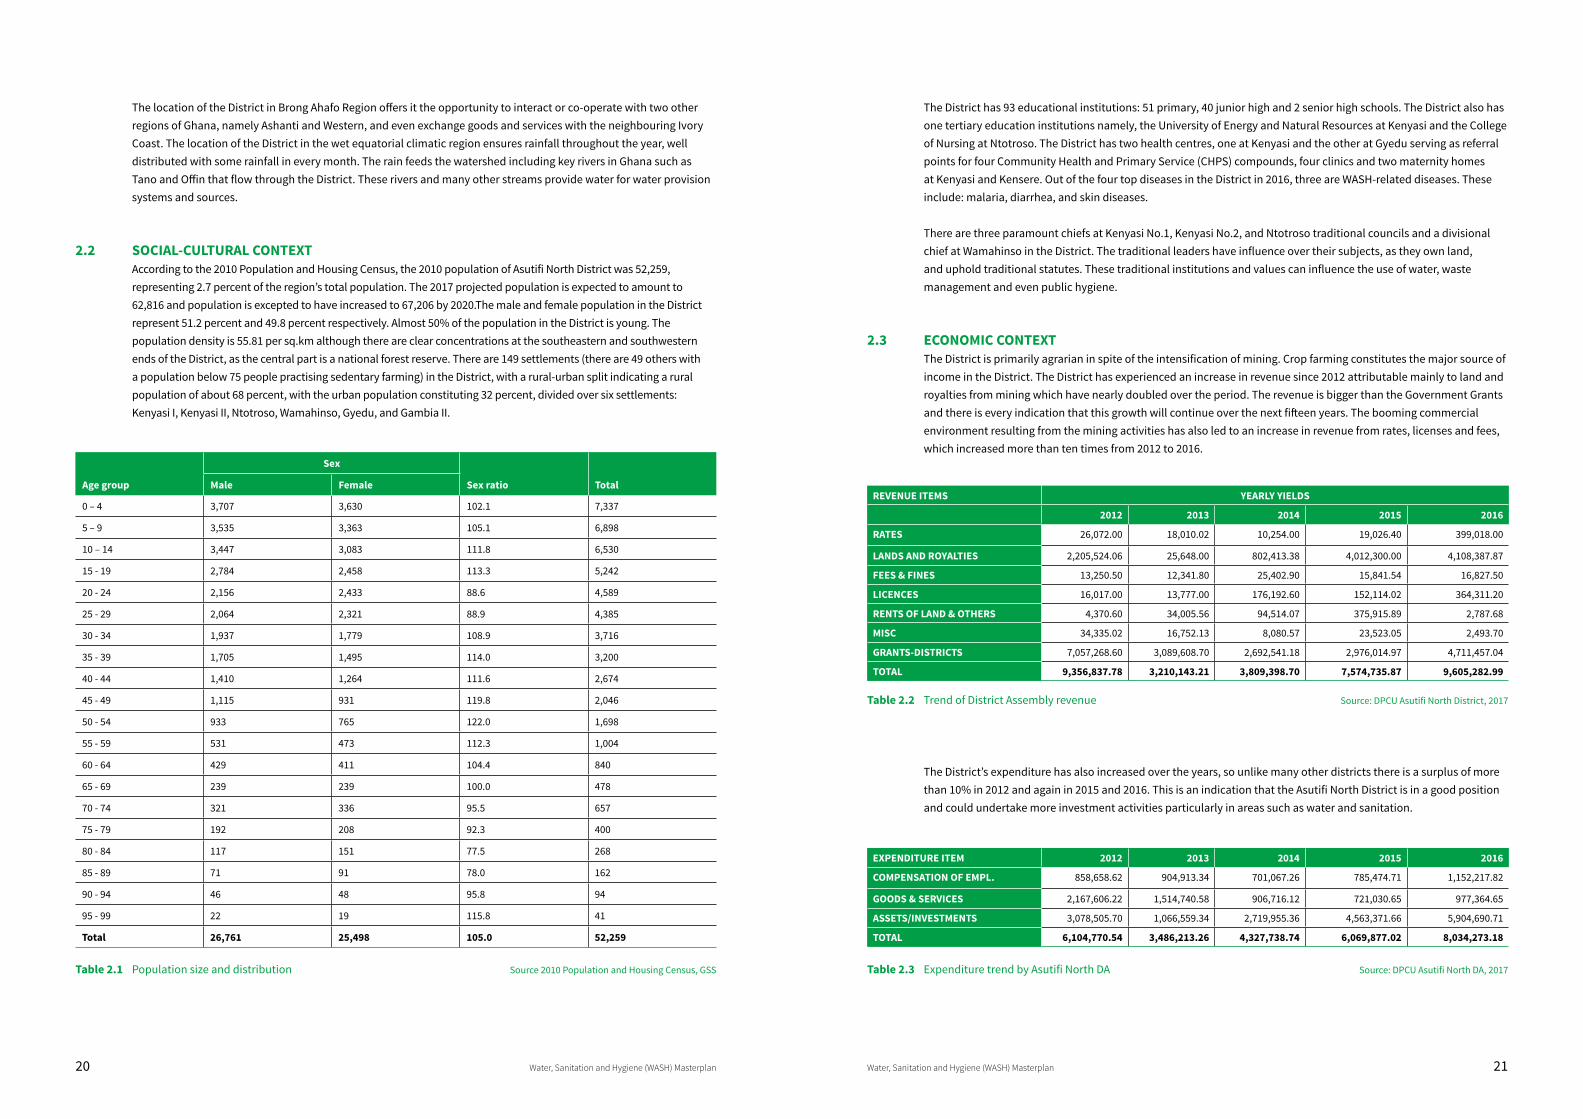
2.2 SOCIAL-CULTURAL CONTEXT According to the 2010 Population and Housing Census, the 2010 population of Asutifi North District was 52,259, representing 2.7 percent of the region’s total population. The 2017 projected population is expected to amount to 62,816 and population is excepted to have increased to 67,206 by 2020.The male and female population in the District represent 51.2 percent and 49.8 percent respectively. Almost 50% of the population in the District is young. The population density is 55.81 per sq.km although there are clear concentrations at the southeastern and southwestern ends of the District, as the central part is a national forest reserve. There are 149 settlements (there are 49 others with a population below 75 people practising sedentary farming) in the District, with a rural-urban split indicating a rural population of about 68 percent, with the urban population constituting 32 percent, divided over six settlements: Kenyasi I, Kenyasi II, Ntotroso, Wamahinso, Gyedu, and Gambia II.
Age group
Sex
Sex ratio TotalMale Female
0 – 4 3,707 3,630 102.1 7,337
5 – 9 3,535 3,363 105.1 6,898
10 – 14 3,447 3,083 111.8 6,530
15 - 19 2,784 2,458 113.3 5,242
20 - 24 2,156 2,433 88.6 4,589
25 - 29 2,064 2,321 88.9 4,385
30 - 34 1,937 1,779 108.9 3,716
35 - 39 1,705 1,495 114.0 3,200
40 - 44 1,410 1,264 111.6 2,674
45 - 49 1,115 931 119.8 2,046
50 - 54 933 765 122.0 1,698
55 - 59 531 473 112.3 1,004
60 - 64 429 411 104.4 840
65 - 69 239 239 100.0 478
70 - 74 321 336 95.5 657
75 - 79 192 208 92.3 400
80 - 84 117 151 77.5 268
85 - 89 71 91 78.0 162
90 - 94 46 48 95.8 94
95 - 99 22 19 115.8 41
Total 26,761 25,498 105.0 52,259
Table 2.1 Population size and distribution Source 2010 Population and Housing Census, GSS
The District has 93 educational institutions: 51 primary, 40 junior high and 2 senior high schools. The District also has one tertiary education institutions namely, the University of Energy and Natural Resources at Kenyasi and the College of Nursing at Ntotroso. The District has two health centres, one at Kenyasi and the other at Gyedu serving as referral points for four Community Health and Primary Service (CHPS) compounds, four clinics and two maternity homes at Kenyasi and Kensere. Out of the four top diseases in the District in 2016, three are WASH-related diseases. These include: malaria, diarrhea, and skin diseases.
There are three paramount chiefs at Kenyasi No.1, Kenyasi No.2, and Ntotroso traditional councils and a divisional chief at Wamahinso in the District. The traditional leaders have influence over their subjects, as they own land, and uphold traditional statutes. These traditional institutions and values can influence the use of water, waste management and even public hygiene.
2.3 ECONOMIC CONTEXTThe District is primarily agrarian in spite of the intensification of mining. Crop farming constitutes the major source of income in the District. The District has experienced an increase in revenue since 2012 attributable mainly to land and royalties from mining which have nearly doubled over the period. The revenue is bigger than the Government Grants and there is every indication that this growth will continue over the next fifteen years. The booming commercial environment resulting from the mining activities has also led to an increase in revenue from rates, licenses and fees, which increased more than ten times from 2012 to 2016.
REVENUE ITEMS YEARLY YIELDS
2012 2013 2014 2015 2016
RATES 26,072.00 18,010.02 10,254.00 19,026.40 399,018.00
LANDS AND ROYALTIES 2,205,524.06 25,648.00 802,413.38 4,012,300.00 4,108,387.87
FEES & FINES 13,250.50 12,341.80 25,402.90 15,841.54 16,827.50
LICENCES 16,017.00 13,777.00 176,192.60 152,114.02 364,311.20
RENTS OF LAND & OTHERS 4,370.60 34,005.56 94,514.07 375,915.89 2,787.68
MISC 34,335.02 16,752.13 8,080.57 23,523.05 2,493.70
GRANTS-DISTRICTS 7,057,268.60 3,089,608.70 2,692,541.18 2,976,014.97 4,711,457.04
TOTAL 9,356,837.78 3,210,143.21 3,809,398.70 7,574,735.87 9,605,282.99
Table 2.2 Trend of District Assembly revenue Source: DPCU Asutifi North District, 2017
The District’s expenditure has also increased over the years, so unlike many other districts there is a surplus of more than 10% in 2012 and again in 2015 and 2016. This is an indication that the Asutifi North District is in a good position and could undertake more investment activities particularly in areas such as water and sanitation.
EXPENDITURE ITEM 2012 2013 2014 2015 2016
COMPENSATION OF EMPL. 858,658.62 904,913.34 701,067.26 785,474.71 1,152,217.82
GOODS & SERVICES 2,167,606.22 1,514,740.58 906,716.12 721,030.65 977,364.65
ASSETS/INVESTMENTS 3,078,505.70 1,066,559.34 2,719,955.36 4,563,371.66 5,904,690.71
TOTAL 6,104,770.54 3,486,213.26 4,327,738.74 6,069,877.02 8,034,273.18
Table 2.3 Expenditure trend by Asutifi North DA Source: DPCU Asutifi North DA, 2017
22 Water, Sanitation and Hygiene (WASH) Masterplan Water, Sanitation and Hygiene (WASH) Masterplan 23
3 ANALYSIS OF WASH AND IWRM ISSUES
This chapter provides a detailed assessment of WASH and WRM situation and challenges in the District. It presents the state and gaps related to the following thematic areas: water services, sanitation and hygiene (including solid waste and sullage management), WASH in schools and health facilities, and water resources. It also presents the current state of WASH governance and financing and identified gaps, challenges related to these issues, and summary of key findings. Cross-cutting issues such as equity and inclusion, and behaviours and attitudes are also presented and discussed. This chapter concludes with a summary of key intractable challenges and opportunities for delivering WASH in the District.
3.1 WATER SERVICES This section presents the main water supply infrastructure and service delivery models which can be found in Asutifi North District. It gives an analysis of water service coverage in line with the definitions applied by the Joint Monitoring Programme (JMP) of the World Health Organization and UNICEF for monitoring the SDGs. A summary of identified gaps and challenges is presented at the end of this section.
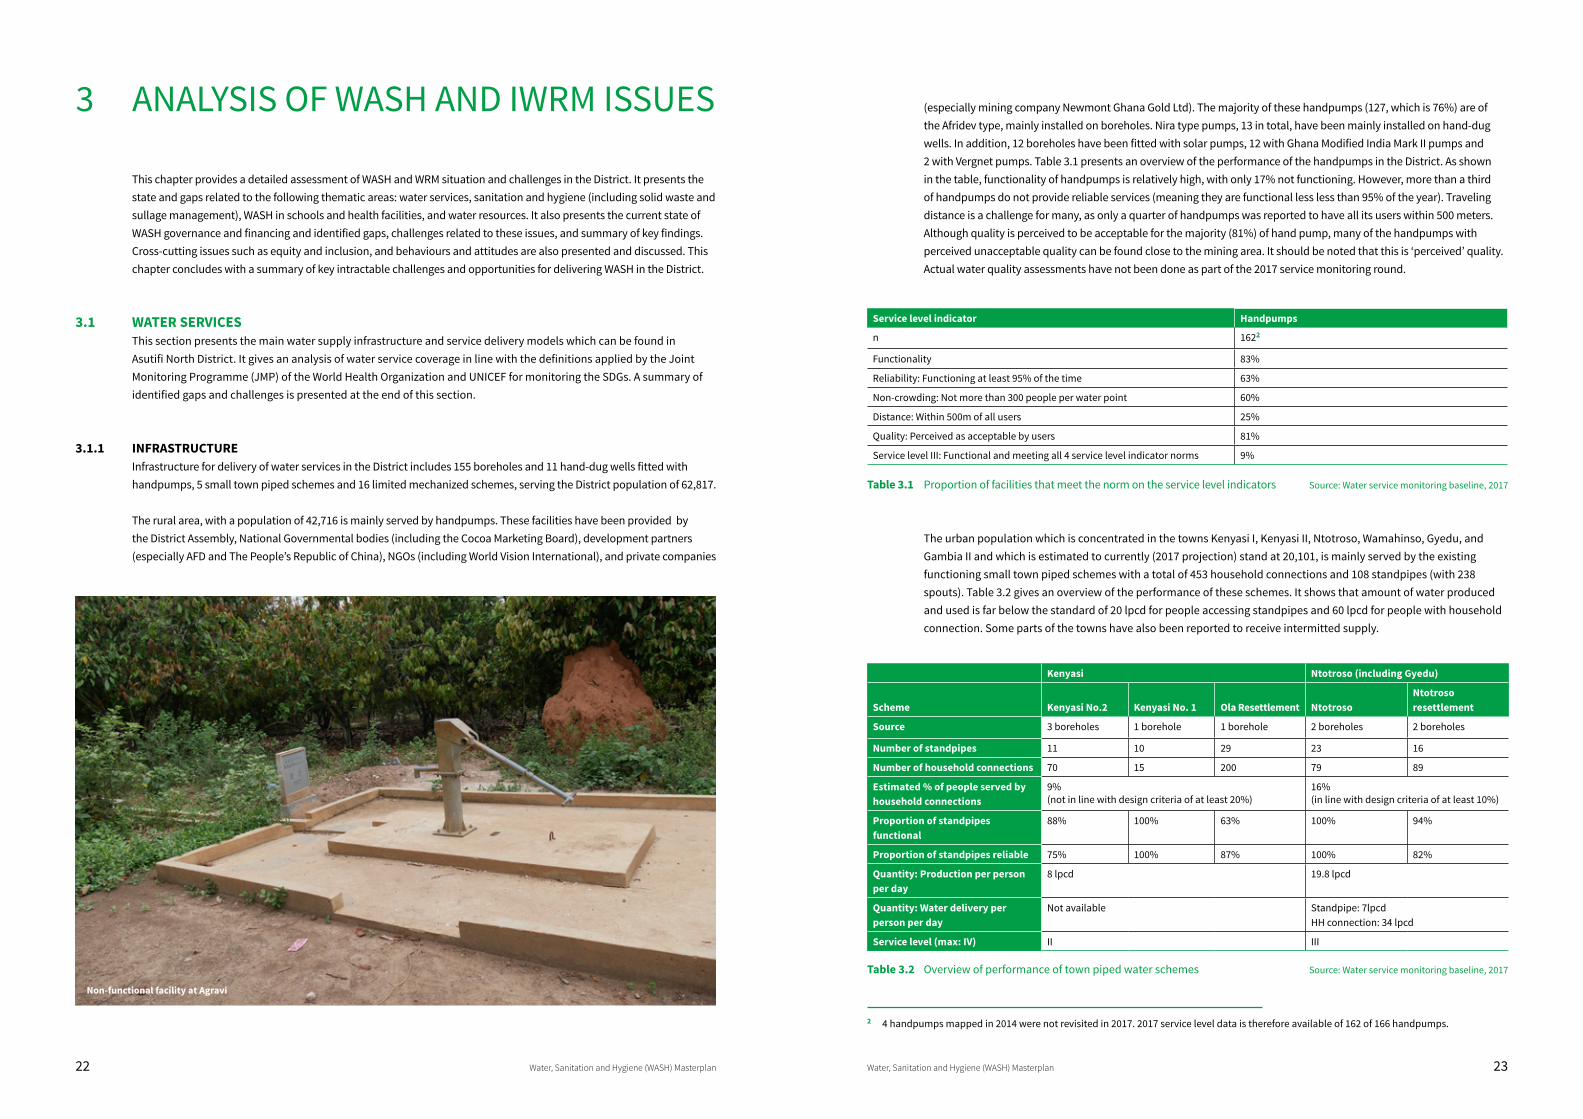
3.1.1 INFRASTRUCTUREInfrastructure for delivery of water services in the District includes 155 boreholes and 11 hand-dug wells fitted with handpumps, 5 small town piped schemes and 16 limited mechanized schemes, serving the District population of 62,817.
The rural area, with a population of 42,716 is mainly served by handpumps. These facilities have been provided by the District Assembly, National Governmental bodies (including the Cocoa Marketing Board), development partners (especially AFD and The People’s Republic of China), NGOs (including World Vision International), and private companies
(especially mining company Newmont Ghana Gold Ltd). The majority of these handpumps (127, which is 76%) are of the Afridev type, mainly installed on boreholes. Nira type pumps, 13 in total, have been mainly installed on hand-dug wells. In addition, 12 boreholes have been fitted with solar pumps, 12 with Ghana Modified India Mark II pumps and 2 with Vergnet pumps. Table 3.1 presents an overview of the performance of the handpumps in the District. As shown in the table, functionality of handpumps is relatively high, with only 17% not functioning. However, more than a third of handpumps do not provide reliable services (meaning they are functional less less than 95% of the year). Traveling distance is a challenge for many, as only a quarter of handpumps was reported to have all its users within 500 meters. Although quality is perceived to be acceptable for the majority (81%) of hand pump, many of the handpumps with perceived unacceptable quality can be found close to the mining area. It should be noted that this is ‘perceived’ quality. Actual water quality assessments have not been done as part of the 2017 service monitoring round.
Service level indicator Handpumps
n 1622
Functionality 83%
Reliability: Functioning at least 95% of the time 63%
Non-crowding: Not more than 300 people per water point 60%
Distance: Within 500m of all users 25%
Quality: Perceived as acceptable by users 81%
Service level III: Functional and meeting all 4 service level indicator norms 9%
Table 3.1 Proportion of facilities that meet the norm on the service level indicators Source: Water service monitoring baseline, 2017
The urban population which is concentrated in the towns Kenyasi I, Kenyasi II, Ntotroso, Wamahinso, Gyedu, and Gambia II and which is estimated to currently (2017 projection) stand at 20,101, is mainly served by the existing functioning small town piped schemes with a total of 453 household connections and 108 standpipes (with 238 spouts). Table 3.2 gives an overview of the performance of these schemes. It shows that amount of water produced and used is far below the standard of 20 lpcd for people accessing standpipes and 60 lpcd for people with household connection. Some parts of the towns have also been reported to receive intermitted supply.
Kenyasi Ntotroso (including Gyedu)
Scheme Kenyasi No.2 Kenyasi No. 1 Ola Resettlement NtotrosoNtotroso resettlement
Source 3 boreholes 1 borehole 1 borehole 2 boreholes 2 boreholes
Number of standpipes 11 10 29 23 16
Number of household connections 70 15 200 79 89
Estimated % of people served by household connections
9%(not in line with design criteria of at least 20%)
16%(in line with design criteria of at least 10%)
Proportion of standpipes functional
88% 100% 63% 100% 94%
Proportion of standpipes reliable 75% 100% 87% 100% 82%
Quantity: Production per person per day
8 lpcd 19.8 lpcd
Quantity: Water delivery per person per day
Not available Standpipe: 7lpcdHH connection: 34 lpcd
Service level (max: IV) II III
Table 3.2 Overview of performance of town piped water schemes Source: Water service monitoring baseline, 2017
2 4 handpumps mapped in 2014 were not revisited in 2017. 2017 service level data is therefore available of 162 of 166 handpumps.
Non-functional facility at Agravi
24 Water, Sanitation and Hygiene (WASH) Masterplan Water, Sanitation and Hygiene (WASH) Masterplan 25
In addition to the handpumps and piped schemes presented above, 16 limited mechanized boreholes (LMB) can be found in the District, mostly located in and around Kenyasi and Wamahinso. These pump water to storage tanks which are connected to one to four public standpipes (total of 33), each with one to four spouts (total of 48). The majority of these schemes have been constructed relatively recently (after 2014). Seven of the LMBs have been implemented by private entrepreneurs and 6 LMB have been implemented by institutions: 2 by schools (Wamahinso and Jaylis schools), 2 by churches, and 1 by the Prison Camp in Kenyasi no 1. All of these were functional at the time of the 2017 monitoring round and 91% was considered to provide reliable services. Water quality was perceived as acceptable for 88% of the LMBs. Accessibility (distance and crowding) was not considered a problem. However, no reliable data was available on quantity of water production and use from these schemes.
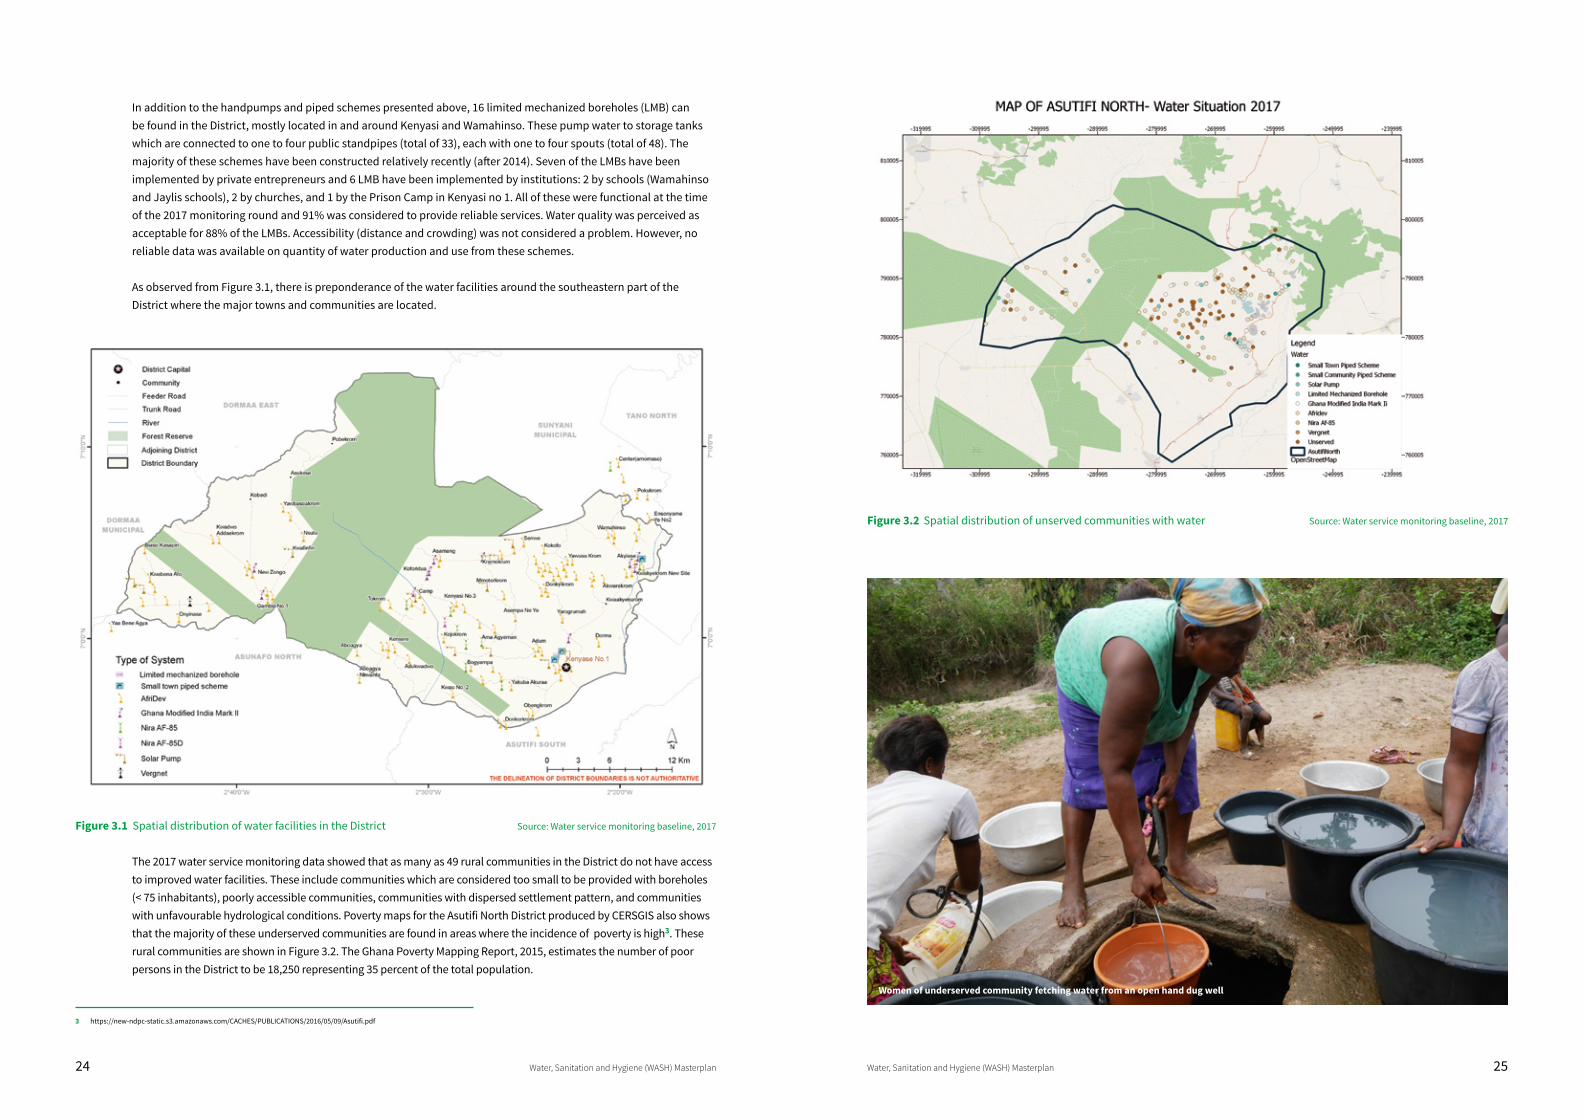
As observed from Figure 3.1, there is preponderance of the water facilities around the southeastern part of the District where the major towns and communities are located.
Figure 3.1 Spatial distribution of water facilities in the District Source: Water service monitoring baseline, 2017
The 2017 water service monitoring data showed that as many as 49 rural communities in the District do not have access to improved water facilities. These include communities which are considered too small to be provided with boreholes (< 75 inhabitants), poorly accessible communities, communities with dispersed settlement pattern, and communities with unfavourable hydrological conditions. Poverty maps for the Asutifi North District produced by CERSGIS also shows that the majority of these underserved communities are found in areas where the incidence of poverty is high3. These rural communities are shown in Figure 3.2. The Ghana Poverty Mapping Report, 2015, estimates the number of poor persons in the District to be 18,250 representing 35 percent of the total population.
Figure 3.2 Spatial distribution of unserved communities with water Source: Water service monitoring baseline, 2017
3 https://new-ndpc-static.s3.amazonaws.com/CACHES/PUBLICATIONS/2016/05/09/Asutifi.pdf
Women of underserved community fetching water from an open hand dug well
26 Water, Sanitation and Hygiene (WASH) Masterplan Water, Sanitation and Hygiene (WASH) Masterplan 27
3.1.2 WATER SERVICE DELIVERY MODELSThe handpumps in the District are supposed to be managed by Water and Sanitation Management Teams (WSMTs), consisting of elected community members responsible for regular management of the handpump. Management of the small town piped schemes is the responsibility of Small Town Water and Sanitation Management Teams. As limited mechanized boreholes are a relatively new technology, there is not yet a clearly defined management model for these kinds of schemes. Seven LMBs have been implemented and are operated by private persons, while 3 others are managed by WSMTs, similar to the small town WSMTs managing small town piped schemes. A small proportion of the population has developed and uses its own household-level water sources (self-supply). These include improved sources, like protected wells, springs and rainwater harvesting systems.
Table 3.3 presents an overview of the main service delivery models which can be found in the District, including the number of facilities under these models and the estimated number of people served. This is based on the maximum number of people potentially served per community, based on its population and the number of water facilities present, assuming a maximum of 300 people served per hand pump and standpipe spout and 5 people per household connection.
Service Delivery Model Number of facilities Estimated proportion of population served under this model
WSMT-managed hand pump 166 27%
Direct WSMT managed small town piped scheme 5 18% (household connections: 4%, standpipes: 14%)
Privately-managed LMB 7 12%
WSMT-managed LMB 4 4%
Self-supply Unknown Unknown (7.6% (3.5% in urban and 9.8% in rural areas) in 2010 census (GSS, 2014))
Table 3.3 Water service delivery models Source: Water service monitoring baseline, 2017
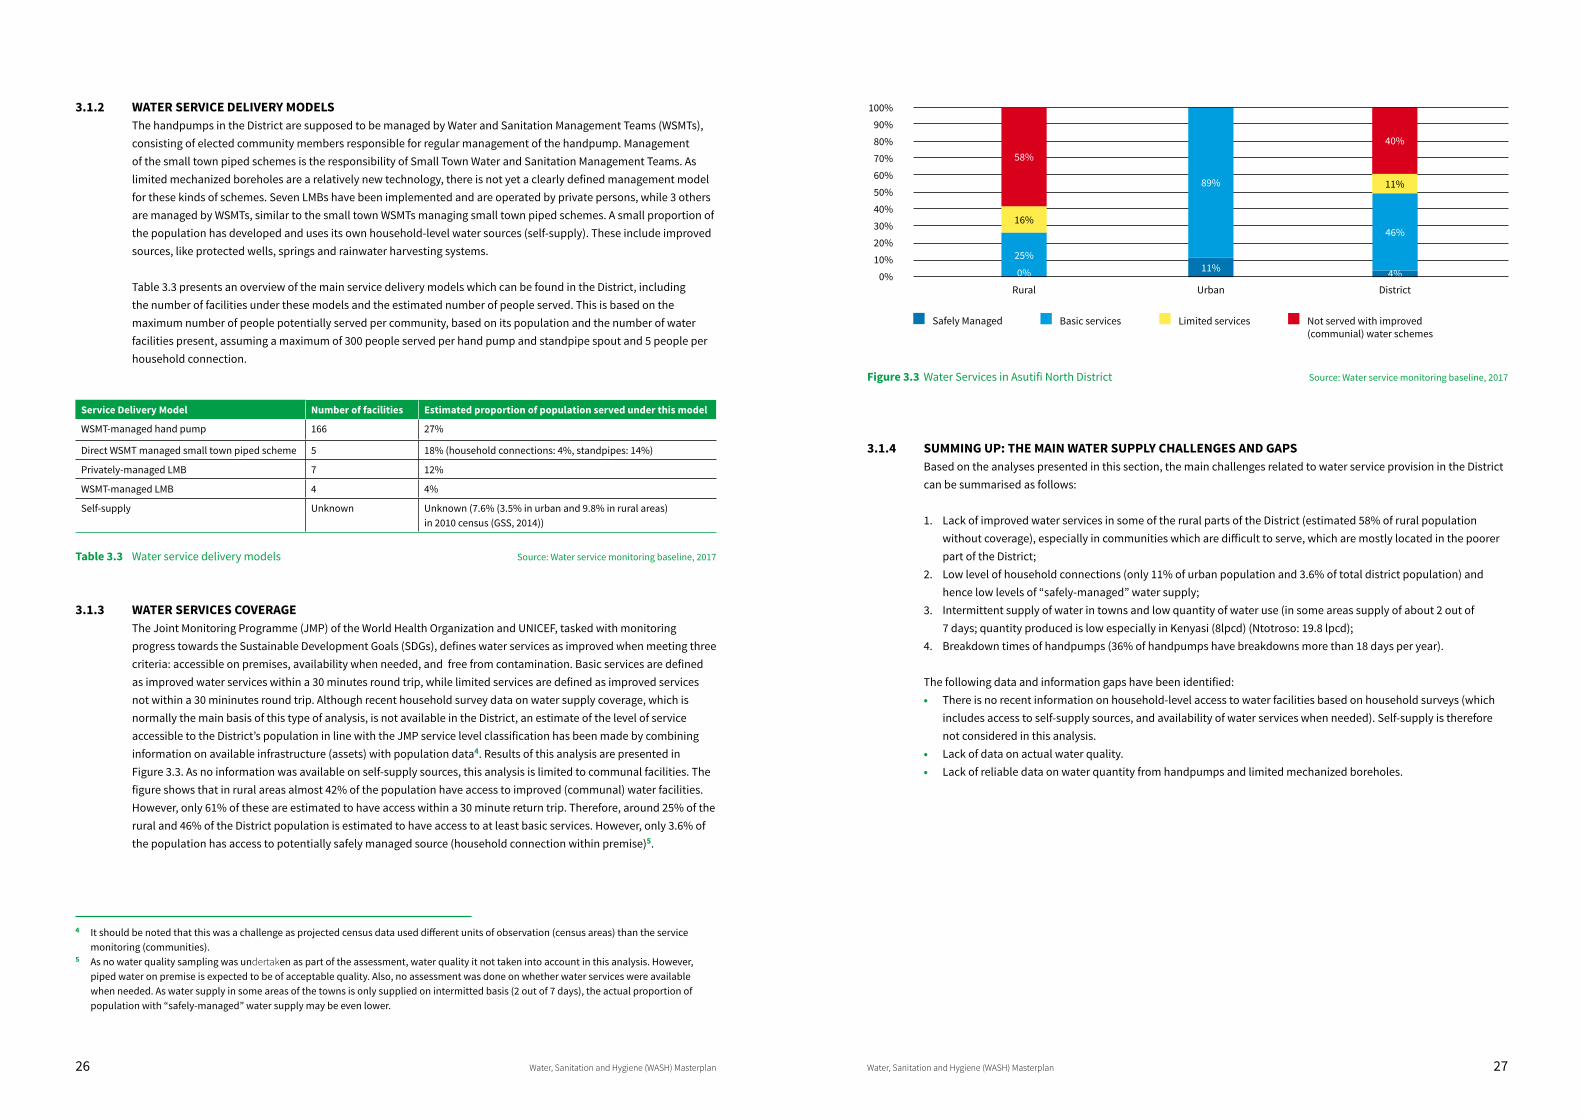
3.1.3 WATER SERVICES COVERAGEThe Joint Monitoring Programme (JMP) of the World Health Organization and UNICEF, tasked with monitoring progress towards the Sustainable Development Goals (SDGs), defines water services as improved when meeting three criteria: accessible on premises, availability when needed, and free from contamination. Basic services are defined as improved water services within a 30 minutes round trip, while limited services are defined as improved services not within a 30 mininutes round trip. Although recent household survey data on water supply coverage, which is normally the main basis of this type of analysis, is not available in the District, an estimate of the level of service accessible to the District’s population in line with the JMP service level classification has been made by combining information on available infrastructure (assets) with population data4. Results of this analysis are presented in Figure 3.3. As no information was available on self-supply sources, this analysis is limited to communal facilities. The figure shows that in rural areas almost 42% of the population have access to improved (communal) water facilities. However, only 61% of these are estimated to have access within a 30 minute return trip. Therefore, around 25% of the rural and 46% of the District population is estimated to have access to at least basic services. However, only 3.6% of the population has access to potentially safely managed source (household connection within premise)5.
Figure 3.3 Water Services in Asutifi North District Source: Water service monitoring baseline, 2017
3.1.4 SUMMING UP: THE MAIN WATER SUPPLY CHALLENGES AND GAPSBased on the analyses presented in this section, the main challenges related to water service provision in the District can be summarised as follows:
1. Lack of improved water services in some of the rural parts of the District (estimated 58% of rural population without coverage), especially in communities which are difficult to serve, which are mostly located in the poorer part of the District;
2. Low level of household connections (only 11% of urban population and 3.6% of total district population) and hence low levels of “safely-managed” water supply;
3. Intermittent supply of water in towns and low quantity of water use (in some areas supply of about 2 out of 7 days; quantity produced is low especially in Kenyasi (8lpcd) (Ntotroso: 19.8 lpcd);
4. Breakdown times of handpumps (36% of handpumps have breakdowns more than 18 days per year).
The following data and information gaps have been identified: • There is no recent information on household-level access to water facilities based on household surveys (which
includes access to self-supply sources, and availability of water services when needed). Self-supply is therefore not considered in this analysis.
• Lack of data on actual water quality. • Lack of reliable data on water quantity from handpumps and limited mechanized boreholes.
4 It should be noted that this was a challenge as projected census data used different units of observation (census areas) than the service monitoring (communities).
5 As no water quality sampling was undertaken as part of the assessment, water quality it not taken into account in this analysis. However, piped water on premise is expected to be of acceptable quality. Also, no assessment was done on whether water services were available when needed. As water supply in some areas of the towns is only supplied on intermitted basis (2 out of 7 days), the actual proportion of population with “safely-managed” water supply may be even lower.
100%90%80%70%60%50%40%30%20%10%
0%
Safely Managed Basic services Limited services
11%
89%
0%
25%
16%
58%
46%
4%
40%
11%
Rural Urban District
Not served with improved (communial) water schemes
28 Water, Sanitation and Hygiene (WASH) Masterplan Water, Sanitation and Hygiene (WASH) Masterplan 29
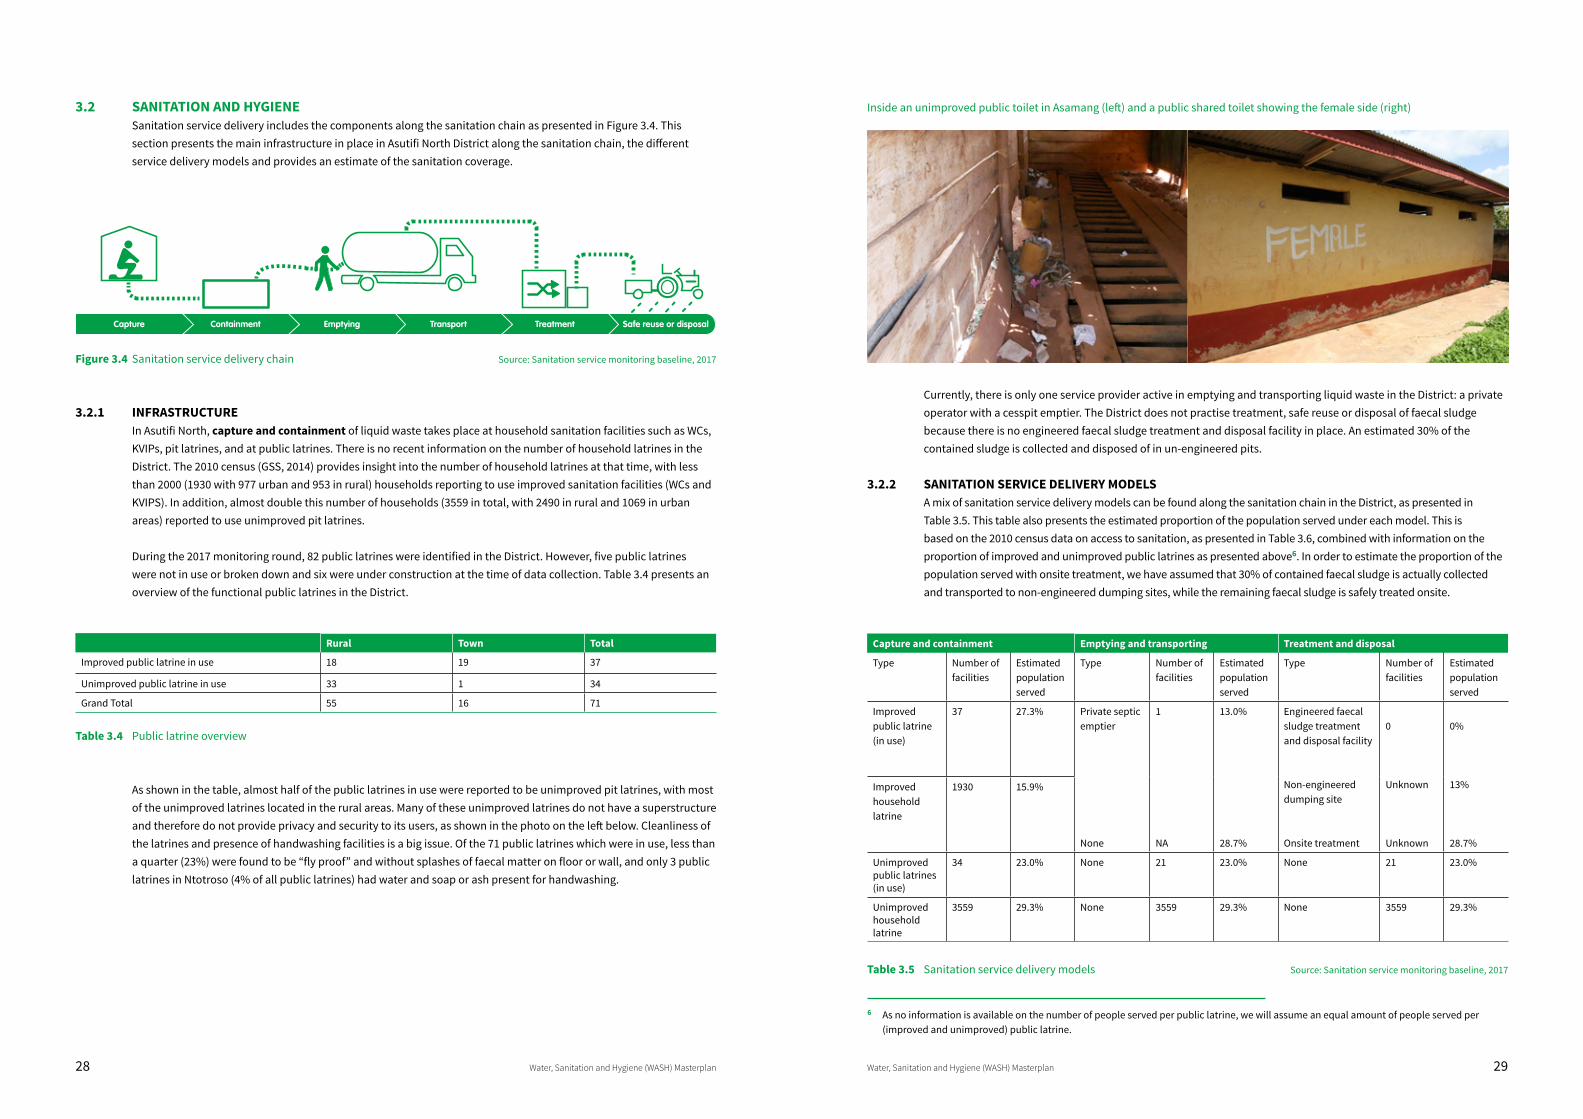
3.2 SANITATION AND HYGIENESanitation service delivery includes the components along the sanitation chain as presented in Figure 3.4. This section presents the main infrastructure in place in Asutifi North District along the sanitation chain, the different service delivery models and provides an estimate of the sanitation coverage.
Figure 3.4 Sanitation service delivery chain Source: Sanitation service monitoring baseline, 2017
3.2.1 INFRASTRUCTUREIn Asutifi North, capture and containment of liquid waste takes place at household sanitation facilities such as WCs, KVIPs, pit latrines, and at public latrines. There is no recent information on the number of household latrines in the District. The 2010 census (GSS, 2014) provides insight into the number of household latrines at that time, with less than 2000 (1930 with 977 urban and 953 in rural) households reporting to use improved sanitation facilities (WCs and KVIPS). In addition, almost double this number of households (3559 in total, with 2490 in rural and 1069 in urban areas) reported to use unimproved pit latrines.
During the 2017 monitoring round, 82 public latrines were identified in the District. However, five public latrines were not in use or broken down and six were under construction at the time of data collection. Table 3.4 presents an overview of the functional public latrines in the District.
Rural Town Total
Improved public latrine in use 18 19 37
Unimproved public latrine in use 33 1 34
Grand Total 55 16 71
Table 3.4 Public latrine overview
As shown in the table, almost half of the public latrines in use were reported to be unimproved pit latrines, with most of the unimproved latrines located in the rural areas. Many of these unimproved latrines do not have a superstructure and therefore do not provide privacy and security to its users, as shown in the photo on the left below. Cleanliness of the latrines and presence of handwashing facilities is a big issue. Of the 71 public latrines which were in use, less than a quarter (23%) were found to be “fly proof” and without splashes of faecal matter on floor or wall, and only 3 public latrines in Ntotroso (4% of all public latrines) had water and soap or ash present for handwashing.
Inside an unimproved public toilet in Asamang (left) and a public shared toilet showing the female side (right)
Currently, there is only one service provider active in emptying and transporting liquid waste in the District: a private operator with a cesspit emptier. The District does not practise treatment, safe reuse or disposal of faecal sludge because there is no engineered faecal sludge treatment and disposal facility in place. An estimated 30% of the contained sludge is collected and disposed of in un-engineered pits.
3.2.2 SANITATION SERVICE DELIVERY MODELSA mix of sanitation service delivery models can be found along the sanitation chain in the District, as presented in Table 3.5. This table also presents the estimated proportion of the population served under each model. This is based on the 2010 census data on access to sanitation, as presented in Table 3.6, combined with information on the proportion of improved and unimproved public latrines as presented above6. In order to estimate the proportion of the population served with onsite treatment, we have assumed that 30% of contained faecal sludge is actually collected and transported to non-engineered dumping sites, while the remaining faecal sludge is safely treated onsite.
Capture and containment Emptying and transporting Treatment and disposal
Type Number of facilities
Estimated population served
Type Number of facilities
Estimated population served
Type Number of facilities
Estimated population served
Improved public latrine (in use)
37 27.3% Private septic emptier
None
1
NA
13.0%
28.7%
Engineered faecal sludge treatment and disposal facility
Non-engineered dumping site
Onsite treatment
0
Unknown
Unknown
0%
13%
28.7%
Improved household latrine
1930 15.9%
Unimproved public latrines (in use)
34 23.0% None 21 23.0% None 21 23.0%
Unimproved household latrine
3559 29.3% None 3559 29.3% None 3559 29.3%
Table 3.5 Sanitation service delivery models Source: Sanitation service monitoring baseline, 2017
6 As no information is available on the number of people served per public latrine, we will assume an equal amount of people served per (improved and unimproved) public latrine.
30 Water, Sanitation and Hygiene (WASH) Masterplan Water, Sanitation and Hygiene (WASH) Masterplan 31
Technologies Rural Urban District
WC (Water closet & pour flush toilets) 2.6% 7.8% 4.5%
KVIP/VIP 9.5% 15.1% 11.4%
Shared or use of public toilets (WC, KVIP, pit latrine etc) 50.5% 50% 50.3%
Pit latrine 31.6% 25.1% 29.3%
Unimproved (bucket/pan/other) 0.2% 0.1% 0.2%
Open defecation (OD) 5.6 1.9% 4.3%
Table 3.6 Proportion of households using different sanitation facilitiesSource: Ghana Statistical Service, 2010 Population and Housing Census
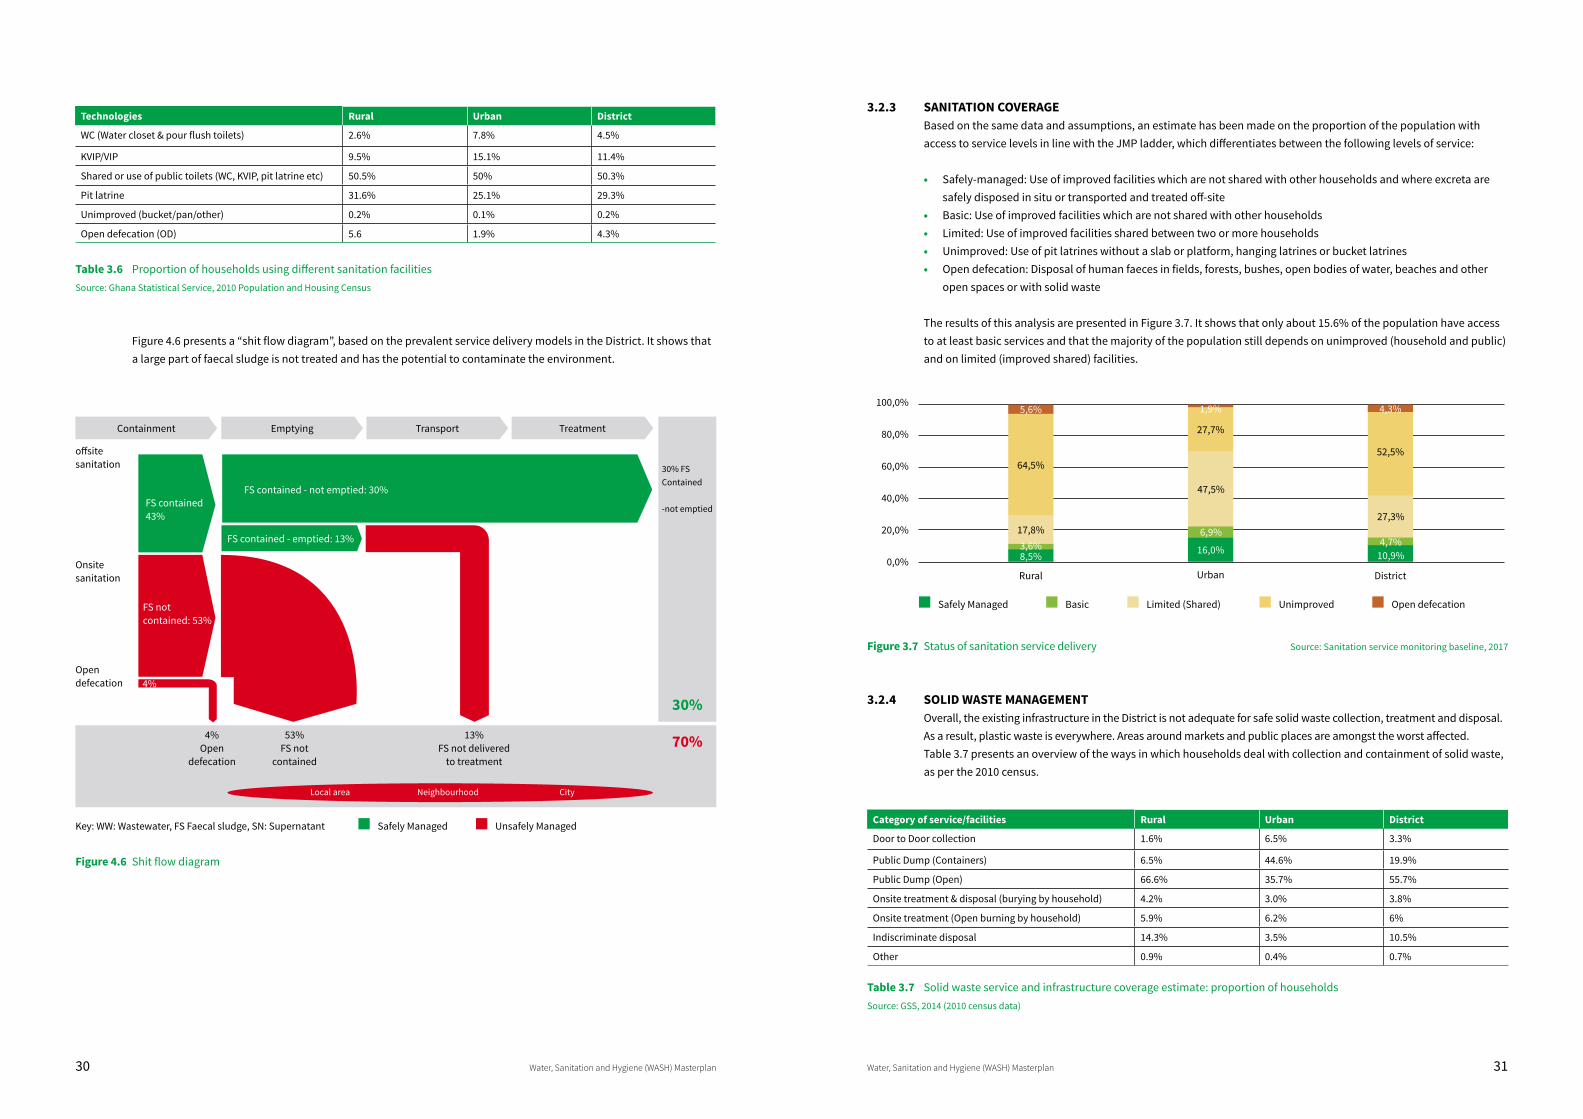
Figure 4.6 presents a “shit flow diagram”, based on the prevalent service delivery models in the District. It shows that a large part of faecal sludge is not treated and has the potential to contaminate the environment.
Containment Emptying Transport Treatment
offsite sanitation
Onsite sanitation
Open defecation
FS contained 43%
FS not contained: 53%
FS contained - not emptied: 30%
FS contained - emptied: 13%
4%
53% FS not
contained
13%FS not delivered
to treatment
4%Open
defecation
30%
70%
30% FSContained
-not emptied
Local area Neighbourhood City
Unsafely ManagedSafely ManagedKey: WW: Wastewater, FS Faecal sludge, SN: Supernatant
Figure 4.6 Shit flow diagram
3.2.3 SANITATION COVERAGE Based on the same data and assumptions, an estimate has been made on the proportion of the population with access to service levels in line with the JMP ladder, which differentiates between the following levels of service:
• Safely-managed: Use of improved facilities which are not shared with other households and where excreta are safely disposed in situ or transported and treated off-site
• Basic: Use of improved facilities which are not shared with other households• Limited: Use of improved facilities shared between two or more households• Unimproved: Use of pit latrines without a slab or platform, hanging latrines or bucket latrines• Open defecation: Disposal of human faeces in fields, forests, bushes, open bodies of water, beaches and other
open spaces or with solid waste
The results of this analysis are presented in Figure 3.7. It shows that only about 15.6% of the population have access to at least basic services and that the majority of the population still depends on unimproved (household and public) and on limited (improved shared) facilities.
Safely Managed Basic Limited (Shared) Unimproved
100,0%
80,0%
60,0%
40,0%
20,0%
0,0%
27,3%
4,7%10,9%
4,3%
52,5%64,5%
5,6%
17,8%3,6%8,5%
Rural
47,5%
6,9%
16,0%
27,7%
1,9%
Urban District
Open defecation
Figure 3.7 Status of sanitation service delivery Source: Sanitation service monitoring baseline, 2017
3.2.4 SOLID WASTE MANAGEMENTOverall, the existing infrastructure in the District is not adequate for safe solid waste collection, treatment and disposal. As a result, plastic waste is everywhere. Areas around markets and public places are amongst the worst affected. Table 3.7 presents an overview of the ways in which households deal with collection and containment of solid waste, as per the 2010 census.
Category of service/facilities Rural Urban District
Door to Door collection 1.6% 6.5% 3.3%
Public Dump (Containers) 6.5% 44.6% 19.9%
Public Dump (Open) 66.6% 35.7% 55.7%
Onsite treatment & disposal (burying by household) 4.2% 3.0% 3.8%
Onsite treatment (Open burning by household) 5.9% 6.2% 6%
Indiscriminate disposal 14.3% 3.5% 10.5%
Other 0.9% 0.4% 0.7%
Table 3.7 Solid waste service and infrastructure coverage estimate: proportion of households Source: GSS, 2014 (2010 census data)
32 Water, Sanitation and Hygiene (WASH) Masterplan Water, Sanitation and Hygiene (WASH) Masterplan 33
The table shows that a large proportion of households dump their solid waste indiscriminately (10.5%) or in public dumping sites (65.6%). Only 3.3% percent of the population has a “door-to-door” service in 2010 and this was mainly in the urban areas. According to the 2014-2017 Medium Term Development Plan of the District, the collection and transportation of waste materials in the District is done by the Assembly’s Environmental Health Department and Zoomlion Company Limited, a private Waste Management Company. In some of the communities, communal labour is organised for waste collection. There is no engineered landfill in the entire District, which means that the little waste that is collected from waste generators (homes and commercial facilities) is not safely disposed of.
During the 2017 service monitoring round, 82 communal waste dumping sites were mapped. As shown in Table 3.8, only 13% of these were effectively managed.
Row Labels Rural areas Towns Grand Total
Burning 1 1
Community solid waste effectively managed 7 4 11
Environment unclean and not swept 33 15 48
Overgrown weeds providing cover OD 15 7 22
Grand Total 56 26 82
Table 3.8 Waste management sites Source: Sanitation service monitoring baseline, 2017
Solid waste management efforts have been concentrated in urban areas and market centres with contracted waste managers, but the rural areas have been left to manage their own waste. This is becoming a challenge for the bigger villages as waste management goes beyond the local capacity.
3.2.5 GREYWATER/SULLAGEThe situation with respect to greywater (sullage) disposal at household level (at the time of the 2010 census) is presented in Table 3.9. The table shows that greywater management in the District has not received much attention, as most household dispose of their greywater into the street or their compound. This is compounded by limited and largely unimproved (non-engineered) drainage system.
There are few places with drainage in the urban settings and they are woefully inadequate. The rest are largely earth drains and mostly created by runoffs. The haphazard disposal practices and neglect of proper greywater management could have serious consequences on water quality.
Category of service/facility Rural Urban District
Through sewerage 0.8% 1.4% 1%
Through stormwater drainage/gutters 4.6% 15.9% 8.6%
Through soakaway or catch pits 1.3% 5.8% 2.9%
By open disposal (onto streets, compounds, etc.) 93.3% 77.0% 87.5%
Table 3.9 Greywater/sullage/liquid waste management Source: GSS, 2014 (2010 census)
3.2.6 SUMMING UP: THE MAIN SANITATION CHALLENGES AND GAPSBased on the analyses presented in this section, the main challenges related to sanitation service provision in the District can be summarised as follows:
• Low levels of basic sanitation, with only 15.6% estimated to use improved household latrines;• About half of the population using public latrines; • However, 60% (33 out of 55) of public latrines in rural areas have unimproved sanitation facilities;• Lack of cleanliness of public latrines (with less than a quarter (23%) of public latrines considered as clean);• Lack of handwashing facilities at public latrines, with only 3 of 71 functional latrines with handwashing facilities;• Lack of facilities for collecting and transporting liquid waste;• Lack of facilities for treatment and disposal of liquid waste; • Lack of clean and well-managed dumping sites for solid waste, especially in the rural areas. • Lack of facilities for grey water disposal.
Main data and information gaps: • Most recent household data on sanitation services, solid waste and grey water management practices is from
2010 and may be (slightly) out of date;• No information on the number of people served per improved and unimproved public latrine.
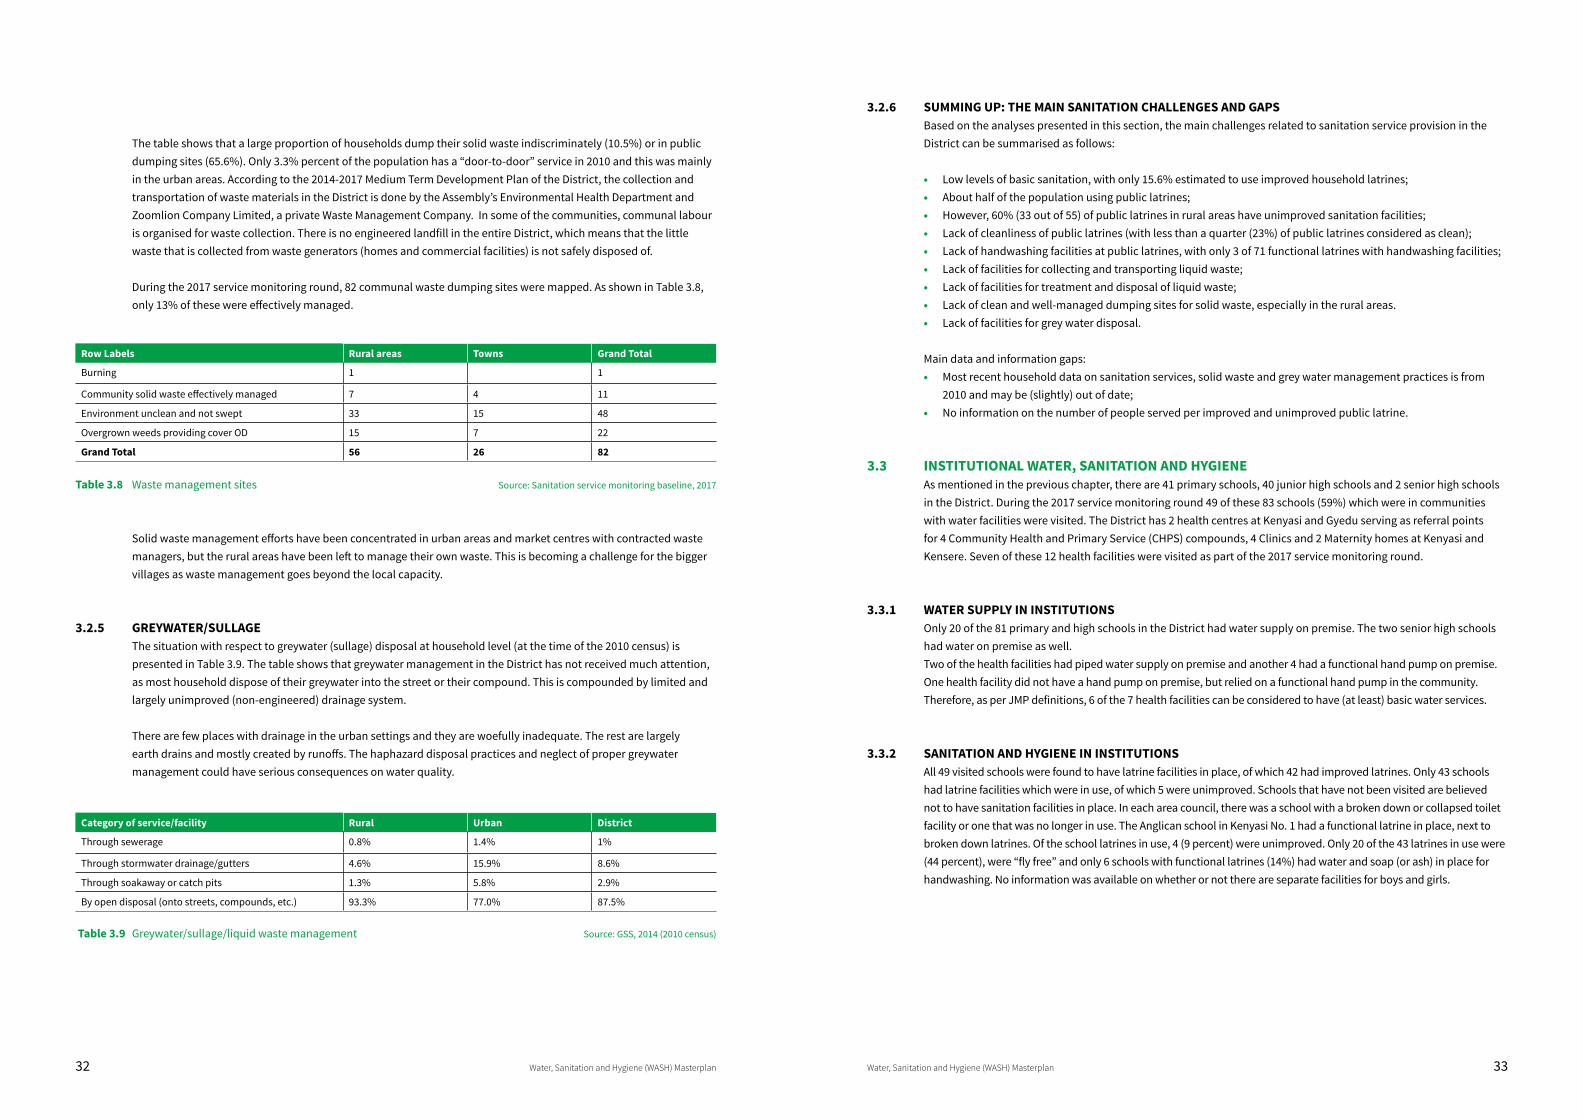
3.3 INSTITUTIONAL WATER, SANITATION AND HYGIENE As mentioned in the previous chapter, there are 41 primary schools, 40 junior high schools and 2 senior high schools in the District. During the 2017 service monitoring round 49 of these 83 schools (59%) which were in communities with water facilities were visited. The District has 2 health centres at Kenyasi and Gyedu serving as referral points for 4 Community Health and Primary Service (CHPS) compounds, 4 Clinics and 2 Maternity homes at Kenyasi and Kensere. Seven of these 12 health facilities were visited as part of the 2017 service monitoring round.
3.3.1 WATER SUPPLY IN INSTITUTIONSOnly 20 of the 81 primary and high schools in the District had water supply on premise. The two senior high schools had water on premise as well. Two of the health facilities had piped water supply on premise and another 4 had a functional hand pump on premise. One health facility did not have a hand pump on premise, but relied on a functional hand pump in the community. Therefore, as per JMP definitions, 6 of the 7 health facilities can be considered to have (at least) basic water services.
3.3.2 SANITATION AND HYGIENE IN INSTITUTIONSAll 49 visited schools were found to have latrine facilities in place, of which 42 had improved latrines. Only 43 schools had latrine facilities which were in use, of which 5 were unimproved. Schools that have not been visited are believed not to have sanitation facilities in place. In each area council, there was a school with a broken down or collapsed toilet facility or one that was no longer in use. The Anglican school in Kenyasi No. 1 had a functional latrine in place, next to broken down latrines. Of the school latrines in use, 4 (9 percent) were unimproved. Only 20 of the 43 latrines in use were (44 percent), were “fly free” and only 6 schools with functional latrines (14%) had water and soap (or ash) in place for handwashing. No information was available on whether or not there are separate facilities for boys and girls.
34 Water, Sanitation and Hygiene (WASH) Masterplan Water, Sanitation and Hygiene (WASH) Masterplan 35
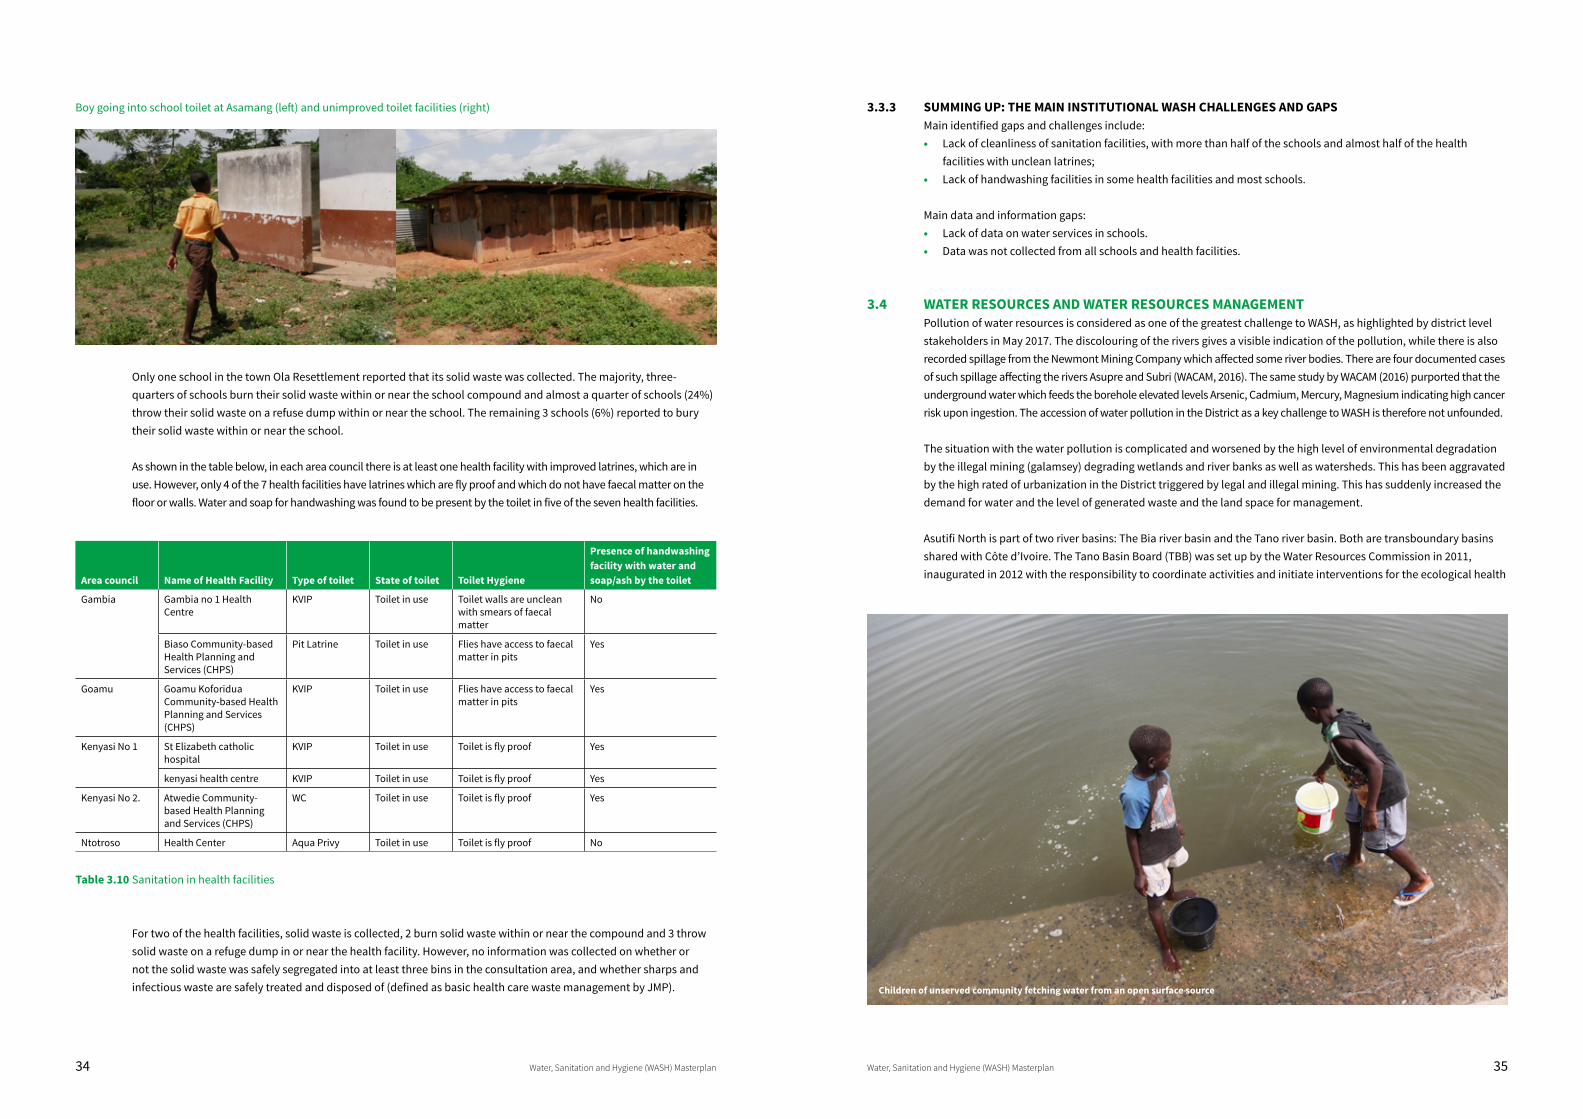
Boy going into school toilet at Asamang (left) and unimproved toilet facilities (right)
Only one school in the town Ola Resettlement reported that its solid waste was collected. The majority, three-quarters of schools burn their solid waste within or near the school compound and almost a quarter of schools (24%) throw their solid waste on a refuse dump within or near the school. The remaining 3 schools (6%) reported to bury their solid waste within or near the school.
As shown in the table below, in each area council there is at least one health facility with improved latrines, which are in use. However, only 4 of the 7 health facilities have latrines which are fly proof and which do not have faecal matter on the floor or walls. Water and soap for handwashing was found to be present by the toilet in five of the seven health facilities.
Area council Name of Health Facility Type of toilet State of toilet Toilet Hygiene
Presence of handwashing facility with water and soap/ash by the toilet
Gambia Gambia no 1 Health Centre
KVIP Toilet in use Toilet walls are unclean with smears of faecal matter
No
Biaso Community-based Health Planning and Services (CHPS)
Pit Latrine Toilet in use Flies have access to faecal matter in pits
Yes
Goamu Goamu Koforidua Community-based Health Planning and Services (CHPS)
KVIP Toilet in use Flies have access to faecal matter in pits
Yes
Kenyasi No 1 St Elizabeth catholic hospital
KVIP Toilet in use Toilet is fly proof Yes
kenyasi health centre KVIP Toilet in use Toilet is fly proof Yes
Kenyasi No 2. Atwedie Community-based Health Planning and Services (CHPS)
WC Toilet in use Toilet is fly proof Yes
Ntotroso Health Center Aqua Privy Toilet in use Toilet is fly proof No
Table 3.10 Sanitation in health facilities
For two of the health facilities, solid waste is collected, 2 burn solid waste within or near the compound and 3 throw solid waste on a refuge dump in or near the health facility. However, no information was collected on whether or not the solid waste was safely segregated into at least three bins in the consultation area, and whether sharps and infectious waste are safely treated and disposed of (defined as basic health care waste management by JMP).
3.3.3 SUMMING UP: THE MAIN INSTITUTIONAL WASH CHALLENGES AND GAPSMain identified gaps and challenges include: • Lack of cleanliness of sanitation facilities, with more than half of the schools and almost half of the health
facilities with unclean latrines;• Lack of handwashing facilities in some health facilities and most schools.
Main data and information gaps:• Lack of data on water services in schools. • Data was not collected from all schools and health facilities.
3.4 WATER RESOURCES AND WATER RESOURCES MANAGEMENTPollution of water resources is considered as one of the greatest challenge to WASH, as highlighted by district level stakeholders in May 2017. The discolouring of the rivers gives a visible indication of the pollution, while there is also recorded spillage from the Newmont Mining Company which affected some river bodies. There are four documented cases of such spillage affecting the rivers Asupre and Subri (WACAM, 2016). The same study by WACAM (2016) purported that the underground water which feeds the borehole elevated levels Arsenic, Cadmium, Mercury, Magnesium indicating high cancer risk upon ingestion. The accession of water pollution in the District as a key challenge to WASH is therefore not unfounded.
The situation with the water pollution is complicated and worsened by the high level of environmental degradation by the illegal mining (galamsey) degrading wetlands and river banks as well as watersheds. This has been aggravated by the high rated of urbanization in the District triggered by legal and illegal mining. This has suddenly increased the demand for water and the level of generated waste and the land space for management.
Asutifi North is part of two river basins: The Bia river basin and the Tano river basin. Both are transboundary basins shared with Côte d’Ivoire. The Tano Basin Board (TBB) was set up by the Water Resources Commission in 2011, inaugurated in 2012 with the responsibility to coordinate activities and initiate interventions for the ecological health
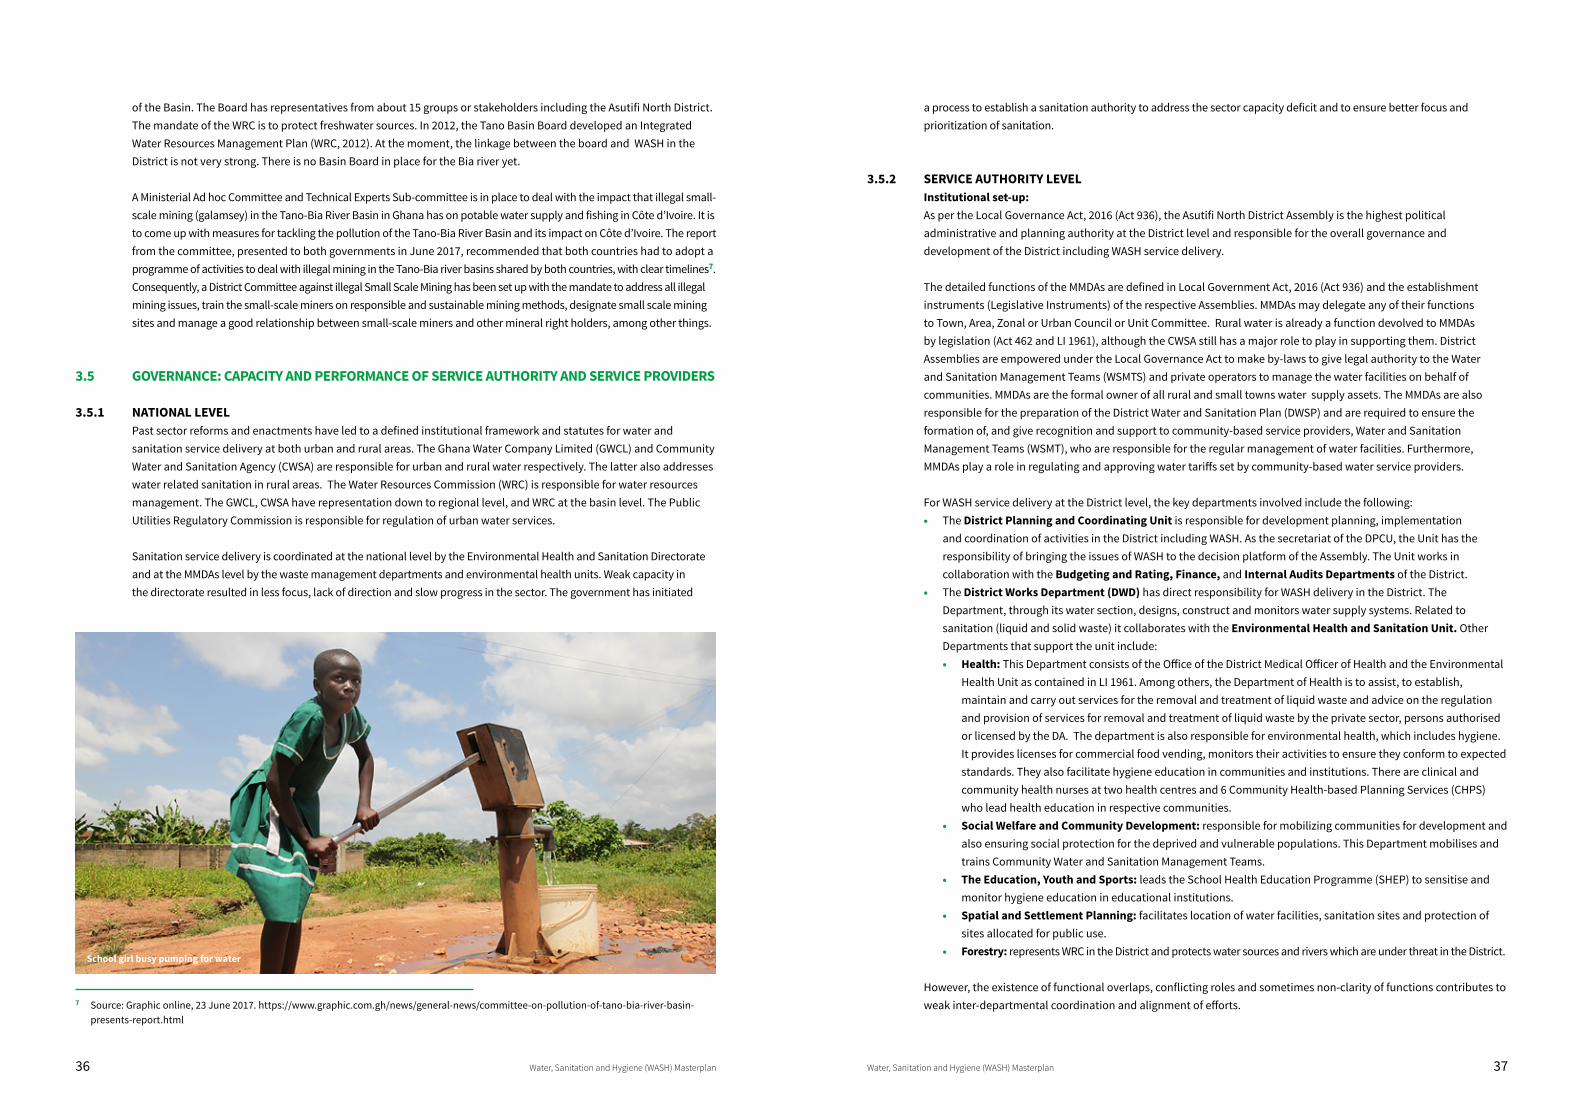
Children of unserved community fetching water from an open surface source
36 Water, Sanitation and Hygiene (WASH) Masterplan Water, Sanitation and Hygiene (WASH) Masterplan 37
of the Basin. The Board has representatives from about 15 groups or stakeholders including the Asutifi North District. The mandate of the WRC is to protect freshwater sources. In 2012, the Tano Basin Board developed an Integrated Water Resources Management Plan (WRC, 2012). At the moment, the linkage between the board and WASH in the District is not very strong. There is no Basin Board in place for the Bia river yet.
A Ministerial Ad hoc Committee and Technical Experts Sub-committee is in place to deal with the impact that illegal small-scale mining (galamsey) in the Tano-Bia River Basin in Ghana has on potable water supply and fishing in Côte d’Ivoire. It is to come up with measures for tackling the pollution of the Tano-Bia River Basin and its impact on Côte d’Ivoire. The report from the committee, presented to both governments in June 2017, recommended that both countries had to adopt a programme of activities to deal with illegal mining in the Tano-Bia river basins shared by both countries, with clear timelines7. Consequently, a District Committee against illegal Small Scale Mining has been set up with the mandate to address all illegal mining issues, train the small-scale miners on responsible and sustainable mining methods, designate small scale mining sites and manage a good relationship between small-scale miners and other mineral right holders, among other things.
3.5 GOVERNANCE: CAPACITY AND PERFORMANCE OF SERVICE AUTHORITY AND SERVICE PROVIDERS
3.5.1 NATIONAL LEVELPast sector reforms and enactments have led to a defined institutional framework and statutes for water and sanitation service delivery at both urban and rural areas. The Ghana Water Company Limited (GWCL) and Community Water and Sanitation Agency (CWSA) are responsible for urban and rural water respectively. The latter also addresses water related sanitation in rural areas. The Water Resources Commission (WRC) is responsible for water resources management. The GWCL, CWSA have representation down to regional level, and WRC at the basin level. The Public Utilities Regulatory Commission is responsible for regulation of urban water services.
Sanitation service delivery is coordinated at the national level by the Environmental Health and Sanitation Directorate and at the MMDAs level by the waste management departments and environmental health units. Weak capacity in the directorate resulted in less focus, lack of direction and slow progress in the sector. The government has initiated
a process to establish a sanitation authority to address the sector capacity deficit and to ensure better focus and prioritization of sanitation.
3.5.2 SERVICE AUTHORITY LEVELInstitutional set-up:As per the Local Governance Act, 2016 (Act 936), the Asutifi North District Assembly is the highest political administrative and planning authority at the District level and responsible for the overall governance and development of the District including WASH service delivery.
The detailed functions of the MMDAs are defined in Local Government Act, 2016 (Act 936) and the establishment instruments (Legislative Instruments) of the respective Assemblies. MMDAs may delegate any of their functions to Town, Area, Zonal or Urban Council or Unit Committee. Rural water is already a function devolved to MMDAs by legislation (Act 462 and LI 1961), although the CWSA still has a major role to play in supporting them. District Assemblies are empowered under the Local Governance Act to make by-laws to give legal authority to the Water and Sanitation Management Teams (WSMTS) and private operators to manage the water facilities on behalf of communities. MMDAs are the formal owner of all rural and small towns water supply assets. The MMDAs are also responsible for the preparation of the District Water and Sanitation Plan (DWSP) and are required to ensure the formation of, and give recognition and support to community-based service providers, Water and Sanitation Management Teams (WSMT), who are responsible for the regular management of water facilities. Furthermore, MMDAs play a role in regulating and approving water tariffs set by community-based water service providers.
For WASH service delivery at the District level, the key departments involved include the following:• The District Planning and Coordinating Unit is responsible for development planning, implementation
and coordination of activities in the District including WASH. As the secretariat of the DPCU, the Unit has the responsibility of bringing the issues of WASH to the decision platform of the Assembly. The Unit works in collaboration with the Budgeting and Rating, Finance, and Internal Audits Departments of the District.
• The District Works Department (DWD) has direct responsibility for WASH delivery in the District. The Department, through its water section, designs, construct and monitors water supply systems. Related to sanitation (liquid and solid waste) it collaborates with the Environmental Health and Sanitation Unit. Other Departments that support the unit include:• Health: This Department consists of the Office of the District Medical Officer of Health and the Environmental
Health Unit as contained in LI 1961. Among others, the Department of Health is to assist, to establish, maintain and carry out services for the removal and treatment of liquid waste and advice on the regulation and provision of services for removal and treatment of liquid waste by the private sector, persons authorised or licensed by the DA. The department is also responsible for environmental health, which includes hygiene. It provides licenses for commercial food vending, monitors their activities to ensure they conform to expected standards. They also facilitate hygiene education in communities and institutions. There are clinical and community health nurses at two health centres and 6 Community Health-based Planning Services (CHPS) who lead health education in respective communities.
• Social Welfare and Community Development: responsible for mobilizing communities for development and also ensuring social protection for the deprived and vulnerable populations. This Department mobilises and trains Community Water and Sanitation Management Teams.
• The Education, Youth and Sports: leads the School Health Education Programme (SHEP) to sensitise and monitor hygiene education in educational institutions.
• Spatial and Settlement Planning: facilitates location of water facilities, sanitation sites and protection of sites allocated for public use.
• Forestry: represents WRC in the District and protects water sources and rivers which are under threat in the District.
However, the existence of functional overlaps, conflicting roles and sometimes non-clarity of functions contributes to weak inter-departmental coordination and alignment of efforts. 7 Source: Graphic online, 23 June 2017. https://www.graphic.com.gh/news/general-news/committee-on-pollution-of-tano-bia-river-basin-
presents-report.html
School girl busy pumping for water
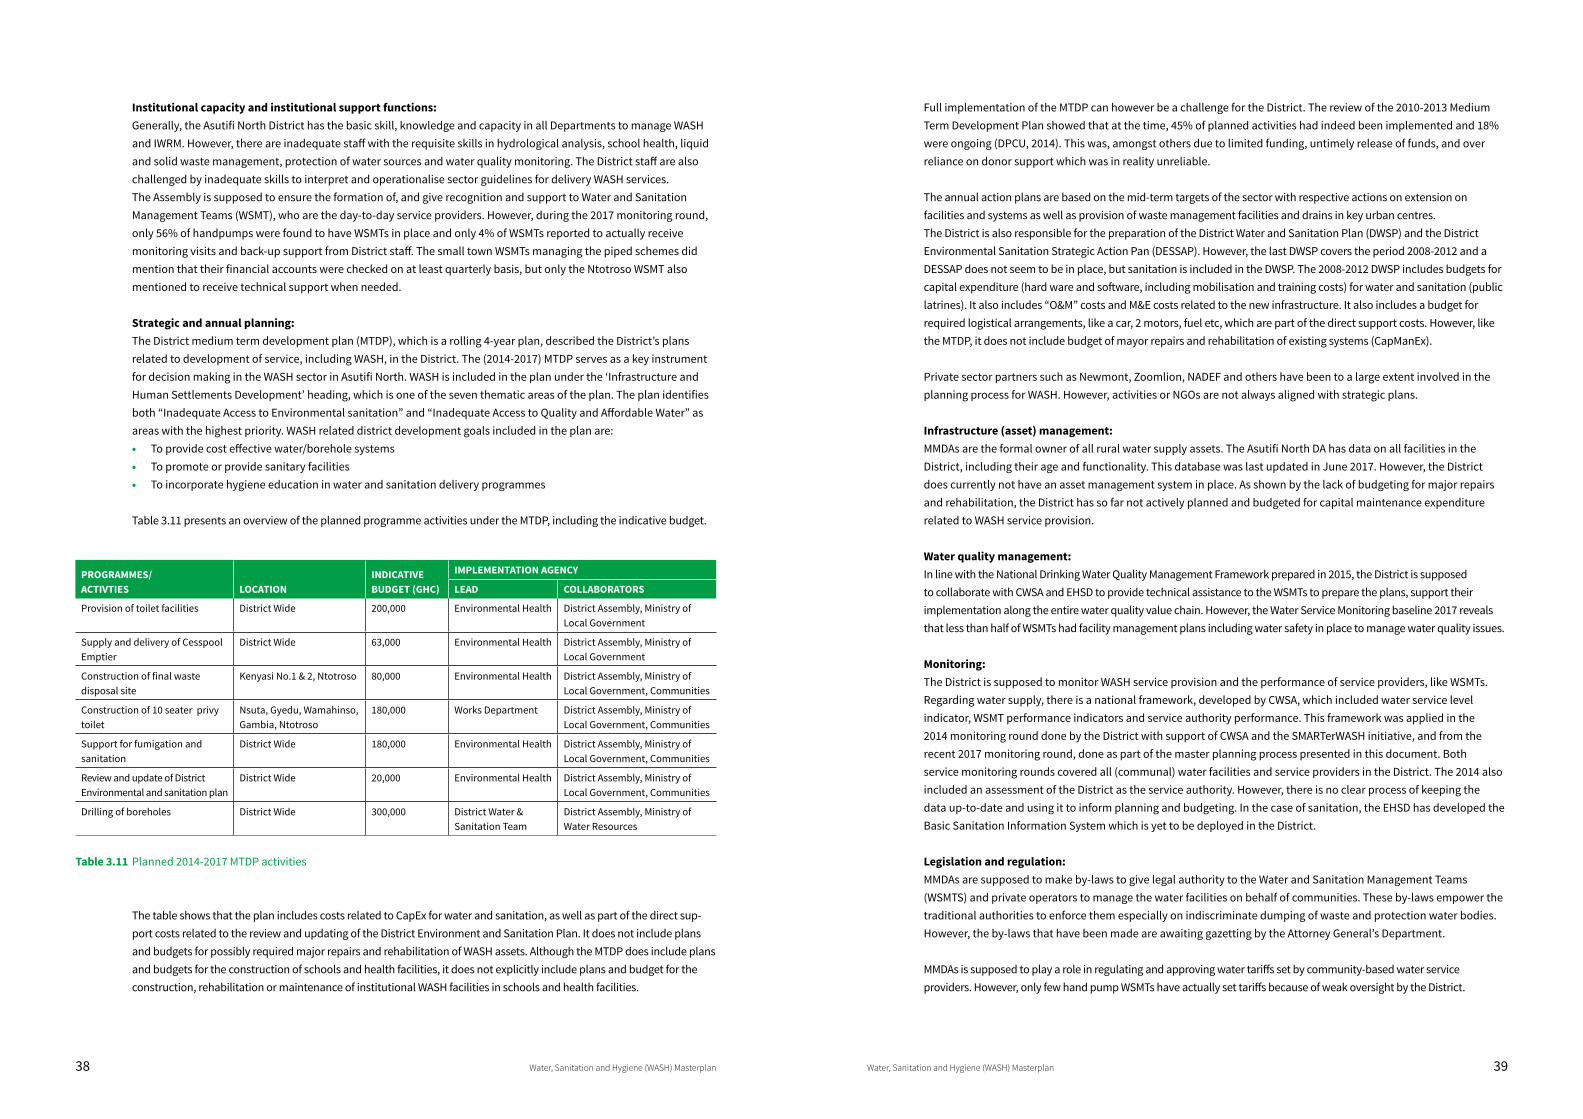
38 Water, Sanitation and Hygiene (WASH) Masterplan Water, Sanitation and Hygiene (WASH) Masterplan 39
Institutional capacity and institutional support functions:Generally, the Asutifi North District has the basic skill, knowledge and capacity in all Departments to manage WASH and IWRM. However, there are inadequate staff with the requisite skills in hydrological analysis, school health, liquid and solid waste management, protection of water sources and water quality monitoring. The District staff are also challenged by inadequate skills to interpret and operationalise sector guidelines for delivery WASH services. The Assembly is supposed to ensure the formation of, and give recognition and support to Water and Sanitation Management Teams (WSMT), who are the day-to-day service providers. However, during the 2017 monitoring round, only 56% of handpumps were found to have WSMTs in place and only 4% of WSMTs reported to actually receive monitoring visits and back-up support from District staff. The small town WSMTs managing the piped schemes did mention that their financial accounts were checked on at least quarterly basis, but only the Ntotroso WSMT also mentioned to receive technical support when needed.
Strategic and annual planning: The District medium term development plan (MTDP), which is a rolling 4-year plan, described the District’s plans related to development of service, including WASH, in the District. The (2014-2017) MTDP serves as a key instrument for decision making in the WASH sector in Asutifi North. WASH is included in the plan under the ‘Infrastructure and Human Settlements Development’ heading, which is one of the seven thematic areas of the plan. The plan identifies both “Inadequate Access to Environmental sanitation” and “Inadequate Access to Quality and Affordable Water” as areas with the highest priority. WASH related district development goals included in the plan are: • To provide cost effective water/borehole systems• To promote or provide sanitary facilities• To incorporate hygiene education in water and sanitation delivery programmes
Table 3.11 presents an overview of the planned programme activities under the MTDP, including the indicative budget.
PROGRAMMES/ACTIVTIES LOCATION
INDICATIVE BUDGET (GHC)
IMPLEMENTATION AGENCY
LEAD COLLABORATORS
Provision of toilet facilities District Wide 200,000 Environmental Health District Assembly, Ministry of Local Government
Supply and delivery of Cesspool Emptier
District Wide 63,000 Environmental Health District Assembly, Ministry of Local Government
Construction of final waste disposal site
Kenyasi No.1 & 2, Ntotroso 80,000 Environmental Health District Assembly, Ministry of Local Government, Communities
Construction of 10 seater privy toilet
Nsuta, Gyedu, Wamahinso, Gambia, Ntotroso
180,000 Works Department District Assembly, Ministry of Local Government, Communities
Support for fumigation and sanitation
District Wide 180,000 Environmental Health District Assembly, Ministry of Local Government, Communities
Review and update of District Environmental and sanitation plan
District Wide 20,000 Environmental Health District Assembly, Ministry of Local Government, Communities
Drilling of boreholes District Wide 300,000 District Water & Sanitation Team
District Assembly, Ministry of Water Resources
Table 3.11 Planned 2014-2017 MTDP activities
The table shows that the plan includes costs related to CapEx for water and sanitation, as well as part of the direct sup-port costs related to the review and updating of the District Environment and Sanitation Plan. It does not include plans and budgets for possibly required major repairs and rehabilitation of WASH assets. Although the MTDP does include plans and budgets for the construction of schools and health facilities, it does not explicitly include plans and budget for the construction, rehabilitation or maintenance of institutional WASH facilities in schools and health facilities.
Full implementation of the MTDP can however be a challenge for the District. The review of the 2010-2013 Medium Term Development Plan showed that at the time, 45% of planned activities had indeed been implemented and 18% were ongoing (DPCU, 2014). This was, amongst others due to limited funding, untimely release of funds, and over reliance on donor support which was in reality unreliable.
The annual action plans are based on the mid-term targets of the sector with respective actions on extension on facilities and systems as well as provision of waste management facilities and drains in key urban centres. The District is also responsible for the preparation of the District Water and Sanitation Plan (DWSP) and the District Environmental Sanitation Strategic Action Pan (DESSAP). However, the last DWSP covers the period 2008-2012 and a DESSAP does not seem to be in place, but sanitation is included in the DWSP. The 2008-2012 DWSP includes budgets for capital expenditure (hard ware and software, including mobilisation and training costs) for water and sanitation (public latrines). It also includes “O&M” costs and M&E costs related to the new infrastructure. It also includes a budget for required logistical arrangements, like a car, 2 motors, fuel etc, which are part of the direct support costs. However, like the MTDP, it does not include budget of mayor repairs and rehabilitation of existing systems (CapManEx).
Private sector partners such as Newmont, Zoomlion, NADEF and others have been to a large extent involved in the planning process for WASH. However, activities or NGOs are not always aligned with strategic plans.
Infrastructure (asset) management: MMDAs are the formal owner of all rural water supply assets. The Asutifi North DA has data on all facilities in the District, including their age and functionality. This database was last updated in June 2017. However, the District does currently not have an asset management system in place. As shown by the lack of budgeting for major repairs and rehabilitation, the District has so far not actively planned and budgeted for capital maintenance expenditure related to WASH service provision.
Water quality management: In line with the National Drinking Water Quality Management Framework prepared in 2015, the District is supposed to collaborate with CWSA and EHSD to provide technical assistance to the WSMTs to prepare the plans, support their implementation along the entire water quality value chain. However, the Water Service Monitoring baseline 2017 reveals that less than half of WSMTs had facility management plans including water safety in place to manage water quality issues.
Monitoring: The District is supposed to monitor WASH service provision and the performance of service providers, like WSMTs. Regarding water supply, there is a national framework, developed by CWSA, which included water service level indicator, WSMT performance indicators and service authority performance. This framework was applied in the 2014 monitoring round done by the District with support of CWSA and the SMARTerWASH initiative, and from the recent 2017 monitoring round, done as part of the master planning process presented in this document. Both service monitoring rounds covered all (communal) water facilities and service providers in the District. The 2014 also included an assessment of the District as the service authority. However, there is no clear process of keeping the data up-to-date and using it to inform planning and budgeting. In the case of sanitation, the EHSD has developed the Basic Sanitation Information System which is yet to be deployed in the District.
Legislation and regulation: MMDAs are supposed to make by-laws to give legal authority to the Water and Sanitation Management Teams (WSMTS) and private operators to manage the water facilities on behalf of communities. These by-laws empower the traditional authorities to enforce them especially on indiscriminate dumping of waste and protection water bodies. However, the by-laws that have been made are awaiting gazetting by the Attorney General’s Department.
MMDAs is supposed to play a role in regulating and approving water tariffs set by community-based water service providers. However, only few hand pump WSMTs have actually set tariffs because of weak oversight by the District.
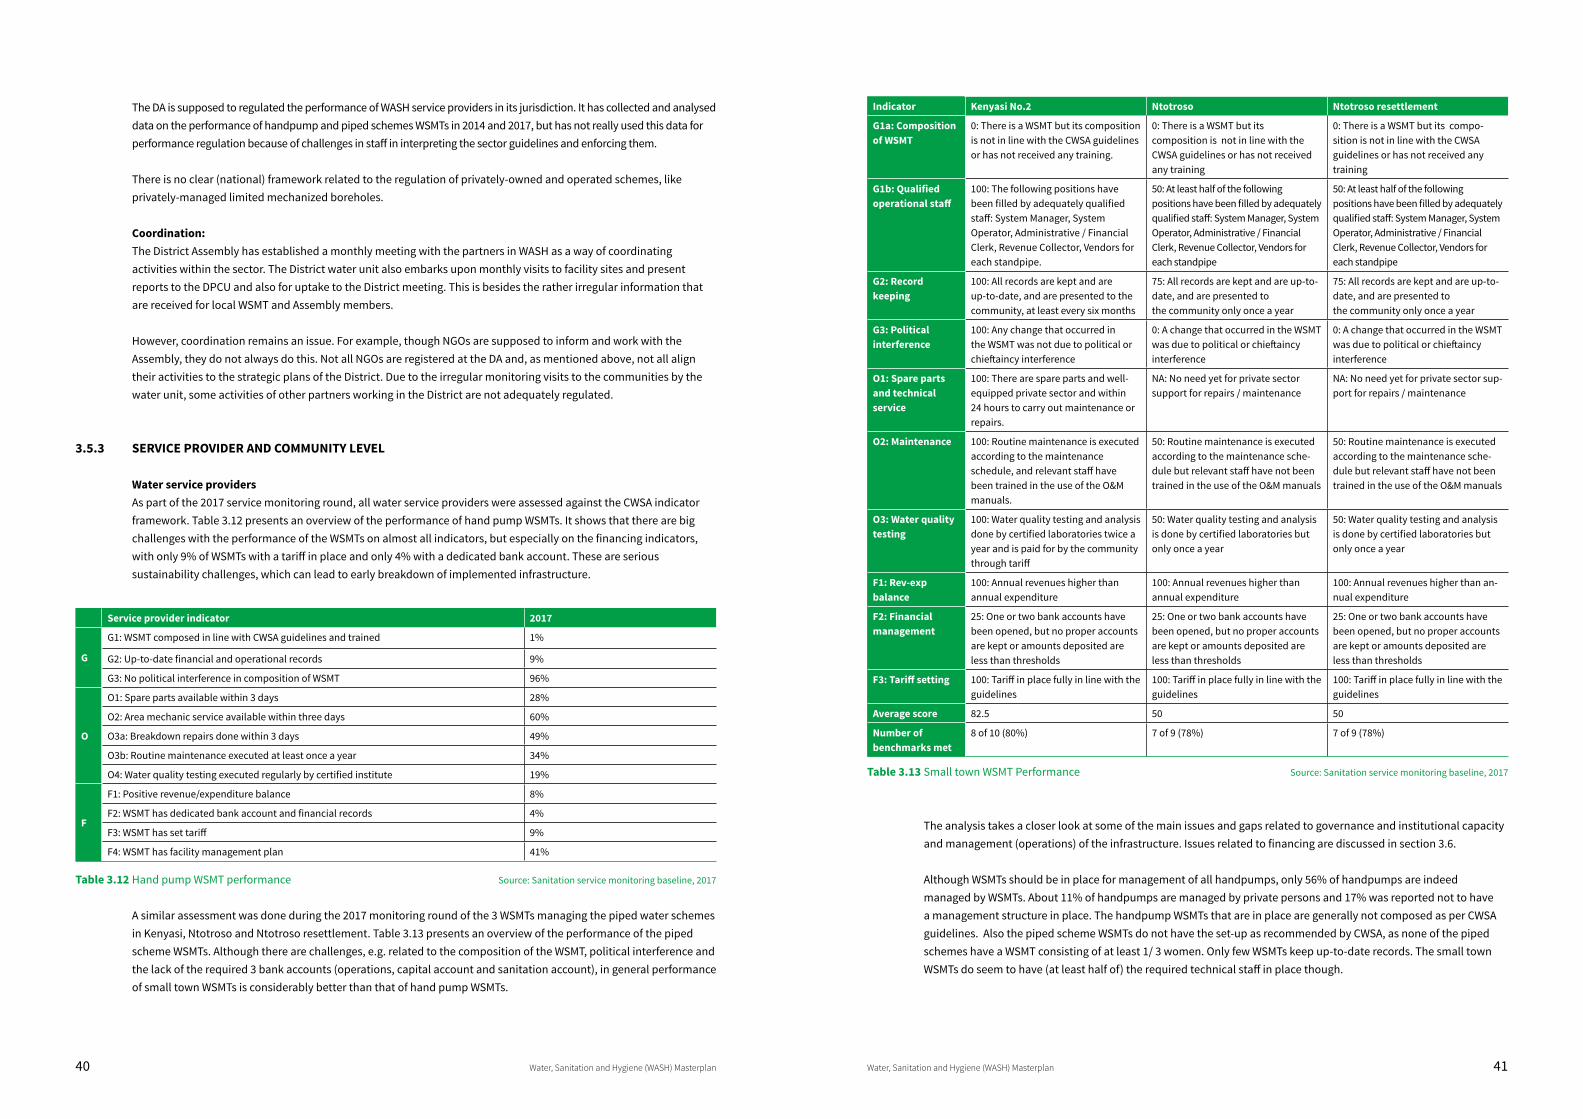
40 Water, Sanitation and Hygiene (WASH) Masterplan Water, Sanitation and Hygiene (WASH) Masterplan 41
The DA is supposed to regulated the performance of WASH service providers in its jurisdiction. It has collected and analysed data on the performance of handpump and piped schemes WSMTs in 2014 and 2017, but has not really used this data for performance regulation because of challenges in staff in interpreting the sector guidelines and enforcing them.
There is no clear (national) framework related to the regulation of privately-owned and operated schemes, like privately-managed limited mechanized boreholes.
Coordination: The District Assembly has established a monthly meeting with the partners in WASH as a way of coordinating activities within the sector. The District water unit also embarks upon monthly visits to facility sites and present reports to the DPCU and also for uptake to the District meeting. This is besides the rather irregular information that are received for local WSMT and Assembly members.
However, coordination remains an issue. For example, though NGOs are supposed to inform and work with the Assembly, they do not always do this. Not all NGOs are registered at the DA and, as mentioned above, not all align their activities to the strategic plans of the District. Due to the irregular monitoring visits to the communities by the water unit, some activities of other partners working in the District are not adequately regulated.
3.5.3 SERVICE PROVIDER AND COMMUNITY LEVEL
Water service providersAs part of the 2017 service monitoring round, all water service providers were assessed against the CWSA indicator framework. Table 3.12 presents an overview of the performance of hand pump WSMTs. It shows that there are big challenges with the performance of the WSMTs on almost all indicators, but especially on the financing indicators, with only 9% of WSMTs with a tariff in place and only 4% with a dedicated bank account. These are serious sustainability challenges, which can lead to early breakdown of implemented infrastructure.
Service provider indicator 2017
G
G1: WSMT composed in line with CWSA guidelines and trained 1%
G2: Up-to-date financial and operational records 9%
G3: No political interference in composition of WSMT 96%
O
O1: Spare parts available within 3 days 28%
O2: Area mechanic service available within three days 60%
O3a: Breakdown repairs done within 3 days 49%
O3b: Routine maintenance executed at least once a year 34%
O4: Water quality testing executed regularly by certified institute 19%
F
F1: Positive revenue/expenditure balance 8%
F2: WSMT has dedicated bank account and financial records 4%
F3: WSMT has set tariff 9%
F4: WSMT has facility management plan 41%
Table 3.12 Hand pump WSMT performance Source: Sanitation service monitoring baseline, 2017
A similar assessment was done during the 2017 monitoring round of the 3 WSMTs managing the piped water schemes in Kenyasi, Ntotroso and Ntotroso resettlement. Table 3.13 presents an overview of the performance of the piped scheme WSMTs. Although there are challenges, e.g. related to the composition of the WSMT, political interference and the lack of the required 3 bank accounts (operations, capital account and sanitation account), in general performance of small town WSMTs is considerably better than that of hand pump WSMTs.
Indicator Kenyasi No.2 Ntotroso Ntotroso resettlement
G1a: Composition of WSMT
0: There is a WSMT but its composition is not in line with the CWSA guidelines or has not received any training.
0: There is a WSMT but its composition is not in line with the CWSA guidelines or has not received any training
0: There is a WSMT but its compo-sition is not in line with the CWSA guidelines or has not received any training
G1b: Qualified operational staff
100: The following positions have been filled by adequately qualified staff: System Manager, System Operator, Administrative / Financial Clerk, Revenue Collector, Vendors for each standpipe.
50: At least half of the following positions have been filled by adequately qualified staff: System Manager, System Operator, Administrative / Financial Clerk, Revenue Collector, Vendors for each standpipe
50: At least half of the following positions have been filled by adequately qualified staff: System Manager, System Operator, Administrative / Financial Clerk, Revenue Collector, Vendors for each standpipe
G2: Record keeping
100: All records are kept and are up-to-date, and are presented to the community, at least every six months
75: All records are kept and are up-to-date, and are presented tothe community only once a year
75: All records are kept and are up-to-date, and are presented tothe community only once a year
G3: Political interference
100: Any change that occurred in the WSMT was not due to political or chieftaincy interference
0: A change that occurred in the WSMT was due to political or chieftaincy interference
0: A change that occurred in the WSMT was due to political or chieftaincy interference
O1: Spare parts and technical service
100: There are spare parts and well-equipped private sector and within 24 hours to carry out maintenance or repairs.
NA: No need yet for private sector support for repairs / maintenance
NA: No need yet for private sector sup-port for repairs / maintenance
O2: Maintenance 100: Routine maintenance is executed according to the maintenance schedule, and relevant staff have been trained in the use of the O&M manuals.
50: Routine maintenance is executed according to the maintenance sche-dule but relevant staff have not been trained in the use of the O&M manuals
50: Routine maintenance is executed according to the maintenance sche-dule but relevant staff have not been trained in the use of the O&M manuals
O3: Water quality testing
100: Water quality testing and analysis done by certified laboratories twice a year and is paid for by the community through tariff
50: Water quality testing and analysis is done by certified laboratories but only once a year
50: Water quality testing and analysis is done by certified laboratories but only once a year
F1: Rev-exp balance
100: Annual revenues higher than annual expenditure
100: Annual revenues higher than annual expenditure
100: Annual revenues higher than an-nual expenditure
F2: Financial management
25: One or two bank accounts have been opened, but no proper accounts are kept or amounts deposited are less than thresholds
25: One or two bank accounts have been opened, but no proper accounts are kept or amounts deposited are less than thresholds
25: One or two bank accounts have been opened, but no proper accounts are kept or amounts deposited are less than thresholds
F3: Tariff setting 100: Tariff in place fully in line with the guidelines
100: Tariff in place fully in line with the guidelines
100: Tariff in place fully in line with the guidelines
Average score 82.5 50 50
Number of benchmarks met
8 of 10 (80%) 7 of 9 (78%) 7 of 9 (78%)
Table 3.13 Small town WSMT Performance Source: Sanitation service monitoring baseline, 2017
The analysis takes a closer look at some of the main issues and gaps related to governance and institutional capacity and management (operations) of the infrastructure. Issues related to financing are discussed in section 3.6.
Although WSMTs should be in place for management of all handpumps, only 56% of handpumps are indeed managed by WSMTs. About 11% of handpumps are managed by private persons and 17% was reported not to have a management structure in place. The handpump WSMTs that are in place are generally not composed as per CWSA guidelines. Also the piped scheme WSMTs do not have the set-up as recommended by CWSA, as none of the piped schemes have a WSMT consisting of at least 1/ 3 women. Only few WSMTs keep up-to-date records. The small town WSMTs do seem to have (at least half of) the required technical staff in place though.
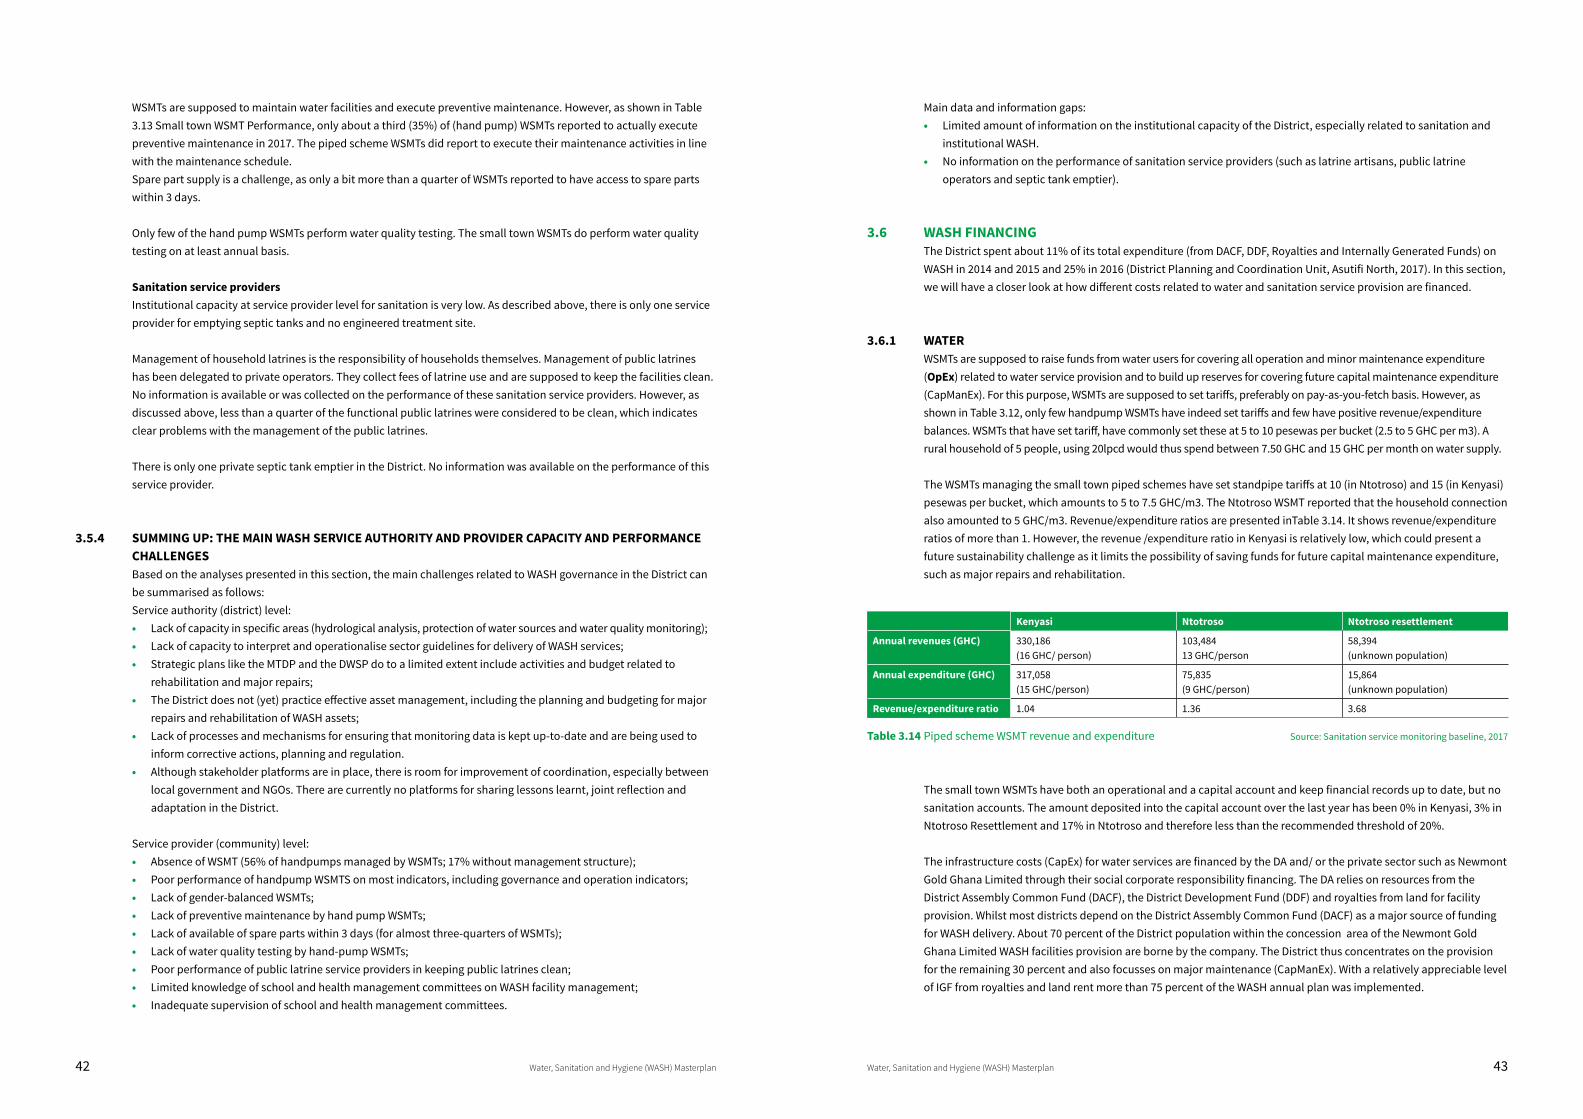
42 Water, Sanitation and Hygiene (WASH) Masterplan Water, Sanitation and Hygiene (WASH) Masterplan 43
WSMTs are supposed to maintain water facilities and execute preventive maintenance. However, as shown in Table 3.13 Small town WSMT Performance, only about a third (35%) of (hand pump) WSMTs reported to actually execute preventive maintenance in 2017. The piped scheme WSMTs did report to execute their maintenance activities in line with the maintenance schedule. Spare part supply is a challenge, as only a bit more than a quarter of WSMTs reported to have access to spare parts within 3 days.
Only few of the hand pump WSMTs perform water quality testing. The small town WSMTs do perform water quality testing on at least annual basis.
Sanitation service providersInstitutional capacity at service provider level for sanitation is very low. As described above, there is only one service provider for emptying septic tanks and no engineered treatment site.
Management of household latrines is the responsibility of households themselves. Management of public latrines has been delegated to private operators. They collect fees of latrine use and are supposed to keep the facilities clean. No information is available or was collected on the performance of these sanitation service providers. However, as discussed above, less than a quarter of the functional public latrines were considered to be clean, which indicates clear problems with the management of the public latrines.
There is only one private septic tank emptier in the District. No information was available on the performance of this service provider.
3.5.4 SUMMING UP: THE MAIN WASH SERVICE AUTHORITY AND PROVIDER CAPACITY AND PERFORMANCE CHALLENGESBased on the analyses presented in this section, the main challenges related to WASH governance in the District can be summarised as follows:Service authority (district) level: • Lack of capacity in specific areas (hydrological analysis, protection of water sources and water quality monitoring);• Lack of capacity to interpret and operationalise sector guidelines for delivery of WASH services;• Strategic plans like the MTDP and the DWSP do to a limited extent include activities and budget related to
rehabilitation and major repairs;• The District does not (yet) practice effective asset management, including the planning and budgeting for major
repairs and rehabilitation of WASH assets;• Lack of processes and mechanisms for ensuring that monitoring data is kept up-to-date and are being used to
inform corrective actions, planning and regulation. • Although stakeholder platforms are in place, there is room for improvement of coordination, especially between
local government and NGOs. There are currently no platforms for sharing lessons learnt, joint reflection and adaptation in the District.
Service provider (community) level: • Absence of WSMT (56% of handpumps managed by WSMTs; 17% without management structure);• Poor performance of handpump WSMTS on most indicators, including governance and operation indicators;• Lack of gender-balanced WSMTs;• Lack of preventive maintenance by hand pump WSMTs;• Lack of available of spare parts within 3 days (for almost three-quarters of WSMTs);• Lack of water quality testing by hand-pump WSMTs;• Poor performance of public latrine service providers in keeping public latrines clean;• Limited knowledge of school and health management committees on WASH facility management;• Inadequate supervision of school and health management committees.
Main data and information gaps: • Limited amount of information on the institutional capacity of the District, especially related to sanitation and
institutional WASH. • No information on the performance of sanitation service providers (such as latrine artisans, public latrine
operators and septic tank emptier).
3.6 WASH FINANCINGThe District spent about 11% of its total expenditure (from DACF, DDF, Royalties and Internally Generated Funds) on WASH in 2014 and 2015 and 25% in 2016 (District Planning and Coordination Unit, Asutifi North, 2017). In this section, we will have a closer look at how different costs related to water and sanitation service provision are financed.
3.6.1 WATERWSMTs are supposed to raise funds from water users for covering all operation and minor maintenance expenditure (OpEx) related to water service provision and to build up reserves for covering future capital maintenance expenditure (CapManEx). For this purpose, WSMTs are supposed to set tariffs, preferably on pay-as-you-fetch basis. However, as shown in Table 3.12, only few handpump WSMTs have indeed set tariffs and few have positive revenue/expenditure balances. WSMTs that have set tariff, have commonly set these at 5 to 10 pesewas per bucket (2.5 to 5 GHC per m3). A rural household of 5 people, using 20lpcd would thus spend between 7.50 GHC and 15 GHC per month on water supply.
The WSMTs managing the small town piped schemes have set standpipe tariffs at 10 (in Ntotroso) and 15 (in Kenyasi) pesewas per bucket, which amounts to 5 to 7.5 GHC/m3. The Ntotroso WSMT reported that the household connection also amounted to 5 GHC/m3. Revenue/expenditure ratios are presented inTable 3.14. It shows revenue/expenditure ratios of more than 1. However, the revenue /expenditure ratio in Kenyasi is relatively low, which could present a future sustainability challenge as it limits the possibility of saving funds for future capital maintenance expenditure, such as major repairs and rehabilitation.
Kenyasi Ntotroso Ntotroso resettlement
Annual revenues (GHC) 330,186 (16 GHC/ person)
103,48413 GHC/person
58,394(unknown population)
Annual expenditure (GHC) 317,058 (15 GHC/person)
75,835(9 GHC/person)
15,864(unknown population)
Revenue/expenditure ratio 1.04 1.36 3.68
Table 3.14 Piped scheme WSMT revenue and expenditure Source: Sanitation service monitoring baseline, 2017
The small town WSMTs have both an operational and a capital account and keep financial records up to date, but no sanitation accounts. The amount deposited into the capital account over the last year has been 0% in Kenyasi, 3% in Ntotroso Resettlement and 17% in Ntotroso and therefore less than the recommended threshold of 20%.
The infrastructure costs (CapEx) for water services are financed by the DA and/ or the private sector such as Newmont Gold Ghana Limited through their social corporate responsibility financing. The DA relies on resources from the District Assembly Common Fund (DACF), the District Development Fund (DDF) and royalties from land for facility provision. Whilst most districts depend on the District Assembly Common Fund (DACF) as a major source of funding for WASH delivery. About 70 percent of the District population within the concession area of the Newmont Gold Ghana Limited WASH facilities provision are borne by the company. The District thus concentrates on the provision for the remaining 30 percent and also focusses on major maintenance (CapManEx). With a relatively appreciable level of IGF from royalties and land rent more than 75 percent of the WASH annual plan was implemented.
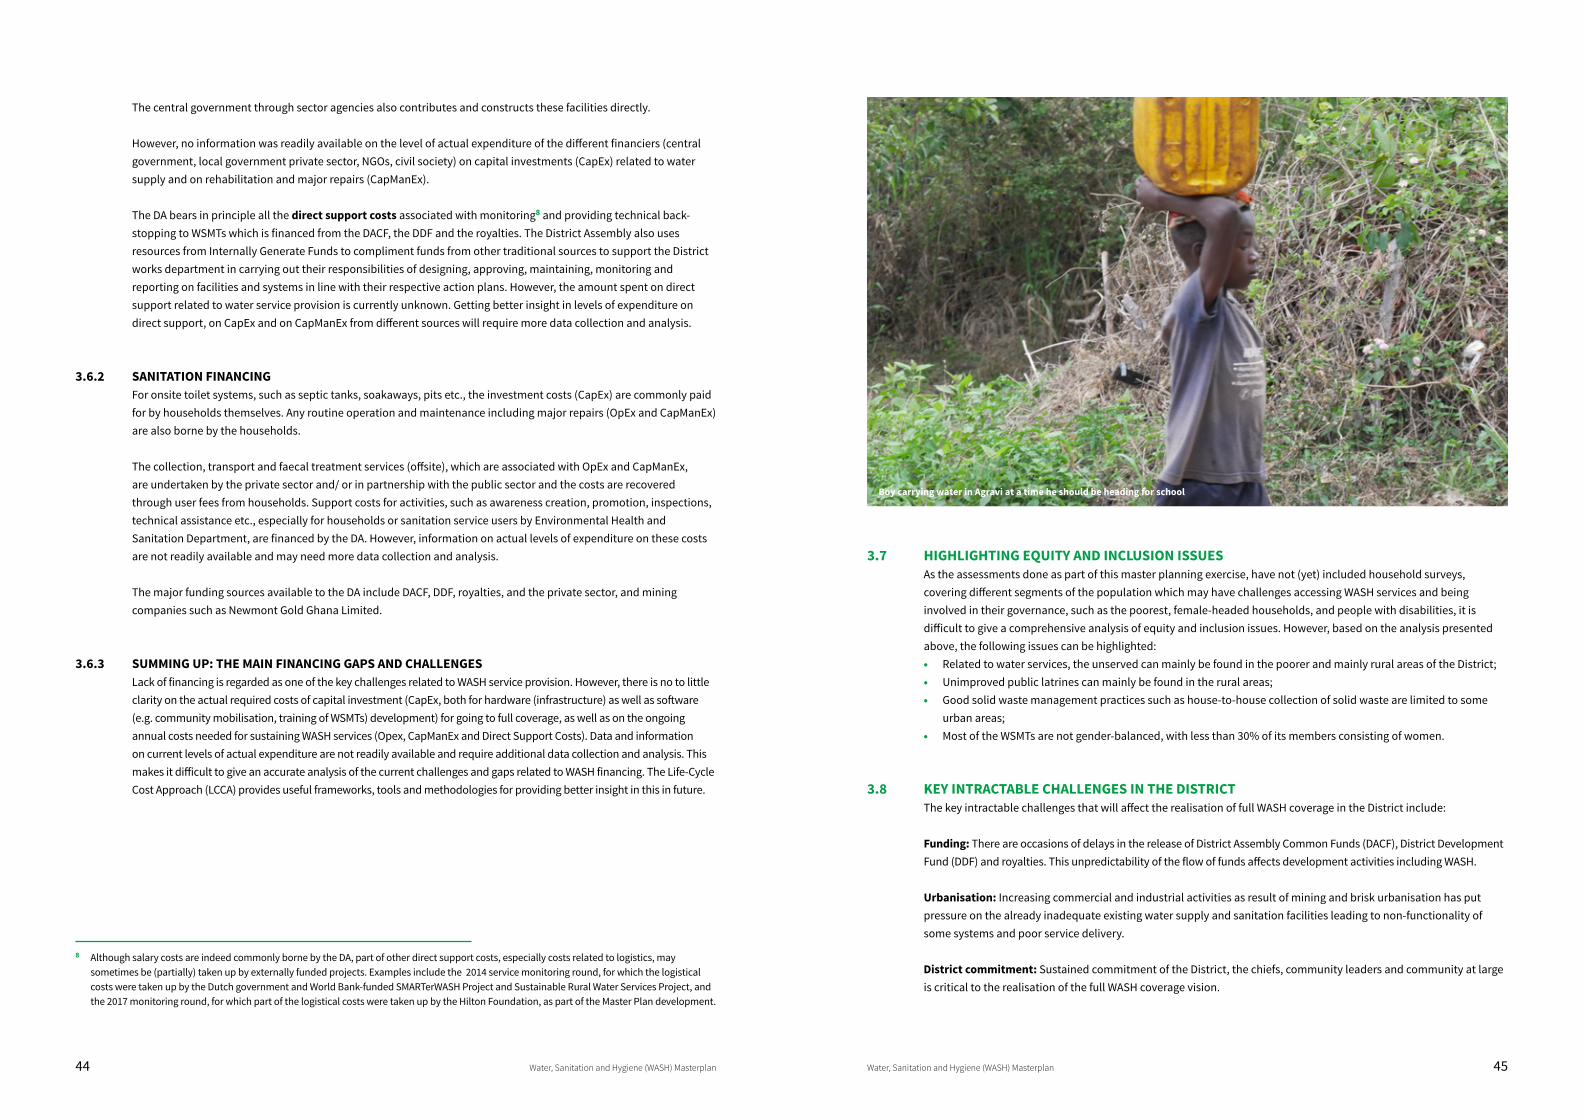
44 Water, Sanitation and Hygiene (WASH) Masterplan Water, Sanitation and Hygiene (WASH) Masterplan 45
The central government through sector agencies also contributes and constructs these facilities directly.
However, no information was readily available on the level of actual expenditure of the different financiers (central government, local government private sector, NGOs, civil society) on capital investments (CapEx) related to water supply and on rehabilitation and major repairs (CapManEx).
The DA bears in principle all the direct support costs associated with monitoring8 and providing technical back-stopping to WSMTs which is financed from the DACF, the DDF and the royalties. The District Assembly also uses resources from Internally Generate Funds to compliment funds from other traditional sources to support the District works department in carrying out their responsibilities of designing, approving, maintaining, monitoring and reporting on facilities and systems in line with their respective action plans. However, the amount spent on direct support related to water service provision is currently unknown. Getting better insight in levels of expenditure on direct support, on CapEx and on CapManEx from different sources will require more data collection and analysis.
3.6.2 SANITATION FINANCINGFor onsite toilet systems, such as septic tanks, soakaways, pits etc., the investment costs (CapEx) are commonly paid for by households themselves. Any routine operation and maintenance including major repairs (OpEx and CapManEx) are also borne by the households.
The collection, transport and faecal treatment services (offsite), which are associated with OpEx and CapManEx, are undertaken by the private sector and/ or in partnership with the public sector and the costs are recovered through user fees from households. Support costs for activities, such as awareness creation, promotion, inspections, technical assistance etc., especially for households or sanitation service users by Environmental Health and Sanitation Department, are financed by the DA. However, information on actual levels of expenditure on these costs are not readily available and may need more data collection and analysis.
The major funding sources available to the DA include DACF, DDF, royalties, and the private sector, and mining companies such as Newmont Gold Ghana Limited.
3.6.3 SUMMING UP: THE MAIN FINANCING GAPS AND CHALLENGESLack of financing is regarded as one of the key challenges related to WASH service provision. However, there is no to little clarity on the actual required costs of capital investment (CapEx, both for hardware (infrastructure) as well as software (e.g. community mobilisation, training of WSMTs) development) for going to full coverage, as well as on the ongoing annual costs needed for sustaining WASH services (Opex, CapManEx and Direct Support Costs). Data and information on current levels of actual expenditure are not readily available and require additional data collection and analysis. This makes it difficult to give an accurate analysis of the current challenges and gaps related to WASH financing. The Life-Cycle Cost Approach (LCCA) provides useful frameworks, tools and methodologies for providing better insight in this in future.
3.7 HIGHLIGHTING EQUITY AND INCLUSION ISSUESAs the assessments done as part of this master planning exercise, have not (yet) included household surveys, covering different segments of the population which may have challenges accessing WASH services and being involved in their governance, such as the poorest, female-headed households, and people with disabilities, it is difficult to give a comprehensive analysis of equity and inclusion issues. However, based on the analysis presented above, the following issues can be highlighted: • Related to water services, the unserved can mainly be found in the poorer and mainly rural areas of the District;• Unimproved public latrines can mainly be found in the rural areas;• Good solid waste management practices such as house-to-house collection of solid waste are limited to some
urban areas; • Most of the WSMTs are not gender-balanced, with less than 30% of its members consisting of women.
3.8 KEY INTRACTABLE CHALLENGES IN THE DISTRICTThe key intractable challenges that will affect the realisation of full WASH coverage in the District include:
Funding: There are occasions of delays in the release of District Assembly Common Funds (DACF), District Development Fund (DDF) and royalties. This unpredictability of the flow of funds affects development activities including WASH.
Urbanisation: Increasing commercial and industrial activities as result of mining and brisk urbanisation has put pressure on the already inadequate existing water supply and sanitation facilities leading to non-functionality of some systems and poor service delivery.
District commitment: Sustained commitment of the District, the chiefs, community leaders and community at large is critical to the realisation of the full WASH coverage vision.
8 Although salary costs are indeed commonly borne by the DA, part of other direct support costs, especially costs related to logistics, may sometimes be (partially) taken up by externally funded projects. Examples include the 2014 service monitoring round, for which the logistical costs were taken up by the Dutch government and World Bank-funded SMARTerWASH Project and Sustainable Rural Water Services Project, and the 2017 monitoring round, for which part of the logistical costs were taken up by the Hilton Foundation, as part of the Master Plan development.
Boy carrying water in Agravi at a time he should be heading for school
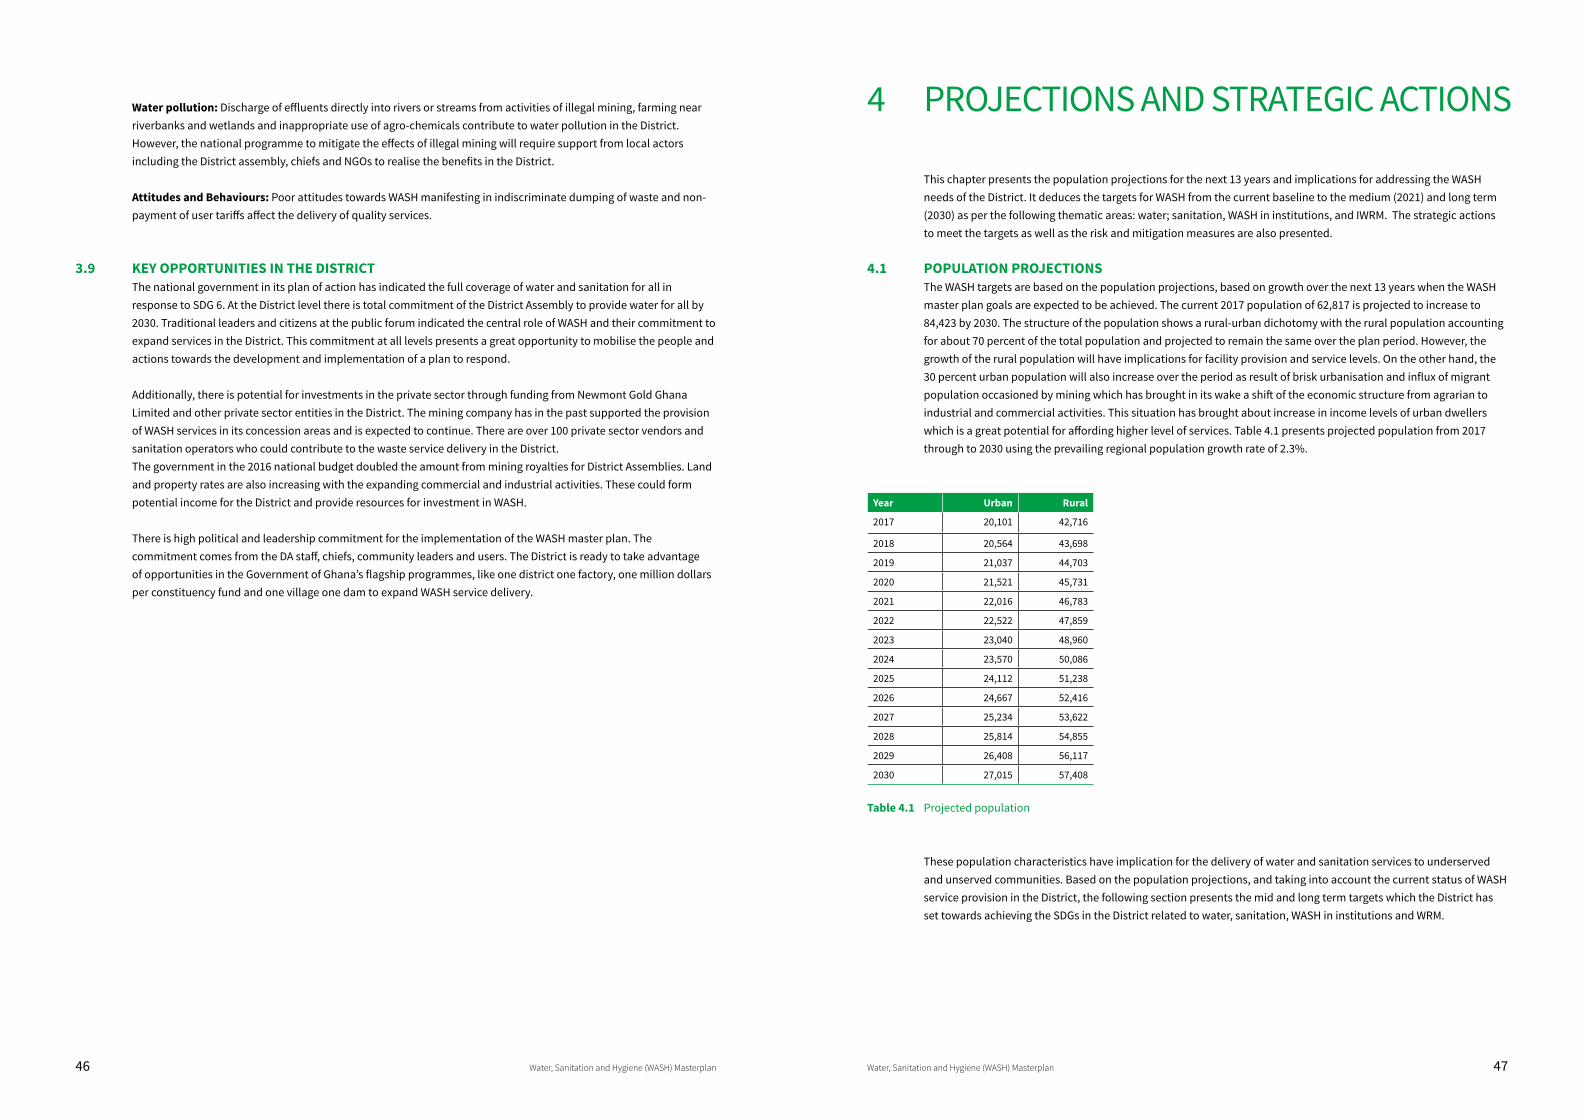
46 Water, Sanitation and Hygiene (WASH) Masterplan Water, Sanitation and Hygiene (WASH) Masterplan 47
Water pollution: Discharge of effluents directly into rivers or streams from activities of illegal mining, farming near riverbanks and wetlands and inappropriate use of agro-chemicals contribute to water pollution in the District. However, the national programme to mitigate the effects of illegal mining will require support from local actors including the District assembly, chiefs and NGOs to realise the benefits in the District.
Attitudes and Behaviours: Poor attitudes towards WASH manifesting in indiscriminate dumping of waste and non-payment of user tariffs affect the delivery of quality services.
3.9 KEY OPPORTUNITIES IN THE DISTRICTThe national government in its plan of action has indicated the full coverage of water and sanitation for all in response to SDG 6. At the District level there is total commitment of the District Assembly to provide water for all by 2030. Traditional leaders and citizens at the public forum indicated the central role of WASH and their commitment to expand services in the District. This commitment at all levels presents a great opportunity to mobilise the people and actions towards the development and implementation of a plan to respond.
Additionally, there is potential for investments in the private sector through funding from Newmont Gold Ghana Limited and other private sector entities in the District. The mining company has in the past supported the provision of WASH services in its concession areas and is expected to continue. There are over 100 private sector vendors and sanitation operators who could contribute to the waste service delivery in the District.The government in the 2016 national budget doubled the amount from mining royalties for District Assemblies. Land and property rates are also increasing with the expanding commercial and industrial activities. These could form potential income for the District and provide resources for investment in WASH.
There is high political and leadership commitment for the implementation of the WASH master plan. The commitment comes from the DA staff, chiefs, community leaders and users. The District is ready to take advantage of opportunities in the Government of Ghana’s flagship programmes, like one district one factory, one million dollars per constituency fund and one village one dam to expand WASH service delivery.
4 PROJECTIONS AND STRATEGIC ACTIONS
This chapter presents the population projections for the next 13 years and implications for addressing the WASH needs of the District. It deduces the targets for WASH from the current baseline to the medium (2021) and long term (2030) as per the following thematic areas: water; sanitation, WASH in institutions, and IWRM. The strategic actions to meet the targets as well as the risk and mitigation measures are also presented.
4.1 POPULATION PROJECTIONS The WASH targets are based on the population projections, based on growth over the next 13 years when the WASH master plan goals are expected to be achieved. The current 2017 population of 62,817 is projected to increase to 84,423 by 2030. The structure of the population shows a rural-urban dichotomy with the rural population accounting for about 70 percent of the total population and projected to remain the same over the plan period. However, the growth of the rural population will have implications for facility provision and service levels. On the other hand, the 30 percent urban population will also increase over the period as result of brisk urbanisation and influx of migrant population occasioned by mining which has brought in its wake a shift of the economic structure from agrarian to industrial and commercial activities. This situation has brought about increase in income levels of urban dwellers which is a great potential for affording higher level of services. Table 4.1 presents projected population from 2017 through to 2030 using the prevailing regional population growth rate of 2.3%.
Year Urban Rural
2017 20,101 42,716
2018 20,564 43,698
2019 21,037 44,703
2020 21,521 45,731
2021 22,016 46,783
2022 22,522 47,859
2023 23,040 48,960
2024 23,570 50,086
2025 24,112 51,238
2026 24,667 52,416
2027 25,234 53,622
2028 25,814 54,855
2029 26,408 56,117
2030 27,015 57,408
Table 4.1 Projected population
These population characteristics have implication for the delivery of water and sanitation services to underserved and unserved communities. Based on the population projections, and taking into account the current status of WASH service provision in the District, the following section presents the mid and long term targets which the District has set towards achieving the SDGs in the District related to water, sanitation, WASH in institutions and WRM.
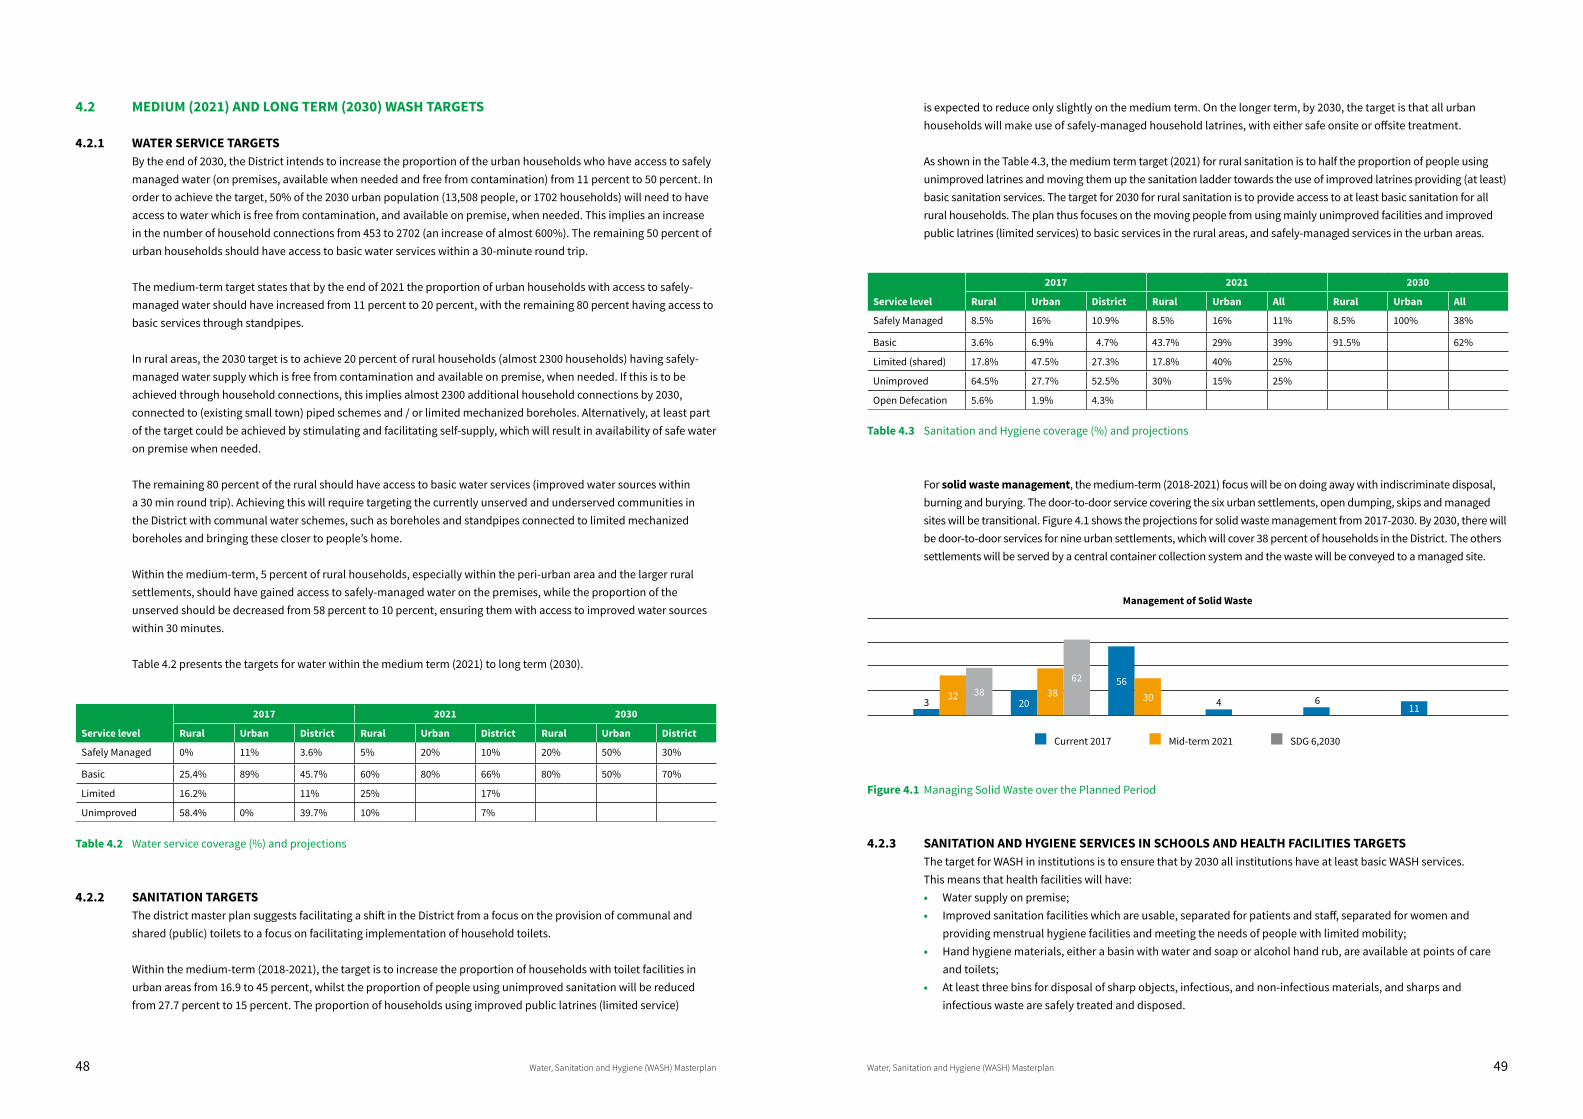
48 Water, Sanitation and Hygiene (WASH) Masterplan Water, Sanitation and Hygiene (WASH) Masterplan 49
4.2 MEDIUM (2021) AND LONG TERM (2030) WASH TARGETS
4.2.1 WATER SERVICE TARGETSBy the end of 2030, the District intends to increase the proportion of the urban households who have access to safely managed water (on premises, available when needed and free from contamination) from 11 percent to 50 percent. In order to achieve the target, 50% of the 2030 urban population (13,508 people, or 1702 households) will need to have access to water which is free from contamination, and available on premise, when needed. This implies an increase in the number of household connections from 453 to 2702 (an increase of almost 600%). The remaining 50 percent of urban households should have access to basic water services within a 30-minute round trip.
The medium-term target states that by the end of 2021 the proportion of urban households with access to safely-managed water should have increased from 11 percent to 20 percent, with the remaining 80 percent having access to basic services through standpipes.
In rural areas, the 2030 target is to achieve 20 percent of rural households (almost 2300 households) having safely-managed water supply which is free from contamination and available on premise, when needed. If this is to be achieved through household connections, this implies almost 2300 additional household connections by 2030, connected to (existing small town) piped schemes and / or limited mechanized boreholes. Alternatively, at least part of the target could be achieved by stimulating and facilitating self-supply, which will result in availability of safe water on premise when needed.
The remaining 80 percent of the rural should have access to basic water services (improved water sources within a 30 min round trip). Achieving this will require targeting the currently unserved and underserved communities in the District with communal water schemes, such as boreholes and standpipes connected to limited mechanized boreholes and bringing these closer to people’s home.
Within the medium-term, 5 percent of rural households, especially within the peri-urban area and the larger rural settlements, should have gained access to safely-managed water on the premises, while the proportion of the unserved should be decreased from 58 percent to 10 percent, ensuring them with access to improved water sources within 30 minutes.
Table 4.2 presents the targets for water within the medium term (2021) to long term (2030).
Service level
2017 2021 2030
Rural Urban District Rural Urban District Rural Urban District
Safely Managed 0% 11% 3.6% 5% 20% 10% 20% 50% 30%
Basic 25.4% 89% 45.7% 60% 80% 66% 80% 50% 70%
Limited 16.2% 11% 25% 17%
Unimproved 58.4% 0% 39.7% 10% 7%
Table 4.2 Water service coverage (%) and projections
4.2.2 SANITATION TARGETSThe district master plan suggests facilitating a shift in the District from a focus on the provision of communal and shared (public) toilets to a focus on facilitating implementation of household toilets.
Within the medium-term (2018-2021), the target is to increase the proportion of households with toilet facilities in urban areas from 16.9 to 45 percent, whilst the proportion of people using unimproved sanitation will be reduced from 27.7 percent to 15 percent. The proportion of households using improved public latrines (limited service)
is expected to reduce only slightly on the medium term. On the longer term, by 2030, the target is that all urban households will make use of safely-managed household latrines, with either safe onsite or offsite treatment.
As shown in the Table 4.3, the medium term target (2021) for rural sanitation is to half the proportion of people using unimproved latrines and moving them up the sanitation ladder towards the use of improved latrines providing (at least) basic sanitation services. The target for 2030 for rural sanitation is to provide access to at least basic sanitation for all rural households. The plan thus focuses on the moving people from using mainly unimproved facilities and improved public latrines (limited services) to basic services in the rural areas, and safely-managed services in the urban areas.
Service level
2017 2021 2030
Rural Urban District Rural Urban All Rural Urban All
Safely Managed 8.5% 16% 10.9% 8.5% 16% 11% 8.5% 100% 38%
Basic 3.6% 6.9% 4.7% 43.7% 29% 39% 91.5% 62%
Limited (shared) 17.8% 47.5% 27.3% 17.8% 40% 25%
Unimproved 64.5% 27.7% 52.5% 30% 15% 25%
Open Defecation 5.6% 1.9% 4.3%
Table 4.3 Sanitation and Hygiene coverage (%) and projections
For solid waste management, the medium-term (2018-2021) focus will be on doing away with indiscriminate disposal, burning and burying. The door-to-door service covering the six urban settlements, open dumping, skips and managed sites will be transitional. Figure 4.1 shows the projections for solid waste management from 2017-2030. By 2030, there will be door-to-door services for nine urban settlements, which will cover 38 percent of households in the District. The others settlements will be served by a central container collection system and the waste will be conveyed to a managed site.
Figure 4.1 Managing Solid Waste over the Planned Period
4.2.3 SANITATION AND HYGIENE SERVICES IN SCHOOLS AND HEALTH FACILITIES TARGETSThe target for WASH in institutions is to ensure that by 2030 all institutions have at least basic WASH services. This means that health facilities will have: • Water supply on premise;• Improved sanitation facilities which are usable, separated for patients and staff, separated for women and
providing menstrual hygiene facilities and meeting the needs of people with limited mobility;• Hand hygiene materials, either a basin with water and soap or alcohol hand rub, are available at points of care
and toilets;• At least three bins for disposal of sharp objects, infectious, and non-infectious materials, and sharps and
infectious waste are safely treated and disposed.
3 3220
3856
30
6238
4 611
Management of Solid Waste
Current 2017 Mid-term 2021 SDG 6,2030
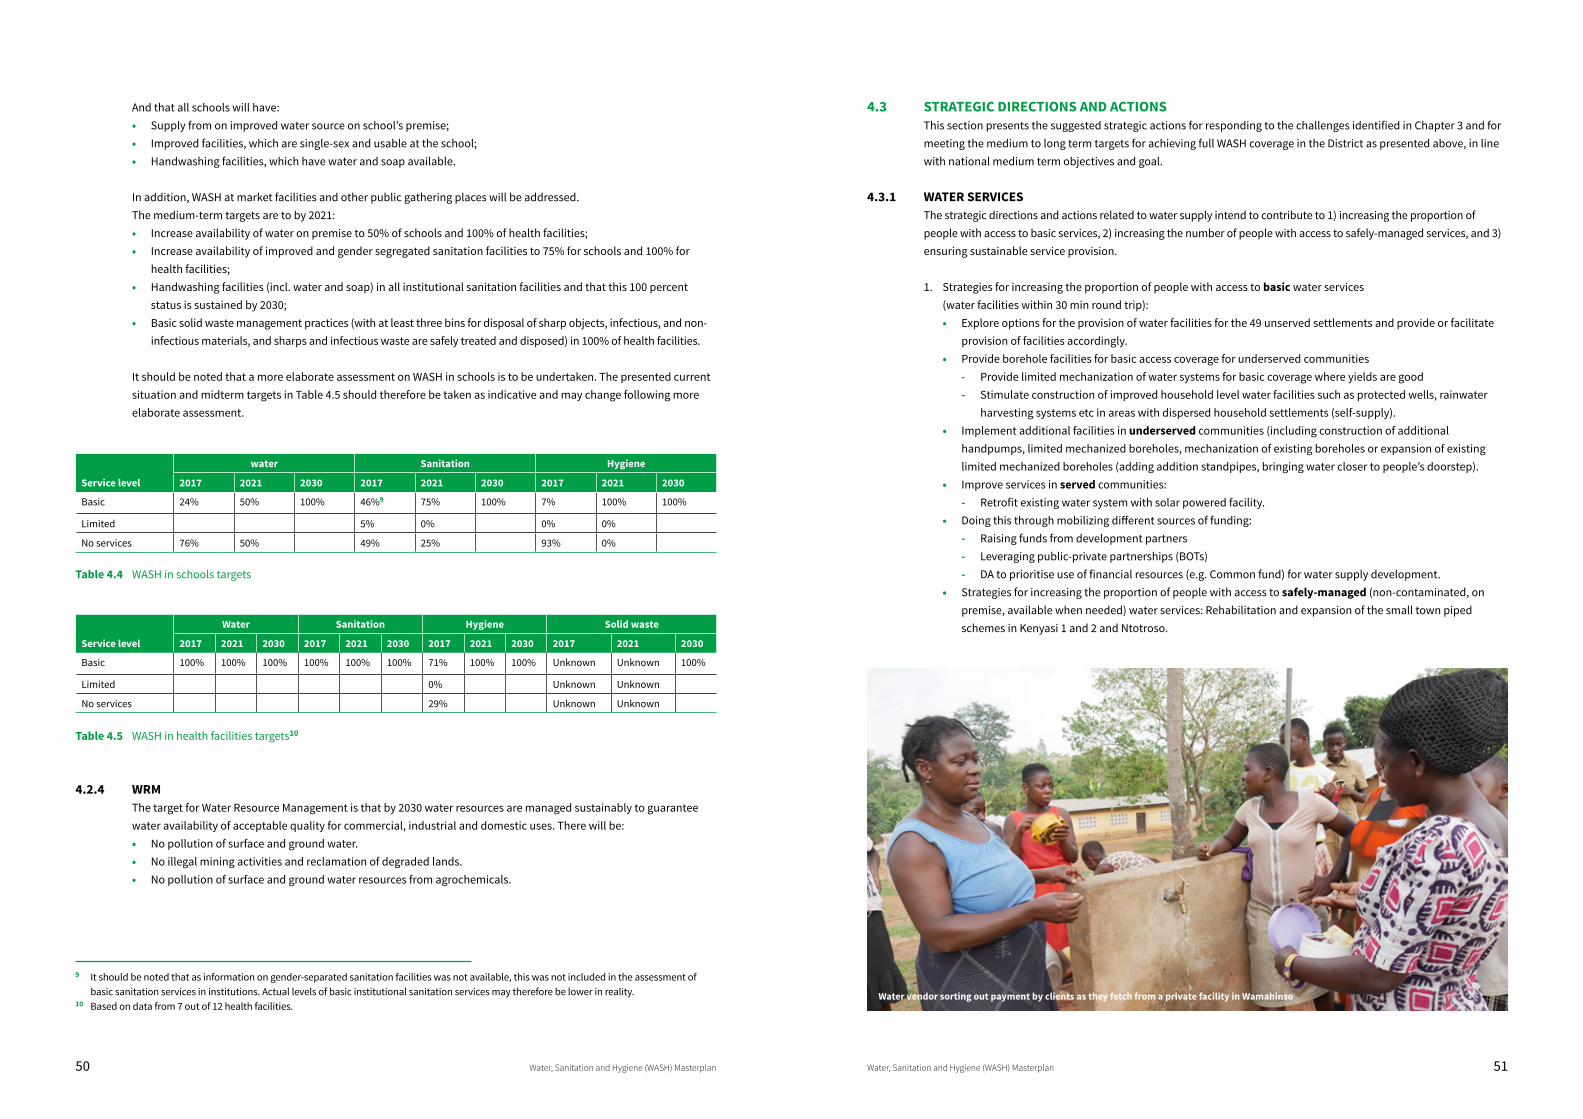
50 Water, Sanitation and Hygiene (WASH) Masterplan Water, Sanitation and Hygiene (WASH) Masterplan 51
And that all schools will have: • Supply from on improved water source on school’s premise;• Improved facilities, which are single-sex and usable at the school;• Handwashing facilities, which have water and soap available.
In addition, WASH at market facilities and other public gathering places will be addressed. The medium-term targets are to by 2021: • Increase availability of water on premise to 50% of schools and 100% of health facilities;• Increase availability of improved and gender segregated sanitation facilities to 75% for schools and 100% for
health facilities;• Handwashing facilities (incl. water and soap) in all institutional sanitation facilities and that this 100 percent
status is sustained by 2030;• Basic solid waste management practices (with at least three bins for disposal of sharp objects, infectious, and non-
infectious materials, and sharps and infectious waste are safely treated and disposed) in 100% of health facilities.
It should be noted that a more elaborate assessment on WASH in schools is to be undertaken. The presented current situation and midterm targets in Table 4.5 should therefore be taken as indicative and may change following more elaborate assessment.
Service level
water Sanitation Hygiene
2017 2021 2030 2017 2021 2030 2017 2021 2030
Basic 24% 50% 100% 46%9 75% 100% 7% 100% 100%
Limited 5% 0% 0% 0%
No services 76% 50% 49% 25% 93% 0%
Table 4.4 WASH in schools targets
Service level
Water Sanitation Hygiene Solid waste
2017 2021 2030 2017 2021 2030 2017 2021 2030 2017 2021 2030
Basic 100% 100% 100% 100% 100% 100% 71% 100% 100% Unknown Unknown 100%
Limited 0% Unknown Unknown
No services 29% Unknown Unknown
Table 4.5 WASH in health facilities targets10
4.2.4 WRMThe target for Water Resource Management is that by 2030 water resources are managed sustainably to guarantee water availability of acceptable quality for commercial, industrial and domestic uses. There will be: • No pollution of surface and ground water.• No illegal mining activities and reclamation of degraded lands. • No pollution of surface and ground water resources from agrochemicals.
4.3 STRATEGIC DIRECTIONS AND ACTIONS This section presents the suggested strategic actions for responding to the challenges identified in Chapter 3 and for meeting the medium to long term targets for achieving full WASH coverage in the District as presented above, in line with national medium term objectives and goal.
4.3.1 WATER SERVICESThe strategic directions and actions related to water supply intend to contribute to 1) increasing the proportion of people with access to basic services, 2) increasing the number of people with access to safely-managed services, and 3) ensuring sustainable service provision.
1. Strategies for increasing the proportion of people with access to basic water services (water facilities within 30 min round trip): • Explore options for the provision of water facilities for the 49 unserved settlements and provide or facilitate
provision of facilities accordingly. • Provide borehole facilities for basic access coverage for underserved communities
- Provide limited mechanization of water systems for basic coverage where yields are good- Stimulate construction of improved household level water facilities such as protected wells, rainwater
harvesting systems etc in areas with dispersed household settlements (self-supply).• Implement additional facilities in underserved communities (including construction of additional
handpumps, limited mechanized boreholes, mechanization of existing boreholes or expansion of existing limited mechanized boreholes (adding addition standpipes, bringing water closer to people’s doorstep).
• Improve services in served communities:- Retrofit existing water system with solar powered facility.
• Doing this through mobilizing different sources of funding: - Raising funds from development partners- Leveraging public-private partnerships (BOTs)- DA to prioritise use of financial resources (e.g. Common fund) for water supply development.
• Strategies for increasing the proportion of people with access to safely-managed (non-contaminated, on premise, available when needed) water services: Rehabilitation and expansion of the small town piped schemes in Kenyasi 1 and 2 and Ntotroso.
9 It should be noted that as information on gender-separated sanitation facilities was not available, this was not included in the assessment of basic sanitation services in institutions. Actual levels of basic institutional sanitation services may therefore be lower in reality.
10 Based on data from 7 out of 12 health facilities. Water vendor sorting out payment by clients as they fetch from a private facility in Wamahinso
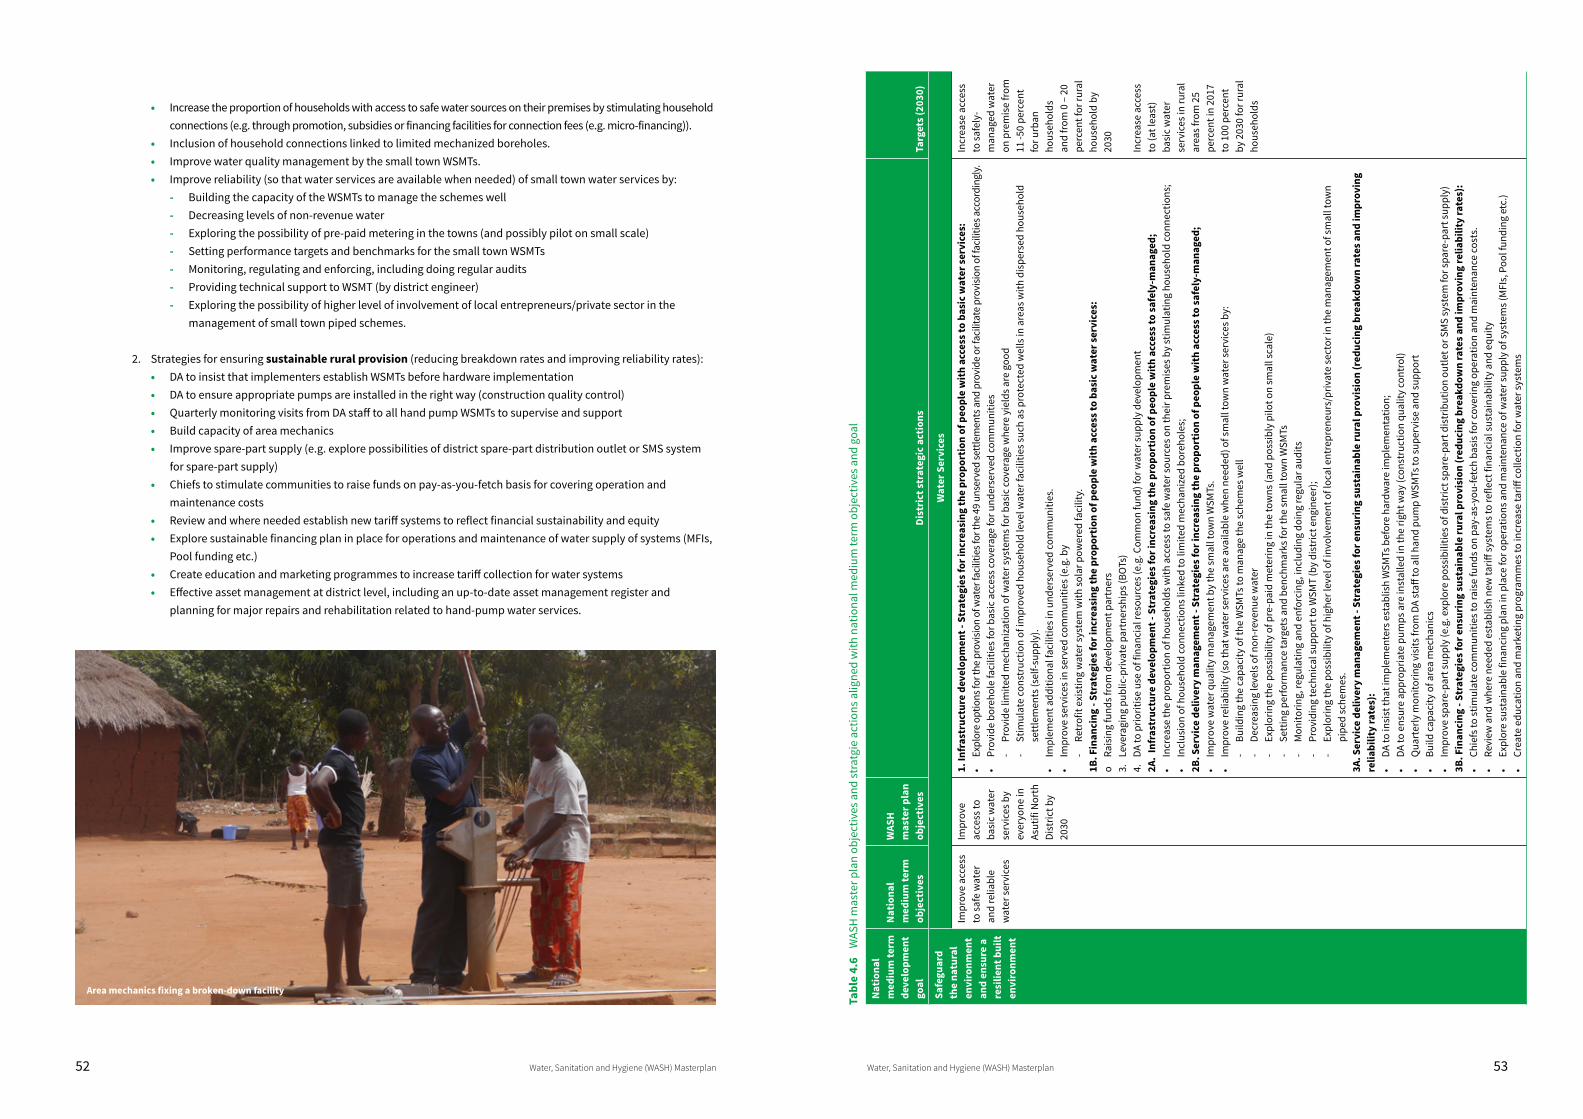
52 Water, Sanitation and Hygiene (WASH) Masterplan Water, Sanitation and Hygiene (WASH) Masterplan 53
• Increase the proportion of households with access to safe water sources on their premises by stimulating household connections (e.g. through promotion, subsidies or financing facilities for connection fees (e.g. micro-financing)).
• Inclusion of household connections linked to limited mechanized boreholes.• Improve water quality management by the small town WSMTs.• Improve reliability (so that water services are available when needed) of small town water services by:
- Building the capacity of the WSMTs to manage the schemes well- Decreasing levels of non-revenue water- Exploring the possibility of pre-paid metering in the towns (and possibly pilot on small scale)- Setting performance targets and benchmarks for the small town WSMTs- Monitoring, regulating and enforcing, including doing regular audits- Providing technical support to WSMT (by district engineer)- Exploring the possibility of higher level of involvement of local entrepreneurs/private sector in the
management of small town piped schemes.
2. Strategies for ensuring sustainable rural provision (reducing breakdown rates and improving reliability rates):• DA to insist that implementers establish WSMTs before hardware implementation• DA to ensure appropriate pumps are installed in the right way (construction quality control)• Quarterly monitoring visits from DA staff to all hand pump WSMTs to supervise and support• Build capacity of area mechanics• Improve spare-part supply (e.g. explore possibilities of district spare-part distribution outlet or SMS system
for spare-part supply)• Chiefs to stimulate communities to raise funds on pay-as-you-fetch basis for covering operation and
maintenance costs• Review and where needed establish new tariff systems to reflect financial sustainability and equity• Explore sustainable financing plan in place for operations and maintenance of water supply of systems (MFIs,
Pool funding etc.)• Create education and marketing programmes to increase tariff collection for water systems• Effective asset management at district level, including an up-to-date asset management register and
planning for major repairs and rehabilitation related to hand-pump water services.
Tabl
e 4.
6 W
ASH
mas
ter p
lan
obje
ctiv
es a
nd st
ratg
ie a
ctio
ns a
ligne
d w
ith n
atio
nal m
ediu
m te
rm o
bjec
tives
and
goa
l
Nat
iona
l m
ediu
m te
rm
deve
lopm
ent
goal
Nat
iona
l m
ediu
m te
rm
obje
ctiv
es
WAS
H
mas
ter p
lan
obje
ctiv
esDi
stri
ct st
rate
gic
actio
nsTa
rget
s (20
30)
Safe
guar
d th
e na
tura
l en
viro
nmen
t an
d en
sure
a
resi
lient
bui
lt
envi
ronm
ent
Wat
er S
ervi
ces
Impr
ove
acce
ss
to sa
fe w
ater
an
d re
liabl
e w
ater
serv
ices
Impr
ove
acce
ss to
ba
sic
wat
er
serv
ices
by
ever
yone
in
Asut
ifi N
orth
Di
stric
t by
2030
1. In
fras
truc
ture
dev
elop
men
t - S
trat
egie
s for
incr
easi
ng th
e pr
opor
tion
of p
eopl
e w
ith a
cces
s to
basi
c w
ater
serv
ices
: •
Expl
ore
optio
ns fo
r the
pro
visio
n of
wat
er fa
cilit
ies f
or th
e 49
uns
erve
d se
ttlem
ents
and
pro
vide
or f
acili
tate
pro
visio
n of
faci
litie
s acc
ordi
ngly
. •
Prov
ide
bore
hole
faci
litie
s for
bas
ic a
cces
s cov
erag
e fo
r und
erse
rved
com
mun
ities
- Pr
ovid
e lim
ited
mec
hani
zatio
n of
wat
er sy
stem
s for
bas
ic c
over
age
whe
re y
ield
s are
goo
d-
Stim
ulat
e co
nstr
uctio
n of
impr
oved
hou
seho
ld le
vel w
ater
faci
litie
s suc
h as
pro
tect
ed w
ells
in a
reas
with
dis
pers
ed h
ouse
hold
se
ttle
men
ts (s
elf-s
uppl
y).
• Im
plem
ent a
dditi
onal
faci
litie
s in
unde
rser
ved
com
mun
ities
. •
Impr
ove
serv
ices
in se
rved
com
mun
ities
(e.g
. by
- Re
trof
it ex
istin
g w
ater
syst
em w
ith so
lar p
ower
ed fa
cilit
y.
1B. F
inan
cing
- St
rate
gies
for i
ncre
asin
g th
e pr
opor
tion
of p
eopl
e w
ith a
cces
s to
basi
c w
ater
serv
ices
:o
Rais
ing
fund
s fro
m d
evel
opm
ent p
artn
ers
3.
Leve
ragi
ng p
ublic
-priv
ate
part
ners
hips
(BO
Ts)
4.
DA to
prio
ritis
e us
e of
fina
ncia
l res
ourc
es (e
.g. C
omm
on fu
nd) f
or w
ater
supp
ly d
evel
opm
ent
2A.
Infr
astr
uctu
re d
evel
opm
ent -
Str
ateg
ies f
or in
crea
sing
the
prop
ortio
n of
peo
ple
with
acc
ess t
o sa
fely
-man
aged
; •
Incr
ease
the
prop
ortio
n of
hou
seho
lds w
ith a
cces
s to
safe
wat
er so
urce
s on
thei
r pre
mis
es b
y st
imul
atin
g ho
useh
old
conn
ectio
ns;
• In
clus
ion
of h
ouse
hold
con
nect
ions
link
ed to
lim
ited
mec
hani
zed
bore
hole
s;2B
. Ser
vice
del
iver
y m
anag
emen
t - S
trat
egie
s for
incr
easi
ng th
e pr
opor
tion
of p
eopl
e w
ith a
cces
s to
safe
ly-m
anag
ed;
• Im
prov
e w
ater
qua
lity
man
agem
ent b
y th
e sm
all t
own
WSM
Ts.
• Im
prov
e re
liabi
lity
(so
that
wat
er se
rvic
es a
re a
vaila
ble
whe
n ne
eded
) of s
mal
l tow
n w
ater
serv
ices
by:
-
Build
ing
the
capa
city
of t
he W
SMTs
to m
anag
e th
e sc
hem
es w
ell
- De
crea
sing
leve
ls o
f non
-rev
enue
wat
er-
Expl
orin
g th
e po
ssib
ility
of p
re-p
aid
met
erin
g in
the
tow
ns (a
nd p
ossi
bly
pilo
t on
smal
l sca
le)
- Se
ttin
g pe
rform
ance
targ
ets a
nd b
ench
mar
ks fo
r the
smal
l tow
n W
SMTs
- M
onito
ring,
regu
latin
g an
d en
forc
ing,
incl
udin
g do
ing
regu
lar a
udits
- Pr
ovid
ing
tech
nica
l sup
port
to W
SMT
(by
dist
rict e
ngin
eer)
;-
Expl
orin
g th
e po
ssib
ility
of h
ighe
r lev
el o
f inv
olve
men
t of l
ocal
ent
repr
eneu
rs/p
rivat
e se
ctor
in th
e m
anag
emen
t of s
mal
l tow
n pi
ped
sche
mes
. 3A
. Ser
vice
del
iver
y m
anag
emen
t - S
trat
egie
s for
ens
urin
g su
stai
nabl
e ru
ral p
rovi
sion
(red
ucin
g br
eakd
own
rate
s and
impr
ovin
g re
liabi
lity
rate
s):
• DA
to in
sist
that
impl
emen
ters
est
ablis
h W
SMTs
bef
ore
hard
war
e im
plem
enta
tion;
• DA
to e
nsur
e ap
prop
riate
pum
ps a
re in
stal
led
in th
e rig
ht w
ay (c
onst
ruct
ion
qual
ity c
ontr
ol)
• Q
uart
erly
mon
itorin
g vi
sits
from
DA
staff
to a
ll ha
nd p
ump
WSM
Ts to
supe
rvis
e an
d su
ppor
t•
Build
cap
acity
of a
rea
mec
hani
cs•
Impr
ove
spar
e-pa
rt su
pply
(e.g
. exp
lore
pos
sibi
litie
s of d
istr
ict s
pare
-par
t dis
trib
utio
n ou
tlet o
r SM
S sy
stem
for s
pare
-par
t sup
ply)
3B. F
inan
cing
- St
rate
gies
for e
nsur
ing
sust
aina
ble
rura
l pro
visi
on (r
educ
ing
brea
kdow
n ra
tes a
nd im
prov
ing
relia
bilit
y ra
tes)
:•
Chie
fs to
stim
ulat
e co
mm
uniti
es to
rais
e fu
nds o
n pa
y-as
-you
-fetc
h ba
sis f
or c
over
ing
oper
atio
n an
d m
aint
enan
ce c
osts
.•
Revi
ew a
nd w
here
nee
ded
esta
blis
h ne
w ta
riff sy
stem
s to
refle
ct fi
nanc
ial s
usta
inab
ility
and
equ
ity•
Expl
ore
sust
aina
ble
finan
cing
pla
n in
pla
ce fo
r ope
ratio
ns a
nd m
aint
enan
ce o
f wat
er su
pply
of s
yste
ms (
MFI
s, P
ool f
undi
ng e
tc.)
• Cr
eate
edu
catio
n an
d m
arke
ting
prog
ram
mes
to in
crea
se ta
riff c
olle
ctio
n fo
r wat
er sy
stem
s
Incr
ease
acc
ess
to sa
fely
-m
anag
ed w
ater
on
pre
mis
e fro
m
11 -5
0 pe
rcen
t fo
r urb
an
hous
ehol
ds
and
from
0 –
20
perc
ent f
or ru
ral
hous
ehol
d by
20
30
Incr
ease
acc
ess
to (a
t lea
st)
basi
c w
ater
se
rvic
es in
rura
l ar
eas f
rom
25
perc
ent i
n 20
17
to 1
00 p
erce
nt
by 2
030
for r
ural
ho
useh
olds
Area mechanics fixing a broken-down facility
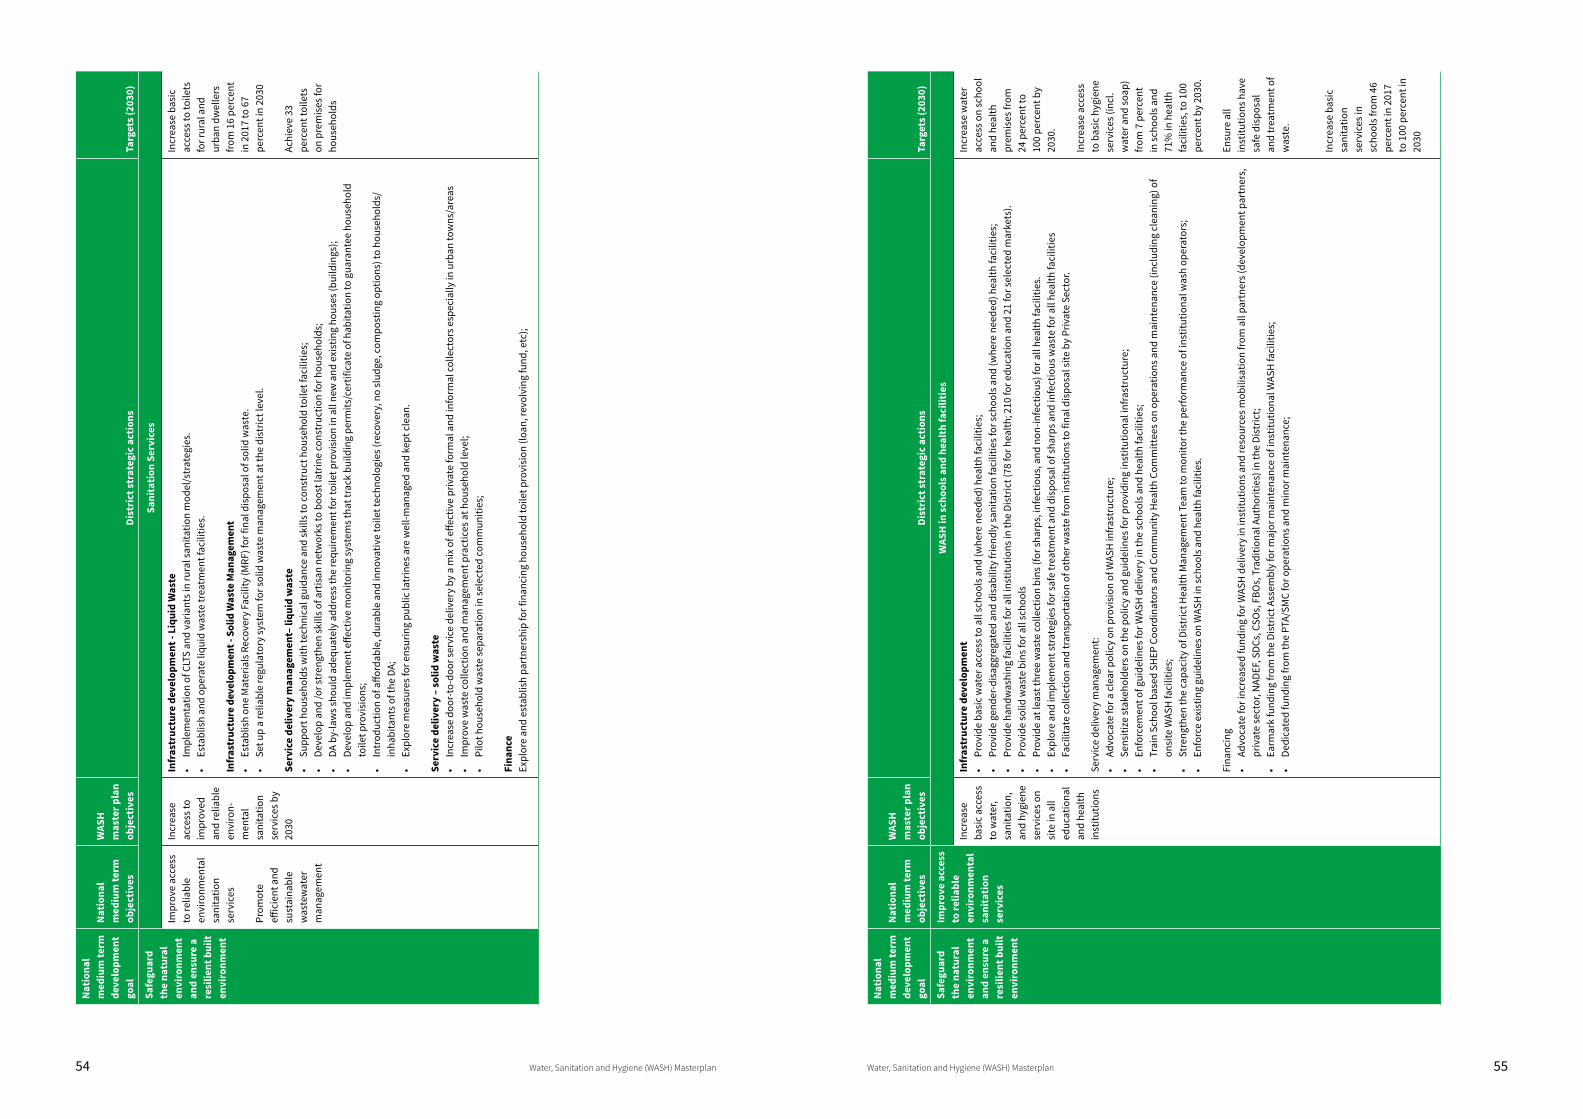
54 Water, Sanitation and Hygiene (WASH) Masterplan Water, Sanitation and Hygiene (WASH) Masterplan 55
Nat
iona
l m
ediu
m te
rm
deve
lopm
ent
goal
Nat
iona
l m
ediu
m te
rm
obje
ctiv
es
WAS
H
mas
ter p
lan
obje
ctiv
esDi
stri
ct st
rate
gic
actio
nsTa
rget
s (20
30)
Safe
guar
d th
e na
tura
l en
viro
nmen
t an
d en
sure
a
resi
lient
bui
lt
envi
ronm
ent
Sani
tatio
n Se
rvic
es
Impr
ove
acce
ss
to re
liabl
e en
viro
nmen
tal
sani
tatio
n se
rvic
es
Prom
ote
effic
ient
and
su
stai
nabl
e w
aste
wat
er
man
agem
ent
Incr
ease
ac
cess
to
impr
oved
an
d re
liabl
e en
viro
n-m
enta
l sa
nita
tion
serv
ices
by
2030
Infr
astr
uctu
re d
evel
opm
ent -
Liq
uid
Was
te•
Impl
emen
tatio
n of
CLT
S an
d va
riant
s in
rura
l san
itatio
n m
odel
/str
ateg
ies.
• Es
tabl
ish
and
oper
ate
liqui
d w
aste
trea
tmen
t fac
ilitie
s.
Infr
astr
uctu
re d
evel
opm
ent -
Sol
id W
aste
Man
agem
ent
• Es
tabl
ish
one
Mat
eria
ls R
ecov
ery
Faci
lity
(MRF
) for
fina
l dis
posa
l of s
olid
was
te.
• Se
t up
a re
liabl
e re
gula
tory
syst
em fo
r sol
id w
aste
man
agem
ent a
t the
dis
tric
t lev
el.
Serv
ice
deliv
ery
man
agem
ent–
liqu
id w
aste
• Su
ppor
t hou
seho
lds w
ith te
chni
cal g
uida
nce
and
skill
s to
cons
truc
t hou
seho
ld to
ilet f
acili
ties;
• De
velo
p an
d /o
r str
engt
hen
skill
s of a
rtis
an n
etw
orks
to b
oost
latr
ine
cons
truc
tion
for h
ouse
hold
s;•
DA b
y-la
ws s
houl
d ad
equa
tely
add
ress
the
requ
irem
ent f
or to
ilet p
rovi
sion
in a
ll ne
w a
nd e
xist
ing
hous
es (b
uild
ings
);•
Deve
lop
and
impl
emen
t effe
ctiv
e m
onito
ring
syst
ems t
hat t
rack
bui
ldin
g pe
rmits
/cer
tific
ate
of h
abita
tion
to g
uara
ntee
hou
seho
ld
toile
t pro
visi
ons;
• In
trod
uctio
n of
affo
rdab
le, d
urab
le a
nd in
nova
tive
toile
t tec
hnol
ogie
s (re
cove
ry, n
o sl
udge
, com
post
ing
optio
ns) t
o ho
useh
olds
/in
habi
tant
s of t
he D
A;•
Expl
ore
mea
sure
s for
ens
urin
g pu
blic
latr
ines
are
wel
l-man
aged
and
kep
t cle
an.
Serv
ice
deliv
ery
– so
lid w
aste
• In
crea
se d
oor-t
o-do
or se
rvic
e de
liver
y by
a m
ix o
f effe
ctiv
e pr
ivat
e fo
rmal
and
info
rmal
col
lect
ors e
spec
ially
in u
rban
tow
ns/a
reas
•
Impr
ove
was
te c
olle
ctio
n an
d m
anag
emen
t pra
ctic
es a
t hou
seho
ld le
vel;
• Pi
lot h
ouse
hold
was
te se
para
tion
in se
lect
ed c
omm
uniti
es;
Fina
nce
Expl
ore
and
esta
blis
h pa
rtne
rshi
p fo
r fin
anci
ng h
ouse
hold
toile
t pro
visi
on (l
oan,
revo
lvin
g fu
nd, e
tc);
Incr
ease
bas
ic
acce
ss to
toile
ts
for r
ural
and
ur
ban
dwel
lers
fro
m 1
6 pe
rcen
t in
201
7 to
67
perc
ent i
n 20
30
Achi
eve
33
perc
ent t
oile
ts
on p
rem
ises
for
hous
ehol
ds
Nat
iona
l m
ediu
m te
rm
deve
lopm
ent
goal
Nat
iona
l m
ediu
m te
rm
obje
ctiv
es
WAS
H
mas
ter p
lan
obje
ctiv
esDi
stri
ct st
rate
gic
actio
nsTa
rget
s (20
30)
Safe
guar
d th
e na
tura
l en
viro
nmen
t an
d en
sure
a
resi
lient
bui
lt
envi
ronm
ent
Impr
ove
acce
ss
to re
liabl
e en
viro
nmen
tal
sani
tatio
n se
rvic
es
WAS
H in
scho
ols a
nd h
ealt
h fa
cilit
ies
Incr
ease
ba
sic
acce
ss
to w
ater
, sa
nita
tion,
an
d hy
gien
e se
rvic
es o
n si
te in
all
educ
atio
nal
and
heal
th
inst
itutio
ns
Infr
astr
uctu
re d
evel
opm
ent
• Pr
ovid
e ba
sic
wat
er a
cces
s to
all s
choo
ls a
nd (w
here
nee
ded)
hea
lth fa
cilit
ies;
• Pr
ovid
e ge
nder
-dis
aggr
egat
ed a
nd d
isab
ility
frie
ndly
sani
tatio
n fa
cilit
ies f
or sc
hool
s and
(whe
re n
eede
d) h
ealth
faci
litie
s;•
Prov
ide
hand
was
hing
faci
litie
s for
all
inst
itutio
ns in
the
Dist
rict (
78 fo
r hea
lth; 2
10 fo
r edu
catio
n an
d 21
for s
elec
ted
mar
kets
).•
Prov
ide
solid
was
te b
ins f
or a
ll sc
hool
s•
Prov
ide
at le
ast t
hree
was
te c
olle
ctio
n bi
ns (f
or sh
arps
, inf
ectio
us, a
nd n
on-in
fect
ious
) for
all
heal
th fa
cilit
ies.
• Ex
plor
e an
d im
plem
ent s
trat
egie
s for
safe
trea
tmen
t and
dis
posa
l of s
harp
s and
infe
ctio
us w
aste
for a
ll he
alth
faci
litie
s•
Faci
litat
e co
llect
ion
and
tran
spor
tatio
n of
oth
er w
aste
from
inst
itutio
ns to
fina
l dis
posa
l site
by
Priv
ate
Sect
or.
Serv
ice
deliv
ery
man
agem
ent:
• Ad
voca
te fo
r a c
lear
pol
icy
on p
rovi
sion
of W
ASH
infra
stru
ctur
e;•
Sens
itize
stak
ehol
ders
on
the
polic
y an
d gu
idel
ines
for p
rovi
ding
inst
itutio
nal i
nfra
stru
ctur
e;•
Enfo
rcem
ent o
f gui
delin
es fo
r WAS
H d
eliv
ery
in th
e sc
hool
s and
hea
lth fa
cilit
ies;
• Tr
ain
Scho
ol b
ased
SH
EP C
oord
inat
ors a
nd C
omm
unity
Hea
lth C
omm
ittee
s on
oper
atio
ns a
nd m
aint
enan
ce (i
nclu
ding
cle
anin
g) o
f on
site
WAS
H fa
cilit
ies;
•
Stre
ngth
en th
e ca
paci
ty o
f Dis
tric
t Hea
lth M
anag
emen
t Tea
m to
mon
itor t
he p
erfo
rman
ce o
f ins
titut
iona
l was
h op
erat
ors;
• En
forc
e ex
istin
g gu
idel
ines
on
WAS
H in
scho
ols a
nd h
ealth
faci
litie
s.
Fina
ncin
g•
Advo
cate
for i
ncre
ased
fund
ing
for W
ASH
del
iver
y in
inst
itutio
ns a
nd re
sour
ces m
obili
satio
n fro
m a
ll pa
rtne
rs (d
evel
opm
ent p
artn
ers,
pr
ivat
e se
ctor
, NAD
EF, S
DCs,
CSO
s, F
BOs,
Tra
ditio
nal A
utho
ritie
s) in
the
Dist
rict;
• Ea
rmar
k fu
ndin
g fro
m th
e Di
stric
t Ass
embl
y fo
r maj
or m
aint
enan
ce o
f ins
titut
iona
l WAS
H fa
cilit
ies;
• De
dica
ted
fund
ing
from
the
PTA/
SMC
for o
pera
tions
and
min
or m
aint
enan
ce;
Incr
ease
wat
er
acce
ss o
n sc
hool
an
d he
alth
pr
emis
es fr
om
24 p
erce
nt to
10
0 pe
rcen
t by
2030
.
Incr
ease
acc
ess
to b
asic
hyg
iene
se
rvic
es (i
ncl.
wat
er a
nd so
ap)
from
7 p
erce
nt
in sc
hool
s and
71
% in
hea
lth
faci
litie
s, to
100
pe
rcen
t by
2030
. En
sure
all
inst
itutio
ns h
ave
safe
dis
posa
l an
d tr
eatm
ent o
f w
aste
.
Incr
ease
bas
ic
sani
tatio
n se
rvic
es in
sc
hool
s fro
m 4
6 pe
rcen
t in
2017
to
100
per
cent
in
2030
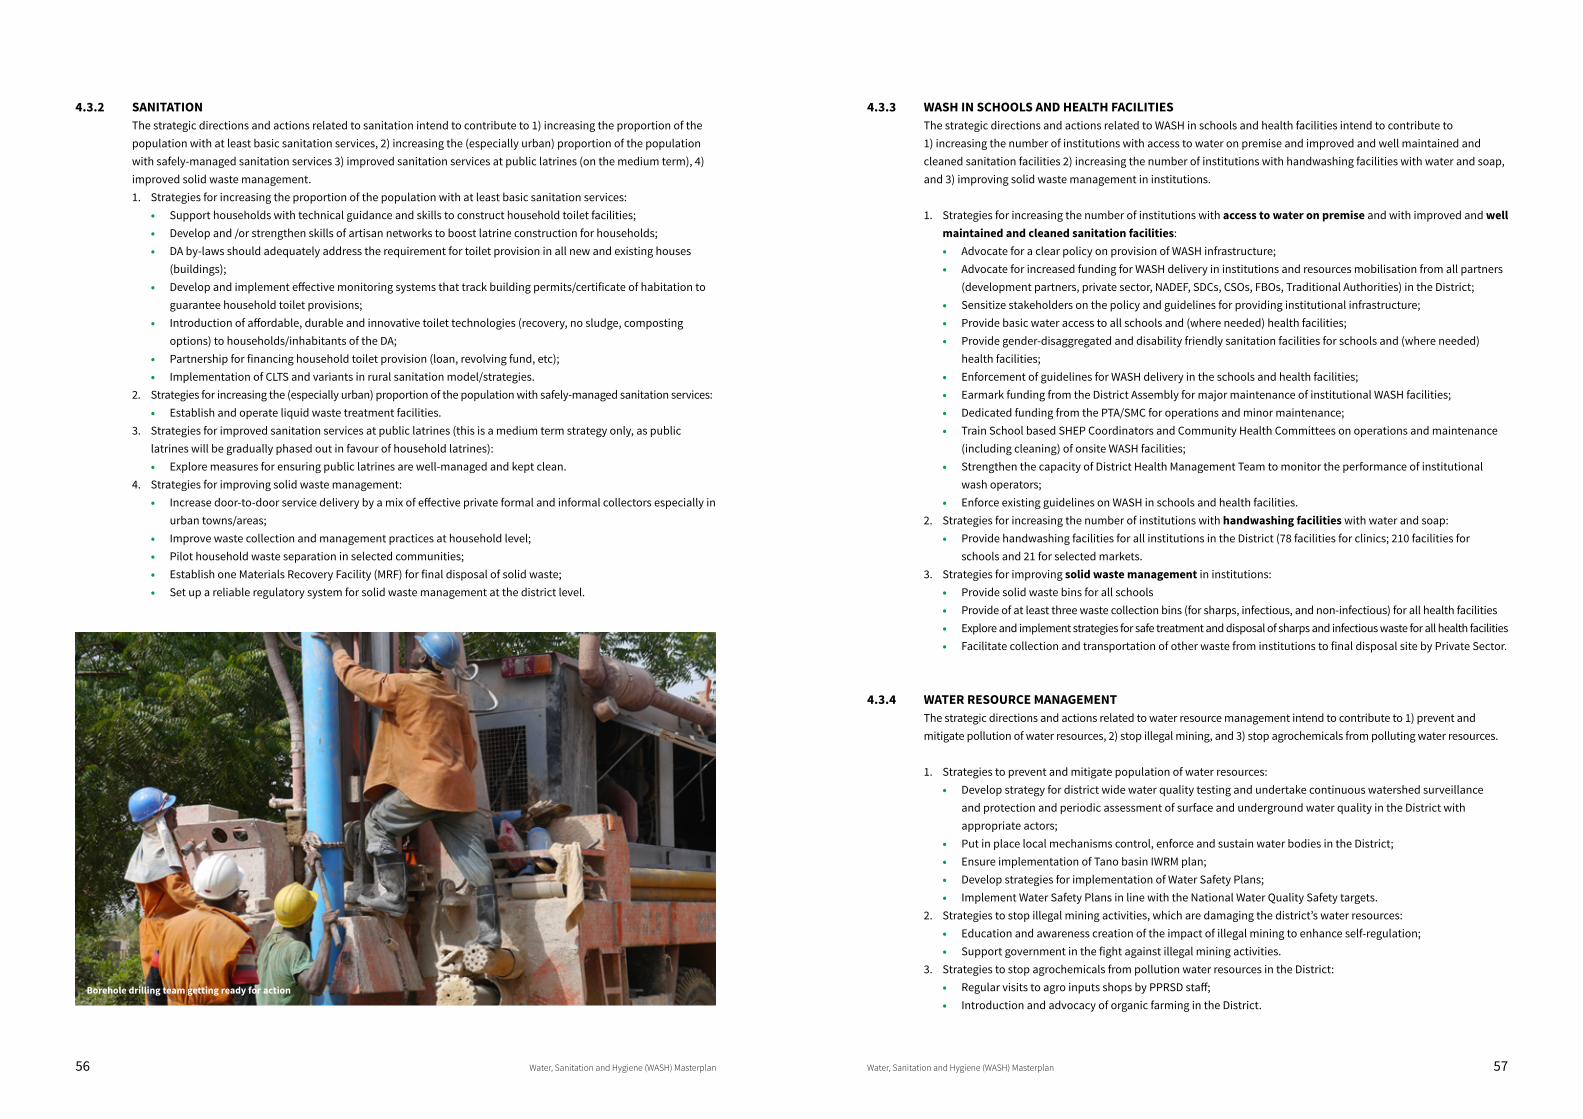
56 Water, Sanitation and Hygiene (WASH) Masterplan Water, Sanitation and Hygiene (WASH) Masterplan 57
4.3.2 SANITATIONThe strategic directions and actions related to sanitation intend to contribute to 1) increasing the proportion of the population with at least basic sanitation services, 2) increasing the (especially urban) proportion of the population with safely-managed sanitation services 3) improved sanitation services at public latrines (on the medium term), 4) improved solid waste management. 1. Strategies for increasing the proportion of the population with at least basic sanitation services:
• Support households with technical guidance and skills to construct household toilet facilities;• Develop and /or strengthen skills of artisan networks to boost latrine construction for households;• DA by-laws should adequately address the requirement for toilet provision in all new and existing houses
(buildings);• Develop and implement effective monitoring systems that track building permits/certificate of habitation to
guarantee household toilet provisions;• Introduction of affordable, durable and innovative toilet technologies (recovery, no sludge, composting
options) to households/inhabitants of the DA;• Partnership for financing household toilet provision (loan, revolving fund, etc);• Implementation of CLTS and variants in rural sanitation model/strategies.
2. Strategies for increasing the (especially urban) proportion of the population with safely-managed sanitation services:• Establish and operate liquid waste treatment facilities.
3. Strategies for improved sanitation services at public latrines (this is a medium term strategy only, as public latrines will be gradually phased out in favour of household latrines):• Explore measures for ensuring public latrines are well-managed and kept clean.
4. Strategies for improving solid waste management:• Increase door-to-door service delivery by a mix of effective private formal and informal collectors especially in
urban towns/areas;• Improve waste collection and management practices at household level;• Pilot household waste separation in selected communities;• Establish one Materials Recovery Facility (MRF) for final disposal of solid waste;• Set up a reliable regulatory system for solid waste management at the district level.
4.3.3 WASH IN SCHOOLS AND HEALTH FACILITIESThe strategic directions and actions related to WASH in schools and health facilities intend to contribute to 1) increasing the number of institutions with access to water on premise and improved and well maintained and cleaned sanitation facilities 2) increasing the number of institutions with handwashing facilities with water and soap, and 3) improving solid waste management in institutions.
1. Strategies for increasing the number of institutions with access to water on premise and with improved and well maintained and cleaned sanitation facilities:• Advocate for a clear policy on provision of WASH infrastructure;• Advocate for increased funding for WASH delivery in institutions and resources mobilisation from all partners
(development partners, private sector, NADEF, SDCs, CSOs, FBOs, Traditional Authorities) in the District; • Sensitize stakeholders on the policy and guidelines for providing institutional infrastructure;• Provide basic water access to all schools and (where needed) health facilities;• Provide gender-disaggregated and disability friendly sanitation facilities for schools and (where needed)
health facilities;• Enforcement of guidelines for WASH delivery in the schools and health facilities;• Earmark funding from the District Assembly for major maintenance of institutional WASH facilities;• Dedicated funding from the PTA/SMC for operations and minor maintenance; • Train School based SHEP Coordinators and Community Health Committees on operations and maintenance
(including cleaning) of onsite WASH facilities; • Strengthen the capacity of District Health Management Team to monitor the performance of institutional
wash operators;• Enforce existing guidelines on WASH in schools and health facilities.
2. Strategies for increasing the number of institutions with handwashing facilities with water and soap:• Provide handwashing facilities for all institutions in the District (78 facilities for clinics; 210 facilities for
schools and 21 for selected markets.3. Strategies for improving solid waste management in institutions:
• Provide solid waste bins for all schools• Provide of at least three waste collection bins (for sharps, infectious, and non-infectious) for all health facilities• Explore and implement strategies for safe treatment and disposal of sharps and infectious waste for all health facilities• Facilitate collection and transportation of other waste from institutions to final disposal site by Private Sector.
4.3.4 WATER RESOURCE MANAGEMENTThe strategic directions and actions related to water resource management intend to contribute to 1) prevent and mitigate pollution of water resources, 2) stop illegal mining, and 3) stop agrochemicals from polluting water resources.
1. Strategies to prevent and mitigate population of water resources:• Develop strategy for district wide water quality testing and undertake continuous watershed surveillance
and protection and periodic assessment of surface and underground water quality in the District with appropriate actors;
• Put in place local mechanisms control, enforce and sustain water bodies in the District;• Ensure implementation of Tano basin IWRM plan;• Develop strategies for implementation of Water Safety Plans;• Implement Water Safety Plans in line with the National Water Quality Safety targets.
2. Strategies to stop illegal mining activities, which are damaging the district’s water resources: • Education and awareness creation of the impact of illegal mining to enhance self-regulation;• Support government in the fight against illegal mining activities.
3. Strategies to stop agrochemicals from pollution water resources in the District: • Regular visits to agro inputs shops by PPRSD staff;• Introduction and advocacy of organic farming in the District.
Borehole drilling team getting ready for action
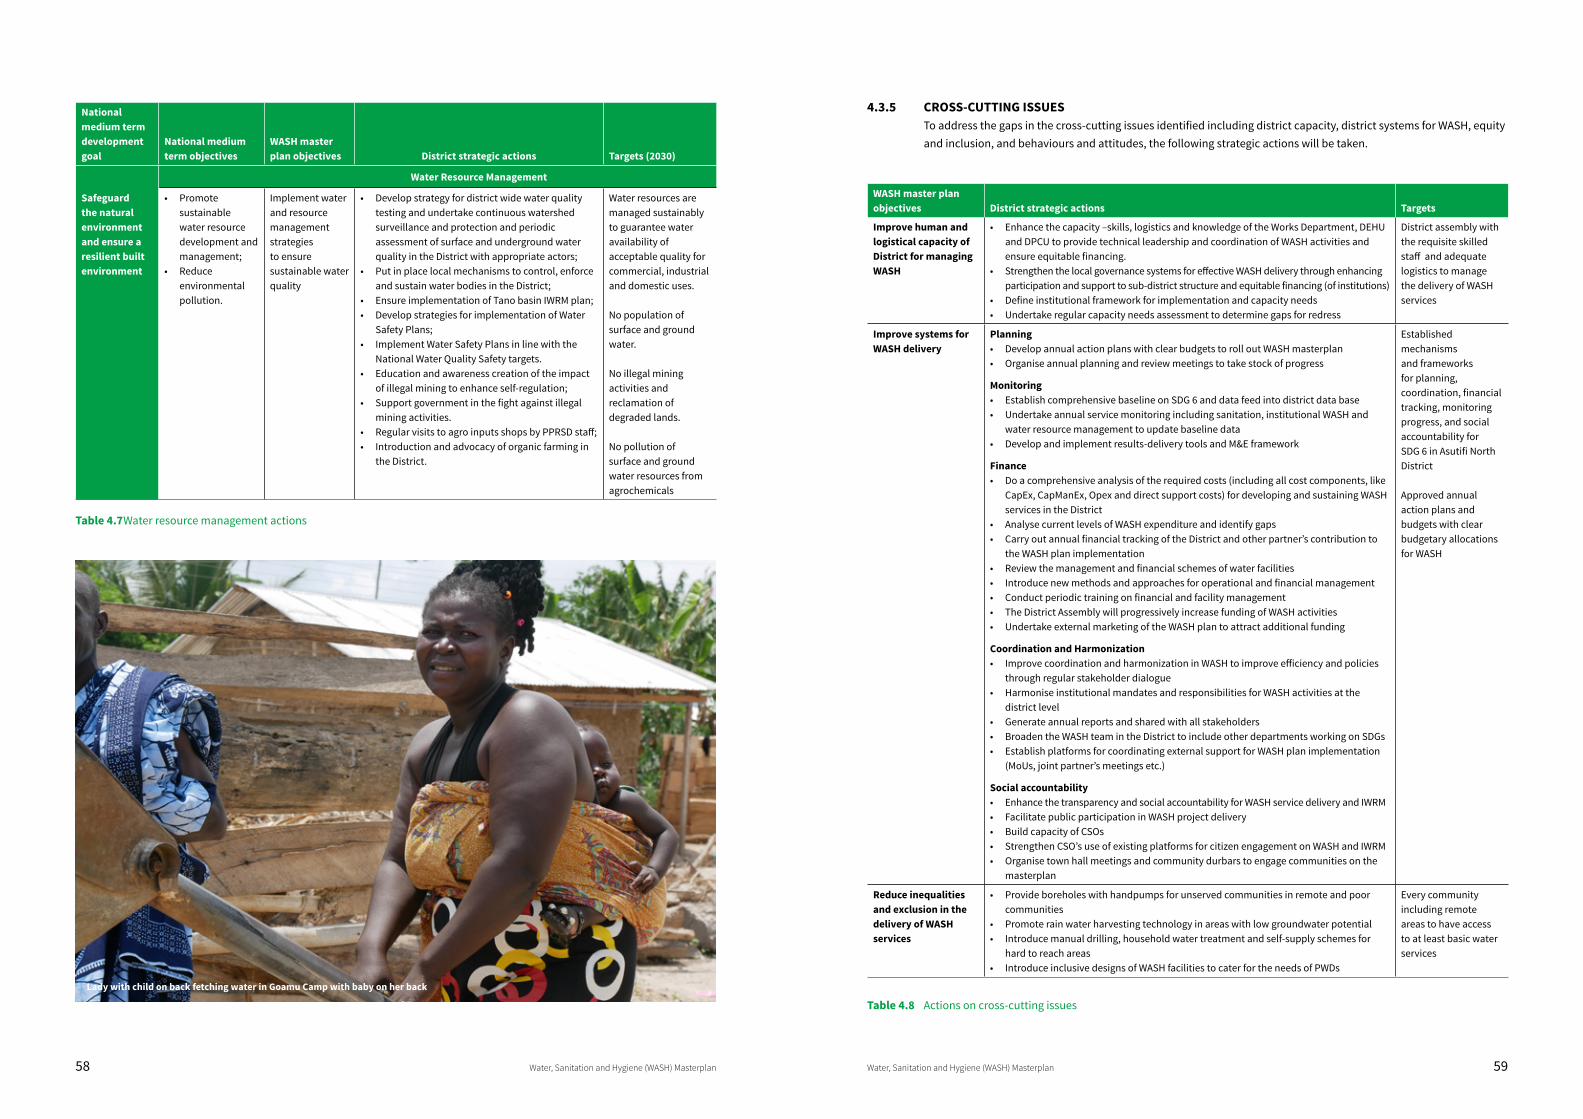
58 Water, Sanitation and Hygiene (WASH) Masterplan Water, Sanitation and Hygiene (WASH) Masterplan 59
National medium term development goal
National medium term objectives
WASH master plan objectives District strategic actions Targets (2030)
Water Resource Management
Safeguard the natural environment and ensure a resilient built environment
• Promote sustainable water resource development and management;
• Reduce environmental pollution.
Implement water and resource management strategies to ensure sustainable water quality
• Develop strategy for district wide water quality testing and undertake continuous watershed surveillance and protection and periodic assessment of surface and underground water quality in the District with appropriate actors;
• Put in place local mechanisms to control, enforce and sustain water bodies in the District;
• Ensure implementation of Tano basin IWRM plan;• Develop strategies for implementation of Water
Safety Plans;• Implement Water Safety Plans in line with the
National Water Quality Safety targets.• Education and awareness creation of the impact
of illegal mining to enhance self-regulation;• Support government in the fight against illegal
mining activities.• Regular visits to agro inputs shops by PPRSD staff;• Introduction and advocacy of organic farming in
the District.
Water resources are managed sustainably to guarantee water availability of acceptable quality for commercial, industrial and domestic uses.
No population of surface and ground water.
No illegal mining activities and reclamation of degraded lands.
No pollution of surface and ground water resources from agrochemicals
Table 4.7 Water resource management actions
4.3.5 CROSS-CUTTING ISSUESTo address the gaps in the cross-cutting issues identified including district capacity, district systems for WASH, equity and inclusion, and behaviours and attitudes, the following strategic actions will be taken.
WASH master plan objectives District strategic actions Targets
Improve human and logistical capacity of District for managing WASH
• Enhance the capacity –skills, logistics and knowledge of the Works Department, DEHU and DPCU to provide technical leadership and coordination of WASH activities and ensure equitable financing.
• Strengthen the local governance systems for effective WASH delivery through enhancing participation and support to sub-district structure and equitable financing (of institutions)
• Define institutional framework for implementation and capacity needs• Undertake regular capacity needs assessment to determine gaps for redress
District assembly with the requisite skilled staff and adequate logistics to manage the delivery of WASH services
Improve systems for WASH delivery
Planning• Develop annual action plans with clear budgets to roll out WASH masterplan• Organise annual planning and review meetings to take stock of progress
Monitoring• Establish comprehensive baseline on SDG 6 and data feed into district data base• Undertake annual service monitoring including sanitation, institutional WASH and
water resource management to update baseline data• Develop and implement results-delivery tools and M&E framework
Finance• Do a comprehensive analysis of the required costs (including all cost components, like
CapEx, CapManEx, Opex and direct support costs) for developing and sustaining WASH services in the District
• Analyse current levels of WASH expenditure and identify gaps• Carry out annual financial tracking of the District and other partner’s contribution to
the WASH plan implementation• Review the management and financial schemes of water facilities• Introduce new methods and approaches for operational and financial management• Conduct periodic training on financial and facility management• The District Assembly will progressively increase funding of WASH activities• Undertake external marketing of the WASH plan to attract additional funding
Coordination and Harmonization• Improve coordination and harmonization in WASH to improve efficiency and policies
through regular stakeholder dialogue• Harmonise institutional mandates and responsibilities for WASH activities at the
district level• Generate annual reports and shared with all stakeholders• Broaden the WASH team in the District to include other departments working on SDGs• Establish platforms for coordinating external support for WASH plan implementation
(MoUs, joint partner’s meetings etc.)
Social accountability• Enhance the transparency and social accountability for WASH service delivery and IWRM• Facilitate public participation in WASH project delivery• Build capacity of CSOs• Strengthen CSO’s use of existing platforms for citizen engagement on WASH and IWRM• Organise town hall meetings and community durbars to engage communities on the
masterplan
Established mechanisms and frameworks for planning, coordination, financial tracking, monitoring progress, and social accountability for SDG 6 in Asutifi North District
Approved annual action plans and budgets with clear budgetary allocations for WASH
Reduce inequalities and exclusion in the delivery of WASH services
• Provide boreholes with handpumps for unserved communities in remote and poor communities
• Promote rain water harvesting technology in areas with low groundwater potential• Introduce manual drilling, household water treatment and self-supply schemes for
hard to reach areas• Introduce inclusive designs of WASH facilities to cater for the needs of PWDs
Every community including remote areas to have access to at least basic water services
Table 4.8 Actions on cross-cutting issues
Lady with child on back fetching water in Goamu Camp with baby on her back
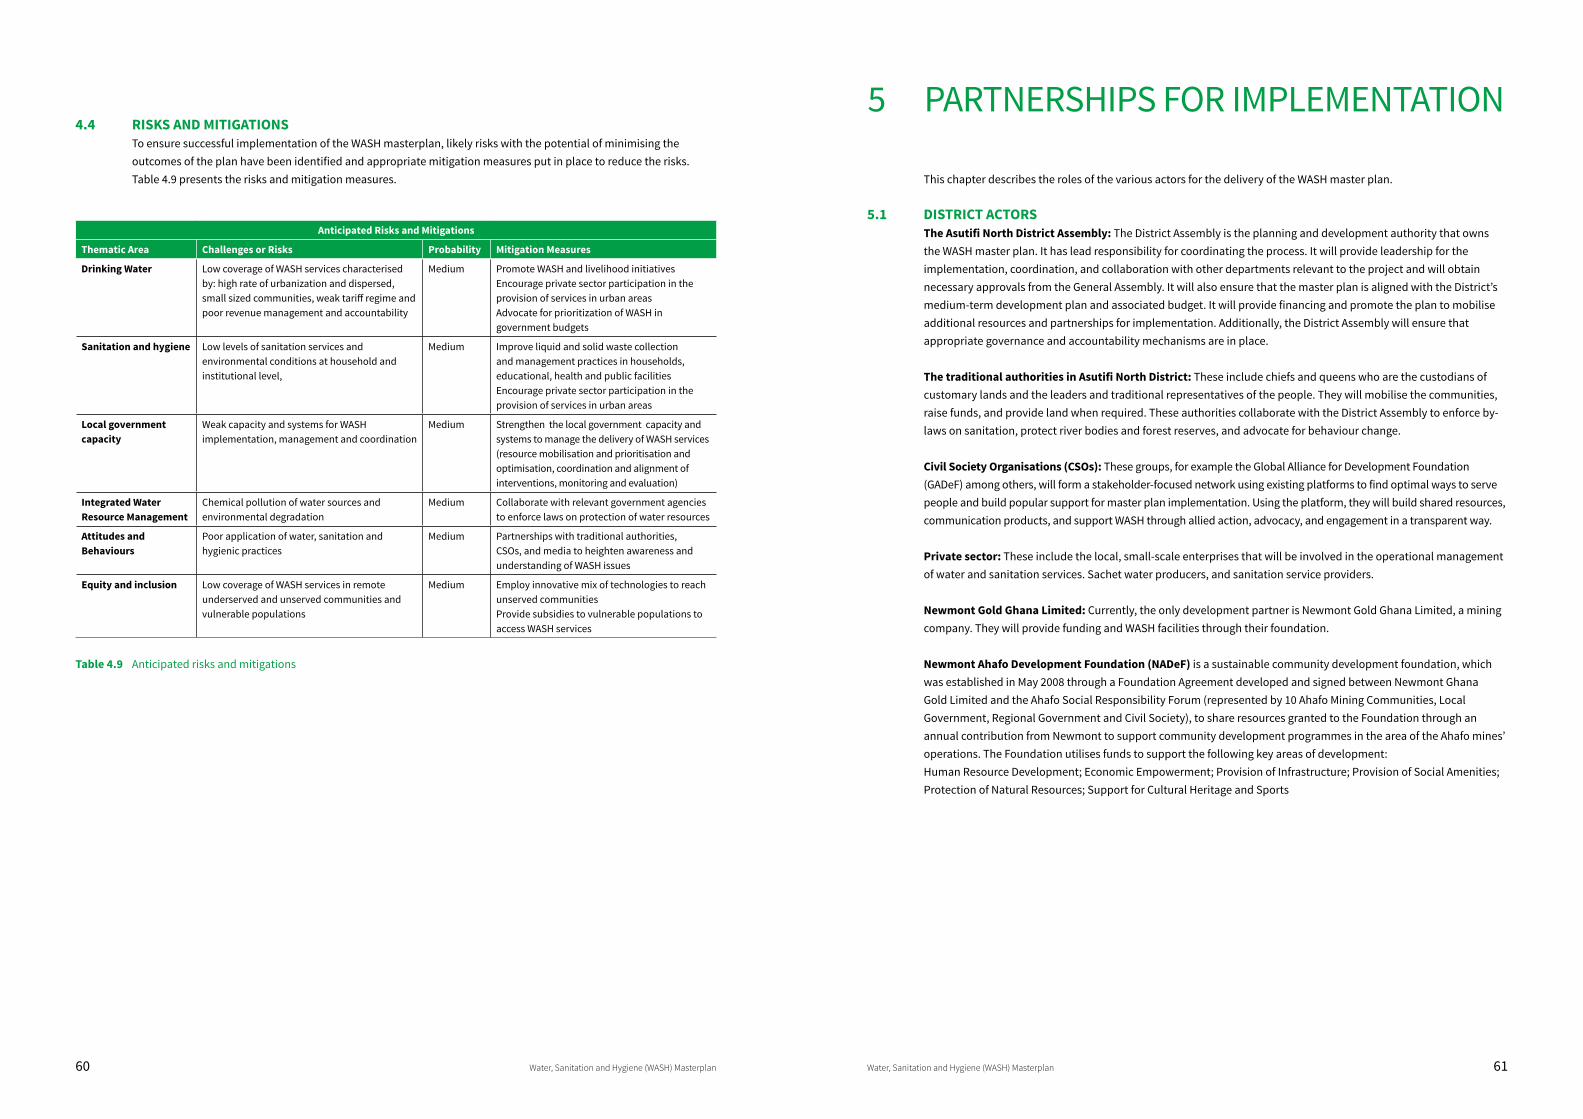
60 Water, Sanitation and Hygiene (WASH) Masterplan Water, Sanitation and Hygiene (WASH) Masterplan 61
4.4 RISKS AND MITIGATIONSTo ensure successful implementation of the WASH masterplan, likely risks with the potential of minimising the outcomes of the plan have been identified and appropriate mitigation measures put in place to reduce the risks. Table 4.9 presents the risks and mitigation measures.
Anticipated Risks and Mitigations
Thematic Area Challenges or Risks Probability Mitigation Measures
Drinking Water Low coverage of WASH services characterised by: high rate of urbanization and dispersed, small sized communities, weak tariff regime and poor revenue management and accountability
Medium Promote WASH and livelihood initiativesEncourage private sector participation in the provision of services in urban areasAdvocate for prioritization of WASH in government budgets
Sanitation and hygiene Low levels of sanitation services and environmental conditions at household and institutional level,
Medium Improve liquid and solid waste collection and management practices in households, educational, health and public facilitiesEncourage private sector participation in the provision of services in urban areas
Local government capacity
Weak capacity and systems for WASH implementation, management and coordination
Medium Strengthen the local government capacity and systems to manage the delivery of WASH services (resource mobilisation and prioritisation and optimisation, coordination and alignment of interventions, monitoring and evaluation)
Integrated Water Resource Management
Chemical pollution of water sources and environmental degradation
Medium Collaborate with relevant government agencies to enforce laws on protection of water resources
Attitudes and Behaviours
Poor application of water, sanitation and hygienic practices
Medium Partnerships with traditional authorities, CSOs, and media to heighten awareness and understanding of WASH issues
Equity and inclusion Low coverage of WASH services in remote underserved and unserved communities and vulnerable populations
Medium Employ innovative mix of technologies to reach unserved communitiesProvide subsidies to vulnerable populations to access WASH services
Table 4.9 Anticipated risks and mitigations
5 PARTNERSHIPS FOR IMPLEMENTATION
This chapter describes the roles of the various actors for the delivery of the WASH master plan.
5.1 DISTRICT ACTORSThe Asutifi North District Assembly: The District Assembly is the planning and development authority that owns the WASH master plan. It has lead responsibility for coordinating the process. It will provide leadership for the implementation, coordination, and collaboration with other departments relevant to the project and will obtain necessary approvals from the General Assembly. It will also ensure that the master plan is aligned with the District’s medium-term development plan and associated budget. It will provide financing and promote the plan to mobilise additional resources and partnerships for implementation. Additionally, the District Assembly will ensure that appropriate governance and accountability mechanisms are in place.
The traditional authorities in Asutifi North District: These include chiefs and queens who are the custodians of customary lands and the leaders and traditional representatives of the people. They will mobilise the communities, raise funds, and provide land when required. These authorities collaborate with the District Assembly to enforce by-laws on sanitation, protect river bodies and forest reserves, and advocate for behaviour change.
Civil Society Organisations (CSOs): These groups, for example the Global Alliance for Development Foundation (GADeF) among others, will form a stakeholder-focused network using existing platforms to find optimal ways to serve people and build popular support for master plan implementation. Using the platform, they will build shared resources, communication products, and support WASH through allied action, advocacy, and engagement in a transparent way.
Private sector: These include the local, small-scale enterprises that will be involved in the operational management of water and sanitation services. Sachet water producers, and sanitation service providers.
Newmont Gold Ghana Limited: Currently, the only development partner is Newmont Gold Ghana Limited, a mining company. They will provide funding and WASH facilities through their foundation.
Newmont Ahafo Development Foundation (NADeF) is a sustainable community development foundation, which was established in May 2008 through a Foundation Agreement developed and signed between Newmont Ghana Gold Limited and the Ahafo Social Responsibility Forum (represented by 10 Ahafo Mining Communities, Local Government, Regional Government and Civil Society), to share resources granted to the Foundation through an annual contribution from Newmont to support community development programmes in the area of the Ahafo mines’ operations. The Foundation utilises funds to support the following key areas of development: Human Resource Development; Economic Empowerment; Provision of Infrastructure; Provision of Social Amenities; Protection of Natural Resources; Support for Cultural Heritage and Sports
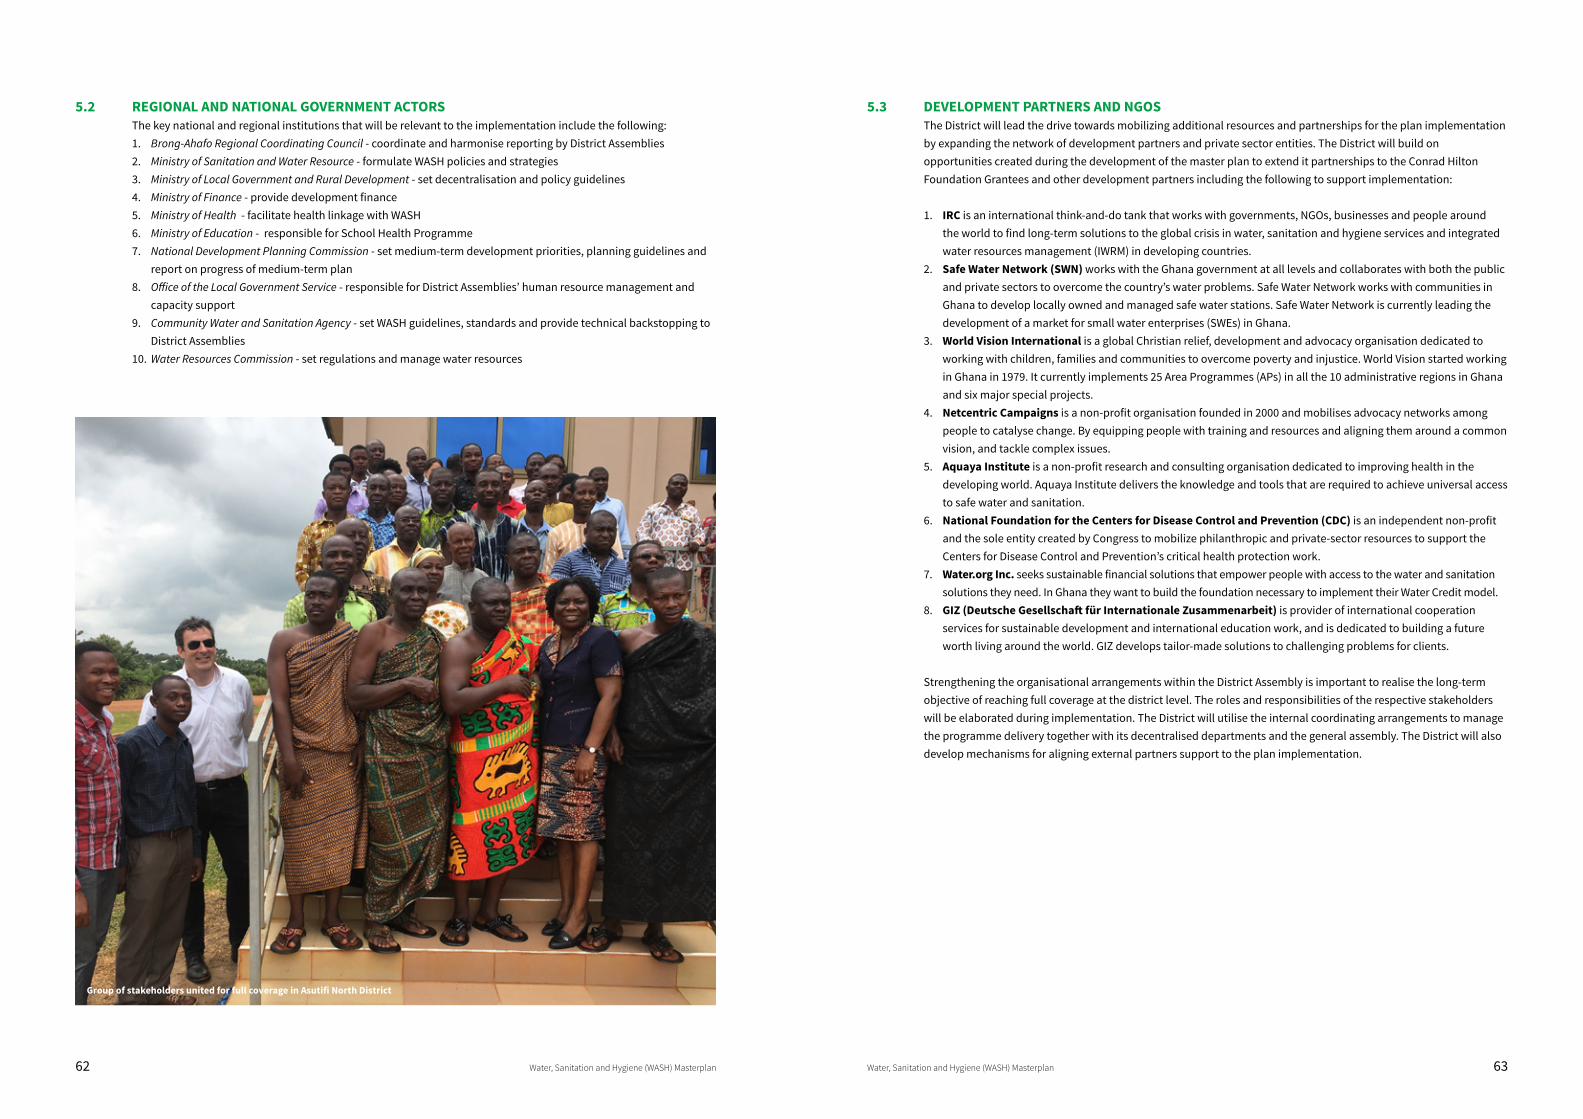
62 Water, Sanitation and Hygiene (WASH) Masterplan Water, Sanitation and Hygiene (WASH) Masterplan 63
5.2 REGIONAL AND NATIONAL GOVERNMENT ACTORSThe key national and regional institutions that will be relevant to the implementation include the following:1. Brong-Ahafo Regional Coordinating Council - coordinate and harmonise reporting by District Assemblies2. Ministry of Sanitation and Water Resource - formulate WASH policies and strategies3. Ministry of Local Government and Rural Development - set decentralisation and policy guidelines4. Ministry of Finance - provide development finance5. Ministry of Health - facilitate health linkage with WASH 6. Ministry of Education - responsible for School Health Programme7. National Development Planning Commission - set medium-term development priorities, planning guidelines and
report on progress of medium-term plan8. Office of the Local Government Service - responsible for District Assemblies’ human resource management and
capacity support9. Community Water and Sanitation Agency - set WASH guidelines, standards and provide technical backstopping to
District Assemblies10. Water Resources Commission - set regulations and manage water resources
5.3 DEVELOPMENT PARTNERS AND NGOSThe District will lead the drive towards mobilizing additional resources and partnerships for the plan implementation by expanding the network of development partners and private sector entities. The District will build on opportunities created during the development of the master plan to extend it partnerships to the Conrad Hilton Foundation Grantees and other development partners including the following to support implementation:
1. IRC is an international think-and-do tank that works with governments, NGOs, businesses and people around the world to find long-term solutions to the global crisis in water, sanitation and hygiene services and integrated water resources management (IWRM) in developing countries.
2. Safe Water Network (SWN) works with the Ghana government at all levels and collaborates with both the public and private sectors to overcome the country’s water problems. Safe Water Network works with communities in Ghana to develop locally owned and managed safe water stations. Safe Water Network is currently leading the development of a market for small water enterprises (SWEs) in Ghana.
3. World Vision International is a global Christian relief, development and advocacy organisation dedicated to working with children, families and communities to overcome poverty and injustice. World Vision started working in Ghana in 1979. It currently implements 25 Area Programmes (APs) in all the 10 administrative regions in Ghana and six major special projects.
4. Netcentric Campaigns is a non-profit organisation founded in 2000 and mobilises advocacy networks among people to catalyse change. By equipping people with training and resources and aligning them around a common vision, and tackle complex issues.
5. Aquaya Institute is a non-profit research and consulting organisation dedicated to improving health in the developing world. Aquaya Institute delivers the knowledge and tools that are required to achieve universal access to safe water and sanitation.
6. National Foundation for the Centers for Disease Control and Prevention (CDC) is an independent non-profit and the sole entity created by Congress to mobilize philanthropic and private-sector resources to support the Centers for Disease Control and Prevention’s critical health protection work.
7. Water.org Inc. seeks sustainable financial solutions that empower people with access to the water and sanitation solutions they need. In Ghana they want to build the foundation necessary to implement their Water Credit model.
8. GIZ (Deutsche Gesellschaft für Internationale Zusammenarbeit) is provider of international cooperation services for sustainable development and international education work, and is dedicated to building a future worth living around the world. GIZ develops tailor-made solutions to challenging problems for clients.
Strengthening the organisational arrangements within the District Assembly is important to realise the long-term objective of reaching full coverage at the district level. The roles and responsibilities of the respective stakeholders will be elaborated during implementation. The District will utilise the internal coordinating arrangements to manage the programme delivery together with its decentralised departments and the general assembly. The District will also develop mechanisms for aligning external partners support to the plan implementation.
Group of stakeholders united for full coverage in Asutifi North District
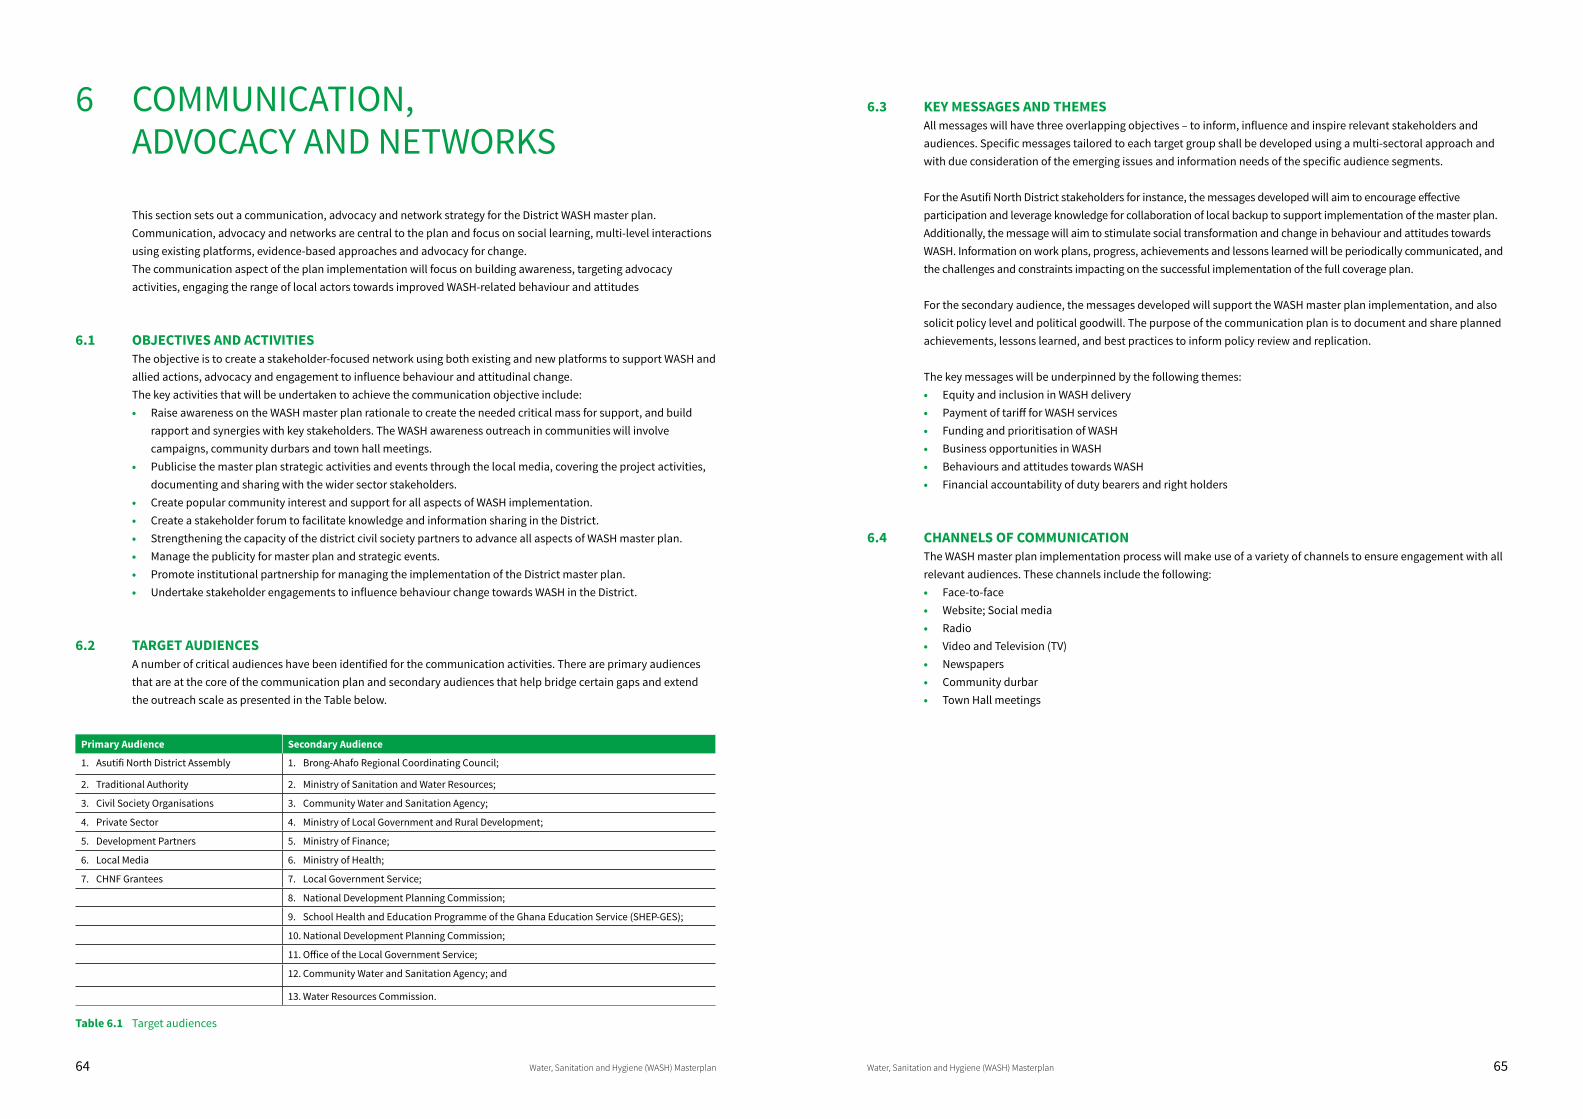
64 Water, Sanitation and Hygiene (WASH) Masterplan Water, Sanitation and Hygiene (WASH) Masterplan 65
6 COMMUNICATION, ADVOCACY AND NETWORKS
This section sets out a communication, advocacy and network strategy for the District WASH master plan. Communication, advocacy and networks are central to the plan and focus on social learning, multi-level interactions using existing platforms, evidence-based approaches and advocacy for change.The communication aspect of the plan implementation will focus on building awareness, targeting advocacy activities, engaging the range of local actors towards improved WASH-related behaviour and attitudes
6.1 OBJECTIVES AND ACTIVITIESThe objective is to create a stakeholder-focused network using both existing and new platforms to support WASH and allied actions, advocacy and engagement to influence behaviour and attitudinal change.The key activities that will be undertaken to achieve the communication objective include:• Raise awareness on the WASH master plan rationale to create the needed critical mass for support, and build
rapport and synergies with key stakeholders. The WASH awareness outreach in communities will involve campaigns, community durbars and town hall meetings.
• Publicise the master plan strategic activities and events through the local media, covering the project activities, documenting and sharing with the wider sector stakeholders.
• Create popular community interest and support for all aspects of WASH implementation.• Create a stakeholder forum to facilitate knowledge and information sharing in the District.• Strengthening the capacity of the district civil society partners to advance all aspects of WASH master plan.• Manage the publicity for master plan and strategic events.• Promote institutional partnership for managing the implementation of the District master plan.• Undertake stakeholder engagements to influence behaviour change towards WASH in the District.
6.2 TARGET AUDIENCESA number of critical audiences have been identified for the communication activities. There are primary audiences that are at the core of the communication plan and secondary audiences that help bridge certain gaps and extend the outreach scale as presented in the Table below.
Primary Audience Secondary Audience
1. Asutifi North District Assembly 1. Brong-Ahafo Regional Coordinating Council;
2. Traditional Authority 2. Ministry of Sanitation and Water Resources;
3. Civil Society Organisations 3. Community Water and Sanitation Agency;
4. Private Sector 4. Ministry of Local Government and Rural Development;
5. Development Partners 5. Ministry of Finance;
6. Local Media 6. Ministry of Health;
7. CHNF Grantees 7. Local Government Service;
8. National Development Planning Commission;
9. School Health and Education Programme of the Ghana Education Service (SHEP-GES);
10. National Development Planning Commission;
11. Office of the Local Government Service;
12. Community Water and Sanitation Agency; and
13. Water Resources Commission.
Table 6.1 Target audiences
6.3 KEY MESSAGES AND THEMESAll messages will have three overlapping objectives – to inform, influence and inspire relevant stakeholders and audiences. Specific messages tailored to each target group shall be developed using a multi-sectoral approach and with due consideration of the emerging issues and information needs of the specific audience segments.
For the Asutifi North District stakeholders for instance, the messages developed will aim to encourage effective participation and leverage knowledge for collaboration of local backup to support implementation of the master plan. Additionally, the message will aim to stimulate social transformation and change in behaviour and attitudes towards WASH. Information on work plans, progress, achievements and lessons learned will be periodically communicated, and the challenges and constraints impacting on the successful implementation of the full coverage plan.
For the secondary audience, the messages developed will support the WASH master plan implementation, and also solicit policy level and political goodwill. The purpose of the communication plan is to document and share planned achievements, lessons learned, and best practices to inform policy review and replication.
The key messages will be underpinned by the following themes:• Equity and inclusion in WASH delivery• Payment of tariff for WASH services• Funding and prioritisation of WASH• Business opportunities in WASH• Behaviours and attitudes towards WASH• Financial accountability of duty bearers and right holders
6.4 CHANNELS OF COMMUNICATIONThe WASH master plan implementation process will make use of a variety of channels to ensure engagement with all relevant audiences. These channels include the following:• Face-to-face • Website; Social media• Radio • Video and Television (TV) • Newspapers• Community durbar• Town Hall meetings
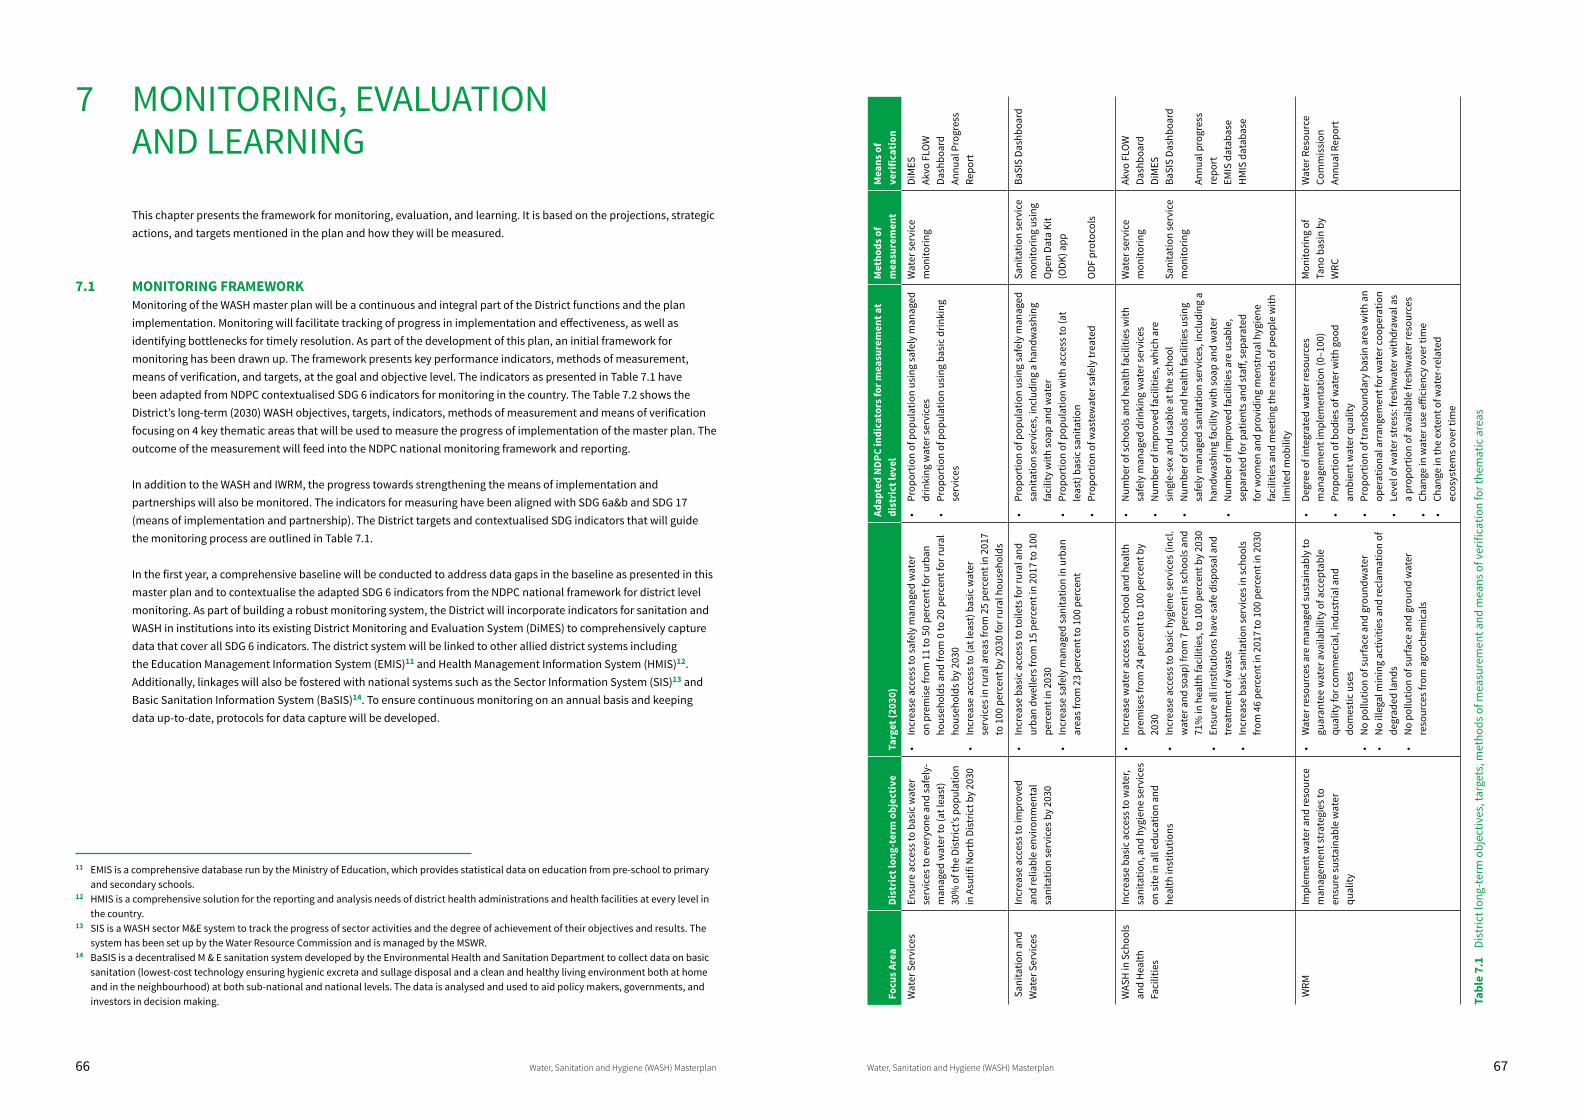
66 Water, Sanitation and Hygiene (WASH) Masterplan Water, Sanitation and Hygiene (WASH) Masterplan 67
7 MONITORING, EVALUATION AND LEARNING
This chapter presents the framework for monitoring, evaluation, and learning. It is based on the projections, strategic actions, and targets mentioned in the plan and how they will be measured.
7.1 MONITORING FRAMEWORKMonitoring of the WASH master plan will be a continuous and integral part of the District functions and the plan implementation. Monitoring will facilitate tracking of progress in implementation and effectiveness, as well as identifying bottlenecks for timely resolution. As part of the development of this plan, an initial framework for monitoring has been drawn up. The framework presents key performance indicators, methods of measurement, means of verification, and targets, at the goal and objective level. The indicators as presented in Table 7.1 have been adapted from NDPC contextualised SDG 6 indicators for monitoring in the country. The Table 7.2 shows the District’s long-term (2030) WASH objectives, targets, indicators, methods of measurement and means of verification focusing on 4 key thematic areas that will be used to measure the progress of implementation of the master plan. The outcome of the measurement will feed into the NDPC national monitoring framework and reporting.
In addition to the WASH and IWRM, the progress towards strengthening the means of implementation and partnerships will also be monitored. The indicators for measuring have been aligned with SDG 6a&b and SDG 17 (means of implementation and partnership). The District targets and contextualised SDG indicators that will guide the monitoring process are outlined in Table 7.1.
In the first year, a comprehensive baseline will be conducted to address data gaps in the baseline as presented in this master plan and to contextualise the adapted SDG 6 indicators from the NDPC national framework for district level monitoring. As part of building a robust monitoring system, the District will incorporate indicators for sanitation and WASH in institutions into its existing District Monitoring and Evaluation System (DiMES) to comprehensively capture data that cover all SDG 6 indicators. The district system will be linked to other allied district systems including the Education Management Information System (EMIS)11 and Health Management Information System (HMIS)12. Additionally, linkages will also be fostered with national systems such as the Sector Information System (SIS)13 and Basic Sanitation Information System (BaSIS)14. To ensure continuous monitoring on an annual basis and keeping data up-to-date, protocols for data capture will be developed.
11 EMIS is a comprehensive database run by the Ministry of Education, which provides statistical data on education from pre-school to primary and secondary schools.
12 HMIS is a comprehensive solution for the reporting and analysis needs of district health administrations and health facilities at every level in the country.
13 SIS is a WASH sector M&E system to track the progress of sector activities and the degree of achievement of their objectives and results. The system has been set up by the Water Resource Commission and is managed by the MSWR.
14 BaSIS is a decentralised M & E sanitation system developed by the Environmental Health and Sanitation Department to collect data on basic sanitation (lowest-cost technology ensuring hygienic excreta and sullage disposal and a clean and healthy living environment both at home and in the neighbourhood) at both sub-national and national levels. The data is analysed and used to aid policy makers, governments, and investors in decision making. Fo
cus A
rea
Dist
rict
long
-ter
m o
bjec
tive
Targ
et (2
030)
Adap
ted
NDP
C in
dica
tors
for m
easu
rem
ent a
t di
stri
ct le
vel
Met
hods
of
mea
sure
men
tM
eans
of
veri
ficat
ion
Wat
er S
ervi
ces
Ensu
re a
cces
s to
basi
c w
ater
se
rvic
es to
eve
ryon
e an
d sa
fely
-m
anag
ed w
ater
to (a
t lea
st)
30%
of t
he D
istr
ict’s
pop
ulat
ion
in A
sutif
i Nor
th D
istr
ict b
y 20
30
• In
crea
se a
cces
s to
safe
ly m
anag
ed w
ater
on
pre
mis
e fro
m 1
1 to
50
perc
ent f
or u
rban
ho
useh
olds
and
from
0 to
20
perc
ent f
or ru
ral
hous
ehol
ds b
y 20
30•
Incr
ease
acc
ess t
o (a
t lea
st) b
asic
wat
er
serv
ices
in ru
ral a
reas
from
25
perc
ent i
n 20
17
to 1
00 p
erce
nt b
y 20
30 fo
r rur
al h
ouse
hold
s
• Pr
opor
tion
of p
opul
atio
n us
ing
safe
ly m
anag
ed
drin
king
wat
er se
rvic
es•
Prop
ortio
n of
pop
ulat
ion
usin
g ba
sic
drin
king
se
rvic
es
Wat
er se
rvic
e m
onito
ring
DiM
ESAk
vo F
LOW
Da
shbo
ard
Annu
al P
rogr
ess
Repo
rt
San
itatio
n an
d W
ater
Ser
vice
sIn
crea
se a
cces
s to
impr
oved
an
d re
liabl
e en
viro
nmen
tal
sani
tatio
n se
rvic
es b
y 20
30
• In
crea
se b
asic
acc
ess t
o to
ilets
for r
ural
and
ur
ban
dwel
lers
from
15
perc
ent i
n 20
17 to
100
pe
rcen
t in
2030
• In
crea
se sa
fely
man
aged
sani
tatio
n in
urb
an
area
s fro
m 2
3 pe
rcen
t to
100
perc
ent
• Pr
opor
tion
of p
opul
atio
n us
ing
safe
ly m
anag
ed
sani
tatio
n se
rvic
es, i
nclu
ding
a h
andw
ashi
ng
faci
lity
with
soap
and
wat
er•
Prop
ortio
n of
pop
ulat
ion
with
acc
ess t
o (a
t le
ast)
bas
ic sa
nita
tion
• Pr
opor
tion
of w
aste
wat
er sa
fely
trea
ted
Sani
tatio
n se
rvic
e m
onito
ring
usin
g O
pen
Data
Kit
(ODK
) app
ODF
pro
toco
ls
BaSI
S Da
shbo
ard
WAS
H in
Sch
ools
an
d H
ealth
Fa
cilit
ies
Incr
ease
bas
ic a
cces
s to
wat
er,
sani
tatio
n, a
nd h
ygie
ne se
rvic
es
on si
te in
all
educ
atio
n an
d he
alth
inst
itutio
ns
• In
crea
se w
ater
acc
ess o
n sc
hool
and
hea
lth
prem
ises
from
24
perc
ent t
o 10
0 pe
rcen
t by
2030
• In
crea
se a
cces
s to
basi
c hy
gien
e se
rvic
es (i
ncl.
wat
er a
nd so
ap) f
rom
7 p
erce
nt in
scho
ols a
nd
71%
in h
ealth
faci
litie
s, to
100
per
cent
by
2030
• En
sure
all
inst
itutio
ns h
ave
safe
dis
posa
l and
tr
eatm
ent o
f was
te
• In
crea
se b
asic
sani
tatio
n se
rvic
es in
scho
ols
from
46
perc
ent i
n 20
17 to
100
per
cent
in 2
030
• N
umbe
r of s
choo
ls a
nd h
ealth
faci
litie
s with
sa
fely
man
aged
drin
king
wat
er se
rvic
es•
Num
ber o
f im
prov
ed fa
cilit
ies,
whi
ch a
re
sing
le-s
ex a
nd u
sabl
e at
the
scho
ol•
Num
ber o
f sch
ools
and
hea
lth fa
cilit
ies u
sing
sa
fely
man
aged
sani
tatio
n se
rvic
es, i
nclu
ding
a
hand
was
hing
faci
lity
with
soap
and
wat
er•
Num
ber o
f im
prov
ed fa
cilit
ies a
re u
sabl
e,
sepa
rate
d fo
r pat
ient
s and
staff
, sep
arat
ed
for w
omen
and
pro
vidi
ng m
enst
rual
hyg
iene
fa
cilit
ies a
nd m
eetin
g th
e ne
eds o
f peo
ple
with
lim
ited
mob
ility
Wat
er se
rvic
e m
onito
ring
Sani
tatio
n se
rvic
e m
onito
ring
Akvo
FLO
W
Dash
boar
dDi
MES
BaSI
S Da
shbo
ard
Annu
al p
rogr
ess
repo
rtEM
IS d
atab
ase
HM
IS d
atab
ase
WRM
Impl
emen
t wat
er a
nd re
sour
ce
man
agem
ent s
trat
egie
s to
ensu
re su
stai
nabl
e w
ater
qu
ality
• W
ater
reso
urce
s are
man
aged
sust
aina
bly
to
guar
ante
e w
ater
ava
ilabi
lity
of a
ccep
tabl
e qu
ality
for c
omm
erci
al, i
ndus
tria
l and
do
mes
tic u
ses
• N
o po
llutio
n of
surfa
ce a
nd g
roun
dwat
er•
No
illeg
al m
inin
g ac
tiviti
es a
nd re
clam
atio
n of
de
grad
ed la
nds
• N
o po
llutio
n of
surfa
ce a
nd g
roun
d w
ater
re
sour
ces f
rom
agr
oche
mic
als
• De
gree
of i
nteg
rate
d w
ater
reso
urce
s m
anag
emen
t im
plem
enta
tion
(0–1
00)
• Pr
opor
tion
of b
odie
s of w
ater
with
goo
d am
bien
t wat
er q
ualit
y•
Prop
ortio
n of
tran
sbou
ndar
y ba
sin
area
with
an
oper
atio
nal a
rran
gem
ent f
or w
ater
coo
pera
tion
• Le
vel o
f wat
er st
ress
: fre
shw
ater
with
draw
al a
s a
prop
ortio
n of
ava
ilabl
e fre
shw
ater
reso
urce
s•
Chan
ge in
wat
er u
se e
ffici
ency
ove
r tim
e•
Chan
ge in
the
exte
nt o
f wat
er-r
elat
ed
ecos
yste
ms o
ver t
ime
Mon
itorin
g of
Ta
no b
asin
by
WRC
Wat
er R
esou
rce
Com
mis
sion
An
nual
Rep
ort
Tabl
e 7.
1 Di
stric
t lon
g-te
rm o
bjec
tives
, tar
gets
, met
hods
of m
easu
rem
ent a
nd m
eans
of v
erifi
catio
n fo
r the
mat
ic a
reas
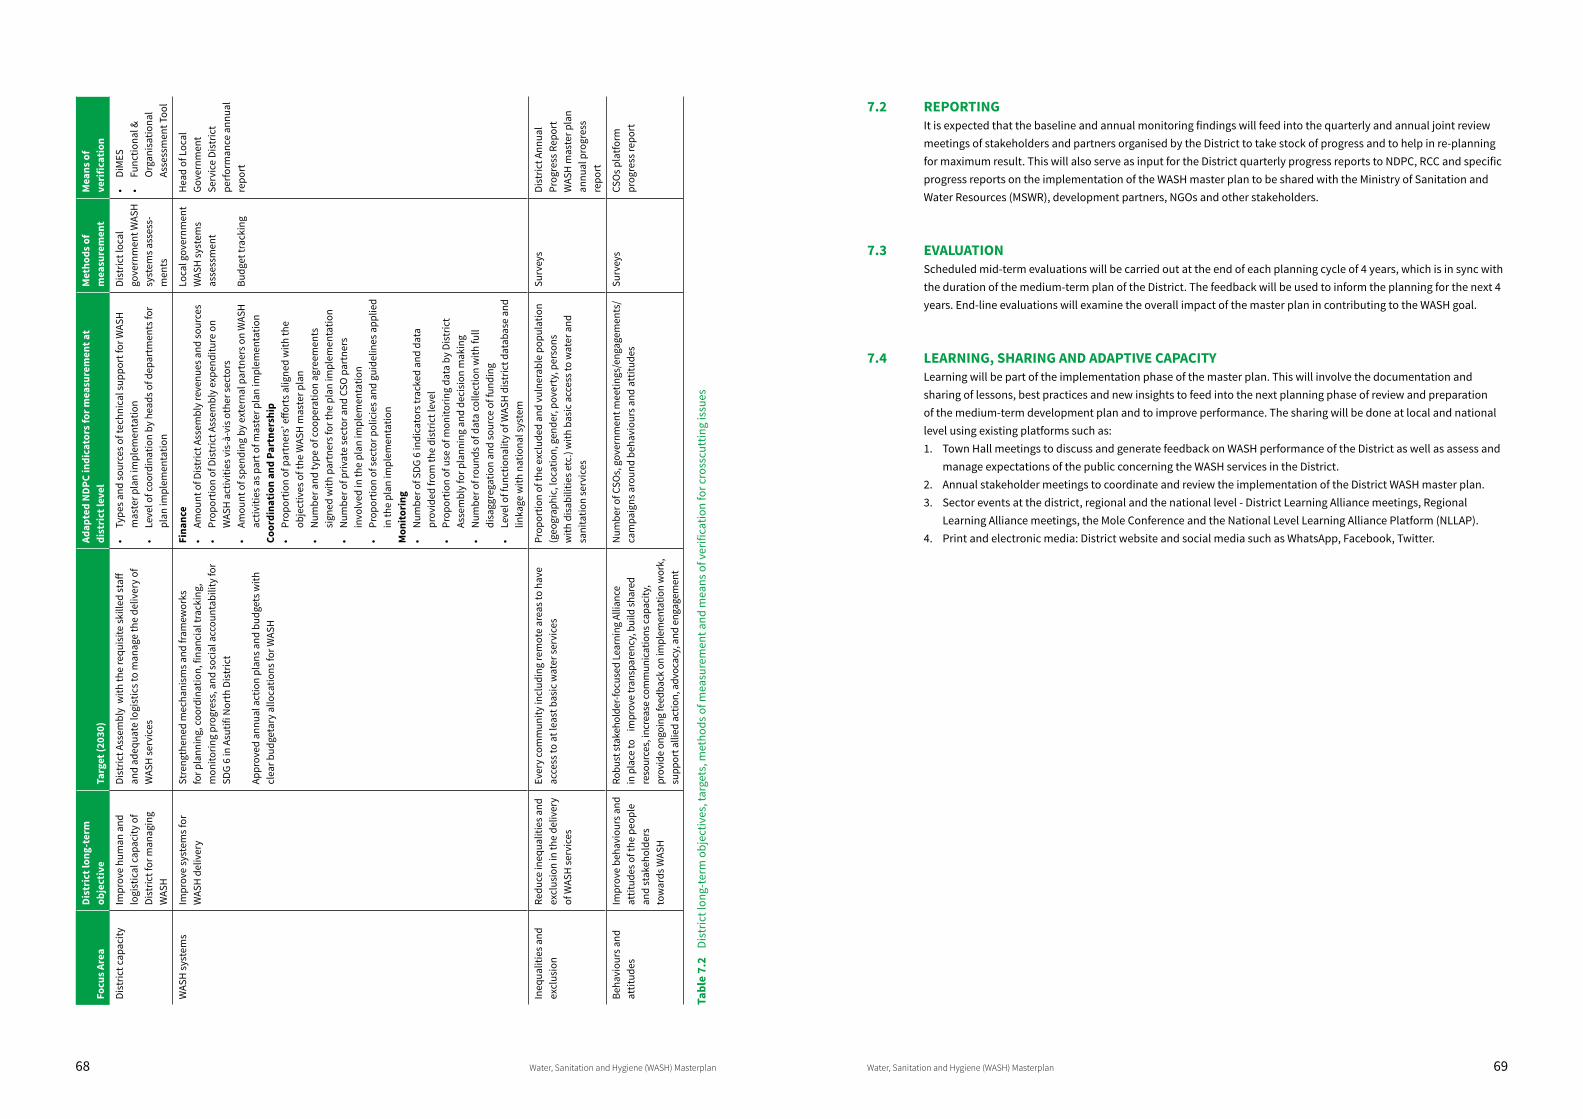
68 Water, Sanitation and Hygiene (WASH) Masterplan Water, Sanitation and Hygiene (WASH) Masterplan 69
Focu
s Are
aDi
stri
ct lo
ng-t
erm
ob
ject
ive
Targ
et (2
030)
Adap
ted
NDP
C in
dica
tors
for m
easu
rem
ent a
t di
stri
ct le
vel
Met
hods
of
mea
sure
men
tM
eans
of
veri
ficat
ion
Dist
rict c
apac
ityIm
prov
e hu
man
and
lo
gist
ical
cap
acity
of
Dist
rict f
or m
anag
ing
WAS
H
Dist
rict A
ssem
bly
with
the
requ
isite
skill
ed st
aff
and
adeq
uate
logi
stic
s to
man
age
the
deliv
ery
of
WAS
H se
rvic
es
• Ty
pes a
nd so
urce
s of t
echn
ical
supp
ort f
or W
ASH
m
aste
r pla
n im
plem
enta
tion
• Le
vel o
f coo
rdin
atio
n by
hea
ds o
f dep
artm
ents
for
plan
impl
emen
tatio
n
Dist
rict l
ocal
go
vern
men
t WAS
H
syst
ems a
sses
s-m
ents
• Di
MES
• Fu
nctio
nal &
O
rgan
isat
iona
l As
sess
men
t Too
l
WAS
H sy
stem
sIm
prov
e sy
stem
s for
W
ASH
del
iver
ySt
reng
then
ed m
echa
nism
s and
fram
ewor
ks
for p
lann
ing,
coo
rdin
atio
n, fi
nanc
ial t
rack
ing,
m
onito
ring
prog
ress
, and
soci
al a
ccou
ntab
ility
for
SDG
6 in
Asu
tifi N
orth
Dis
tric
t
Appr
oved
ann
ual a
ctio
n pl
ans a
nd b
udge
ts w
ith
clea
r bud
geta
ry a
lloca
tions
for W
ASH
Fina
nce
• Am
ount
of D
istr
ict A
ssem
bly
reve
nues
and
sour
ces
• Pr
opor
tion
of D
istr
ict A
ssem
bly
expe
nditu
re o
n W
ASH
act
iviti
es v
is-à
-vis
oth
er se
ctor
s•
Amou
nt o
f spe
ndin
g by
ext
erna
l par
tner
s on
WAS
H
activ
ities
as p
art o
f mas
ter p
lan
impl
emen
tatio
nCo
ordi
natio
n an
d Pa
rtne
rshi
p•
Prop
ortio
n of
par
tner
s’ e
ffort
s alig
ned
with
the
obje
ctiv
es o
f the
WAS
H m
aste
r pla
n•
Num
ber a
nd ty
pe o
f coo
pera
tion
agre
emen
ts
sign
ed w
ith p
artn
ers f
or th
e pl
an im
plem
enta
tion
• N
umbe
r of p
rivat
e se
ctor
and
CSO
par
tner
s in
volv
ed in
the
plan
impl
emen
tatio
n•
Prop
ortio
n of
sect
or p
olic
ies a
nd g
uide
lines
app
lied
in th
e pl
an im
plem
enta
tion
Mon
itori
ng•
Num
ber o
f SDG
6 in
dica
tors
trac
ked
and
data
pr
ovid
ed fr
om th
e di
stric
t lev
el•
Prop
ortio
n of
use
of m
onito
ring
data
by
Dist
rict
Asse
mbl
y fo
r pla
nnin
g an
d de
cisi
on m
akin
g•
Num
ber o
f rou
nds o
f dat
a co
llect
ion
with
full
disa
ggre
gatio
n an
d so
urce
of f
undi
ng•
Leve
l of f
unct
iona
lity
of W
ASH
dis
tric
t dat
abas
e an
d lin
kage
with
nat
iona
l sys
tem
Loca
l gov
ernm
ent
WAS
H sy
stem
s as
sess
men
t
Budg
et tr
acki
ng
Hea
d of
Loc
al
Gove
rnm
ent
Serv
ice
Dist
rict
perfo
rman
ce a
nnua
l re
port
Ineq
ualit
ies a
nd
excl
usio
nRe
duce
ineq
ualit
ies a
nd
excl
usio
n in
the
deliv
ery
of W
ASH
serv
ices
Ever
y co
mm
unity
incl
udin
g re
mot
e ar
eas t
o ha
ve
acce
ss to
at l
east
bas
ic w
ater
serv
ices
Prop
ortio
n of
the
excl
uded
and
vul
nera
ble
popu
latio
n (g
eogr
aphi
c, lo
catio
n, g
ende
r, po
vert
y, p
erso
ns
with
dis
abili
ties e
tc.)
with
bas
ic a
cces
s to
wat
er a
nd
sani
tatio
n se
rvic
es
Surv
eys
Dist
rict A
nnua
l Pr
ogre
ss R
epor
tW
ASH
mas
ter p
lan
annu
al p
rogr
ess
repo
rt
Beha
viou
rs a
nd
attit
udes
Impr
ove
beha
viou
rs a
nd
attit
udes
of t
he p
eopl
e an
d st
akeh
olde
rs
tow
ards
WAS
H
Robu
st st
akeh
olde
r-foc
used
Lea
rnin
g Al
lianc
e in
pla
ce to
im
prov
e tr
ansp
aren
cy, b
uild
shar
ed
reso
urce
s, in
crea
se co
mm
unic
atio
ns ca
paci
ty,
prov
ide
ongo
ing
feed
back
on
impl
emen
tatio
n w
ork,
su
ppor
t alli
ed a
ctio
n, a
dvoc
acy,
and
eng
agem
ent
Num
ber o
f CSO
s, g
over
nmen
t mee
tings
/eng
agem
ents
/ca
mpa
igns
aro
und
beha
viou
rs a
nd a
ttitu
des
Surv
eys
CSO
s pla
tform
pr
ogre
ss re
port
Tabl
e 7.
2 Di
stric
t lon
g-te
rm o
bjec
tives
, tar
gets
, met
hods
of m
easu
rem
ent a
nd m
eans
of v
erifi
catio
n fo
r cro
sscu
ttin
g is
sues
7.2 REPORTINGIt is expected that the baseline and annual monitoring findings will feed into the quarterly and annual joint review meetings of stakeholders and partners organised by the District to take stock of progress and to help in re-planning for maximum result. This will also serve as input for the District quarterly progress reports to NDPC, RCC and specific progress reports on the implementation of the WASH master plan to be shared with the Ministry of Sanitation and Water Resources (MSWR), development partners, NGOs and other stakeholders.
7.3 EVALUATIONScheduled mid-term evaluations will be carried out at the end of each planning cycle of 4 years, which is in sync with the duration of the medium-term plan of the District. The feedback will be used to inform the planning for the next 4 years. End-line evaluations will examine the overall impact of the master plan in contributing to the WASH goal.
7.4 LEARNING, SHARING AND ADAPTIVE CAPACITYLearning will be part of the implementation phase of the master plan. This will involve the documentation and sharing of lessons, best practices and new insights to feed into the next planning phase of review and preparation of the medium-term development plan and to improve performance. The sharing will be done at local and national level using existing platforms such as:1. Town Hall meetings to discuss and generate feedback on WASH performance of the District as well as assess and
manage expectations of the public concerning the WASH services in the District.2. Annual stakeholder meetings to coordinate and review the implementation of the District WASH master plan. 3. Sector events at the district, regional and the national level - District Learning Alliance meetings, Regional
Learning Alliance meetings, the Mole Conference and the National Level Learning Alliance Platform (NLLAP).4. Print and electronic media: District website and social media such as WhatsApp, Facebook, Twitter.
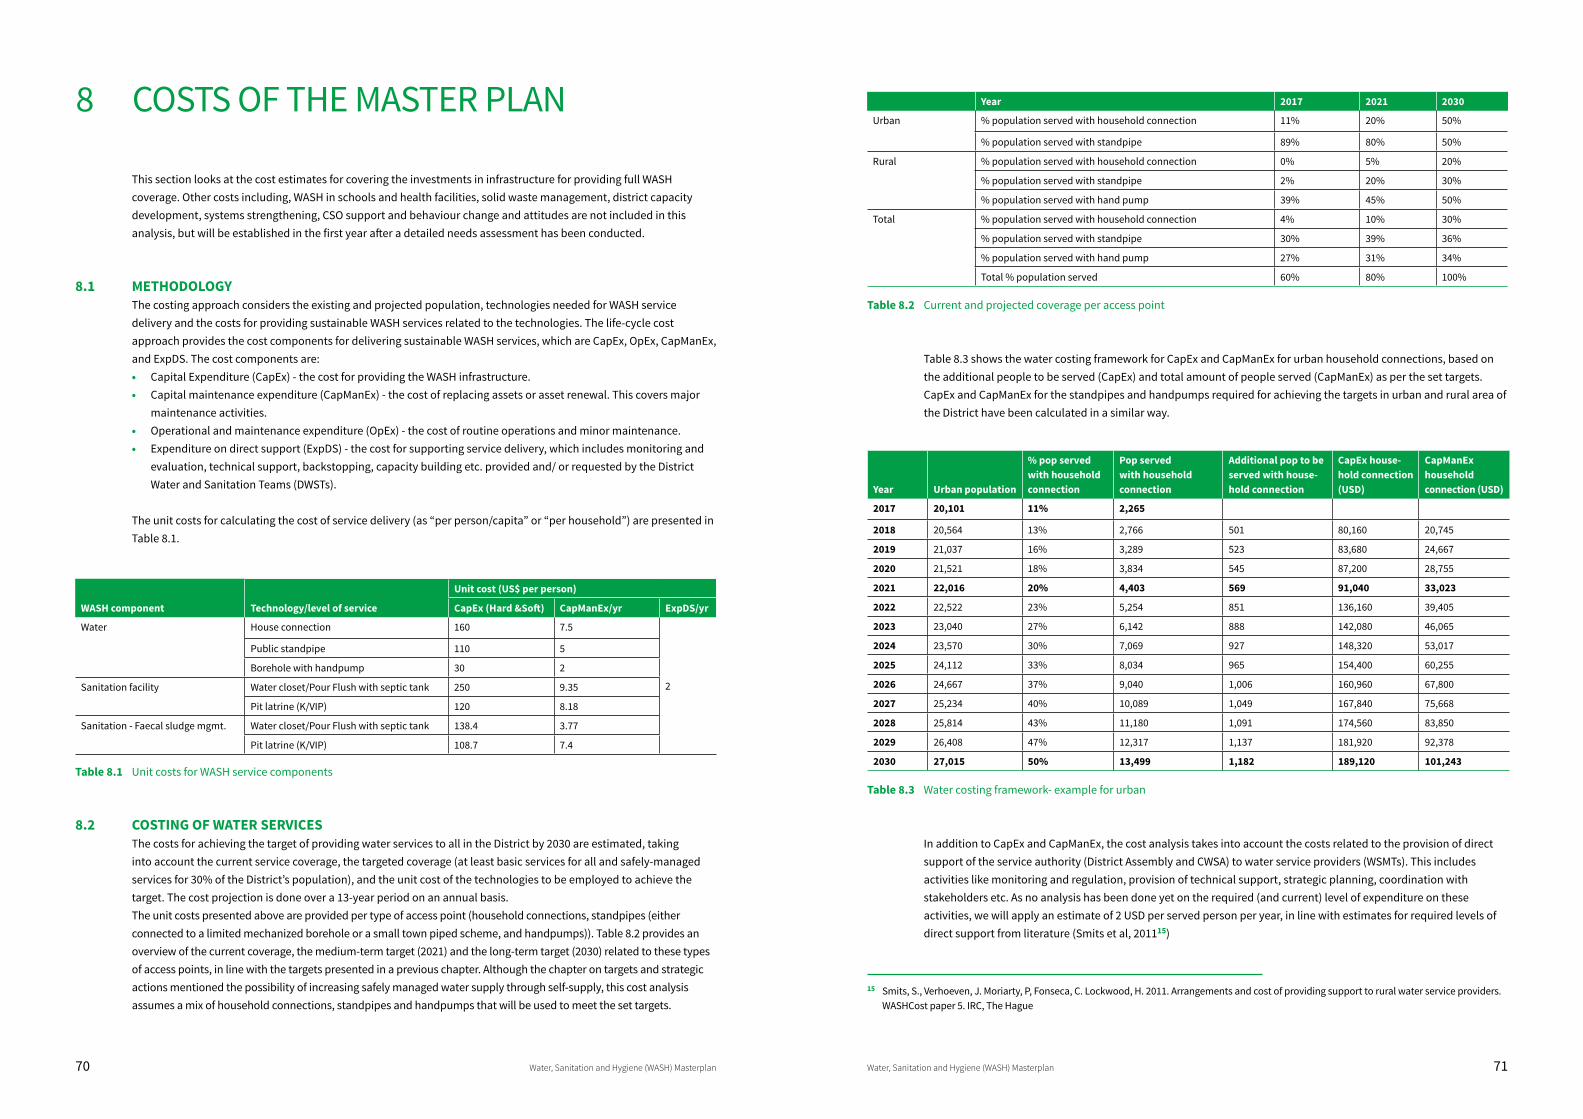
70 Water, Sanitation and Hygiene (WASH) Masterplan Water, Sanitation and Hygiene (WASH) Masterplan 71
8 COSTS OF THE MASTER PLAN
This section looks at the cost estimates for covering the investments in infrastructure for providing full WASH coverage. Other costs including, WASH in schools and health facilities, solid waste management, district capacity development, systems strengthening, CSO support and behaviour change and attitudes are not included in this analysis, but will be established in the first year after a detailed needs assessment has been conducted.
8.1 METHODOLOGYThe costing approach considers the existing and projected population, technologies needed for WASH service delivery and the costs for providing sustainable WASH services related to the technologies. The life-cycle cost approach provides the cost components for delivering sustainable WASH services, which are CapEx, OpEx, CapManEx, and ExpDS. The cost components are:• Capital Expenditure (CapEx) - the cost for providing the WASH infrastructure.• Capital maintenance expenditure (CapManEx) - the cost of replacing assets or asset renewal. This covers major
maintenance activities.• Operational and maintenance expenditure (OpEx) - the cost of routine operations and minor maintenance. • Expenditure on direct support (ExpDS) - the cost for supporting service delivery, which includes monitoring and
evaluation, technical support, backstopping, capacity building etc. provided and/ or requested by the District Water and Sanitation Teams (DWSTs).
The unit costs for calculating the cost of service delivery (as “per person/capita” or “per household”) are presented in Table 8.1.
WASH component Technology/level of service
Unit cost (US$ per person)
CapEx (Hard &Soft) CapManEx/yr ExpDS/yr
Water House connection 160 7.5
2
Public standpipe 110 5
Borehole with handpump 30 2
Sanitation facility Water closet/Pour Flush with septic tank 250 9.35
Pit latrine (K/VIP) 120 8.18
Sanitation - Faecal sludge mgmt. Water closet/Pour Flush with septic tank 138.4 3.77
Pit latrine (K/VIP) 108.7 7.4
Table 8.1 Unit costs for WASH service components
8.2 COSTING OF WATER SERVICESThe costs for achieving the target of providing water services to all in the District by 2030 are estimated, taking into account the current service coverage, the targeted coverage (at least basic services for all and safely-managed services for 30% of the District’s population), and the unit cost of the technologies to be employed to achieve the target. The cost projection is done over a 13-year period on an annual basis.The unit costs presented above are provided per type of access point (household connections, standpipes (either connected to a limited mechanized borehole or a small town piped scheme, and handpumps)). Table 8.2 provides an overview of the current coverage, the medium-term target (2021) and the long-term target (2030) related to these types of access points, in line with the targets presented in a previous chapter. Although the chapter on targets and strategic actions mentioned the possibility of increasing safely managed water supply through self-supply, this cost analysis assumes a mix of household connections, standpipes and handpumps that will be used to meet the set targets.
Year 2017 2021 2030
Urban % population served with household connection 11% 20% 50%
% population served with standpipe 89% 80% 50%
Rural % population served with household connection 0% 5% 20%
% population served with standpipe 2% 20% 30%
% population served with hand pump 39% 45% 50%
Total % population served with household connection 4% 10% 30%
% population served with standpipe 30% 39% 36%
% population served with hand pump 27% 31% 34%
Total % population served 60% 80% 100%
Table 8.2 Current and projected coverage per access point
Table 8.3 shows the water costing framework for CapEx and CapManEx for urban household connections, based on the additional people to be served (CapEx) and total amount of people served (CapManEx) as per the set targets. CapEx and CapManEx for the standpipes and handpumps required for achieving the targets in urban and rural area of the District have been calculated in a similar way.
Year Urban population
% pop served with household connection
Pop served with household connection
Additional pop to be served with house-hold connection
CapEx house-hold connection (USD)
CapManEx household connection (USD)
2017 20,101 11% 2,265
2018 20,564 13% 2,766 501 80,160 20,745
2019 21,037 16% 3,289 523 83,680 24,667
2020 21,521 18% 3,834 545 87,200 28,755
2021 22,016 20% 4,403 569 91,040 33,023
2022 22,522 23% 5,254 851 136,160 39,405
2023 23,040 27% 6,142 888 142,080 46,065
2024 23,570 30% 7,069 927 148,320 53,017
2025 24,112 33% 8,034 965 154,400 60,255
2026 24,667 37% 9,040 1,006 160,960 67,800
2027 25,234 40% 10,089 1,049 167,840 75,668
2028 25,814 43% 11,180 1,091 174,560 83,850
2029 26,408 47% 12,317 1,137 181,920 92,378
2030 27,015 50% 13,499 1,182 189,120 101,243
Table 8.3 Water costing framework- example for urban
In addition to CapEx and CapManEx, the cost analysis takes into account the costs related to the provision of direct support of the service authority (District Assembly and CWSA) to water service providers (WSMTs). This includes activities like monitoring and regulation, provision of technical support, strategic planning, coordination with stakeholders etc. As no analysis has been done yet on the required (and current) level of expenditure on these activities, we will apply an estimate of 2 USD per served person per year, in line with estimates for required levels of direct support from literature (Smits et al, 201115)
15 Smits, S., Verhoeven, J. Moriarty, P, Fonseca, C. Lockwood, H. 2011. Arrangements and cost of providing support to rural water service providers. WASHCost paper 5. IRC, The Hague
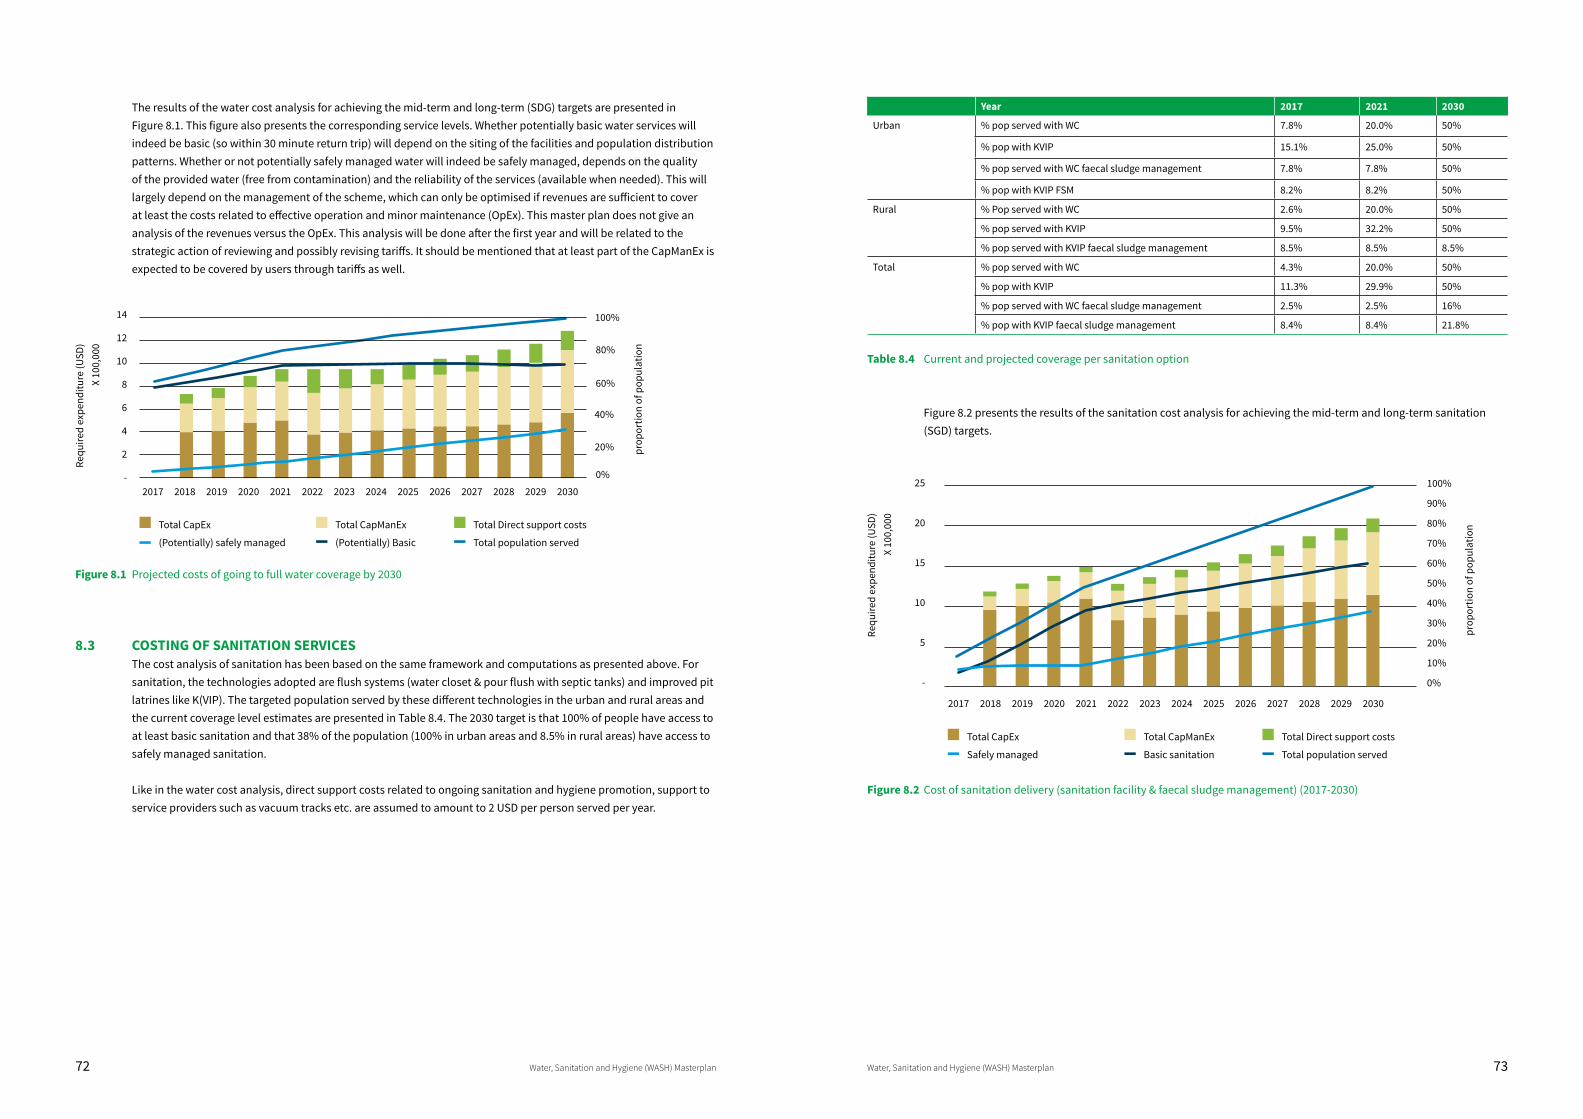
72 Water, Sanitation and Hygiene (WASH) Masterplan Water, Sanitation and Hygiene (WASH) Masterplan 73
The results of the water cost analysis for achieving the mid-term and long-term (SDG) targets are presented in Figure 8.1. This figure also presents the corresponding service levels. Whether potentially basic water services will indeed be basic (so within 30 minute return trip) will depend on the siting of the facilities and population distribution patterns. Whether or not potentially safely managed water will indeed be safely managed, depends on the quality of the provided water (free from contamination) and the reliability of the services (available when needed). This will largely depend on the management of the scheme, which can only be optimised if revenues are sufficient to cover at least the costs related to effective operation and minor maintenance (OpEx). This master plan does not give an analysis of the revenues versus the OpEx. This analysis will be done after the first year and will be related to the strategic action of reviewing and possibly revising tariffs. It should be mentioned that at least part of the CapManEx is expected to be covered by users through tariffs as well.
100%
80%
60%
40%
20%
0%
14
12
10
8
6
4
2
-2017 2018 2019 2020 2021 2022 2023 2024 2025 2026 2027 2028 2029 2030
prop
ortio
n of
pop
ulat
ion
Requ
ired
expe
nditu
re (U
SD)
X 10
0,00
0
Total CapEx Total CapManEx Total Direct support costs
(Potentially) safely managed (Potentially) Basic Total population served
Figure 8.1 Projected costs of going to full water coverage by 2030
8.3 COSTING OF SANITATION SERVICESThe cost analysis of sanitation has been based on the same framework and computations as presented above. For sanitation, the technologies adopted are flush systems (water closet & pour flush with septic tanks) and improved pit latrines like K(VIP). The targeted population served by these different technologies in the urban and rural areas and the current coverage level estimates are presented in Table 8.4. The 2030 target is that 100% of people have access to at least basic sanitation and that 38% of the population (100% in urban areas and 8.5% in rural areas) have access to safely managed sanitation.
Like in the water cost analysis, direct support costs related to ongoing sanitation and hygiene promotion, support to service providers such as vacuum tracks etc. are assumed to amount to 2 USD per person served per year.
Year 2017 2021 2030
Urban % pop served with WC 7.8% 20.0% 50%
% pop with KVIP 15.1% 25.0% 50%
% pop served with WC faecal sludge management 7.8% 7.8% 50%
% pop with KVIP FSM 8.2% 8.2% 50%
Rural % Pop served with WC 2.6% 20.0% 50%
% pop served with KVIP 9.5% 32.2% 50%
% pop served with KVIP faecal sludge management 8.5% 8.5% 8.5%
Total % pop served with WC 4.3% 20.0% 50%
% pop with KVIP 11.3% 29.9% 50%
% pop served with WC faecal sludge management 2.5% 2.5% 16%
% pop with KVIP faecal sludge management 8.4% 8.4% 21.8%
Table 8.4 Current and projected coverage per sanitation option
Figure 8.2 presents the results of the sanitation cost analysis for achieving the mid-term and long-term sanitation (SGD) targets.
2017 2018 2019 2020 2021 2022 2023 2024 2025 2026 2027 2028 2029 2030
Total CapEx Total CapManEx Total Direct support costs
Safely managed Basic sanitation Total population served
100%
90%
80%
70%
60%
50%
40%
30%
20%
10%
0%
prop
ortio
n of
pop
ulat
ion
Requ
ired
expe
nditu
re (U
SD)
X 10
0,00
0
25
20
15
10
5
-
Figure 8.2 Cost of sanitation delivery (sanitation facility & faecal sludge management) (2017-2030)
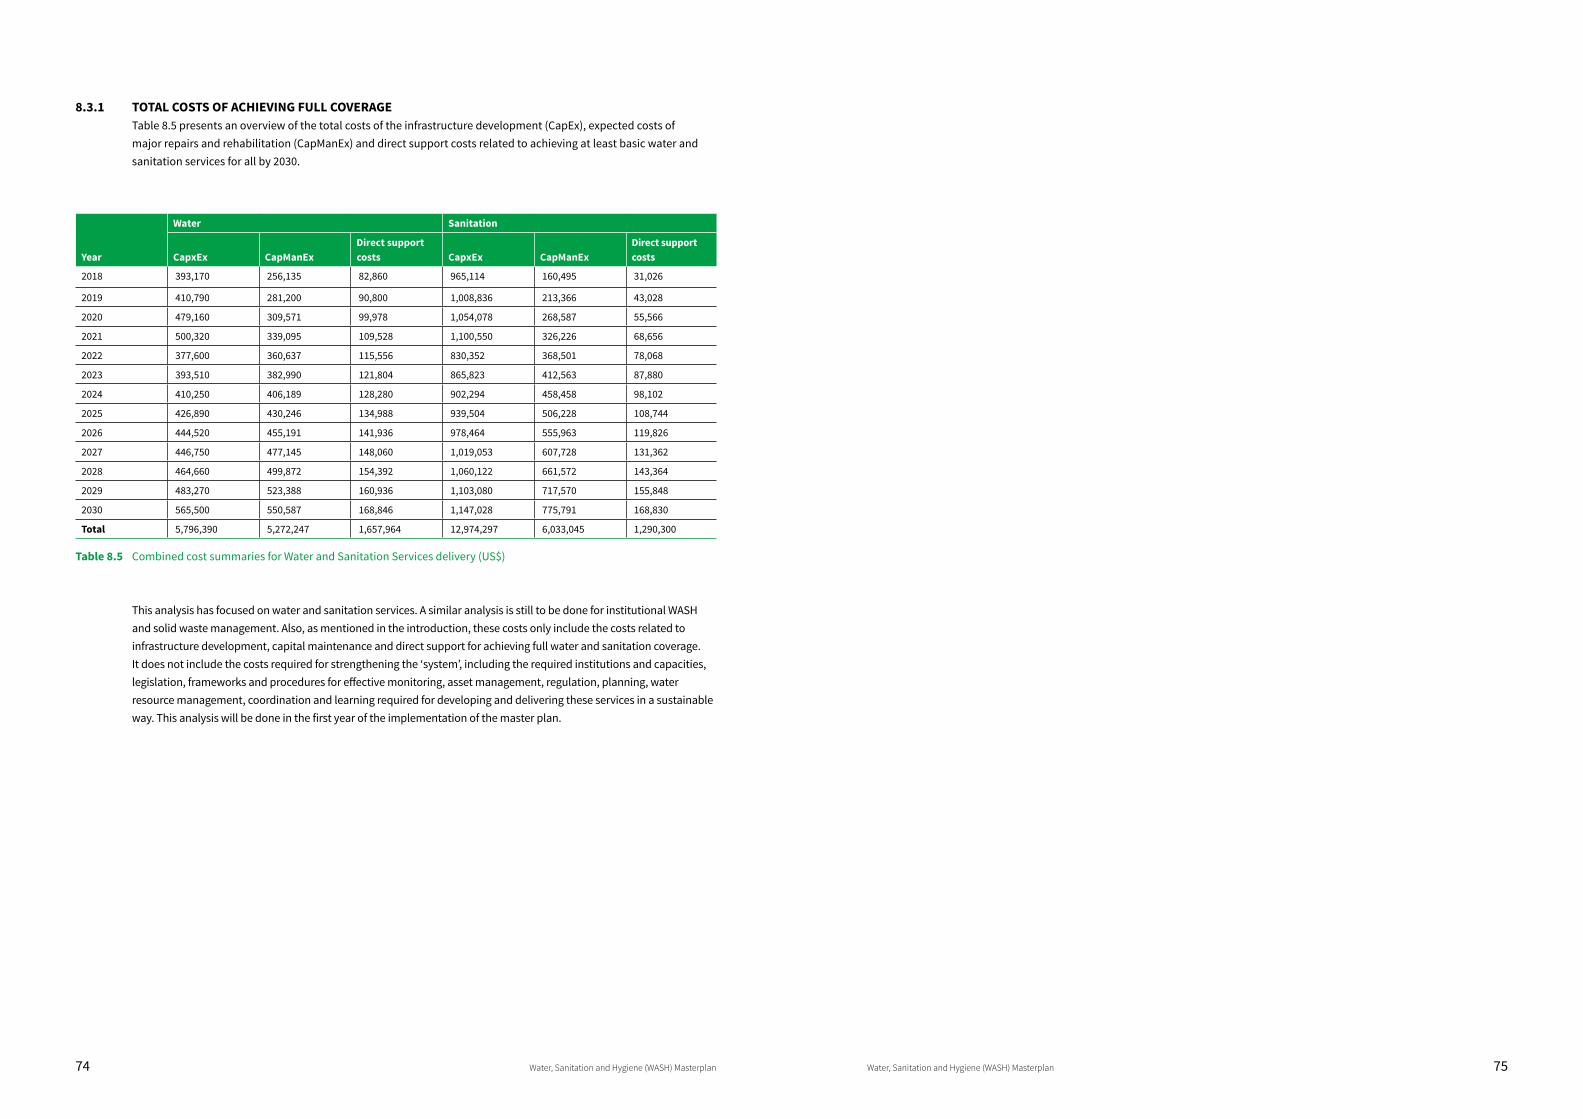
74 Water, Sanitation and Hygiene (WASH) Masterplan Water, Sanitation and Hygiene (WASH) Masterplan 75
8.3.1 TOTAL COSTS OF ACHIEVING FULL COVERAGETable 8.5 presents an overview of the total costs of the infrastructure development (CapEx), expected costs of major repairs and rehabilitation (CapManEx) and direct support costs related to achieving at least basic water and sanitation services for all by 2030.
Year
Water Sanitation
CapxEx CapManExDirect support costs CapxEx CapManEx
Direct support costs
2018 393,170 256,135 82,860 965,114 160,495 31,026
2019 410,790 281,200 90,800 1,008,836 213,366 43,028
2020 479,160 309,571 99,978 1,054,078 268,587 55,566
2021 500,320 339,095 109,528 1,100,550 326,226 68,656
2022 377,600 360,637 115,556 830,352 368,501 78,068
2023 393,510 382,990 121,804 865,823 412,563 87,880
2024 410,250 406,189 128,280 902,294 458,458 98,102
2025 426,890 430,246 134,988 939,504 506,228 108,744
2026 444,520 455,191 141,936 978,464 555,963 119,826
2027 446,750 477,145 148,060 1,019,053 607,728 131,362
2028 464,660 499,872 154,392 1,060,122 661,572 143,364
2029 483,270 523,388 160,936 1,103,080 717,570 155,848
2030 565,500 550,587 168,846 1,147,028 775,791 168,830
Total 5,796,390 5,272,247 1,657,964 12,974,297 6,033,045 1,290,300
Table 8.5 Combined cost summaries for Water and Sanitation Services delivery (US$)
This analysis has focused on water and sanitation services. A similar analysis is still to be done for institutional WASH and solid waste management. Also, as mentioned in the introduction, these costs only include the costs related to infrastructure development, capital maintenance and direct support for achieving full water and sanitation coverage. It does not include the costs required for strengthening the ‘system’, including the required institutions and capacities, legislation, frameworks and procedures for effective monitoring, asset management, regulation, planning, water resource management, coordination and learning required for developing and delivering these services in a sustainable way. This analysis will be done in the first year of the implementation of the master plan.
76 Water, Sanitation and Hygiene (WASH) Masterplan Water, Sanitation and Hygiene (WASH) Masterplan 77
Asutifi North District Assembly (2016). Annual Progress Report for 2016
Asutifi North District Assembly (2017). Water Service Monitoring Baseline Report
District Planning and Coordinating Unit (2014). 2014-2017 Medium-Term Development Plan (Draft Report). Asutifi North District Assembly
Ghana Statistical Service (2014). 2010 Population & Housing Census. District Analytical Report. Asutifi North District
Ministry Water Resources Works and Housing (2014). Water Sector Strategic Development Plan (2012-2025). MWRWH, Accra
Smits, S., Verhoeven, J. Moriarty, P, Fonseca, C. Lockwood, H. 2011. Arrangements and cost of providing support to rural water service providers. WASHCost paper 5. IRC, The Hague
WHO/UNICEF (2017). Progress on drinking water, sanitation and hygiene: 2017 update and SGD baselines. Geneva: World Health Organization and the United Nations Children’s Fund, 2017, Licence: CC BY-NC-SA 3.0 IGO
Water Resource Commission (2012). Tano Basin: Integrated Water Resource Management Plan. WRC, Accra
For detailed information about Ghana’s local government system and decentralised WASH service delivery; The Masterplan small towns asset register and Asutifi North water point sources asset register and plan, please find the links to the annexes online:
ANNEX 1 GHANA’S LOCAL GOVERNMENT SYSTEM AND DECENTRALISED WASH SERVICE DELIVERY
https://www.ircwash.org/sites/default/files/masterplan_local_government_system_and_decentralised_wash_service_delivery_annex_1.pdf
ANNEX 2 MASTER PLAN SMALL TOWNS ASSET REGISTER
https://www.ircwash.org/sites/default/files/masterplan_small_towns_asset_register_annex_2.xlsx
ANNEX 3 ASUTIFI NORTH WATER POINT SOURCES ASSET REGISTER AND PLAN
https://www.ircwash.org/sites/default/files/masterplan_point_sources_asset_register_annex_3.xlsx
REFERENCE LIST ANNEXES