26

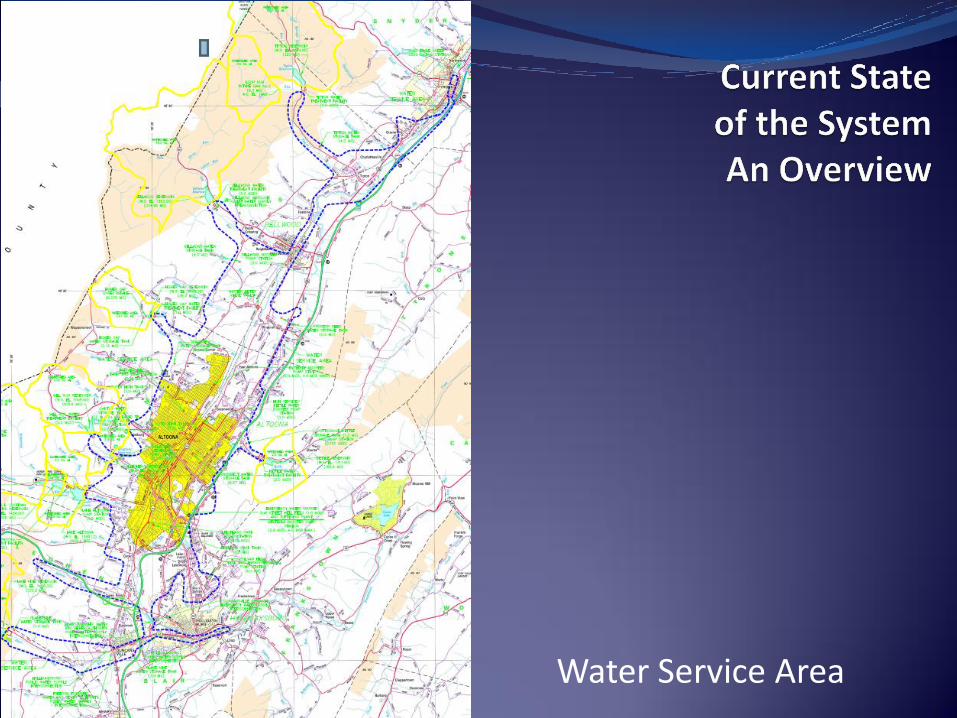
Water Service Area
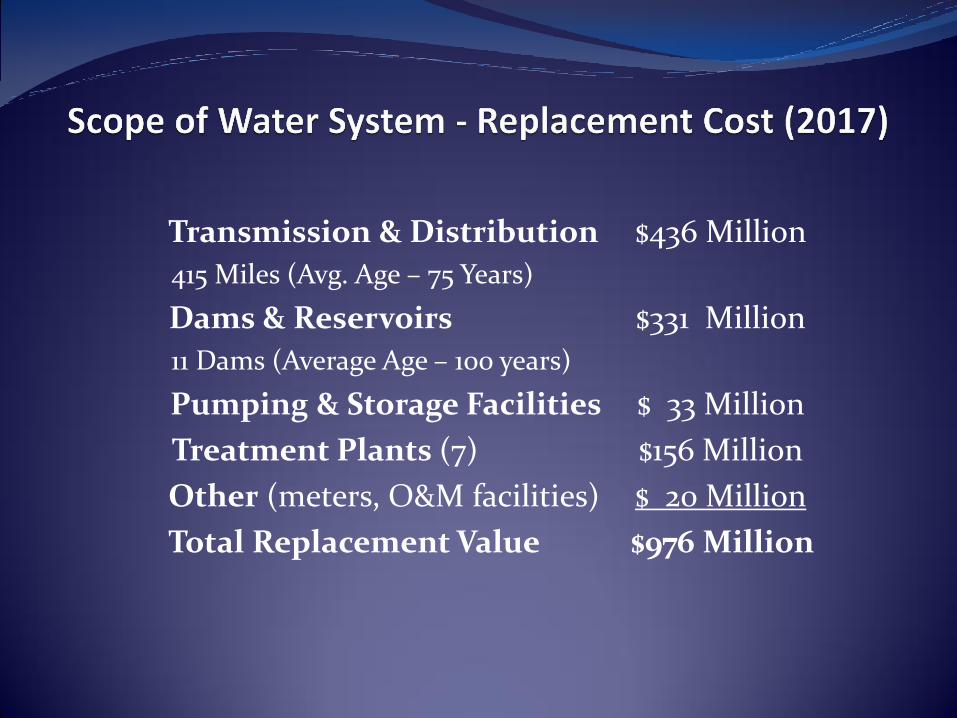
Transmission & Distribution $436 Million
415 Miles (Avg. Age – 75 Years)
Dams & Reservoirs $331 Million
11 Dams (Average Age – 100 years)
Pumping & Storage Facilities $ 33 Million
Treatment Plants (7) $156 Million
Other (meters, O&M facilities) $ 20 Million
Total Replacement Value $976 Million
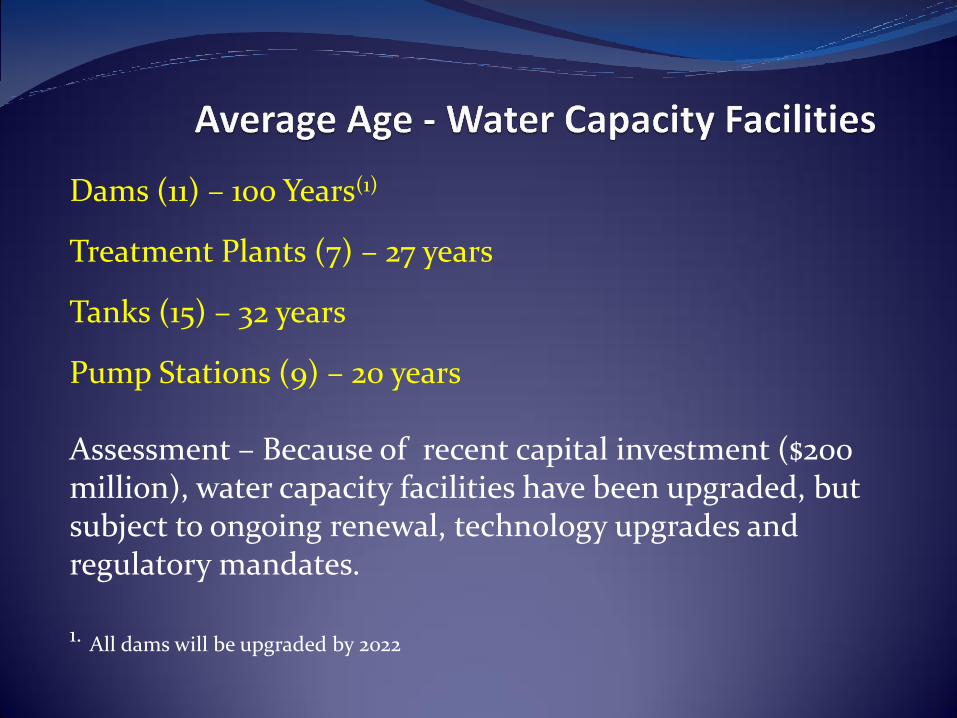
Dams (11) – 100 Years(1)
Treatment Plants (7) – 27 years
Tanks (15) – 32 years
Pump Stations (9) – 20 years Assessment – Because of recent capital investment ($200 million), water capacity facilities have been upgraded, but subject to ongoing renewal, technology upgrades and regulatory mandates. 1. All dams will be upgraded by 2022
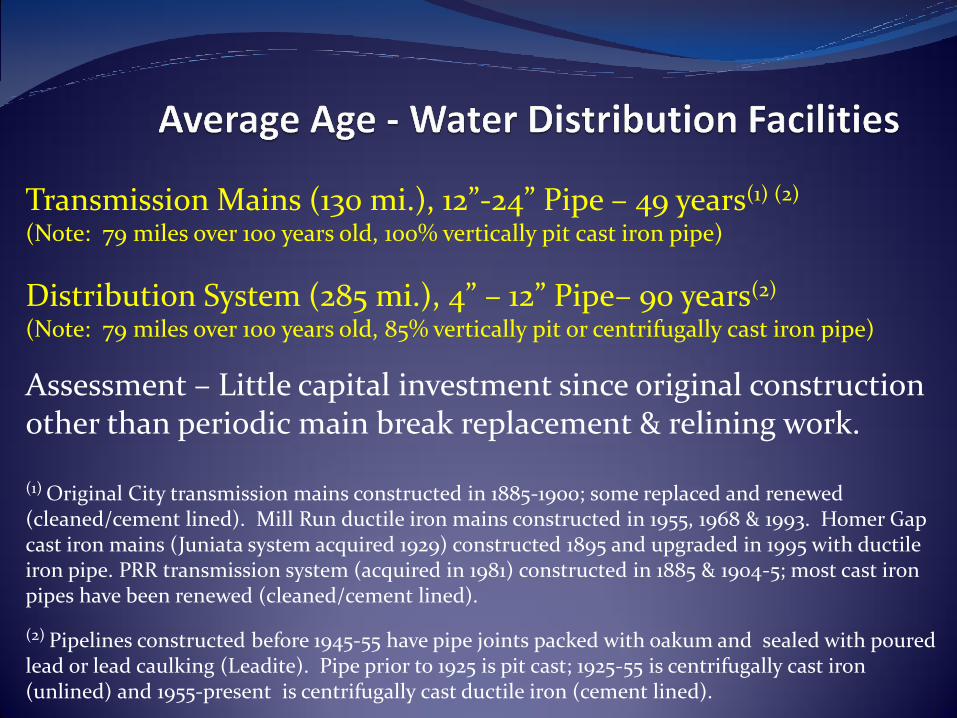
Transmission Mains (130 mi.), 12”-24” Pipe – 49 years(1) (2)
(Note: 79 miles over 100 years old, 100% vertically pit cast iron pipe)
Distribution System (285 mi.), 4” – 12” Pipe– 90 years(2) (Note: 79 miles over 100 years old, 85% vertically pit or centrifugally cast iron pipe)
Assessment – Little capital investment since original construction other than periodic main break replacement & relining work. (1) Original City transmission mains constructed in 1885-1900; some replaced and renewed (cleaned/cement lined). Mill Run ductile iron mains constructed in 1955, 1968 & 1993. Homer Gap cast iron mains (Juniata system acquired 1929) constructed 1895 and upgraded in 1995 with ductile iron pipe. PRR transmission system (acquired in 1981) constructed in 1885 & 1904-5; most cast iron pipes have been renewed (cleaned/cement lined).
(2) Pipelines constructed before 1945-55 have pipe joints packed with oakum and sealed with poured lead or lead caulking (Leadite). Pipe prior to 1925 is pit cast; 1925-55 is centrifugally cast iron (unlined) and 1955-present is centrifugally cast ductile iron (cement lined).
Unaccounted-For-Water Increasing • Due to Leakage - Now 30% Hydraulic Capacity Problems • 50 Miles of 120 year old, undersized, cast iron pipe (4-inch dia.
and less); principally in Juniata and old Allegheny Water Company system
Reoccurring Main Breaks • Logan Boulevard, Grazierville, etc.
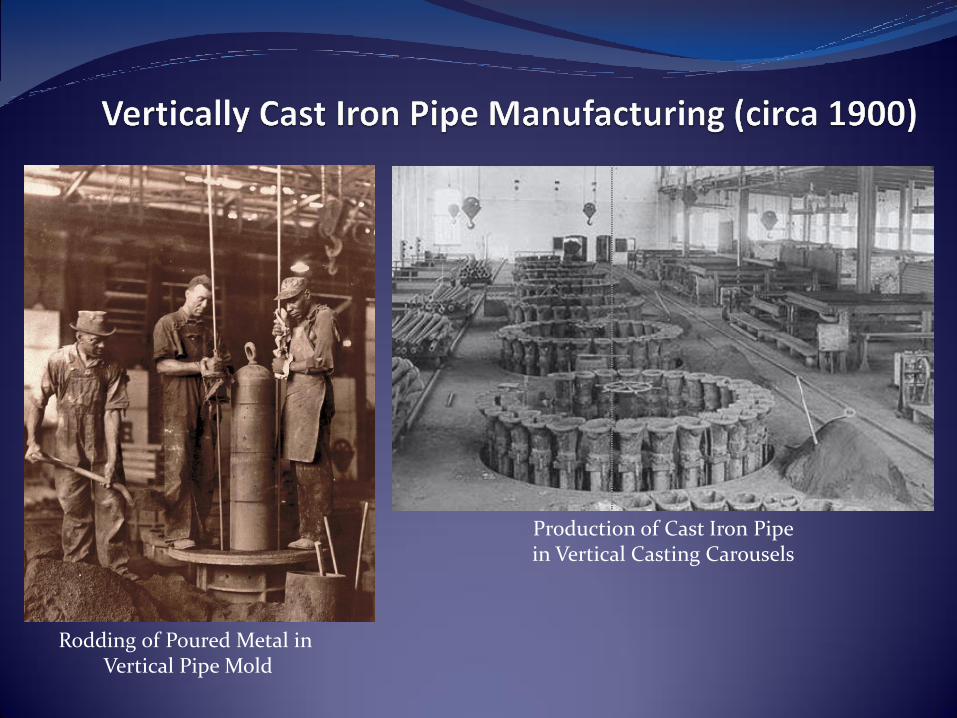
Production of Cast Iron Pipe in Vertical Casting Carousels
Rodding of Poured Metal in Vertical Pipe Mold
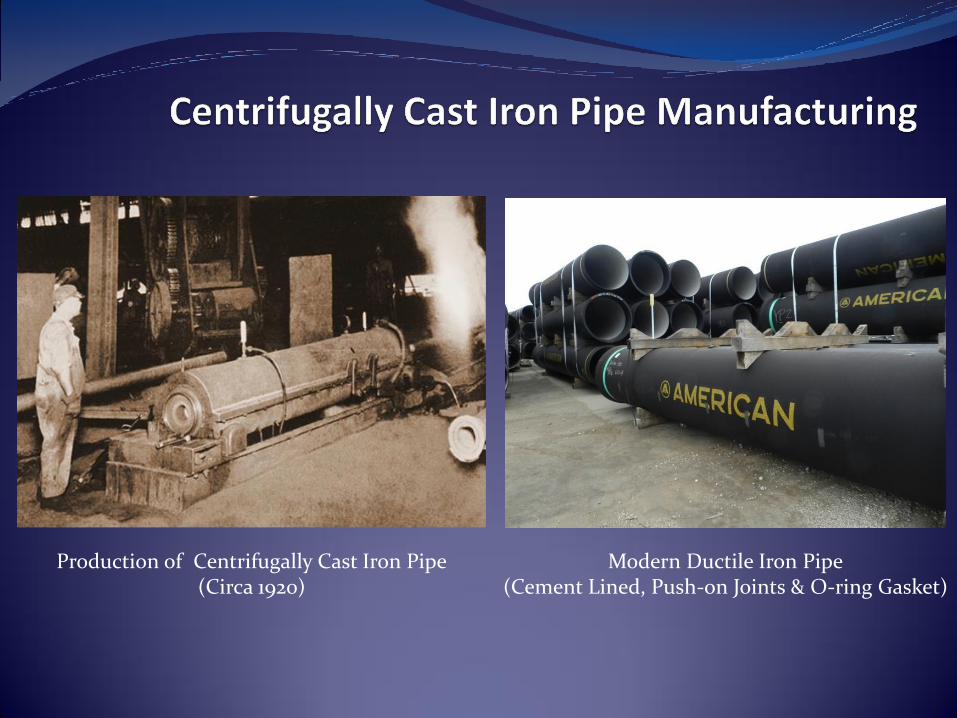
Production of Centrifugally Cast Iron Pipe (Circa 1920)
Modern Ductile Iron Pipe (Cement Lined, Push-on Joints & O-ring Gasket)
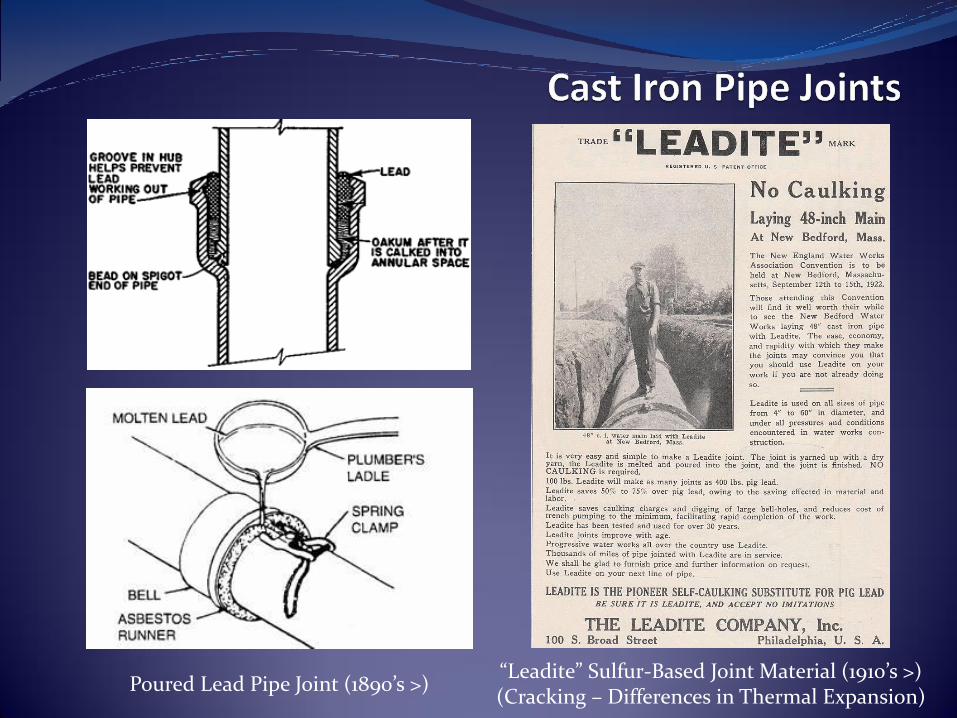
Poured Lead Pipe Joint (1890’s >) “Leadite” Sulfur-Based Joint Material (1910’s >) (Cracking – Differences in Thermal Expansion)
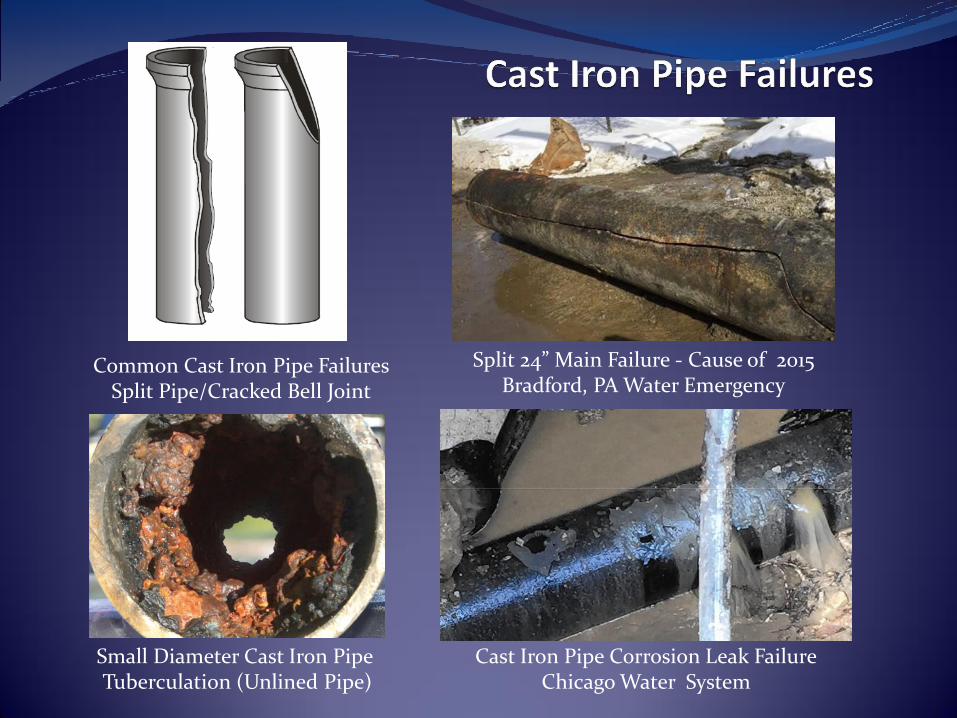
Split 24” Main Failure - Cause of 2015 Bradford, PA Water Emergency
Common Cast Iron Pipe Failures Split Pipe/Cracked Bell Joint
Cast Iron Pipe Corrosion Leak Failure Chicago Water System
Small Diameter Cast Iron Pipe Tuberculation (Unlined Pipe)
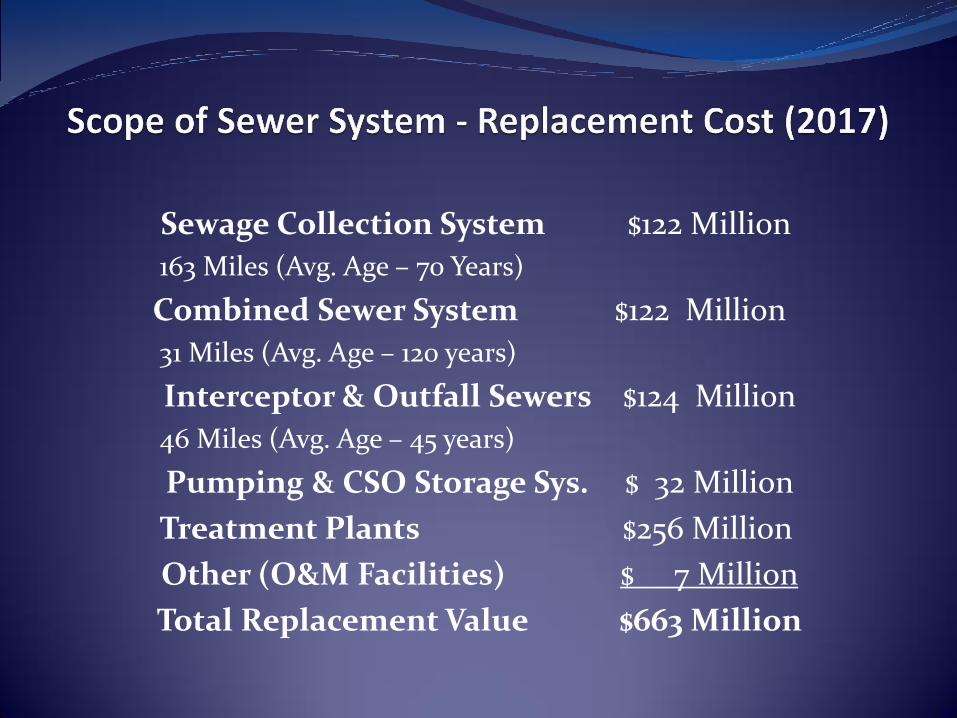
Sewage Collection System $122 Million
163 Miles (Avg. Age – 70 Years)
Combined Sewer System $122 Million
31 Miles (Avg. Age – 120 years)
Interceptor & Outfall Sewers $124 Million
46 Miles (Avg. Age – 45 years)
Pumping & CSO Storage Sys. $ 32 Million
Treatment Plants $256 Million
Other (O&M Facilities) $ 7 Million
Total Replacement Value $663 Million
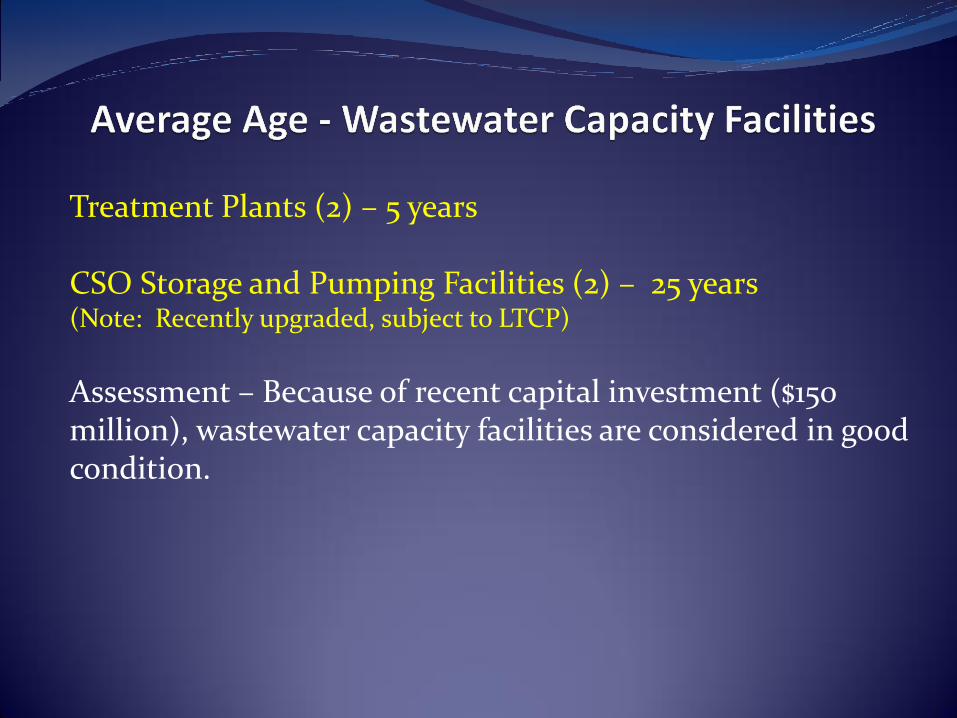
Treatment Plants (2) – 5 years CSO Storage and Pumping Facilities (2) – 25 years (Note: Recently upgraded, subject to LTCP)
Assessment – Because of recent capital investment ($150 million), wastewater capacity facilities are considered in good condition.
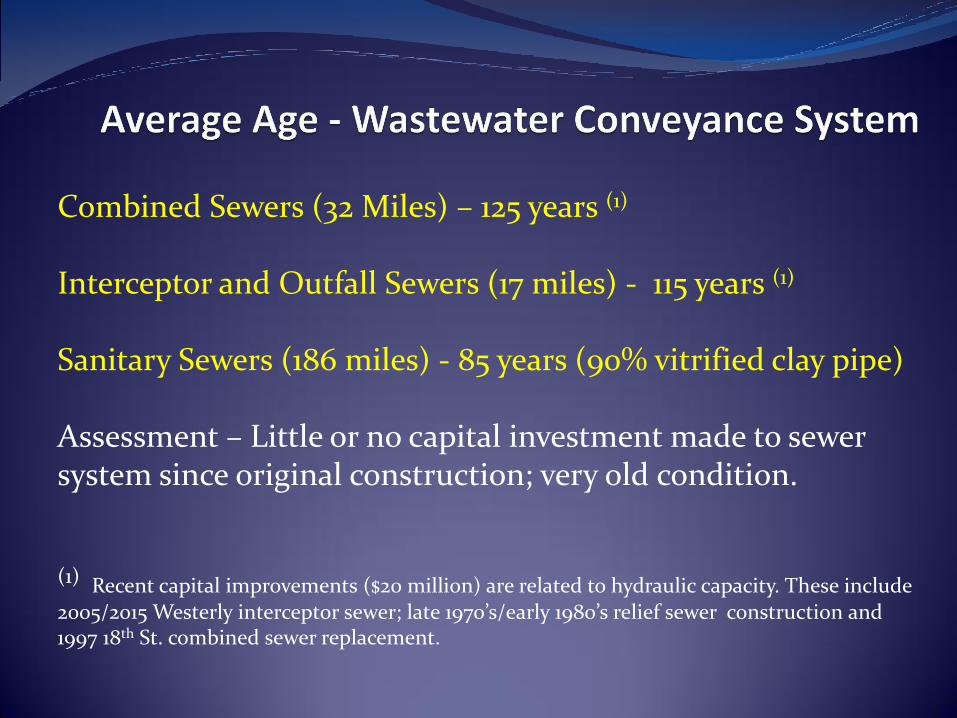
Combined Sewers (32 Miles) – 125 years (1)
Interceptor and Outfall Sewers (17 miles) - 115 years (1)
Sanitary Sewers (186 miles) - 85 years (90% vitrified clay pipe) Assessment – Little or no capital investment made to sewer system since original construction; very old condition. (1) Recent capital improvements ($20 million) are related to hydraulic capacity. These include 2005/2015 Westerly interceptor sewer; late 1970’s/early 1980’s relief sewer construction and 1997 18th St. combined sewer replacement.
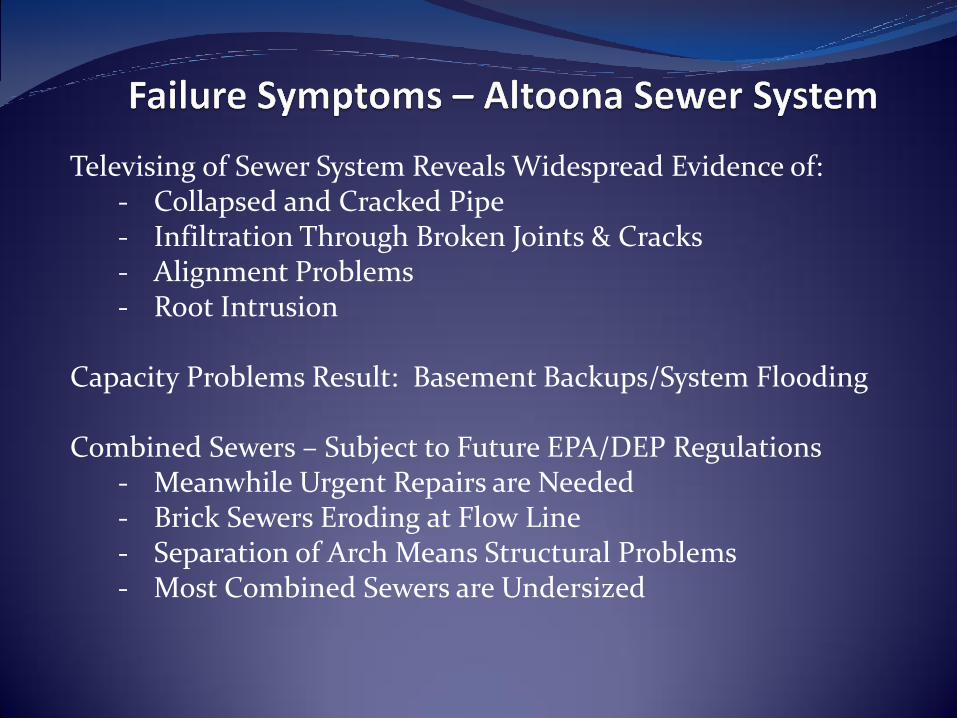
Televising of Sewer System Reveals Widespread Evidence of: - Collapsed and Cracked Pipe - Infiltration Through Broken Joints & Cracks - Alignment Problems - Root Intrusion
Capacity Problems Result: Basement Backups/System Flooding Combined Sewers – Subject to Future EPA/DEP Regulations
- Meanwhile Urgent Repairs are Needed - Brick Sewers Eroding at Flow Line - Separation of Arch Means Structural Problems - Most Combined Sewers are Undersized
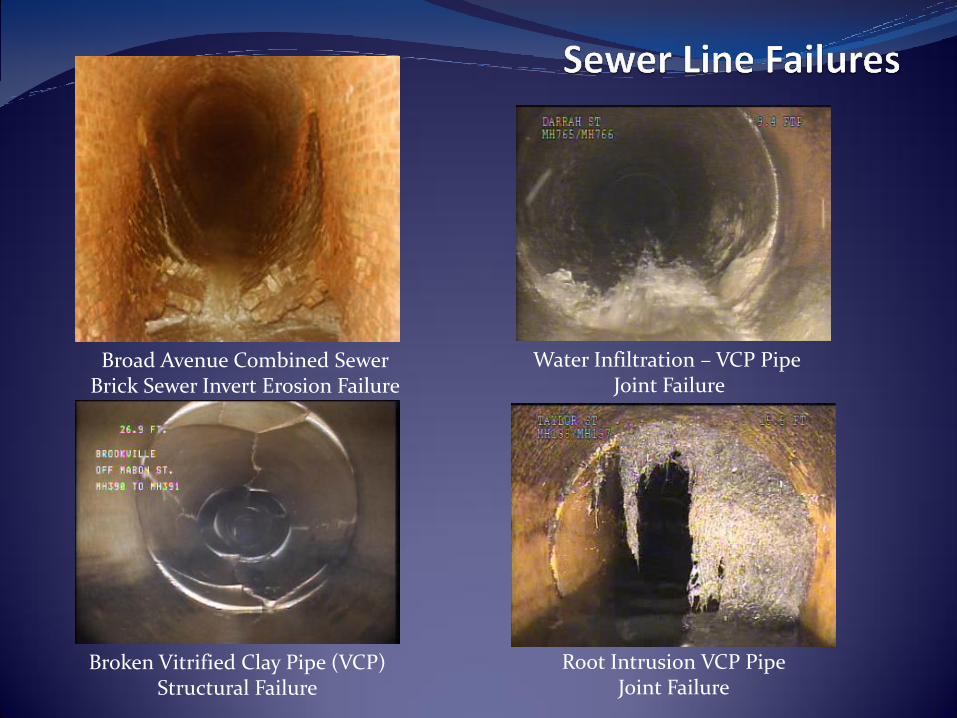
Water Infiltration – VCP Pipe Joint Failure
Broad Avenue Combined Sewer Brick Sewer Invert Erosion Failure
Root Intrusion VCP Pipe Joint Failure
Broken Vitrified Clay Pipe (VCP) Structural Failure
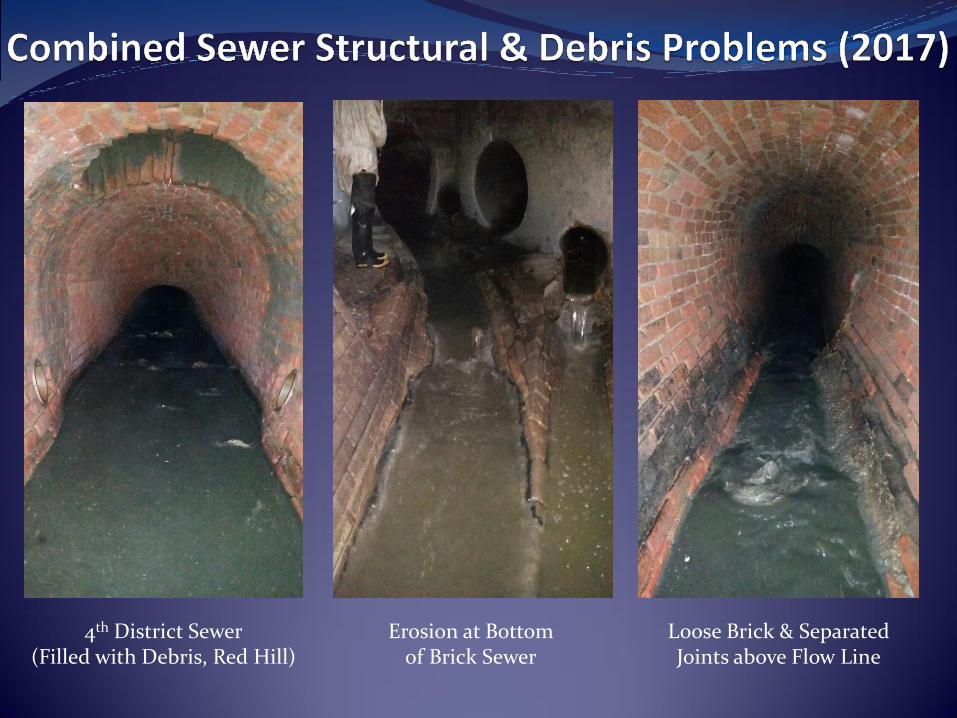
Loose Brick & Separated Joints above Flow Line
4th District Sewer (Filled with Debris, Red Hill)
Erosion at Bottom of Brick Sewer
Broken Vitrified Clay Pipe (VCP) Structural Failure
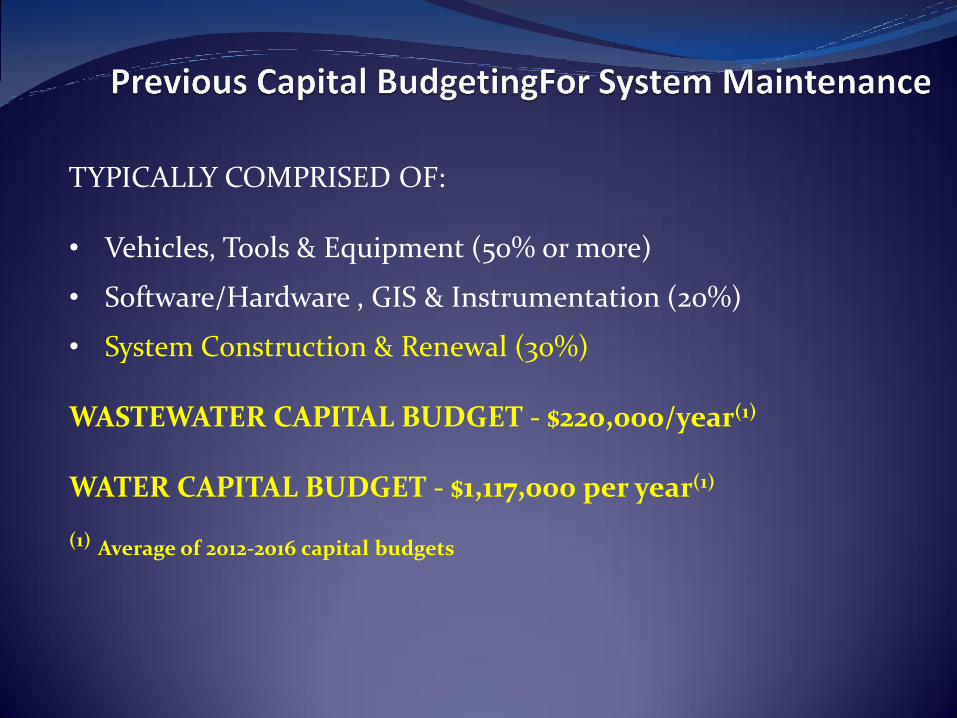
TYPICALLY COMPRISED OF: • Vehicles, Tools & Equipment (50% or more)
• Software/Hardware , GIS & Instrumentation (20%)
• System Construction & Renewal (30%)
WASTEWATER CAPITAL BUDGET - $220,000/year(1)
WATER CAPITAL BUDGET - $1,117,000 per year(1)
(1) Average of 2012-2016 capital budgets
• 2012 AWWA Water and Wastewater Rate Survey • Class C Systems (less than 20 MGD meter consumption) –
110 Systems Surveyed
• AWA meets Criteria as an “Average” Class C System
Average (c)
Balance Sheet (d)
Annual
Capital Total Total Total
Needs Assets Debt Equity
($000) ($000) ($000) ($000)
$ 1,117 $ 111,908 $ 41,188 $ 64,585
$ 6,401 $ 103,125 $ 32,355 $ 65,726
$ 3,501 $ 83,846 $ 19,439 $ 52,196
Service Daily
Area (b)
Total Gallons Daily Max-Day
Population Number of Sold Capacity Production
Utility ($000) Accounts (MGD) (MGD) (MGD)
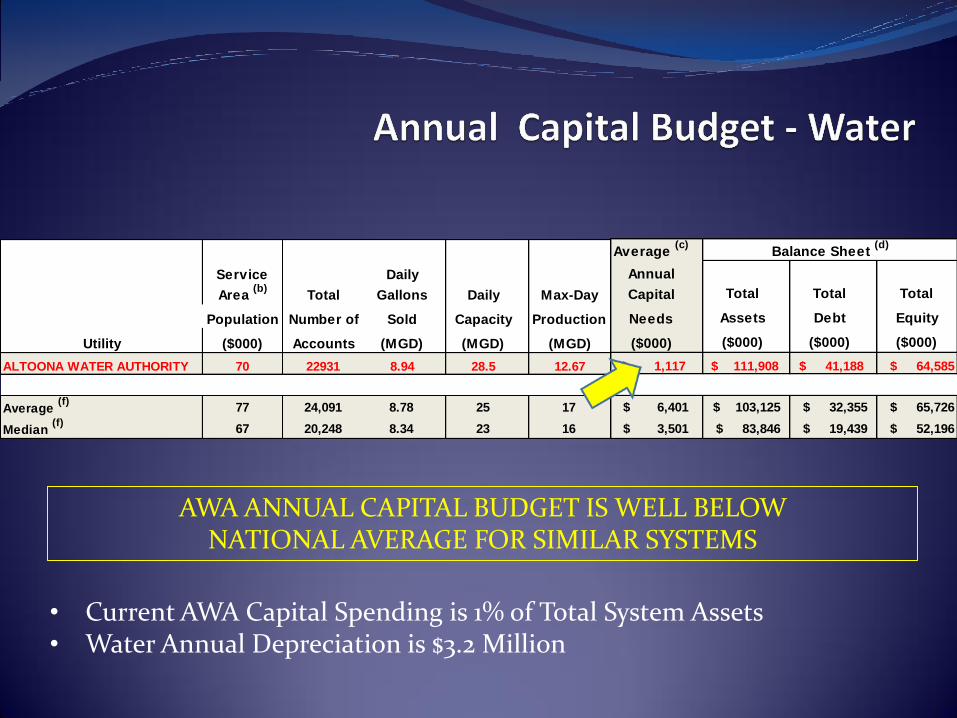
ALTOONA WATER AUTHORITY 70 22931 8.94 28.5 12.67
Average (f)
77 24,091 8.78 25 17
Median (f)
67 20,248 8.34 23 16
AWA ANNUAL CAPITAL BUDGET IS WELL BELOW NATIONAL AVERAGE FOR SIMILAR SYSTEMS
• Current AWA Capital Spending is 1% of Total System Assets • Water Annual Depreciation is $3.2 Million
Capital Budget Income Statement (d)
Balance Sheet (d)
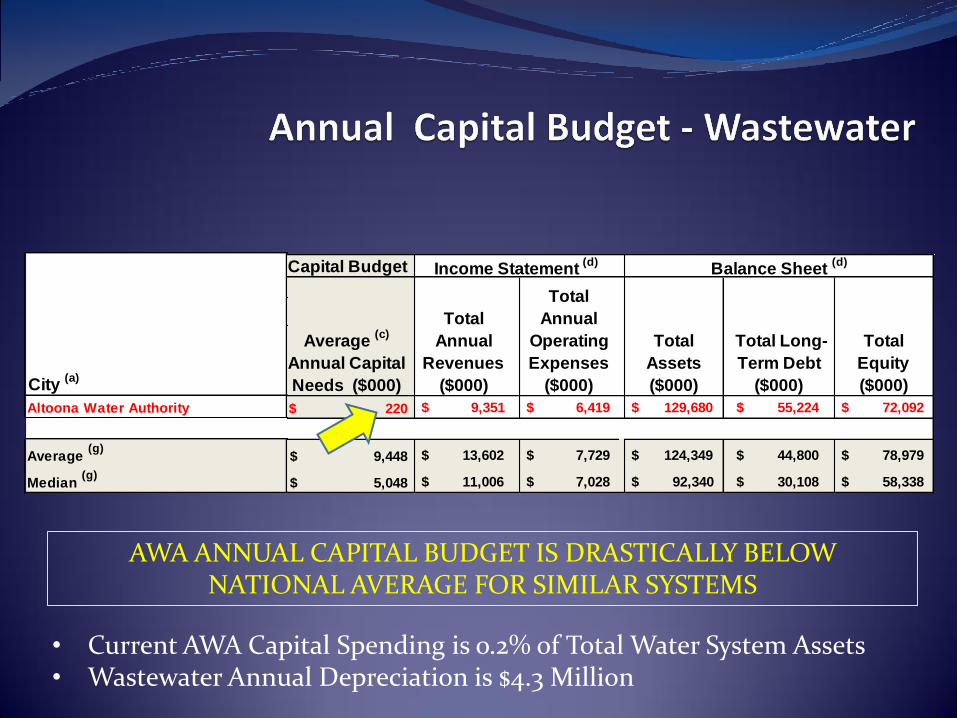
220$ $ 9,351 $ 6,419 $ 129,680 $ 55,224 $ 72,092
9,448$ $ 13,602 $ 7,729 $ 124,349 $ 44,800 $ 78,979
5,048$ $ 11,006 $ 7,028 $ 92,340 $ 30,108 $ 58,338
Total
Equity
($000)
Average (c)
Annual Capital
Needs ($000)
Total
Annual
Revenues
($000)
Total
Annual
Operating
Expenses
($000)
Total
Assets
($000)
Total Long-
Term Debt
($000)
Monthly Service/Minimum Charge
5/8-inch (Residential)
City (a)
Altoona Water Authority
Average (g)
Median (g)
AWA ANNUAL CAPITAL BUDGET IS DRASTICALLY BELOW NATIONAL AVERAGE FOR SIMILAR SYSTEMS
• Current AWA Capital Spending is o.2% of Total Water System Assets • Wastewater Annual Depreciation is $4.3 Million

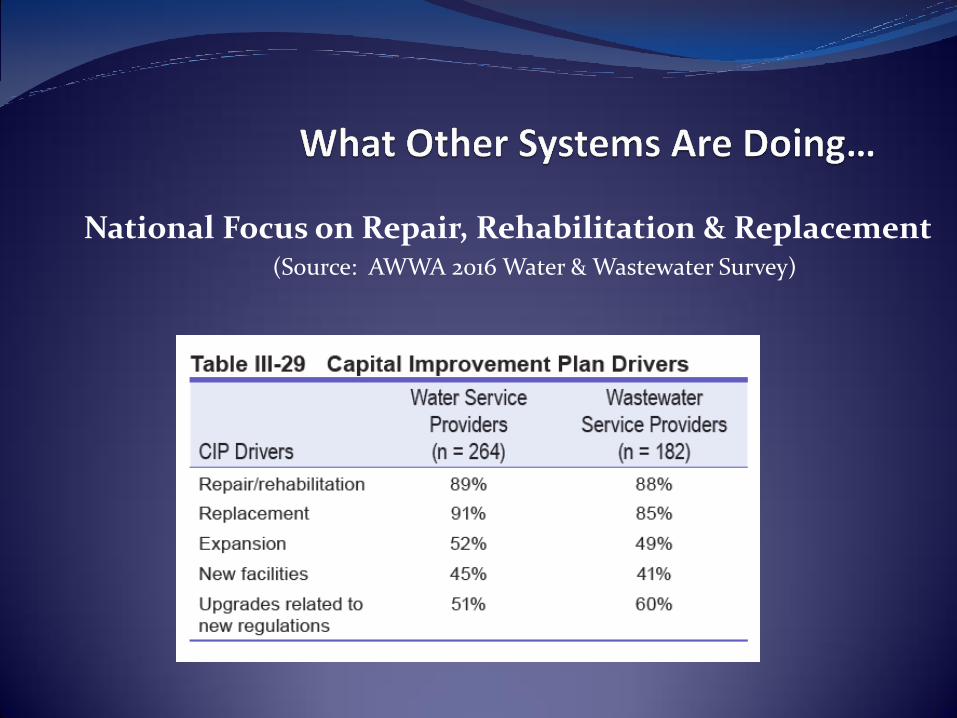
National Focus on Repair, Rehabilitation & Replacement (Source: AWWA 2016 Water & Wastewater Survey)
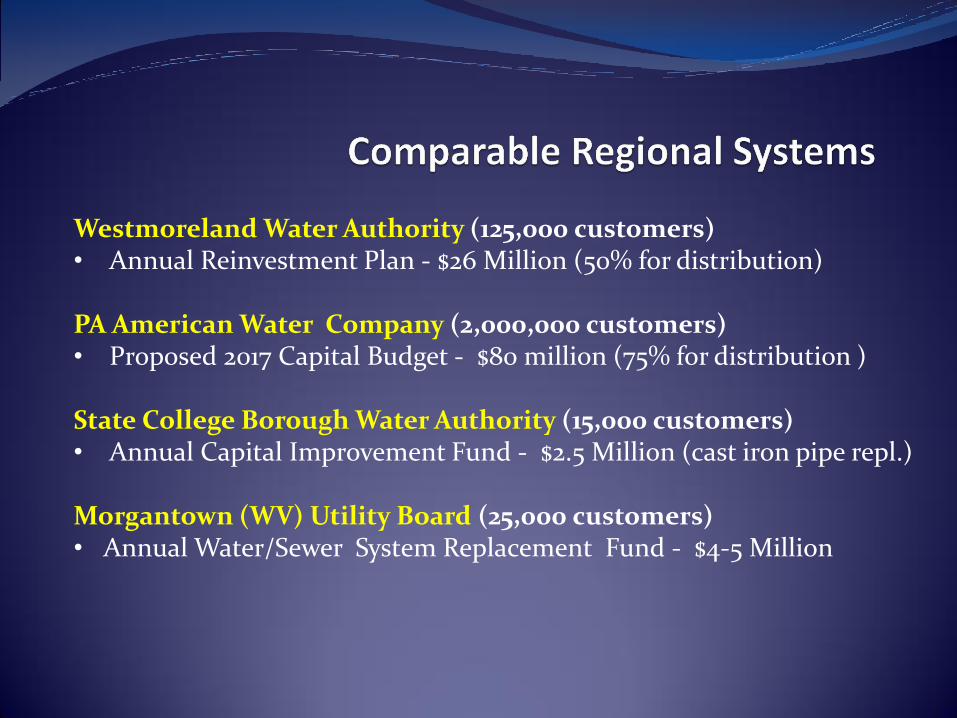
Westmoreland Water Authority (125,000 customers) • Annual Reinvestment Plan - $26 Million (50% for distribution) PA American Water Company (2,000,000 customers) • Proposed 2017 Capital Budget - $80 million (75% for distribution ) State College Borough Water Authority (15,000 customers) • Annual Capital Improvement Fund - $2.5 Million (cast iron pipe repl.) Morgantown (WV) Utility Board (25,000 customers) • Annual Water/Sewer System Replacement Fund - $4-5 Million
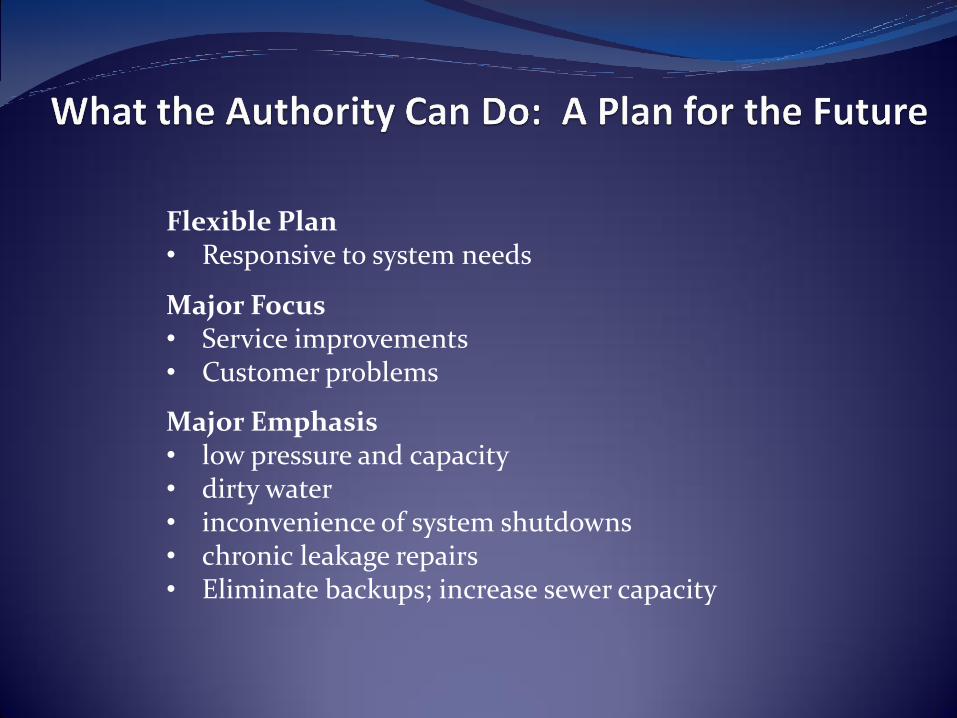
Flexible Plan • Responsive to system needs
Major Focus • Service improvements • Customer problems
Major Emphasis • low pressure and capacity • dirty water • inconvenience of system shutdowns • chronic leakage repairs • Eliminate backups; increase sewer capacity
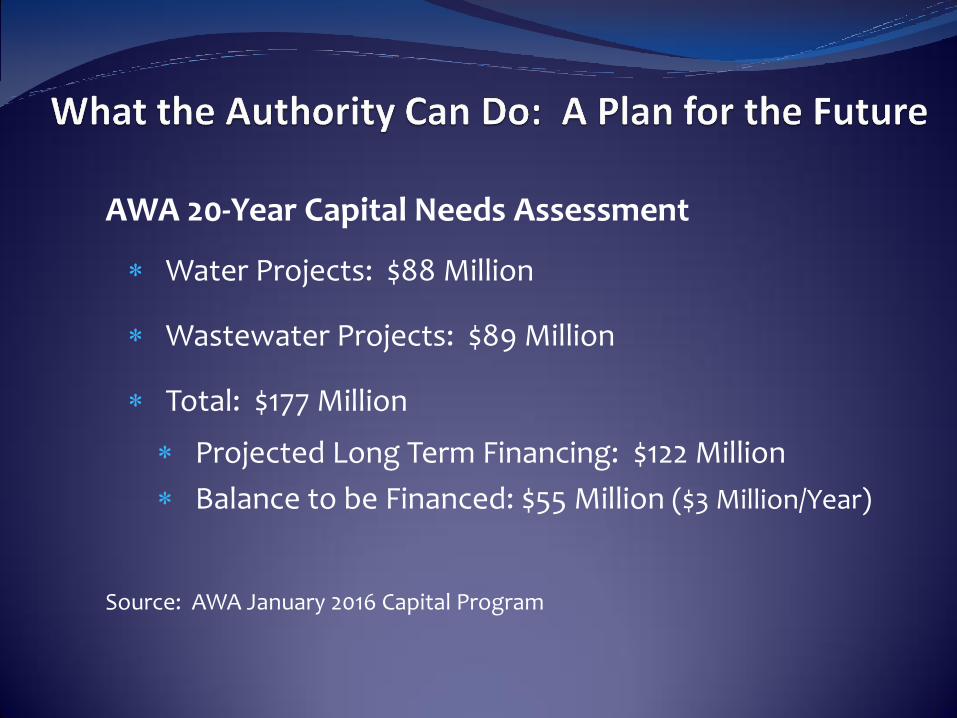
AWA 20-Year Capital Needs Assessment
Water Projects: $88 Million
Wastewater Projects: $89 Million
Total: $177 Million
Projected Long Term Financing: $122 Million
Balance to be Financed: $55 Million ($3 Million/Year)
Source: AWA January 2016 Capital Program


