18
Water Supply and Drought Management Update Water Planning Committee November 20, 2014 Presentation by: Alexi Schnell Water Resources Specialist Lake Oroville, September 5, 2014 Photo:
| Date post: | 16-Jul-2015 |
| Category: |
Education |
| Upload: | san-diego-county-water-authority |
| View: | 132 times |
| Download: | 1 times |

Water Supply and Drought Management Update
Water Planning Committee November 20, 2014
Presentation by: Alexi Schnell Water Resources Specialist
Lake Oroville, September 5, 2014
Photo:
2
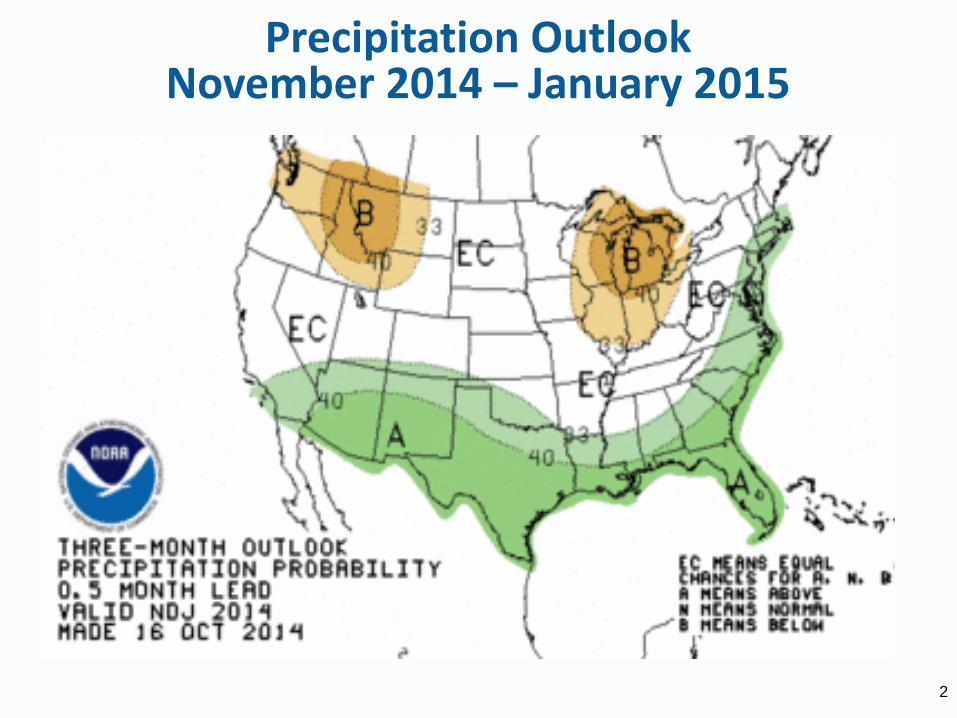
Precipitation Outlook November 2014 – January 2015

3
Precipitation Outlook December 2014 – February 2015

4
El Niño Watch
El Niño still predicted to develop by December 58% Probability Consensus forecast favors a weak event
5
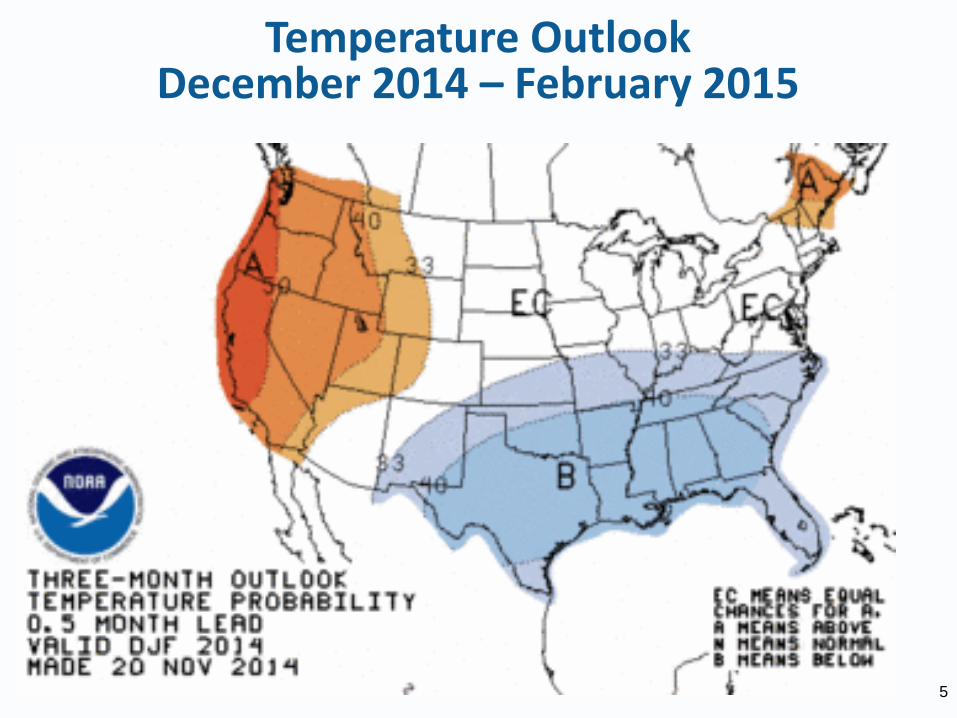
Temperature Outlook December 2014 – February 2015

California Drought Intensifies in 2014
November January Governor declares
“Drought Emergency”
February Water Authority notification of
“Drought Watch”
July Water Authority notification of
“Drought Alert”
6
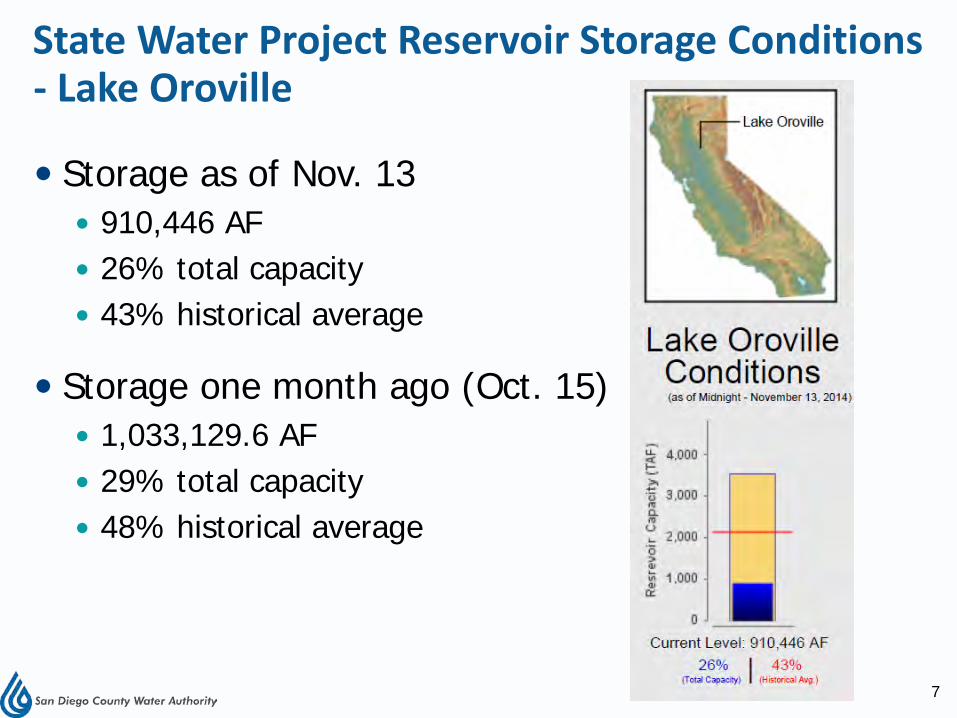
State Water Project Reservoir Storage Conditions
7
Storage as of Nov. 13 910,446 AF 26% total capacity 43% historical average
Storage one month ago (Oct. 15) 1,033,129.6 AF 29% total capacity 48% historical average
- Lake Oroville

Lake Oroville Near Record Low Levels
0
1000
2000
3000
4000
Current Level 910,446 AF 26% capacity (Nov. 13, 2014)
Total Reservoir Capacity: 3.5 MAF
Record Low Level
882,000 AF 25% capacity (Sep. 7, 1977)
Rese
rvoi
r Lev
el (T
AF)
8
Lake Oroville
100% capacity – July 2011
36% capacity – Jan. 2014

State Water Project Reservoir Storage Conditions
9
Storage as of Nov. 13 409,230 AF 20% total capacity 36% historical average
Storage one month ago (Oct. 15) 427,089 AF 21% total capacity 42% historical average
- San Luis Reservoir
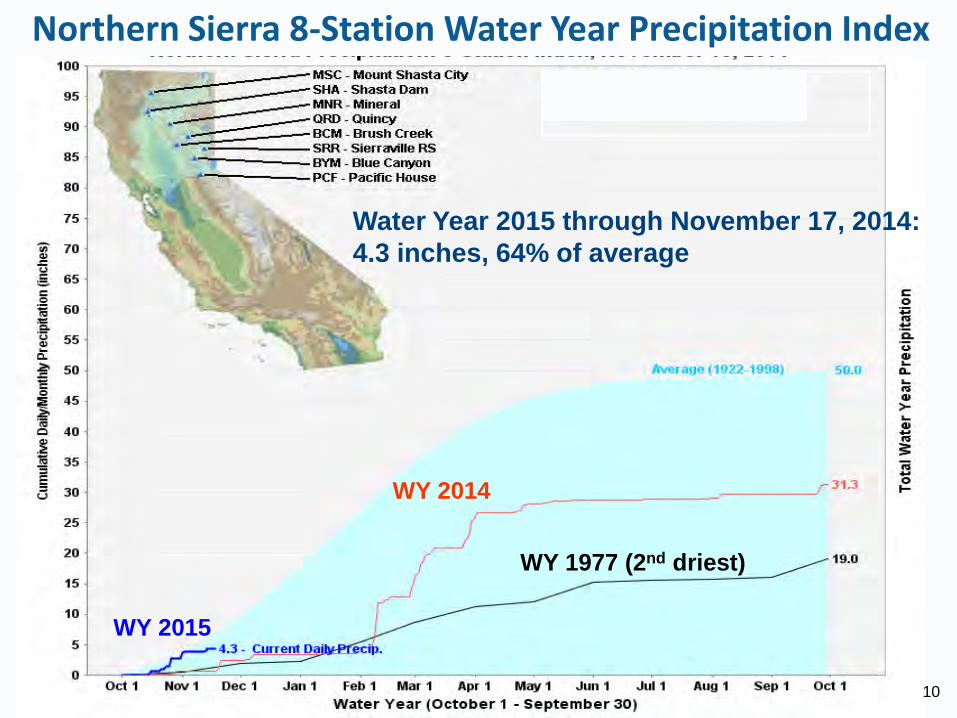
Northern Sierra 8-Station Water Year Precipitation Index
Water Year 2015 through November 17, 2014: 4.3 inches, 64% of average
WY 2014
WY 1977 (2nd driest)
10
WY 2015
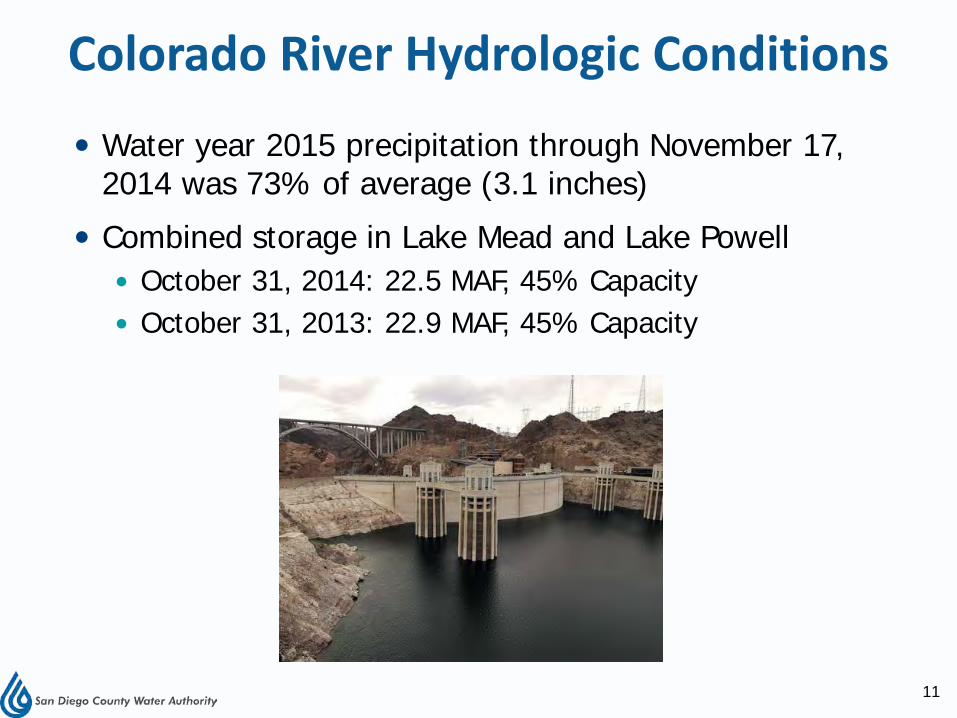
Colorado River Hydrologic Conditions
Water year 2015 precipitation through November 17, 2014 was 73% of average (3.1 inches)
Combined storage in Lake Mead and Lake Powell October 31, 2014: 22.5 MAF, 45% Capacity October 31, 2013: 22.9 MAF, 45% Capacity
11
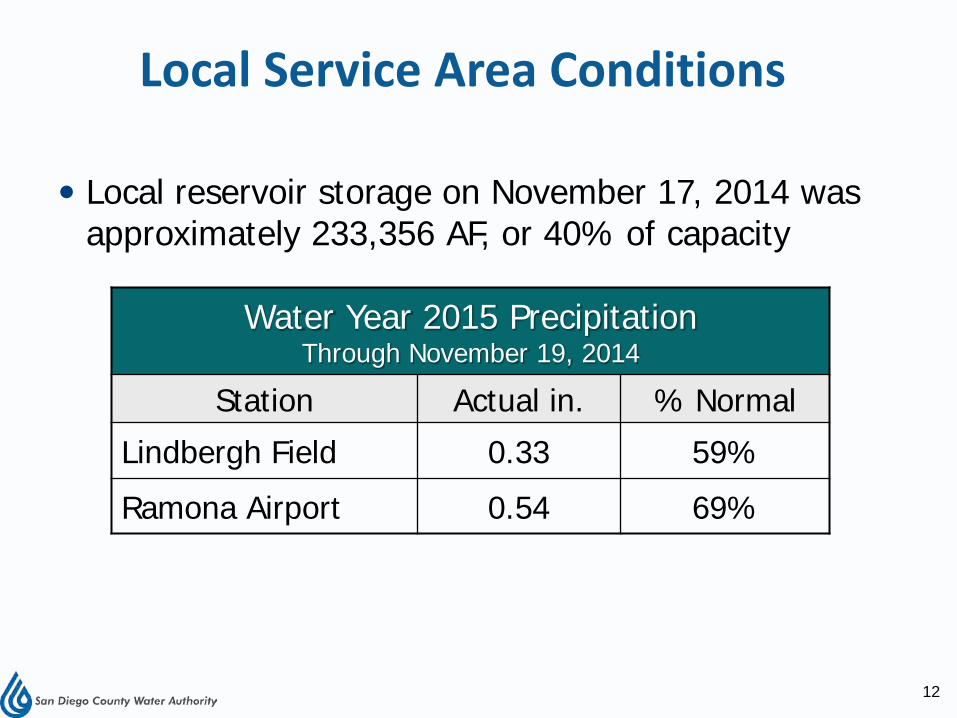
Local Service Area Conditions
Local reservoir storage on November 17, 2014 was approximately 233,356 AF, or 40% of capacity
Water Year 2015 Precipitation
Through November 19, 2014
Station Actual in. % Normal
Lindbergh Field 0.33 59%
Ramona Airport 0.54 69%
12

SWRCB Emergency Regulations Monthly Reporting
Water Production by Urban Water Suppliers
SWRCB staff reported statewide production down 10.3% in September
South Coast region down 7.5% in September Approximately 8.5 billion gallons saved
New reporting requirement Residential gallons per-capita per day (R-GPCD) South Coast region reported 119 R-GPCD
Anticipate October statewide production numbers and R-GPCD data released at Dec. 2nd SWRCB meeting
13
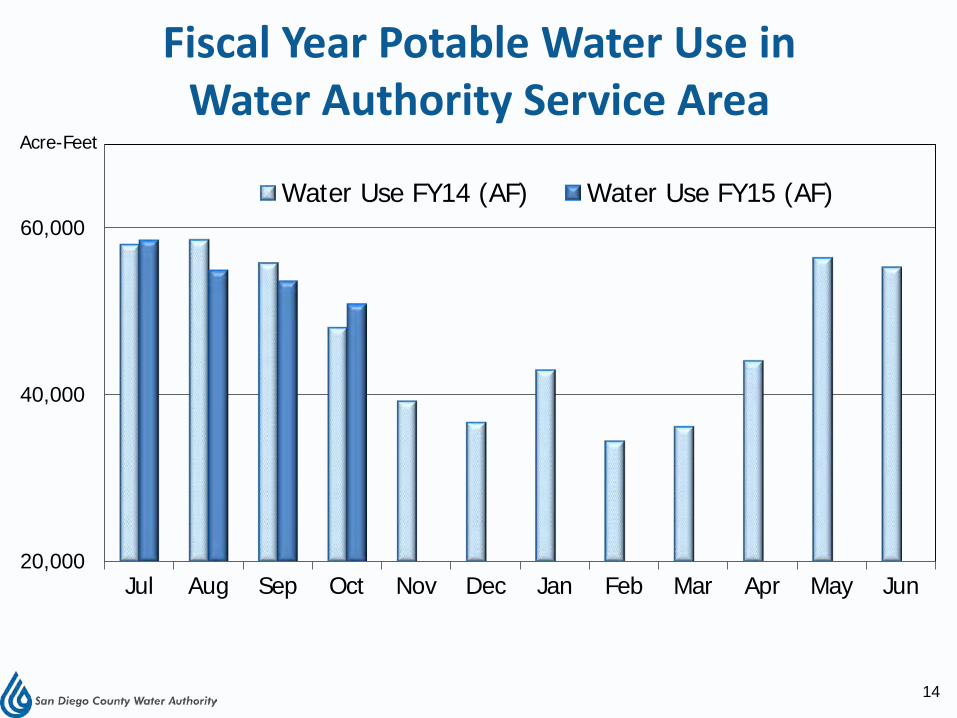
Fiscal Year Potable Water Use in Water Authority Service Area
20,000
40,000
60,000
Jul Aug Sep Oct Nov Dec Jan Feb Mar Apr May Jun
Acre-Feet
Water Use FY14 (AF) Water Use FY15 (AF)
14

Average Daily Maximum Temperature at Lindbergh Field – Departure from Normal (oF)
-2.0
0.0
2.0
4.0
6.0
8.0Fiscal Year 2014 Fiscal Year 2015
Jul Aug Sep Oct Nov Dec Jan Feb Mar Apr May Jun
Hotter
Cooler
15
• October 2014 was 5.8o F warmer than normal • Temperatures were 14o F above average the first week of October

Potable Water Use in Water Authority Service Area
% Increase Oct. 2013 to Oct. 2014
Potable Water Use
5.9%
M&I Potable Use (excluding TSAWR)
3.8%
Urban Water Use Reporting
Water Authority agricultural water use (TSAWR) is classified under urban water supplies
Water Authority has largest agricultural component in MWD service area
Intent of SWRCB emergency regulations to reduce outdoor irrigation and other wasteful water practices effort not directed at agricultural irrigation
16

Other Factors Affecting October Water Use
17
Agricultural
Untreated/Treated Water Shutdown Agriculture customers irrigated in advance
Excessive heat required additional irrigation to protect agricultural investments
M&I
Excessive heat increased water use
Current Drought Activities
Monitor water use and drought conditions
Assist member agencies in compliance with SWRCB Emergency Regulations
Participate in MWD member agency review of Water Supply Allocation Plan
18
Initiate review of Water Authority’s Supply Allocation Methodology in early December 2014


