40
An AMCOW Country Status Overview Water Supply and Sanitation in Mali Turning Finance into Services for 2015 and Beyond

For enquiries, contact:Water and Sanitation Program–Africa RegionThe World Bank, Upper Hill RoadP.O. Box 30577, 00100, Nairobi, KenyaTel: +(254) 20 322 6300 E-mail: [email protected] site: www.wsp.org
An AMCOW Country Status Overview
Water Supply and Sanitation in MaliTurning Finance into Services for 2015 and Beyond

The first round of Country Status Overviews (CSO1) published in 2006 benchmarked the preparedness of sectors of 16 countries in Africa to meet the WSS MDGs based on their medium-term spending plans and a set of ‘success factors’ selected from regional experience. Combined with a process of national stakeholder consultation, this prompted countries to ask whether they had those ‘success factors’ in place and, if not, whether they should put them in place.
The second round of Country Status Overviews (CSO2) has built on both the method and the process developed in CSO1. The ‘success factors’ have been supplemented with additional factors drawn from country and regional analysis to develop the CSO2 scorecard. Together these reflect the essential steps, functions and results in translating finance into services through government systems—in line with Paris Principles for aid effectiveness. The data and summary assessments have been drawn from local data sources and compared with internationally reported data, and, wherever possible, the assessments have been subject to broad-based consultations with lead government agencies and country sector stakeholders, including donor institutions.
This second set of 32 Country Status Overviews (CSO2) on water supply and sanitation was commissioned by the African Ministers’ Council on Water (AMCOW). Development of the CSO2 was led by the World Bank administered Water and Sanitation Program (WSP) in collaboration with the African Development Bank (AfDB), the United Nations Children’s Fund (UNICEF), the World Bank and the World Health Organization (WHO).
This report was produced in collaboration with the Government of Mali and other stakeholders during 2009/10. Some sources cited may be informal documents that are not readily available.
The findings, interpretations, and conclusions expressed in this volume do not necessarily reflect the views of the collaborating institutions, their Executive Directors, or the governments they represent. The collaborating institutions do not guarantee the accuracy of the data included in this work. The boundaries, colors, denominations, and other information shown on any map in this work do not imply any judgment on the part of the collaborating institutions concerning the legal status of any territory or the endorsement or acceptance of such boundaries.
The material in this publication is copyrighted. Requests for permission to reproduce portions of it should be sent to [email protected]. The collaborating institutions encourage the dissemination of this work and will normally grant permission promptly. For more information, please visit www.amcow.net or www.wsp.org.
Photograph credits: Published with permission from Gallo Images/Getty Images/AFP and The Bigger Picture/Reuters
© 2011 Water and Sanitation Program

1
Water Supply and Sanitation in MaliTurning Finance into Services for 2015 and Beyond
An AMCOW Country Status Overview

2
Strategic Overview
The water supply and sanitation sector in Mali has a number of strengths, chief among these being the political stability that has reigned in the country for the last 20 years, loyal partners, and public policies that are both clear and implemented in partnership. For several years now, the state and its partners have been committed to implementing a sectorwide approach; this is due to reach an important milestone in 2012 with the introduction of sector budget support, the principles of which have been in place since 2008. As in many countries in the subregion, Mali has undertaken a series of reforms since the end of the 1990s that have profoundly altered both the institutional landscape and stakeholder relationships. The Water and Sanitation Sector Program (PROSEA: Programme Sectoriel Eau Potable et Assainissement) now acts as the frame of reference for the sector.
When current access rates are compared to the 2015 targets, it becomes clear that the pace of infrastructure construction is still too low despite considerable efforts having been made, particularly in the rural water supply subsector. The situation in the sanitation and hygiene subsector is of particular concern as access rates are still exceedingly low, especially in rural areas. According to the figures provided by the government, for the Millennium Development Goal targets to be achieved it will be
necessary to provide services to an additional 460,000 people per year for drinking water and an additional 720,000 people per year for sanitation.
The target for drinking water remains achievable, but only if the government makes this a real national priority and provided that this priority is supported by implementation of the domestic and donor financing included in PROSEA. It would appear that the target for sanitation will be far more difficult to achieve by 2015, even if considerably greater efforts are made. The main bottlenecks hindering the development of the sanitation subsectors are not caused by the level of financing available, but rather by a lack of capacity within the sector.
Analysis of the financing committed to the sector over the next few years shows that all subsectors are currently underfinanced, with the whole (urban and rural) sanitation and hygiene sector being the most severely underfunded. Nevertheless, the majority of the financial partners are confident that PROSEA will be able to improve the levels of financing available and streamline the utilization of funds.
This second AMCOW Country Status Overview (CSO2) has been produced in collaboration with the Government of Mali and other stakeholders.
An AMCOW Country Status Overview
2

3
Rural water supply• Assisttheruralwatersupplysubsectortomakethetransitiontowardssectorbudgetsupport.• Improvetheabsorptioncapacity: reinforcethe implementationcapacityof theprivatesectorand improvepublic
procurement procedures.• Improvemonitoringandevaluationofthesubsectorandincreasethecommunes’involvement.• Improvethesustainabilityofthewatersupplyservicesinruralareas,asthisiscurrentlyweak.Expandtheuseofthe
operator back-up support and Technical and Financial Monitoring (STEFI: Suivi Technique et Financier) mechanism.• Continuethepolicyofpromotingpublic-privatepartnerships(PPP)inruralareas.• Accordprioritytovillagesthatcurrentlyhavenomodernwaterpointinplace.
Urban water supply• Implementtheinstitutionalreformagreedin2009.• Implementthe‘Kabala’projecttosecureBamako’sfuturewatersupply.• Completethereformoftheurbanwatersupplysubsectorbyensuringthatthisrespectstheprinciplesofequityand
universalaccesstothepublicwaterserviceacrossEDM’s(Energie du Mali) territory.• Ensureserviceimprovementsaresupportedbyanadjustmenttothetarifftoguaranteethefinancialstabilityofthe
urban water supply subsector.• Focusonperi-urbanareasasthesecurrentlycomeundertheresponsibilityofbothDNH(NationalDirectorateof
Water Resources: Direction Nationale de l’Hydraulique) and EDM and thus have poor coverage.
WaterSupplyandSanitationinMali:TurningFinanceintoServicesfor2015andBeyond
3
Sectorwide• Continuethetransferofcompetenciestocommuneswithinthewatersupplyandsanitationsector,combinedwith
back-up support from deconcentrated technical departments at the region and district level.• Implementinstitutionalreformoftheurbanwatersupplysubsector(separatewaterandenergy,createanasset-
holding company and an operator).• ImplementPROSEAastheplanningandcoordinationframeworkfortheentirewatersupplyandsanitationsector.• Continue to use the Objective-based program budget/Medium-Term Expenditure Framework (BPO/MTEF) tool,
particularly for sanitation and hygiene, by improving the way in which this is linked to the financial planning carried out at the commune level.
• Improvetheabsorptionandimplementationrateofdonorfinancing.• Increasethefundingallocatedtosanitationandhygiene.• Laythegroundworkforthewatersupplysector’stransitiontoSBS(SectorBudgetSupport)(ABS:Appui Budgétaire
Sectoriel).• Establishindicatorsfortheruralandsemi-urbanwatersupplysubsector.• Ensurethedefinitionsof‘urban’usedbyINSTAT(Institut National de la Statistique) and the urban operator (Energie
du Mali) are consistent.• Developmonitoringandevaluationforthesanitationandhygienesubsectors.• HarmonizethestandardsandmethodologiesusedbytheJointMonitoringProgrammeandthegovernment.
Agreed priority actions to tackle these challenges, and ensure finance is effectively turned into services, are:

4
Urban sanitation and hygiene• Securefinancingforthesubsector,notablyintheformofaseweragesurchargeaddedtothewaterbill.• Providecapacity-buildingtothecommunestoensuretheyareabletotakeonallorpartofthesanitationinfrastructure
contracting authority role.• FinalizeandimplementthesanitationmasterplanforBamako,clarifyingtheconditionsnecessaryforitsinstitutional
customization.• ApplytheprovisionsincludedintheNationalSanitationPolicy(PNA:Politique Nationale d’Assainissement), notably
with regard to Strategic Sanitation Plans and the development of disposal sites.
Rural sanitation and hygiene• Setupamonitoringandevaluationmechanismwithmonitoringindicatorsthatarespeciallyadaptedtotherural
sanitation subsector in Mali.• Improvethesubsector’scapacitytousetheBPO/MTEFtooltoincreasethefinancingavailabletotheruralsanitation
subsector.• Develop strategies for implementing the National Policy and complete the regulatory texts required for its
operationalization.• Ensuregreaterconsiderationisgiventohygieneandsanitationincommuneplanning(CommuneSocialDevelopment,
Economic, and Cultural Plans – PDSEC: Plans Communaux de Développement Social, Economique, et Culturel; Strategic Sanitation Plan – PSA: Plan Stratégique d’Assainissement andthecommunes’budgets).
• Promoteawareness-raisingandhygieneeducationcampaignsandreduceopendefecationthroughthedevelopmentoftheCommunity-LedTotalSanitationapproach.
• Improvethecapacityofthedeconcentratedstatedepartmentstorespondtothecommunes’demandforback-upsupport.
4
An AMCOW Country Status Overview

5
Acronyms and Abbreviations ........................................................................................................................... 6
1. Introduction .................................................................................................................................................... 7
2. Sector Overview: Coverage and Finance Trends ............................................................................................... 8
3. Reform Context: Introducing the CSO2 Scorecard ......................................................................................... 11
4. Institutional Framework ................................................................................................................................ 14
5. Financing and its Implementation .................................................................................................................. 16
6. Sector Monitoring and Evaluation ................................................................................................................. 19
7. Subsector: Rural Water Supply ...................................................................................................................... 21
8. Subsector: Urban Water Supply ..................................................................................................................... 24
9. Subsector:RuralSanitationandHygiene ....................................................................................................... 27
10. Subsector:UrbanSanitationandHygiene ...................................................................................................... 30
Notes and References
Contents

6
Acronyms and Abbreviations
ABS SectorBudgetSupport (Appui Budgétaire Sectoriel)
AEPA Water Supply and Sanitation (Approvisionnement en Eau Potable et Assainissement)
AFD French Development Agency (Agence Française de Développement)
AfDB AfricanDevelopmentBankAMCOW AfricanMinisters’CouncilonWaterANGESEM National Agency for the Management of
Wastewater Treatment Plants in Mali (Agence Nationale de Gestion des Stations d’Epuration au Mali)
AUE Associationd’Usagersd’EauBPO Objective-basedprogrambudget
(Budget Programme par Objectif)BSI SpecialInvestmentBudget
(Budget Spécial d’Investissement)CAPEX Capital expenditureCLTS Community-LedTotalSanitationCPS Statistics and Planning Unit
(Cellule de Planification et de Statistique)CREE Water and Electricity Regulatory
Commission (Commission de Régulation Eau et Electricité)
CSO2 Country Status Overview (second round)DHSP HygieneandPublicHealthDivision
(Division Hygiène et Salubrité Publique)DNACPN National Directorate of Sanitation and
Pollution and Nuisance Control (Direction Nationale de l’Assainissement et du Contrôle des Pollutions et Nuisances)
DNH NationalDirectorateofWaterResources(Direction Nationale de l’Hydraulique)
DNS NationalDirectorateofHealth (Direction Nationale de la Santé)
DP Development partnerDRH RegionalDirectorateofWaterResources
(Direction Régionale de l’Hydraulique)EDM Energie du MaliEU European UnionFéDAL Certificationof‘opendefecationfree’statusGDP Gross domestic productGNI Gross national incomeINSTAT InstitutNationaldelaStatistiqueIWRM Integrated Water Resources Management
JMP JointMonitoringProgramme (UNICEF/WHO)
KfW GermanBankforReconstructionandDevelopment (Kreditanstalt für Wiederaufbau)
MDG Millennium Development GoalM&E Monitoring and evaluationMEA Ministry of the Environment and Sanitation
(Ministère de l’Environnement et de l’Assainissement)
MEE Ministry of Energy and Water (Ministère de l’Energie et de l’Eau)
MTEF Medium-Term Expenditure FrameworkNGO Nongovernmental organizationO&M Operation and maintenanceOPEX Operations expenditurePASEPARE Drinking Water, Sanitation and Water
Resources Sector Support Program (Programme d’Appui au Secteur de l’Eau Potable, de l’Assainissement et des Ressources en Eau)
PDSEC Commune Social Development, Economic and Cultural Plan (Plans Communaux de Développement Social, Economique, et Culturel)
PNA National Sanitation Policy (Politique Nationale d’Assainissement)
PPP Public-private partnershipPROSEA Water and Sanitation Sector Program
(Programme Sectoriel Eau et Assainissement)
PRSP Poverty Reduction Strategy PaperPSA Strategic Sanitation Plan
(Plan Stratégique d’Assainissement)RSH RuralsanitationandhygieneRWS Rural water supplySIGMA Geographical Information System of Mali
(Système d’Information Géographique du Mali)
STEFI Technical and Financial Monitoring (Suivi Technique et Financier)
UNICEF UnitedNationsChildren’sFundUSH UrbansanitationandhygieneUWS Urban water supplyWHO WorldHealthOrganizationWSP Water and Sanitation ProgramWSS Water supply and sanitation
Exchange rate: US$1 = 496 CFA Francs.1
An AMCOW Country Status Overview
7
1. Introduction
TheAfricanMinisters’CouncilonWater(AMCOW)commissionedtheproductionofasecondroundofCountryStatusOverviews (CSOs) to better understand what underpins progress in water supply and sanitation and what its member governments can do to accelerate that progress across countries in Sub-Saharan Africa (SSA).2 AMCOW delegated this tasktotheWorldBank’sWaterandSanitationProgramandtheAfricanDevelopmentBankwhoareimplementingitinclosepartnershipwithUNICEFandWHOinover30countriesacrossSSA.ThisCSO2reporthasbeenproducedincollaborationwiththeGovernmentofMaliandotherstakeholdersduring2009/10. The analysis aims to help countries assess their own service delivery pathways for turning finance into water supply and sanitation services in each of four subsectors: rural and urban water supply, and rural and urban sanitation and hygiene. TheCSO2analysishasthreemaincomponents:areviewofpastcoverage;acostingmodeltoassesstheadequacyoffuture investments; and a scorecard which allows diagnosis of particular bottlenecks along the service delivery pathway. TheCSO2’scontribution is toanswernotonlywhetherpast trendsandfuturefinancearesufficient tomeetsectortargets, but what specific issues need to be addressed to ensure finance is effectively turned into accelerated coverage in water supply and sanitation. In this spirit, specific priority actions have been identified through consultation. A synthesis report, available separately, presents best practice and shared learning to help realize these priority actions.
WaterSupplyandSanitationinMali:TurningFinanceintoServicesfor2015andBeyond
8
2. Sector Overview: Coverage and Finance Trends
Coverage: Assessing Past Progress
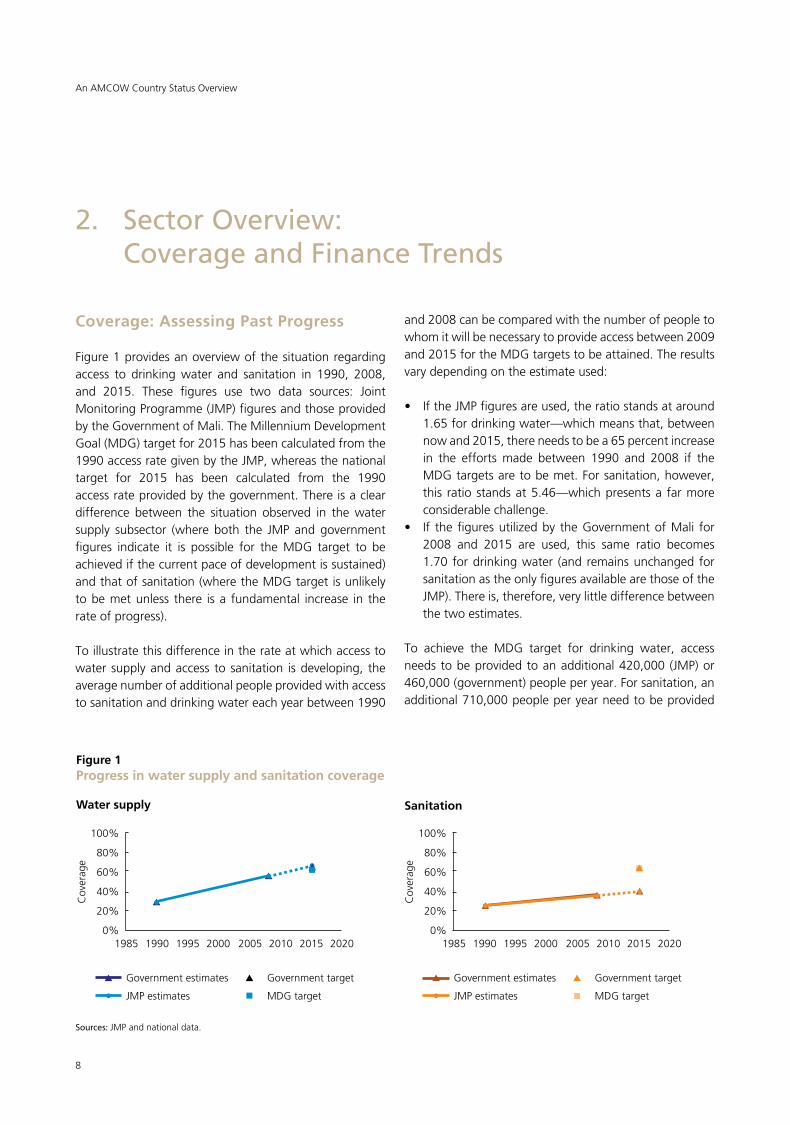
Figure 1 provides an overview of the situation regarding access to drinking water and sanitation in 1990, 2008, and 2015. These figures use two data sources: JointMonitoringProgramme(JMP)figuresandthoseprovidedby the Government of Mali. The Millennium Development Goal (MDG) target for 2015 has been calculated from the 1990accessrategivenbytheJMP,whereasthenationaltarget for 2015 has been calculated from the 1990 access rate provided by the government. There is a clear difference between the situation observed in the water supply subsector (where both the JMP andgovernmentfigures indicate it is possible for the MDG target to be achieved if the current pace of development is sustained) and that of sanitation (where the MDG target is unlikely to be met unless there is a fundamental increase in the rate of progress).
To illustrate this difference in the rate at which access to water supply and access to sanitation is developing, the average number of additional people provided with access to sanitation and drinking water each year between 1990
and 2008 can be compared with the number of people to whom it will be necessary to provide access between 2009 and 2015 for the MDG targets to be attained. The results vary depending on the estimate used:
• IftheJMPfiguresareused,theratiostandsataround1.65 for drinking water—which means that, between now and 2015, there needs to be a 65 percent increase in the efforts made between 1990 and 2008 if the MDG targets are to be met. For sanitation, however, this ratio stands at 5.46—which presents a far more considerable challenge.
• If the figuresutilizedby theGovernmentofMali for2008 and 2015 are used, this same ratio becomes 1.70 for drinking water (and remains unchanged for sanitation as the only figures available are those of the JMP).Thereis,therefore,verylittledifferencebetweenthe two estimates.
To achieve the MDG target for drinking water, access needstobeprovidedtoanadditional420,000 (JMP)or460,000 (government) people per year. For sanitation, an additional 710,000 people per year need to be provided
Sanitation
100%
80%
60%
40%
20%
0%1985 1990 1995 2000 2005 2010 2015 2020
Government estimates
JMPestimates
Government target
MDG target
Cov
erag
e
Water supply
Figure 1Progress in water supply and sanitation coverage
100%
80%
60%
40%
20%
0%1985 1990 1995 2000 2005 2010 2015 2020
Government estimates
JMPestimates
Government target
MDG target
Cov
erag
e
Sources:JMPandnationaldata.
An AMCOW Country Status Overview

9
with access to an acceptable sanitation facility up to 2015—this will be a huge challenge given the current performance.
Even if Mali were to achieve its MDG targets in 2015, 2.6 million inhabitants would still be without access to an improved source of drinking water and 5.4 million would not have access to an acceptable sanitation facility; in both cases, the majority of the population with no access will live in rural areas (2.1 million rural inhabitants will still require access todrinkingwater and3.7millionwill bewithout access to sanitation).
Investment Requirements: Testing the Sufficiency of Finance
The CSO2 methodology provides both an estimate of the amount to be invested in each subsector for the MDG targets to be achieved and the proportion of this amount that corresponds to public investment. It should be noted that the fact that public investment has been committed does not mean that the financing will be made available. For example, in the rural water supply (RWS) subsector, the 2010–12 Medium-Term Expenditure Framework (MTEF) estimates public investment of around US$240 million over the three years; however, only about half of this amount has actually been secured (the sector review stated that US$92 million had been obtained, to which
financing of around US$28 million for the 2010–12 period from the Danish-Swedish assistance program (PADS) needs to be added, giving a total of US$120 million obtained out oftheUS$240millionrequired).
AccordingtotheCSO2estimate,investmentrequirementsstand at US$89 million per year for drinking water and US$29 million per year for sanitation (see Figure 2 and Table 1). Therefore, for the 2009–15 period, a total of US$825millionisrequiredforinvestmentinwatersupplyand sanitation. Nearly 64 percent of this investment needs to be allocated to rural areas.
A large part of the investment necessary for the water supply subsectors has already been committed (US$83 million), whereas for sanitation this financing comes to only around US$17 million. There is, therefore, a considerable funding deficit in the sanitation subsectors, particularly in the rural subsector.
It is important to note that the investment considered in the calculation only relates to drinking water and household sanitation facilities that are to be constructed and rehabilitated to meet the MDG targets. It excludes, forinstance,studiesandupfrontinvestmentrequiredformobilizing water resources, awareness-raising and hygiene education activities, as well as industrial sanitation and wastewater treatment plants.
Sanitation
0 10 20 30 40
RequiredCAPEX
US$million/year
Public CAPEX (anticipated)
HouseholdCAPEX(assumed)
CAPEX deficit
Water supply
Figure 2Required vs. anticipated (public) and assumed (household) expenditure for water
0 50 100 150
RequiredCAPEX
Required OPEX
US$million/year
Public CAPEX (anticipated)
HouseholdCAPEX(assumed)
CAPEX deficit
Sources: CSO2 estimates.
WaterSupplyandSanitationinMali:TurningFinanceintoServicesfor2015andBeyond
Required OPEX

10
Table 2Annual OPEX requirements
Subsector OPEX US$ million/year
Rural water supply 11Urban water supply 18Water supply total 29Rural sanitation 2Urban sanitation 2Sanitation total 4
Source: CSO2 estimates.
HadthetargetssetbytheGovernmentofMaliinthelatestversion of Water and Sanitation Sector Program (PROSEA: Programme Sectoriel Eau Potable et Assainissement) been used instead of the JMP targets, the investmentrequirements would have been even higher with anadditional US$21million per year required for drinkingwater, mainly in the urban water supply subsector where the government target is a lot more ambitious (91 percent) than that of the JMP (77 percent). The estimates forsanitation would have remained unchanged, however, as, duetoalackofreliablenationaldata,theJMPestimateshave been used.
Once the soon-to-be published data from the latest census (2010) is taken into account, the population data could change considerably, with a further 1.3 million inhabitants beingaddedtoMali’stotalpopulationestimate—meaningthe annual population growth rate is far higher than that used in current assumptions. In order for the MDG targets to be achieved, a total of 1.66 million additional inhabitants will need to be taken into account. This updated population data could, therefore, significantly increase the level of investment required and render achievementofthe MDG targets less likely, including those pertaining to the water supply subsectors.
Inadditiontothe investmentrequirementsgivenabove,US$33 million per year will be needed to finance the operation and maintenance (O&M) costs of current and futureinfrastructure,withUS$29millionofthisrequiredfor drinking water and US$4 million for sanitation (CSO2
estimates, see Table 2). A large part of these costs is to be borne by households, either out of their own budget (for household latrines), through the tariff or via a fixed contribution (for water supply infrastructure in both rural and urban areas).
The availability of finance is only part of the picture. Bottlenecks can, in fact, occur throughout the servicedelivery pathway—all the institutions, processes, and actors that translate sector funding into sustainable services. Where the pathway is well developed, sector funding should turn into services at the estimated unit costs. Whereitisnot,theaboveinvestmentrequirementsmaybe gross underestimates. The rest of this report evaluates the service delivery pathway in its entirety, locating the bottlenecks and presenting the agreed priority actions to help address them.
An AMCOW Country Status Overview
Table 1Coverage and investment figures
Source: CSO2 estimates.3
Coverage Target Population CAPEX Anticipated public Assumed Total requiring requirements CAPEX HH deficit access CAPEX
1990 2008 2015 Total Public Domestic External Total
% % % ‘000/year
US$ million/year
Rural water supply 22% 44% 61% 288 57 54 39 5 44 2 10Urban water supply 54% 81% 77% 129 32 32 34 3 37 0 -Water supply total 29% 56% 65% 417 89 86 73 8 81 2 5Rural sanitation 23% 32% 62% 442 19 13 4 2 6 3 10Urban sanitation 36% 45% 68% 269 11 8 4 2 6 3 2Sanitation total 26% 36% 63% 711 29 21 8 4 12 5 12

11
WaterSupplyandSanitationinMali:TurningFinanceintoServicesfor2015andBeyond
3. Reform Context: Introducing the CSO2 Scorecard
The CSO2 scorecard is an assessment tool providing a snapshot of reform progress along the service delivery pathway. This scorecard looks at nine building blocks of the service delivery pathway, which correspond to specific functions classified in three categories: three functions that refer to enabling conditions for putting services in place (policy development, planning new undertakings, budgeting); three actions that relate to developing the service(expenditureoffunds,equity intheuseofthesefunds, service output); and three functions that relate to sustaining these services (facility maintenance, expansion of infrastructure, use of the service). Each building block is assessed against specific indicators and scored from 1 (poor) to 3 (excellent) accordingly.4
Figure 3 shows the overall scorecard results obtained by Mali, which are compared to the average results of its peer-group countries in SSA.5 It can be seen that the scorecard places Mali within the average of other African low-income countries.
As far as sector context is concerned, the water supply and sanitation (WSS) sector in Mali underwent considerable upheaval during the early years of the decade of the 2000s. This period was marked both by the notable advances made (particularly in the rural and semi-urban water supply subsectors) and by the difficulties encountered, for which initial solutions began to be found in 2009–10 (notably in the sanitation and hygiene subsectors).
Mali has made remarkable progress in terms of strategy, policy, and regulatory framework, although there are significant differences from one subsector to another. Numerous reforms have been introduced that have profoundly altered the institutional landscape.
Although the spirit of reform is present in the WSS sector as a whole in Mali, the situation at subsector level is more varied. Although the rural and semi-urban water supply subsector is relatively well organized with a strategy that has recently been substantially improved and updated (in 2007), the organization of the sanitation subsectors is very recent.
From 2005, intense review has led to the foundations of a programmatic approach being put in place. This has been manifested in two ways: (a) through the design of a framework to combine planning and coordination at national level, the PROSEA; and (b) through the implementation of a MTEF for water supply and sanitation, broken down into an Objective-based program budget (BPO:Budget Programme par Objectif) for water supply andaBPOforsanitation.Thetargetnowisforthewatersupply sector to make the transition to Sector BudgetSupport(ABS: Appui Budgétaire Sectoriel) in 2012.
The urban water supply (UWS) subsector underwent considerable upheaval at the initial years of the 2000s with the old public water and electricity company, Energie du Mali (EDM), being placed under concession and with the creation of an independent regulator, the Water and Electricity Regulatory Commission (CREE: Commission de Régulation Eau et Electricité). The public-private partnership gradually disintegrated as a result of two tariff reductions decided
Figure 3Average scorecard results for enabling, developing, and sustaining service delivery, and peer-group comparison
Enabling
Sustaining Developing
Mali average scores
Averages,LICs,GNIp.p.<=US$500
Source: CSO2 scorecard.
12
by the government, coupled with chronic underinvestment linked to the fact that EDM’s ‘strategic partner’, SaurInternational, failed to honor its commitments. The crisis reached its peak in the autumn of 2005 with the departure of Saur International and the de-facto renationalization of EDM. Since then, the financing that the subsector so
An AMCOW Country Status Overview
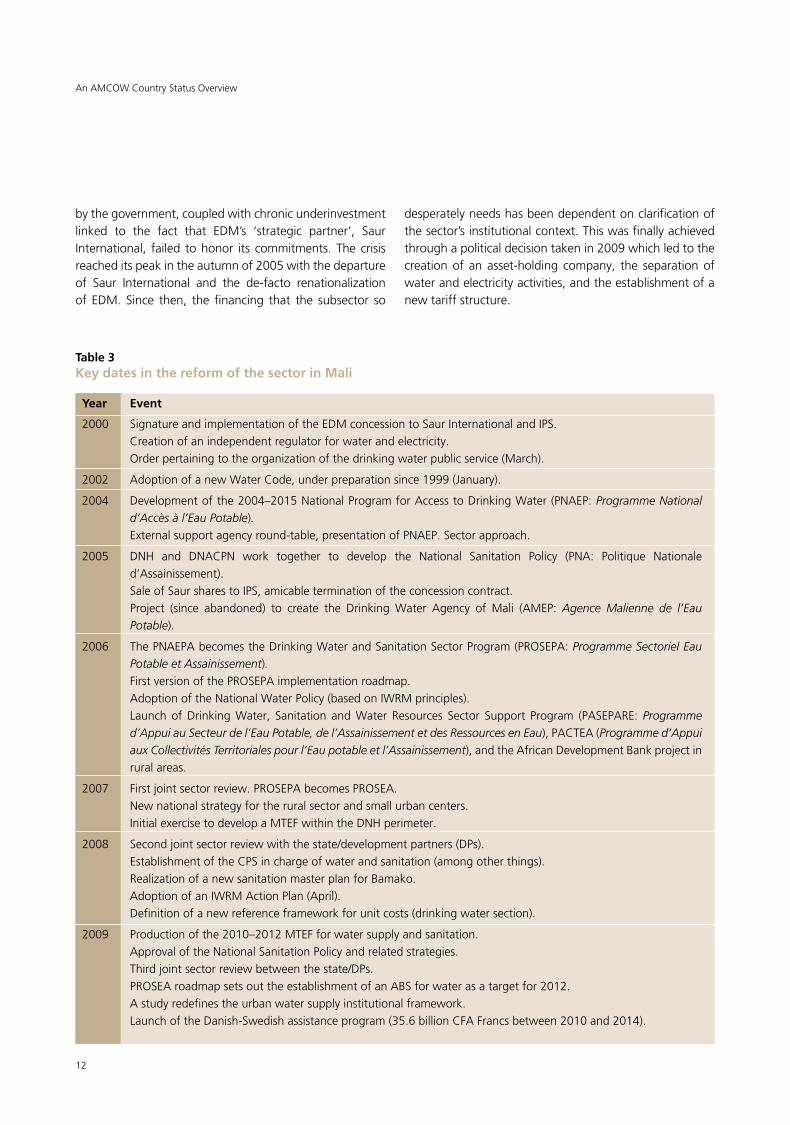
Table 3Key dates in the reform of the sector in Mali
Year Event
2000 Signature and implementation of the EDM concession to Saur International and IPS. Creation of an independent regulator for water and electricity. Order pertaining to the organization of the drinking water public service (March).
2002 AdoptionofanewWaterCode,underpreparationsince1999(January).
2004 Development of the 2004–2015 National Program for Access to Drinking Water (PNAEP: Programme National d’Accès à l’Eau Potable).
External support agency round-table, presentation of PNAEP. Sector approach.
2005 DNH and DNACPN work together to develop the National Sanitation Policy (PNA: Politique Nationaled’Assainissement).
Sale of Saur shares to IPS, amicable termination of the concession contract. Project (since abandoned) to create the Drinking Water Agency of Mali (AMEP: Agence Malienne de l’Eau
Potable).
2006 The PNAEPA becomes the Drinking Water and Sanitation Sector Program (PROSEPA: Programme Sectoriel Eau Potable et Assainissement).
First version of the PROSEPA implementation roadmap. Adoption of the National Water Policy (based on IWRM principles). Launch ofDrinkingWater, Sanitation andWater Resources Sector Support Program (PASEPARE:Programme
d’Appui au Secteur de l’Eau Potable, de l’Assainissement et des Ressources en Eau), PACTEA (Programme d’Appui aux Collectivités Territoriales pour l’Eau potable et l’Assainissement),andtheAfricanDevelopmentBankprojectinrural areas.
2007 First joint sector review. PROSEPA becomes PROSEA. New national strategy for the rural sector and small urban centers. InitialexercisetodevelopaMTEFwithintheDNHperimeter.
2008 Secondjointsectorreviewwiththestate/developmentpartners(DPs). Establishment of the CPS in charge of water and sanitation (among other things). RealizationofanewsanitationmasterplanforBamako. Adoption of an IWRM Action Plan (April). Definition of a new reference framework for unit costs (drinking water section).
2009 Production of the 2010–2012 MTEF for water supply and sanitation. Approval of the National Sanitation Policy and related strategies. Thirdjointsectorreviewbetweenthestate/DPs. PROSEAroadmapsetsouttheestablishmentofanABSforwaterasatargetfor2012. A study redefines the urban water supply institutional framework. LaunchoftheDanish-Swedishassistanceprogram(35.6billionCFAFrancsbetween2010and2014).
desperately needs has been dependent on clarification of thesector’sinstitutionalcontext.Thiswasfinallyachievedthrough a political decision taken in 2009 which led to the creation of an asset-holding company, the separation of water and electricity activities, and the establishment of a new tariff structure.
13
The national water policy, adopted in February 2006, sets out the sector approach based on Integrated Water Resources Management (IWRM) principles, as well as the strategic directions to which particular effort needs to be applied to develop the water supply sector, namely (a) promoting the sustainability of investment; (b) involving the private sector and optimizing investment efficiency; (c) capacity-building to improve the qualitative andquantitativeunderstandingandmonitoringandevaluationof water resources and their users; and, (d) promoting consultation between countries on issues linked to the management of international waters.
For a long time, no real consideration was given to strategy and policy for the sanitation and hygiene subsectors. This situation has, however, been largely rectified over the course of the last few years following the preparation of a National
Sanitation Policy and five subsector policies which were officially adopted at the beginning of 2009. Nevertheless, implementing this national strategy is a huge challenge for the subsector, which remains highly fragmented and is still not yet accorded real political priority.
Table 3 provides a summary of the main steps taken as part of the WSS sector reform process in Mali.
Sections 4 to 6 highlight progress and challenges across three thematic areas—the institutional framework; finance; and monitoring and evaluation (M&E)—benchmarking Mali against its peer countries based on a grouping by gross national income. The related indicators are extracted from the scorecard and presented in charts at the beginning of each section. The scorecards for each subsector are presented in their entirety in Sections 7 to 10.
WaterSupplyandSanitationinMali:TurningFinanceintoServicesfor2015andBeyond

14
4. Institutional Framework
Decentralization plays a highly important role in the WSS sector in Mali as all related competencies are steadily being transferred to the communes. As a result, Mali is one of the West African countries in which the decentralization processismostadvancedandwhere,overall,thesector’sinstitutional framework is relatively sound (see Figure 4). The transfer of competencies is being supported by the distribution of tools adapted to the communes’ needs
andbythecapacity-buildingofthestate’sdeconcentrateddepartments (regional and subregional directorates). The majority of projects respect this orientation. In those towns where EDM is responsible for the water service, the level of commune involvement is, however, extremely limited.
As the EDM perimeter is relatively small, the size of the rural and semi-urban water supply subsector is substantial. The subsector comes under the responsibility of the National DirectorateofWaterSupply(DNH:Direction Nationale de l’Hydraulique), which is part of the Ministry of Energy and Water (MEE: Ministère de l’Energie et de l’Eau).TheDNHhas been widely decentralized into all regions of Mali, with decentralization to subregional levels being more recent (thisiscurrentlyintensifying).TheDNHisalsoresponsiblefor the coordination of the entire water supply sector.
EDM manages the water supply service in 17 urban centers and is responsible for electricity distribution in 36 centers. EDM is a joint stock company whose current majority shareholder is the state. The company has signed a concession contractwith the state and the DNH actsas contracting authority for the urban water supply subsector on the state’s behalf. In accordancewith thepolicy orientations agreed as a result of the institutional study finalized in 2009, water and energy activities are to be separated, with two new bodies being set up to oversee operation of the services; these new companies will also be responsible for asset management. EDM does not currently deal with sanitation issues and it appears
Priority actions for institutional framework
• Continue the transfer of competencies to communes within the water supply and sanitation sector,combinedwithback-up support fromdeconcentrated technicaldepartmentsat the regionanddistrictlevel.
• Implementinstitutionalreformoftheurbanwatersupplysubsector(separatewaterandenergy,createanasset-holdingcompanyandanoperator).
• ImplementPROSEAastheplanningandcoordinationframeworkfortheentirewatersupplyandsanitationsector.
Figure 4Scorecard indicator scores relating to institutional framework compared to peer group6
Mali average scores
Averages,LICs,GNIp.p.<=US$500
Source: CSO2 scorecard.
RWS
RSH
USH UWS
An AMCOW Country Status Overview
15
that this will continue to be the case after the institutional reform has been implemented.
The very recently created National Directorate of Sanitation and Pollution and Nuisance Control (DNACPN: Direction Nationale de l’Assainissement et du Contrôle des Pollutions et Nuisances) comes under the supervision of the Ministry of the Environment and Sanitation (MEA: Ministère de l’Environnement et de l’Assainissement). During development of the new National Sanitation Policy (PNA: Politique Nationale d’Assainissement), which it led, the DNACPN consolidated its leadership role within both the rural and urban sanitation subsectors. The DNACPN is relatively well decentralized with two-thirds of its staff working in the regional and subregional directorates.
TheNationalDirectorate ofHealth’sHygiene and PublicHealthDivision(DHSP:Division Hygiène et Santé Publique) works across the whole national territory to promote public hygiene and health in households, communities, workplaces,andpublicplaces.TheDHSPissupportedin
this by the extensive network of community healthcare centers and their health workers.
The new (2007) National Agency for the Management of Wastewater Treatment Plants in Mali (ANGESEM: Agence Nationale de Gestion des stations d’Epuration du Mali) is astate-ownedcompanycreatedtomanageBamako’sfirstwastewater treatment plant, which was constructed in 2006 with financing from the Netherlands. The ANGESEM is supervised by the MEA.
Sector coordination should be carried out within the PROSEA framework; however, PROSEA does not yet have an operational Steering Committee in place and so most coordination work is conducted during the sector reviews (with the latest of these scheduled for March 2011). The Statistics and Planning Unit (CPS: Cellule de Planification et de Statistique), which is responsible for the WSS sector, was created in 2007 and has been operational since 2008. TheCPShasbeen required toplayan important role incoordinating the sector.
WaterSupplyandSanitationinMali:TurningFinanceintoServicesfor2015andBeyond

16
The WSS sector in Mali is highly dependent on development aid (it is estimated that over 90 percent of funding comes from bilateral or multilateral aid). The main multilateral external support agencies within the sector are the World Bank,theEuropeanUnion,theAfricanDevelopmentBank(AfDB)andtheUnitedNationsChildren’sFund(UNICEF);the main bilateral donors are France, Germany, Sweden, Denmark,BelgiumandLuxembourg.Allofthesedonorsoperate exclusively through projects, albeit with a relatively limited amount of inter-project coordination that is reliant on the goodwill of the actors.
The scorecard results relating to financing of the WSS sectorarebelowtheaverageofMali’speergroupcountries(see Figure 5).
5. FinancinganditsImplementation
Priority actions for financing and its implementation
• ContinuetousetheBPO/MTEFtool,particularlyforsanitationandhygiene,byimprovingthewayinwhichthisislinkedtothefinancialplanningcarriedoutatcommunelevel.
• Improvetheabsorption/implementationrateofdonorfinancing.
• Increasethefundingallocatedtosanitationandhygiene.
• Laythegroundworkforthewatersupplysector’stransitiontoABS.
The new program being co-financed by Denmark and Sweden (2010–14) is the first that truly complies with the rationale of the Paris Declaration (to fully respect national procedures) and of PROSEA (to conduct planning entirely at sector level). This program has set a target for the water supply sector to ensure the conditions necessary for its transitiontoABSin2012areinplace(theequivalenttargetfor the sanitation sector has not yet been established).
Another characteristic of development aid in the WSS sector in Mali is the heavy involvement of nongovernmental organizations (NGOs)—Protos, CARE, Eau Vive, WaterAid, and so on; decentralized cooperation8 (several hundred twinning arrangements exist in the country); and diaspora associations (which, for over 20 years, have made sizeable financial contributions to the water supply sector, notably intheregionofKayes).
Investment planning has steadily been improving since 2004, theyear inwhich therewasaconsiderableDNH-initiated effort made by PNAEPA to coordinate the planning of rural and semi-urban water supply networks following updates made to the SIGMA (Système Informatique de Gestion du Mali) database (water supply facilities). PNAEPA has since developed into a sectorwide approach withPROSEA,forwhichthemaintool isaBPOcoupledwith a MTEF. It is to be noted that two MTEFs have been developed,oneforwatersupply(drivenbyDNH)andtheother for sanitation (driven by DNACPN).
Sector planning is therefore considered to be satisfactory, but with three reservations:
• The MTEF/BPO tool has been better developed andadoptedbytheDNHthanbytheDNACPN;investmentplanning for sanitation could still be significantly
Source: CSO2 scorecard.
Figure 5Scorecard indicator scores relating to financing compared to peer group7
Mali average scores
Averages,LICs,GNIp.p.<=US$500
RWS
RSH
USH
UWS
An AMCOW Country Status Overview
17
improved, notably by including the urban sanitation subsector and by using unit costs that have been better validated against actual experience. In addition, the local/commune planning tools (PDSEC: Plans Communaux de Développement Social, Economique, et Culturel; and PSA: Plan Stratégique d’Assainissement) also need to be improved and updated.
• Linksbetweenthedifferentplanninglevels(communal,regional, national) could be improved; although the communes theoretically lead the investment planning process, the national BPOs are not arranged as acompilation of these commune planning exercises. A pilotrecentlyundertakenintheKayesregion,andthenexpanded to other regions, has shown that integrating local authorities’ planning into theMTEF is perfectlyfeasible and that PROSEA would be able to cover the associated cost. The 2010 exercise is, therefore, the first wherebythenationalBPOshavebeendevelopedasacompilationof thoseBPOs created at local authoritylevel (however, whilst this is true for water, it is less so for sanitation).
• Although the 2009–11 MTEF/BPO for water supplyincludes both subsectors (rural and urban), investment planning for the urban water supply (UWS) subsector is currently carried out independently of RWS subsector investment planning and includes significant contributions from EDM. It is possible that the next planned reform will bring about changes to this situation, as it includes the creation of an asset-holding company for the UWS subsector which would, in all likelihood, be given responsibility for planning.
Aid coordination is carried out at the national level through several different instruments: through PROSEA as the coordination body (although it is not yet carrying out this role in full); through the sector reviews, where the main orientations of the sector are presented and discussed (however, the fact that these are only held once a year means coordination is neither particularly detailed nor operational); through the development partners’(DP) own consultation framework meetings, which are currently being facilitated by cooperation with the German agency,KfW (Kreditanstalt für Wiederaufbau). With the watersupplysectorduetomakethetransitiontoanABSin 2012, it is even more important that this coordination be improved.
At regional level, coordination should be carried out through the Regional Steering Committees for the Coordination and Monitoring of Development Orientations (CROCSAD: Comités Régionaux d’Orientation, de Coordination et de Suivi des Actions de Développement), chaired by the regionalGovernors, and through the Local Steering
Committees for the Coordination and Monitoring of Development Orientations (CLOCSAD: Comités Locaux d’Orientation, de Coordination et de Suivi des Actions de Développement),chairedbythelocalprefects.However,these organizations have only recently been created (February 2008) and do not specialize in water supply. In some regions, there are Regional Water Sector Committees (ComitésRégionauxduSecteurdel’Eau)inplace,whoselevels of activity vary according to the impetus given to them by the DRH and the main regional stakeholders(projects, NGOs, and decentralized cooperations).
It is difficult to compile a complete picture of all the financing allocated to the WSS sector in Mali due to the diverse nature of the external support agencies and their procedures; to the recent and modest introduction of the sectorwide approach; and to the limited role still being played by PROSEA in this area.
TheMTEFtool(anditssubsectorvariations,theBPOs),putin place four years ago, is aimed at improving the capacity to monitor and collate financing allocated to the sector; however, the extent to which it has been adopted varies fromonesubsectortoanother.TheBPOforwatersupplyhas become relatively sophisticated: the 2009–11 water supply MTEF, which includes both UWS and RWS, reflects the fact that there is a real planning capacity in place, even though the monitoring of indicators is still an issue.
The share of the national budget allocated to sector financing fluctuates and depends on a number of various decisions. This financing is generally provided through the Special Investment Budget (BSI: Budget Spécial d’Investissement), which contains most of the financial contributions that the state has committed to providing in the finance agreements signed with the DPs. The state is not, however, always in a position to honor its commitments and this situation risks being exacerbated by the financial crisis currently affecting the whole subregion.
The exact budget allocated to the sector is unknown, with the exception of the rural and semi-urban WSS subsector for which a review of public expenditure was carried out at the beginning of 2008 for the 2001–06 period. In addition,figuresareprovidedbytheDNHateachsectorreview as part of the report on implementation of the watersupplyBPO.Incontrast,onlyveryimprecisefiguresare available for sanitation.
Overall, the financing allocated to the WSS sector outside the EDM perimeter has increased significantly over the course of the last eight years, rising from 11 billion CFA Francs in 2001 to 42 billion in 2008, with a sharp increase
WaterSupplyandSanitationinMali:TurningFinanceintoServicesfor2015andBeyond

18
in funding levels seen from 2005 onwards. A large part of this growth is due to higher levels of donor financing, which rose from 9.5 billion CFA Francs in 2001 to 32.5 billion in 2008. The national budget has also increased at the same rate, rising from 1.6 billion CFA Francs in 2001 to 9.6 billion in 2008.
Over the course of the last three years, the overall proportion of financing utilized (domestic and donor) has remained stable at around 64 percent. This average does, however, conceal differences between domestic financing, where the percent of financing utilized rose considerably between 2006 and 2008, increasing from 70 percent to 95 percent, and donor financing, where the percent of financing utilized fell to only 53 percent in
An AMCOW Country Status Overview
Rural water supply:Total: $56,600,000
Per capita (new): $106
Urban water supply:Total: $32,000,000
Per capita (new): $155
Rural sanitation:Total: $18,600,000
Per capita (new): $21
Urban sanitation:Total: $10,700,000
Per capita (new): $28
Domestic anticipated investment
External anticipated investment
Assumed household investment
Gap
Source: CSO2 estimates.
Figure 6Overall and per capita investment requirements and contribution of anticipated financing by source
2008—thishighlightsboththesector’slimitedabsorptioncapacity and the issues created by the procedures that are currently in force.
The funding prospects for the next few years are stable, notably within PROSEA which brings together the majority of domestic and donor contributions. The anticipated financing is still insufficient, however, to cover all requirements,particularlyfortheruralsanitationsubsector,where the funding deficit equates to over half of thefinancing required (seeFigure6). In theory, financing forthe UWS subsector has already been obtained due to an ambitious investment plan presented by EDM for the 2010–12 period. Nevertheless, it appears highly unlikely that all theanticipatedfundingrequiredforthiswillbemobilized.

19
WaterSupplyandSanitationinMali:TurningFinanceintoServicesfor2015andBeyond
Whilstcertaindevelopmentshaveenabledthequalityofthe sector M&E mechanism to be improved, this generally remains unsatisfactory and out of step with the targets set out in PROSEA. Moreover, the situation varies widely from one subsector to another with sanitation and hygiene lagging behind the water supply subsectors.
ThescorecardshowsthatMali’sresultsforsectorM&Earelargely similar to the peer-group average (being slightly lower for the sanitation subsectors and marginally higher for water supply, see Figure 7).
6. SectorMonitoringandEvaluation
Priority actions for monitoring and evaluation
• Establishindicatorsfortheruralandsemi-urbanwatersupplysubsector.
• Ensure the definitions of ‘urban’ used by INSTAT and the urban operator (Energie du Mali) are consistent.
• Developmonitoringandevaluationforthesanitationandhygienesubsectors.
• HarmonizethestandardsandmethodologiesusedbytheJMPandthegovernment.
Some of the more positive aspects are:
• The establishment of a Statistics and Planning Unit(CPS: Cellule de Planification et de Statistique) in 2008 that covers both the water supply and sanitation sectors (as well as other related sectors). The CPS is specifically responsible for planning and M&E within the sector and so should, therefore, play a key role in implementingthisaspectofPROSEA.However,asit is relatively new, the CPS still lacks the necessary methods and resources.
• TheproductionbyEnergieduMaliofacertainnumberof annual indicators, as stipulated in the provisions of the contract linking the company to the state, and in the regulator’s (CREE) monitoring framework. Theseindicators enable the partial monitoring of the urban watersupplysubsector’sperformance.
• Astudycarriedoutin2008,theconclusionsofwhichwere validated at the beginning of 2009, which enabled the list and means of establishing M&E indicators to be defined, but only for the water supply subsector. The results of this study were highly anticipated as they form an integral part of the implementation and monitoringofthewatersupplyBPO.
Some of the more negative aspects or those where there is scope for improvement, are:
• ThelargediscrepanciesinthewatersupplyaccessratecalculatedbytheDNHandEDMandtheresultsoftheregularly conducted household surveys (upon which
Figure 7Scorecard indicator scores relating to sector M&E compared to peer group9
RWS
RSH
Mali average scores
Averages,LICs,GNIp.p.<=US$500
USH UWS
Source: CSO2 scorecard.
20
the JMP estimates are based). This disparity is moststriking in the urban water supply subsector where JMP figures indicate an access rate of 94 percent,yet this figure is not supported by field observations which have identified several areas of the capital, Bamako,ashavingnocoverage.Moregenerally,thislack of concordance is a reflection of the difficulties experienced by the sector in clearly defining access to the service and in including these definitions in the householdsurveys.TheJMPhasofferedtosupporta‘reconciliation’ofthisdata.
• Thecurrent lackofconsistencybetweenthe‘official’definition of what constitutes an urban area in Mali (particularly that used by INSTAT for population censuses) and the definition used by EDM (which operates the water supply service in 17 towns, thereby covering an area much smaller than that actually considered to be urban).
• ThereiscurrentlynoM&Esysteminplacethatisadaptedto the sanitation and hygiene subsectors, where the only data available are from household surveys and the quantitative data pertaining to facilities built aspart of the main projects. Much work still remains to be done to define both the baseline indicators (work that has already been completed for the water supply subsectors) and the means of monitoring the sector. This is a complex issue as monitoring cannot be carried out entirely at local or regional level and needs to include both an inventory of facilities built—such as public latrines, for example—and household surveys. A study financed by the DNACPN was initiated in 2010 to (a) precisely define the technical standards in use, notably for on-site sanitation; and (b) propose a M&E system for sanitation and hygiene that is both realistic and aligned to the constraints of the subsector (and notably to the ministerialHealth/Sanitationdichotomy).
An AMCOW Country Status Overview

21
WaterSupplyandSanitationinMali:TurningFinanceintoServicesfor2015andBeyond
7. Subsector:RuralWaterSupply
Priority actions for rural water supply
• AssisttheruralwatersupplysubsectortomakethetransitiontowardsSBS.
• Improvetheabsorptioncapacity:reinforcethebudgetimplementationcapacityoftheprivatesectorandimprovepublicprocurementprocedures.
• Improvemonitoringandevaluationofthesubsectorandincreasethecommunes’involvement.
• Improvethesustainabilityofthewatersupplyserviceinruralareas,asthisiscurrentlyweak.Expandtheuseoftheoperatorback-upsupportandmonitoringmechanism(STEFI).
• ContinuewiththepolicyofpromotingPPPinruralareas.
• Accordprioritytovillagesthatcurrentlyhavenomodernwaterpointinplace.
To make up the difference, the public authorities need to mobilize more financial resources (see Figure 9). According to CSO2 estimates, US$57 million per year needs to be invested in RWS if the corresponding MDG targets are to be achieved. A further US$11 million then needs to beaddedtothistocovertheinfrastructure’sO&Mcosts.High levelsof financinghavebeen invested in theRWSsubsector in Mali over the course of the last few years (including funds invested by NGOs), but achievement of the rural water supply MDG targets is dependent upon this level of investment being both sustained and increased.ThetransitiontoABS,plannedfor2012,shouldlead to a significant increase in the financing available to the subsector.
It is highly likely that the method currently used by the DNH to calculate the access rate to drinking water inrural areas leads it to overestimate coverage (70 percent in2008,comparedto44percentaccordingtotheJMP).Furthermore, the target set by the government (78 percent in 2015) is more ambitious than that identified from JMP data (61 percent). The current pace of access ratedevelopment is thus insufficient to enable the targets to be met; however, the RWS subsector has clearly made the most progress as regards organization. According to the Government of Mali, the current pace of modern water point construction will need to double if the MDG targets for the RWS subsector are to be achieved. This construction effort includes building both simple structures (handpumps, large diameter wells) and water supply networks.
Figure 8Rural water supply coverage
100%
80%
60%
40%
20%
0%1985 1990 1995 2000 2005 2010 2015 2020
Government estimates
JMPimproved
Government target
JMP,piped
Sources:JMPandnationaldata.
Figure 9Rural water supply investment requirements
0 20 40 60 80
RequiredCAPEX
Required OPEX
US$million/year
PublicCAPEX(anticipated) HouseholdCAPEX(assumed)
CAPEX deficit
Sources: CSO2 estimates.
Cov
erag
e

22
Overall, the scorecard results for the rural water supply subsector place Mali within the average of its economic peer group countries (see Figures 10 and 3).
The‘watersupply’BPO,putinplaceaspartoftheMTEF,has already progressed (particularly when compared to theBPOinplacefor‘sanitationandhygiene’).Thewatersupply BPO is updated each year and the latest versioncovers the 2011–12 period. In 2010, Mali organized its fourth sector review, which was the first to be organized by CPS. The fifth review took place at the end of March 2011.
The accounting headings currently utilized by the local authorities (who include very little investment in their budgets) and the state do not particularly distinguish betweenRWS(DNHperimeter)andurbanandsemi-urbanwater supply. The majority of donor financing is included in the national budget. The last review of public expenditure for the RWS subsector was conducted in 2008 and relates to the 2001–06 period. According to the conclusions of the April 2009 sector review, 53 percent of donor financing was utilized, which was slightly lower than the proportion of financing utilized in 2007. The cumbersome nature of the public procurement procedures was cited as the reason this rate was so low.
In RWS subsector planning, the communes with the lowest coverage rate are theoretically given priority. However,commune planning is not sufficiently linked to regional planning and decision making is mostly carried out at regional level.
Thereare veryprecise standards inplace for thequalityof the water distributed (stipulated in the 2007 National Strategy for rural and small towns water supply) but
they are neither systematically applied nor monitored. The performance indicators for the RWS subsector were established in 2009 as a result of a study conducted across the whole water supply sector, the conclusions of which have since been validated.
The database used within the RWS subsector is the ‘SIGMA’ database, which was last comprehensivelyupdated in 2004 to coincide with the work undertaken to prepare the National Program for Access to Drinking Water (PNAEP: Plan National d’Accès à l’Eau Potable). Although thedeconcentrated(DRH)departmentsregularlyprovidefeedback to the central level as to which elements of SIGMA need to be amended, including information on the facilities’breakdownrateandrehabilitationrequirements,the database is not kept sufficiently up-to-date. This
An AMCOW Country Status Overview
Figure 11Average RWS scorecard scores for enabling, developing, and sustaining service delivery, and peer-group comparison
Enabling
Mali average scores
Averages,LICs,GNIp.p.<=US$500
Sustaining Developing
Source: CSO2 scorecard.
Figure 10Rural water supply scorecard10
EnablingPolicy
3 2 1 2.5 1.5 2 2.5 1
Planning Budget Expenditure Equity Output Maintenance Expansion
1.5
Use
Developing Sustaining
Source: CSO2 scorecard.

23
WaterSupplyandSanitationinMali:TurningFinanceintoServicesfor2015andBeyond
information flow forms the basis of the current planning systemcreatedaspartoftheMTEF/BPO.
The water tariff is supposed to cover O&M costs, which is the case in most areas that receive no subsidies from either the state or the local authorities. The users of rural water supply networks generally do not contribute to the development of the service through the water tariff; extensions are carried out using public funds or financing mobilized by NGOs or decentralized cooperation stakeholders.Mali’sdiasporacommunityinFranceisalsohighly active in this domain.
Spare parts for pumps (handpumps or diesel engine pumping units) are mostly provided by the local private sector. Except in rare cases (a batch of spare parts obtained through a cooperation project), the state is not involved in this supply chain and this can create problems, notably in sparsely populated or difficult to access areas (the north of the country). In addition, the high growth in demand for water supply networks is increasingly putting the existence ofthe‘handpump’supplychainatrisk.
The management model used for water supply facilities in rural areas is both well-established and continually evolving. Simple facilities (typically, boreholes equipped withhandpumps) are overseen by Management Committees. The more complex facilities (water supply networks) are mostly managed by Water Users’ Associations (AUE:Association d’Usagers de l’Eau) which come under the responsibility of the communes. The communes are not entitled to directly manage the service, so they delegate the management of the water supply networks to the AUE or private operators (recourse to this latter option has been increasing rapidly as it has been promoted, and
supervised,bytheDNH).ThefactthatEDMoperateswithinsuch a small perimeter (only 17 towns) means that the communes, and those associations or private delegatees they have selected to manage the water supply service, are being made responsible for relatively large water supply networks.
Over 15 years ago, Mali put in place an innovative technical and financial monitoring system (STEFI) for water supply networks in rural areas. Although previously managed by a unit attached to theDNH, this systemhas nowbeendecentralized and taken over by specialist private operators recruited through a national invitation to tender process. The STEFI operators provide both back-up support and control onbehalf ofDNH (and so the communes). Thisis a predominantly self-financing service, using funding received from a surcharge of 20 CFA Francs per m3 pumped on the water tariff (this surcharge has remained the same for 15 years and is today insufficient to cover the STEFIoperators’costs).
The government has clearly stated it wishes to achieve the MDG targets for rural areas and the DPs have also expressed their willingness to support this effort. It is important to ensure that the external support agencies remain heavily involved in the RWS subsector as 70 percent of Mali’spopulation live in rural areas and so meeting the MDG targets constitutes a major challenge. The current pace of development is insufficient, however. To achieve the changeinpacerequired,itwillbenecessarytoovercomesteep hurdles related to the utilization of finance and public procedures (budgeting, procurement). These procedures need to be gradually simplified to reverse the trend observed in 2009 and 2010 (low percentage of financing utilized).
24
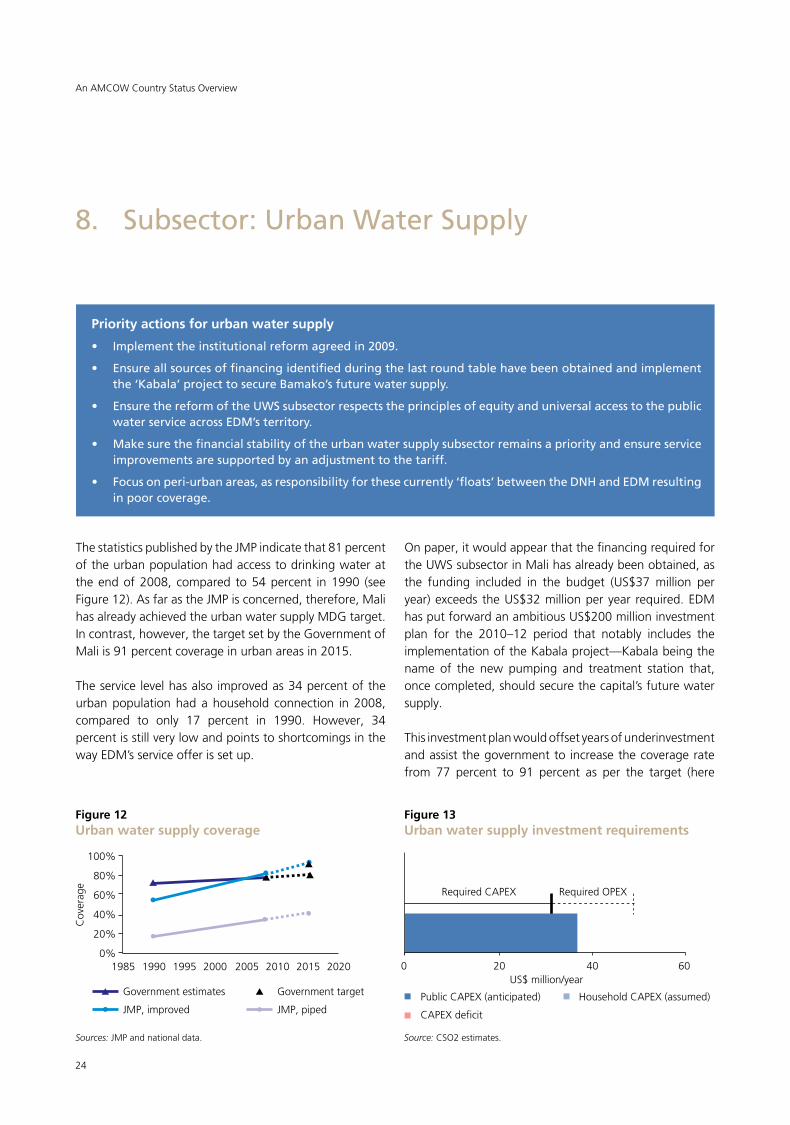
ThestatisticspublishedbytheJMPindicatethat81percentof the urban population had access to drinking water at the end of 2008, compared to 54 percent in 1990 (see Figure12).AsfarastheJMPisconcerned,therefore,Malihas already achieved the urban water supply MDG target. In contrast, however, the target set by the Government of Mali is 91 percent coverage in urban areas in 2015.
The service level has also improved as 34 percent of the urban population had a household connection in 2008, compared to only 17 percent in 1990. However, 34percent is still very low and points to shortcomings in the wayEDM’sserviceofferissetup.
8. Subsector:UrbanWaterSupply
Priority actions for urban water supply
• Implementtheinstitutionalreformagreedin2009.
• Ensureallsourcesoffinancingidentifiedduringthelastroundtablehavebeenobtainedandimplementthe‘Kabala’projecttosecureBamako’sfuturewatersupply.
• EnsurethereformoftheUWSsubsectorrespectstheprinciplesofequityanduniversalaccesstothepublicwaterserviceacrossEDM’sterritory.
• Makesurethefinancialstabilityoftheurbanwatersupplysubsectorremainsapriorityandensureserviceimprovementsaresupportedbyanadjustmenttothetariff.
• Focusonperi-urbanareas,asresponsibilityforthesecurrently‘floats’betweentheDNHandEDMresultinginpoorcoverage.
Onpaper,itwouldappearthatthefinancingrequiredforthe UWS subsector in Mali has already been obtained, as the funding included in the budget (US$37 million per year)exceedstheUS$32millionperyear required.EDMhas put forward an ambitious US$200 million investment plan for the 2010–12 period that notably includes the implementationoftheKabalaproject—Kabalabeingthename of the new pumping and treatment station that, oncecompleted,shouldsecurethecapital’sfuturewatersupply.
This investment plan would offset years of underinvestment and assist the government to increase the coverage rate from 77 percent to 91 percent as per the target (here
An AMCOW Country Status Overview
Figure 12Urban water supply coverage
100%
80%
60%
40%
20%
0%1985 1990 1995 2000 2005 2010 2015 2020
Government estimates
JMP,improved
Government target
JMP,piped
Sources:JMPandnationaldata.
Figure 13Urban water supply investment requirements
Cov
erag
e
0 20 40 60
RequiredCAPEX RequiredOPEX
US$million/year
PublicCAPEX(anticipated) HouseholdCAPEX(assumed)
CAPEX deficit
Source: CSO2 estimates.

25
Figure 14Urban water supply scorecard
EnablingPolicy
2 1.5 2 3 0.5 2 1.5 1.5 2.5
Planning Budget Expenditure Equity Output Maintenance Expansion Use
Developing Sustaining
Source: CSO2 scorecard.
WaterSupplyandSanitationinMali:TurningFinanceintoServicesfor2015andBeyond
thegovernmentfiguresareused,notthoseoftheJMP).However, there is little indication that itwillbepossibleto mobilize the US$200 million within such a short timeframe—the initial invitations to tender were only issued at the end of 2010.
Overall, the performance of the UWS subsector in Mali is slightly below the peer-group average (see Figures 14 and 15), with the main areas of weakness being encountered in the enabling conditions for putting services in place. Ensuring equity when extending the service is also anissue.
After the failure of the public-private partnership set up at the beginning of the decade of the 2000s, coupled with the resistance to change that prevailed in the subsector for a number of years, the institutional framework of the UWS subsector is now undergoing rapid development. The 2006 national water policy document makes a brief reference to the urban sector (page 54), but there is no viable and realistic policy in place that specifically targets the subsector. The institutional framework of the urban water supply subsector is due to be completely overhauled in 2011 following recommendations made in a study, validated in 2009, to separate water supply and electricity activities and to differentiate between operation of the service and asset management.
As part of PROSEA, there is a joint MTEF in place for the UWS subsector that includes both EDM activities and those directlymanaged by theDNH.However, any alignmentremains largely artificial as EDM’s implementation ofexpenditureistotallydifferenttothatoftheDNH,asareactivity planning and M&E. There is an investment plan that has been prepared by EDM and validated by the supervisory authority but it has not yet been possible to implement this due to the institutional situation, even
though all the conditions necessary for this implementation were in place at the end of 2010.
Whilst the access rate to the water supply service in urban areas is satisfactory, the low number of household connections is symptomatic of production failings and highlights potential scope for improvement. Although EDM has successfully and steadily increased water productionforBamakoandtheothercentersthroughthe‘emergencyprograms’partially financedbyexternalaid,in general production is not keeping pace with demand. This is particularly true in Bamako where financing ofthe ‘right bank’ treatment plant (the ‘Kabala’ project),aimed at ensuring that medium-term future production requirements canbemet, hasbeendelayeddue to theimplementation of the new institutional framework. At the 2009 sector review, EDM presented an ambitious US$200 million investment plan for 2010–12; it is unlikely,
Figure 15Average UWS scorecard scores for enabling, developing, and sustaining service delivery, and peer-group comparison
Enabling
Mali average scores
Averages,LICs,GNIp.p.<=US$500
Sustaining Developing
Source: CSO2 scorecard.
26
however, that this will be implemented before 2011, after the financing arrangements for theKabalaproject havebeen confirmed.
Within EDM’s concession area, planning is conductedby mutual agreement between the DNH (supervisoryauthority), EDM and, to a lesser extent, the communes. There is very little local stakeholder involvement (users’associations, community groups, private operators). The planning process currently contains no criteria for allocating finance; this is due to the fact that very few development partners directly finance EDM, in addition to which the national budget often has to be utilized for emergency programs. There is no specific strategy in place aimed at providing access to the poorest users, although some pro-poor programs have been implemented by communes and nongovernmental stakeholders.
In urban areas, the rate at which production and the uptake of household connections are increasing is too slow to enable the urban water supply MDG targets to be met. There were 3,636 new connections in 2008, which was24percent fewer than in2007 inBamako (and18percentfeweroverthewholecountry).Thequalityofthewater distributed by EDM is independently defined and controlled.
EDM is a public company and its accounts are regularly audited. EDMactivities are controlled both by theDNH(representing the ministry in charge of water supply for the whole water sector) and by an independent regulator, CREE.
A pricing study was carried out in 2008 in preparation for the institutional reform. The pricing issue is both fundamental (as the tariffs are currently very low and
need to be increased to ensure the sector’s financialstability) and highly sensitive (it was CREE’s decision tointroduce tariff reductions in both 2002 and 2004, offset by subsidies provided to the operator by the state, that triggered the crisis which culminated in the departure of the international majority shareholder).
The proportion of water distributed and paid for is estimated to stand at 74 percent for the country as a whole (71 percentforthenetworkinBamako,whichprovideswatertothevastmajorityofEDM’sclients).Despiteconsiderableefforts made by EDM since the beginning of the decade of the 2000s, this percentage is continuing to fall due to the aging networks and low levels of investment.
In theory, investment planning comes under the remit of thestate,representedbytheDNH.EDMregularlypreparesabusinessplanandclearlyhasthecompetenciesrequiredto conduct planning and support the implementation of investment. As a result of the ongoing institutional reform, however, investment planning (and, in all likelihood, the related contracting authority role) will be carried out by the asset-holding company that is due to be set up, with EDM remaining as the water supply service operator.
Asfarasservicequalityisconcerned,accesstothenetworkintheperi-urbansettlementsofBamakoisnotoriouslypoorand certain neighborhoods are entirely dependent upon water resellers who obtain their water from standposts connected to either the EDM network or to independent networks managed by private operators or associations. Some neighborhoods suffer from water shortages (with distribution proving difficult during certain periods, notably at the end of the dry season) but, on average, following emergency measures put in place by EDM since 2000, water is now available for over 12 hours per day.
An AMCOW Country Status Overview

27
WaterSupplyandSanitationinMali:TurningFinanceintoServicesfor2015andBeyond
Mali is currently unable to produce reliable figures for the country’s rural sanitation and hygiene (RSH) subsector.The only figures available are those of the JMP whichestimates that, in 2008, only one rural household in three (32 percent) had access to an improved sanitation facility (see Figure 16). Few programs have distributed improved sanitation facilities, with the exception of those in public places or institutions (schools, healthcare centers). The numberofhouseholdsequippedwithsanitationfacilitiesis very low, with most of these facilities having been paid
9. Subsector:RuralSanitationandHygiene
Priority actions for rural sanitation and hygiene
• SetupamonitoringandevaluationmechanismwithindicatorsthatareespeciallyadaptedtotheruralsanitationsubsectorinMali.
• Improvethesubsector’scapacitytousetheBPO/MTEFtooltoincreasethefinancingavailabletotheruralsanitation subsector.
• Developstrategiesfor implementingtheNationalPolicyanddrafttheregulatorytextsrequiredfor itsoperationalization.
• Ensuregreaterconsiderationisgiventohygieneandsanitationincommuneplanning(PDSEC,PSA,andthecommunes’budgets).
• Promoteawareness-raisingandhygieneeducationcampaignsandreduceopendefecationthroughthedevelopmentoftheCommunity-LedTotalSanitationapproach.
• Improvethecapacityofthedeconcentratedstatedepartmentstorespondtothecommunes’demandforback-upsupport.
for by the households themselves, and open defecation remains prevalent (21 percent of rural households).
AnalysesofthefinancingavailabletotheRSHsubsectorshow that Mali will be unable to achieve the MDG target for rural sanitation due to the large funding gap. According toCSO2estimates,US$19millionperyearwillberequiredfor the targets to be met, whereas only US$6 million of public investment has so far been obtained. While not to be overlooked, the investment mobilized by households
Figure 17Rural sanitation investment requirements
0 5 10 15 20 25
RequiredCAPEX Required OPEX
US$million/year
PublicCAPEX(anticipated) HouseholdCAPEX(assumed)
CAPEX deficit
Source: CSO2 estimates.
Figure 16Rural sanitation coverage
100%
80%
60%
40%
20%
0%1985 1990 1995 2000 2005 2010 2015 2020
Government estimates
JMP,improved
Government target
JMP,improved+shared
Sources:JMPandnationaldata.
Cov
erag
e

28
Figure 19Average RSH scorecard scores for enabling, developing, and sustaining service delivery, and peer-group comparison
Enabling
Mali average scores
Averages,LICs,GNIp.p.<=US$500
Sustaining Developing
Source: CSO2 scorecard.
(around US$3 million) will only offset a small part of this deficit. This situation reflects the underfinancing of sanitation and hygiene in general and of the rural subsector in particular.
Furthermore,aroundUS$2millionisalsorequiredtocoverthefacilities’O&Mcosts(seeFigure17).Atthemoment,the vast majority of these costs are being met by the households (these maintenance costs are relatively low as household latrines are virtually the only type of sanitation facility used in rural areas).
Sanitation and hygiene in rural areas are not considered priorities by either the national or local authorities. This explains the below-average performance of the subsector (see Figures 4 and 18), with development of the service noticeably lagging behind that of other African low-income countries.
There are, however, some positive elements in place within the RSH subsector, which suggest it may be accordedgreater priority in the years to come.
The PNA was approved at the beginning of 2009. This new policy clearly designates the DNACPN, placed under the Ministry of the Environment and Sanitation, as the body in charge of coordinating the sanitation and hygiene sector. A strong incentive has been put in place for DNACPN to work with the other ministries (notably theMinistryofHealthonhygieneissuesandtheMinistryof Energy and Water to improve the link between water supply and sanitation and hygiene). The PNA sets out clear targets for 2015 but not all of these have been precisely quantified.Thenationaltargetlistedinthelatestavailabledocumentation (2010–2012 MTEF) is lower than the MDG target for sanitation in rural areas.
AspartofPROSEA,aBPO/MTEFiscurrentlybeingdevelopedfor the (urban and rural) sanitation and hygiene sector. However,itisdifficulttodistinguishruralfromurban(forbudgetplanningpurposes, themasterplan forBamakoseems to be dealt with separately and is not currently included in the MTEF). Annual sector reviews have been held since 2007, but they do not particularly lead to new projects being launched and their effectiveness could be improved. Due to the lack of monitoring indicators, the sanitation and hygiene MTEF/BPO tool also still needsfurther refinement.
Rural sanitation is not identified as such in the national budget and communes hardly ever include this expenditure in their budgets. There are masons active in most towns, buttheydonotalwaysmasterthetechniquesrequiredforthe construction of improved household latrines, for which demand is currently very low in rural areas. Nevertheless, it
An AMCOW Country Status Overview
Figure 18Rural sanitation and hygiene scorecard
EnablingPolicy
3 1.5 1 2 0.5 0.5 1.5
Planning Budget Expenditure Equity Output Markets
0.5 1
Uptake Use
Developing Sustaining
Source: CSO2 scorecard.

29
is worth noting that several organizations are supporting the Ministry of Health by promoting SanPlat slabs(UNICEF, Plan Mali, WaterAid, and so on). This has led to the training of a sizeable number of masons and there areseveralSanPlatslabproduction/promotionworkshopstaking place. Unfortunately, this effort has not yet been comprehensively evaluated and there is no recent reliable data available to measure its success. Furthermore, interaction between the two ministries (Sanitation and Health)islimitedandthoseactivitiescarriedoutonbehalfof theMinistry of Health are not included in theM&Emechanism as Health and Sanitation come under twodifferent Statistics and Planning Units (CPS).
RecentpilotsoftheCommunity-LedTotalSanitation(CLTS)approach(notablyintheKoulikororegion)havenotledtoa particular increase in demand as most newly constructed latrines are traditional latrines built by the families themselves. There is no program in place at national level to either train or reinforce the local private sector.
The promotion of sanitation is considered a priority in the national policy, which seeks to strike a balance between stimulating demand and subsidizing facilities, particularly in rural areas. Some projects and programs (led by the government or NGOs) have made considerable efforts to drive promotional activities in rural areas, despite insufficient resources being made available at the national level.
The DNACPN recently trialed the CLTS approach in 30villagesintheregionofKoulikoro(withthetechnicalandfinancial support of UNICEF) and the initial results have beenhighlypromising:inMay2010,CLTSwaslaunched
in 106 communes and 48 communities have already been declaredFéDAL (certifiedas ‘opendefecation free’—‘fin de défécation a l’air libre’). Around 2,000 latrines havebeen either built or rehabilitated in less than a year, which have benefited around 95,000 people. In addition, pools of CLTS experts have been set up at the central leveland in two regions. CLTS in Mali is, therefore, clearlymoving on from the experimental stage and is now being upscaled. The government wishes to expand this approach nationwide, whilst at the same time recognizing that technical standards need to be improved to encourage the transition away from slabs made of wood or mud towards washable slabs (such as SanPlat).
The monitoring of hygiene practices in general and of handwashing with soap, in particular, is still unsatisfactory. Since 2010, the DNACPN has been working on defining indicators for the whole subsector but this task has not yet been completed and needs to be integrated into the monitoring planning conducted at the MTEF level.
Since 1990, there has been a steady but slow (23 percent to 32 percent) increase in the access rate. This rise is mainly due to the investment made by households, which is inevitably limited in rural areas. The activities currently beingundertakentoimplementCLTSshouldmainlyleadto a reduction in open defecation, still practiced by 21 percentofhouseholds.However,unlessthelinkbetweenCLTSandthepromotionofSanPlatlatrinesisreinforced,it will have less impact on the number of households equipped with improved latrines. The current rate oflatrine construction means that is unlikely that Mali will achieve its MDG targets for the rural sanitation and hygiene subsector.
WaterSupplyandSanitationinMali:TurningFinanceintoServicesfor2015andBeyond

30
Access to improved sanitation in urban areas increased slowly between 1990 and 2008, rising from 36 percent to 45percentaccordingtotheJMP(thisisasmallerincreasethan that seen in rural areas, which is to be expected given the high urban population growth). This rise is mainly due to the investment made by households—the 2008 DNACPN report indicates that 9,149 latrines and 2,348 soakaways were constructed with the aid of public funds, which constitute only a small proportion of the total number of facilities built.
10.Subsector:UrbanSanitationandHygiene
Priority actions for urban sanitation and hygiene
• Seekfinancingforthesubsector,notablyintheformofaseweragesurchargeaddedtothewaterbill.
• Providecapacity-buildingtothecommunestoensuretheyareabletotakeonallorpartofthesanitationinfrastructure contracting authority role.
• FinalizeandimplementthesanitationmasterplanforBamako,clarifyingtheconditionsnecessaryforitsinstitutionalcustomization.
• Apply the provisions included in the PNA, notably with regard to Strategic Sanitation Plans and thedevelopmentofdisposalsites.
This increase in access is currently too low for there to be any possibility of achieving the MDG target for sanitation inurbanareas(68percent).However,ifsharedlatrinestobeincludedinthe‘improved’category,thecurrentpaceof development would be largely sufficient to meet the MDG target (see Figure 20).
A large part of the progress seen above is due to households investing their own funds in facilities. The state and local authorities inject very low levels of public funds intourbansanitationandhygiene(USH)andthesubsector
Figure 21Urban sanitation investment requirements
0 5 10 15
RequiredCAPEX Required OPEX
US$million/year
Source: CSO2 estimates.
Figure 20Urban sanitation coverage
100%
80%
60%
40%
20%
0%1985 1990 1995 2000 2005 2010 2015 2020
Government estimates
JMP,improved
Government target
JMP,improved+shared
Sources:JMPandnationaldata.
Cov
erag
e
PublicCAPEX(anticipated) HouseholdCAPEX(assumed)
CAPEX deficit
An AMCOW Country Status Overview
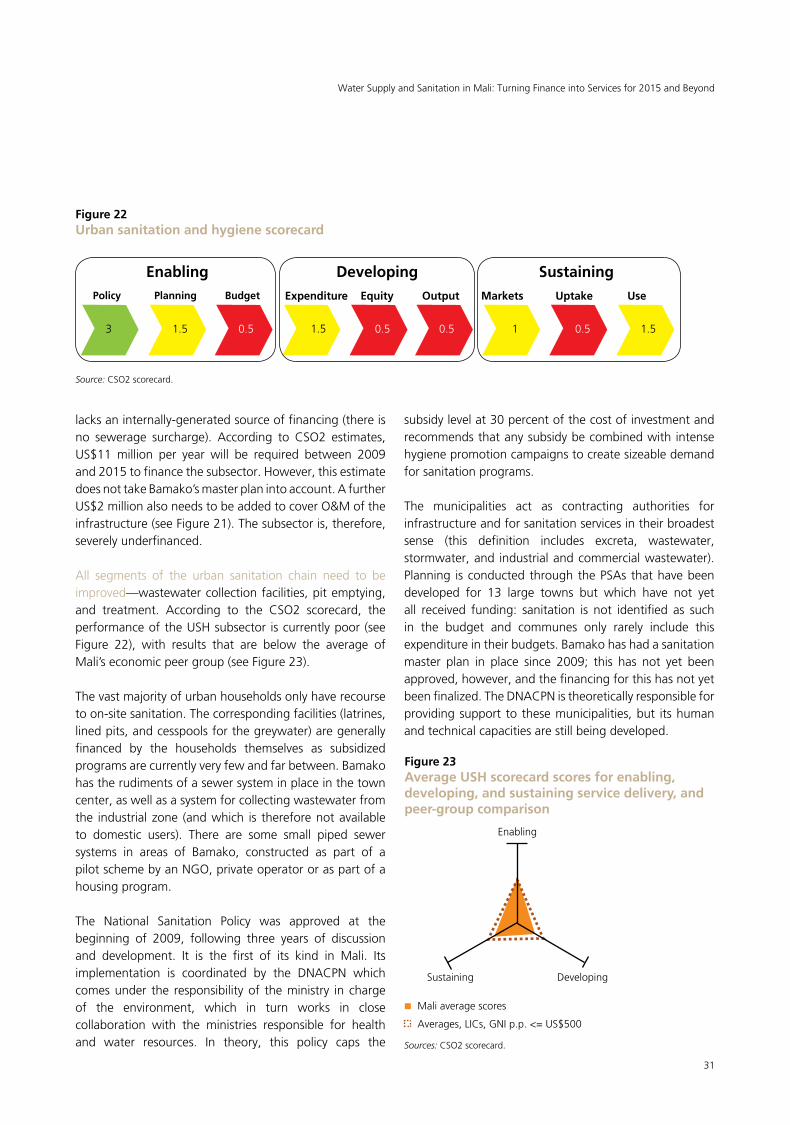
31
WaterSupplyandSanitationinMali:TurningFinanceintoServicesfor2015andBeyond
lacks an internally-generated source of financing (there is no sewerage surcharge). According to CSO2 estimates, US$11million per year will be required between 2009and2015tofinancethesubsector.However,thisestimatedoesnottakeBamako’smasterplanintoaccount.AfurtherUS$2 million also needs to be added to cover O&M of the infrastructure (see Figure 21). The subsector is, therefore, severely underfinanced.
All segments of the urban sanitation chain need to be improved—wastewater collection facilities, pit emptying, and treatment. According to the CSO2 scorecard, the performanceoftheUSHsubsector iscurrentlypoor(seeFigure 22), with results that are below the average of Mali’seconomicpeergroup(seeFigure23).
The vast majority of urban households only have recourse to on-site sanitation. The corresponding facilities (latrines, lined pits, and cesspools for the greywater) are generally financed by the households themselves as subsidized programsarecurrentlyveryfewandfarbetween.Bamakohas the rudiments of a sewer system in place in the town center, as well as a system for collecting wastewater from the industrial zone (and which is therefore not available to domestic users). There are some small piped sewer systems in areas of Bamako, constructed as part of apilot scheme by an NGO, private operator or as part of a housing program.
The National Sanitation Policy was approved at the beginning of 2009, following three years of discussion and development. It is the first of its kind in Mali. Its implementation is coordinated by the DNACPN which comes under the responsibility of the ministry in charge of the environment, which in turn works in close collaboration with the ministries responsible for health and water resources. In theory, this policy caps the
subsidy level at 30 percent of the cost of investment and recommends that any subsidy be combined with intense hygiene promotion campaigns to create sizeable demand for sanitation programs.
The municipalities act as contracting authorities for infrastructure and for sanitation services in their broadest sense (this definition includes excreta, wastewater, stormwater, and industrial and commercial wastewater). Planning is conducted through the PSAs that have been developed for 13 large towns but which have not yet all received funding: sanitation is not identified as such in the budget and communes only rarely include this expenditureintheirbudgets.Bamakohashadasanitationmaster plan in place since 2009; this has not yet been approved, however, and the financing for this has not yet been finalized. The DNACPN is theoretically responsible for providing support to these municipalities, but its human and technical capacities are still being developed.
Figure 23Average USH scorecard scores for enabling, developing, and sustaining service delivery, and peer-group comparison
Enabling
Mali average scores
Averages,LICs,GNIp.p.<=US$500
Sustaining Developing
Sources: CSO2 scorecard.
Figure 22Urban sanitation and hygiene scorecard
EnablingPolicy
3 1.5 0.5 1.5 0.5 0.5 1 0.5 1.5
Planning Budget Expenditure Equity Output Markets Uptake Use
Developing Sustaining
Source: CSO2 scorecard.
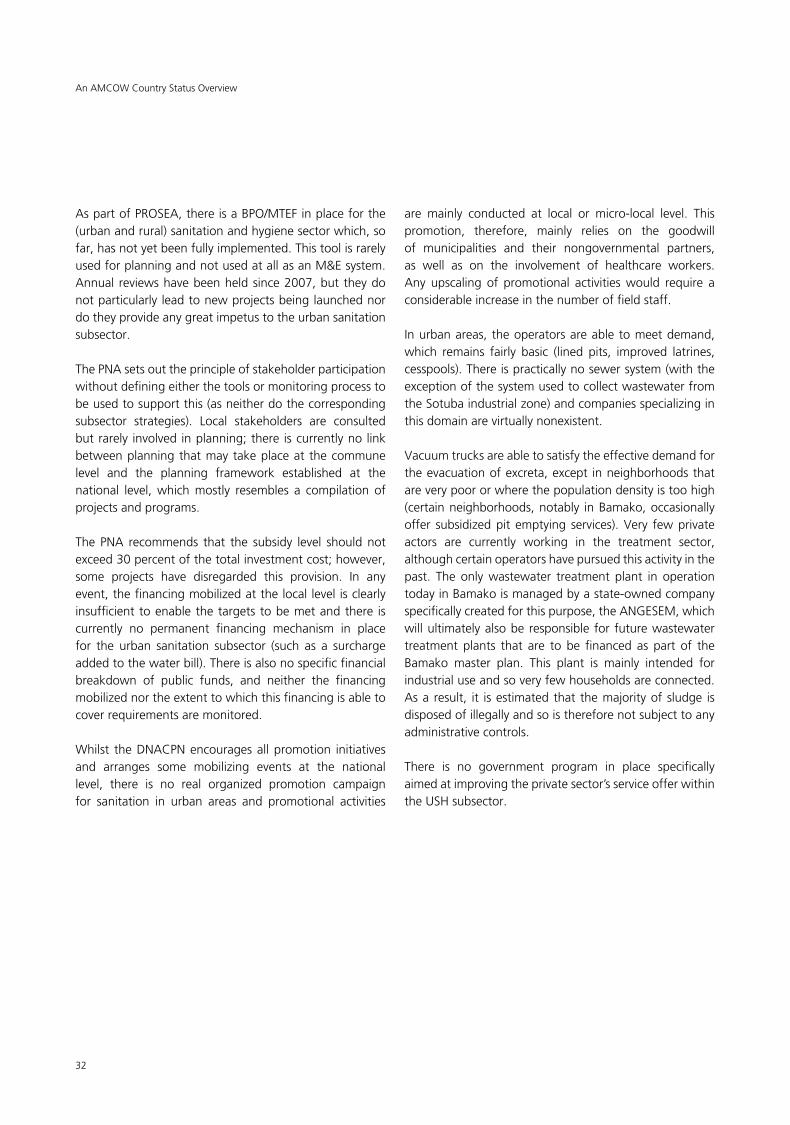
32
An AMCOW Country Status Overview
AspartofPROSEA,thereisaBPO/MTEFinplaceforthe(urban and rural) sanitation and hygiene sector which, so far, has not yet been fully implemented. This tool is rarely used for planning and not used at all as an M&E system. Annual reviews have been held since 2007, but they do not particularly lead to new projects being launched nor do they provide any great impetus to the urban sanitation subsector.
The PNA sets out the principle of stakeholder participation without defining either the tools or monitoring process to be used to support this (as neither do the corresponding subsector strategies). Local stakeholders are consultedbut rarely involved in planning; there is currently no link between planning that may take place at the commune level and the planning framework established at the national level, which mostly resembles a compilation of projects and programs.
The PNA recommends that the subsidy level should not exceed 30 percent of the total investment cost; however, some projects have disregarded this provision. In any event, the financing mobilized at the local level is clearly insufficient to enable the targets to be met and there is currently no permanent financing mechanism in place for the urban sanitation subsector (such as a surcharge added to the water bill). There is also no specific financial breakdown of public funds, and neither the financing mobilized nor the extent to which this financing is able to coverrequirementsaremonitored.
Whilst the DNACPN encourages all promotion initiatives and arranges some mobilizing events at the national level, there is no real organized promotion campaign for sanitation in urban areas and promotional activities
are mainly conducted at local or micro-local level. This promotion, therefore, mainly relies on the goodwill of municipalities and their nongovernmental partners, as well as on the involvement of healthcare workers. Any upscaling of promotional activitieswould require aconsiderable increase in the number of field staff.
In urban areas, the operators are able to meet demand, which remains fairly basic (lined pits, improved latrines, cesspools). There is practically no sewer system (with the exception of the system used to collect wastewater from the Sotuba industrial zone) and companies specializing in this domain are virtually nonexistent.
Vacuum trucks are able to satisfy the effective demand for the evacuation of excreta, except in neighborhoods that are very poor or where the population density is too high (certainneighborhoods,notably inBamako,occasionallyoffer subsidized pit emptying services). Very few private actors are currently working in the treatment sector, although certain operators have pursued this activity in the past. The only wastewater treatment plant in operation todayinBamakoismanagedbyastate-ownedcompanyspecifically created for this purpose, the ANGESEM, which will ultimately also be responsible for future wastewater treatment plants that are to be financed as part of the Bamako master plan. This plant is mainly intended forindustrial use and so very few households are connected. As a result, it is estimated that the majority of sludge is disposed of illegally and so is therefore not subject to any administrative controls.
There is no government program in place specifically aimedatimprovingtheprivatesector’sserviceofferwithintheUSHsubsector.

33
WaterSupplyandSanitationinMali:TurningFinanceintoServicesfor2015andBeyondWaterSupplyandSanitationinMali:TurningFinanceintoServicesfor2015andBeyond
1 Source:GlobalEconomicMonitor,theWorldBank,2010average.
2 The first round of CSOs was carried out in 2006 covering 16 countries and is summarized in the report, Getting Africa On-Track to Meet the MDGs on Water and Sanitation.
3 Due to rounding, subsector figures may not sum to totals.4 The CSO2 scorecard methodology and its structure are
detailed in the regional synthesis report.5 Within this report, Mali is classified as an African low-
income country with a GNI below US$500 per capita (WorldBankAtlasMethod).
6 The relevant indicators are as follows. All subsectors: targets in the national development plan or the PRSP; subsector policies agreed and approved. RWS/UWS:institutional roles defined. RSH/USH: institutional leadappointed.
7 The relevant indicators are as follows. All subsectors: programmatic Sector-Wide Approach; investment program based on MDG needs assessment; sufficient finance to meet the MDG; percent of official donor commitments utilized; percent of domestic commitments utilized.
8 A relatively common phenomenon in Francophone West
NotesandReferences
Africa: exchange of technical or financial support between institutions of the global North and South, other than central governments.
9 The relevant indicators are as follows. All subsectors: annual review setting new undertakings; subsector spend identifiable in budget (UWS: including recurrent subsidies);budgetcomprehensivelycoversdomestic/donorfinance; standards and definitions used for household surveys consistent with JMP. RWS/RSH: domestic/donorexpenditure reported. UWS: audited accounts and balance sheetsfromutilities.RWS/RSH:periodicanalysisofequitycriteria by CSOs and government. UWS: pro-poor plans developed and implemented by utilities. RWS/UWS:nationally consolidated reporting of output. RSH/USH:monitoringofquantity andqualityofuptake relative topromotion and subsidy efforts.
10 The scorecard uses a simple color code to indicate: building blocks that are largely in place, acting as a driver on service delivery (score >2, green); building blocks that areadragonservicedeliveryandrequireattention(score1–2, yellow); and building blocks that are inadequate,constituting a barrier to service delivery and a priority for reform(score<1,red).

Notes

Notes

Notes

The first round of Country Status Overviews (CSO1) published in 2006 benchmarked the preparedness of sectors of 16 countries in Africa to meet the WSS MDGs based on their medium-term spending plans and a set of ‘success factors’ selected from regional experience. Combined with a process of national stakeholder consultation, this prompted countries to ask whether they had those ‘success factors’ in place and, if not, whether they should put them in place.
The second round of Country Status Overviews (CSO2) has built on both the method and the process developed in CSO1. The ‘success factors’ have been supplemented with additional factors drawn from country and regional analysis to develop the CSO2 scorecard. Together these reflect the essential steps, functions and results in translating finance into services through government systems—in line with Paris Principles for aid effectiveness. The data and summary assessments have been drawn from local data sources and compared with internationally reported data, and, wherever possible, the assessments have been subject to broad-based consultations with lead government agencies and country sector stakeholders, including donor institutions.
This second set of 32 Country Status Overviews (CSO2) on water supply and sanitation was commissioned by the African Ministers’ Council on Water (AMCOW). Development of the CSO2 was led by the World Bank administered Water and Sanitation Program (WSP) in collaboration with the African Development Bank (AfDB), the United Nations Children’s Fund (UNICEF), the World Bank and the World Health Organization (WHO).
This report was produced in collaboration with the Government of Mali and other stakeholders during 2009/10. Some sources cited may be informal documents that are not readily available.
The findings, interpretations, and conclusions expressed in this volume do not necessarily reflect the views of the collaborating institutions, their Executive Directors, or the governments they represent. The collaborating institutions do not guarantee the accuracy of the data included in this work. The boundaries, colors, denominations, and other information shown on any map in this work do not imply any judgment on the part of the collaborating institutions concerning the legal status of any territory or the endorsement or acceptance of such boundaries.
The material in this publication is copyrighted. Requests for permission to reproduce portions of it should be sent to [email protected]. The collaborating institutions encourage the dissemination of this work and will normally grant permission promptly. For more information, please visit www.amcow.net or www.wsp.org.
Photograph credits:
© 2011 Water and Sanitation Program

For enquiries, contact:Water and Sanitation Program–Africa RegionThe World Bank, Upper Hill RoadP.O. Box 30577, 00100, Nairobi, KenyaTel: +(254) 20 322 6300 E-mail: [email protected] site: www.wsp.org
An AMCOW Country Status Overview
Water Supply and Sanitation in MaliTurning Finance into Services for 2015 and Beyond


