32
WATER SUPPLY MASTER PLAN 2017 – PROJECT RISKS 9/8/2017 Results of Pairwise and Traditional Risk Analyses Attachment 3 Page 1 of 32

WATER SUPPLY MASTER PLAN 2017 – PROJECT RISKS
9/8/2017 Results of Pairwise and Traditional Risk Analyses
Attachment 3 Page 1 of 32
Water Supply Master Plan 2017 – PROJECT RISKS
P a g e 1
Contents
OVERVIEW ........................................................................................................................... 2
RISK ELEMENTS.................................................................................................................... 2
PAIRWISE RISK ANALYSIS ................................................................................................... 4 PAIRWISE RISK ANALYSIS BY RISK ELEMENT ..................................................................................... 4 PAIRWISE RANKING RESULTS ............................................................................................................ 10
RISK SEVERITY AND LIKELIHOOD ANALYSIS ................................................................... 12
TOTAL PROJECT RISK CALCULATION ............................................................................... 14
PROJECT RISK SUMMARY AND CONCLUSIONS ............................................................... 17
Appendices A. Project Descriptions B. Methodology
Attachment 3 Page 2 of 32
Water Supply Master Plan 2017 – PROJECT RISKS
Page 2
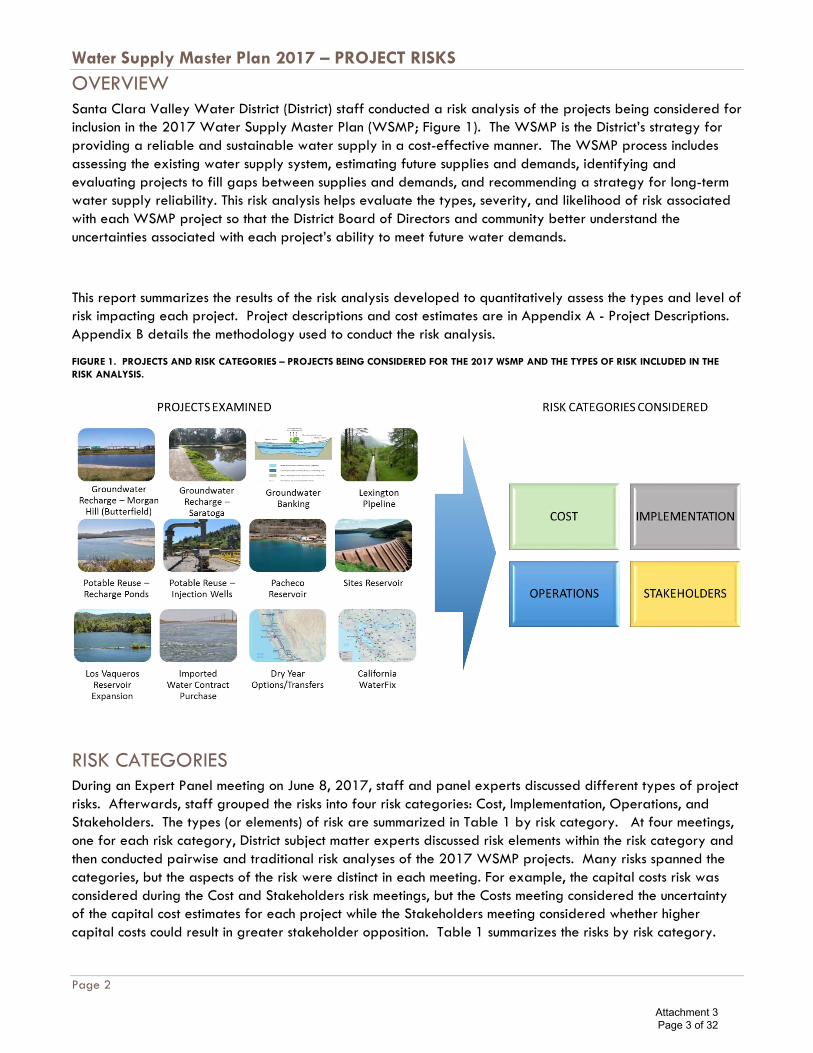
OVERVIEW Santa Clara Valley Water District (District) staff conducted a risk analysis of the projects being considered for inclusion in the 2017 Water Supply Master Plan (WSMP; Figure 1). The WSMP is the District’s strategy for providing a reliable and sustainable water supply in a cost-effective manner. The WSMP process includes assessing the existing water supply system, estimating future supplies and demands, identifying and evaluating projects to fill gaps between supplies and demands, and recommending a strategy for long-term water supply reliability. This risk analysis helps evaluate the types, severity, and likelihood of risk associated with each WSMP project so that the District Board of Directors and community better understand the uncertainties associated with each project’s ability to meet future water demands.
This report summarizes the results of the risk analysis developed to quantitatively assess the types and level of risk impacting each project. Project descriptions and cost estimates are in Appendix A - Project Descriptions. Appendix B details the methodology used to conduct the risk analysis.
FIGURE 1. PROJECTS AND RISK CATEGORIES – PROJECTS BEING CONSIDERED FOR THE 2017 WSMP AND THE TYPES OF RISK INCLUDED IN THE RISK ANALYSIS.
RISK CATEGORIES During an Expert Panel meeting on June 8, 2017, staff and panel experts discussed different types of project risks. Afterwards, staff grouped the risks into four risk categories: Cost, Implementation, Operations, and Stakeholders. The types (or elements) of risk are summarized in Table 1 by risk category. At four meetings, one for each risk category, District subject matter experts discussed risk elements within the risk category and then conducted pairwise and traditional risk analyses of the 2017 WSMP projects. Many risks spanned the categories, but the aspects of the risk were distinct in each meeting. For example, the capital costs risk was considered during the Cost and Stakeholders risk meetings, but the Costs meeting considered the uncertainty of the capital cost estimates for each project while the Stakeholders meeting considered whether higher capital costs could result in greater stakeholder opposition. Table 1 summarizes the risks by risk category.
Attachment 3 Page 3 of 32
Water Supply Master Plan 2017 – PROJECT RISKS
P a g e 3
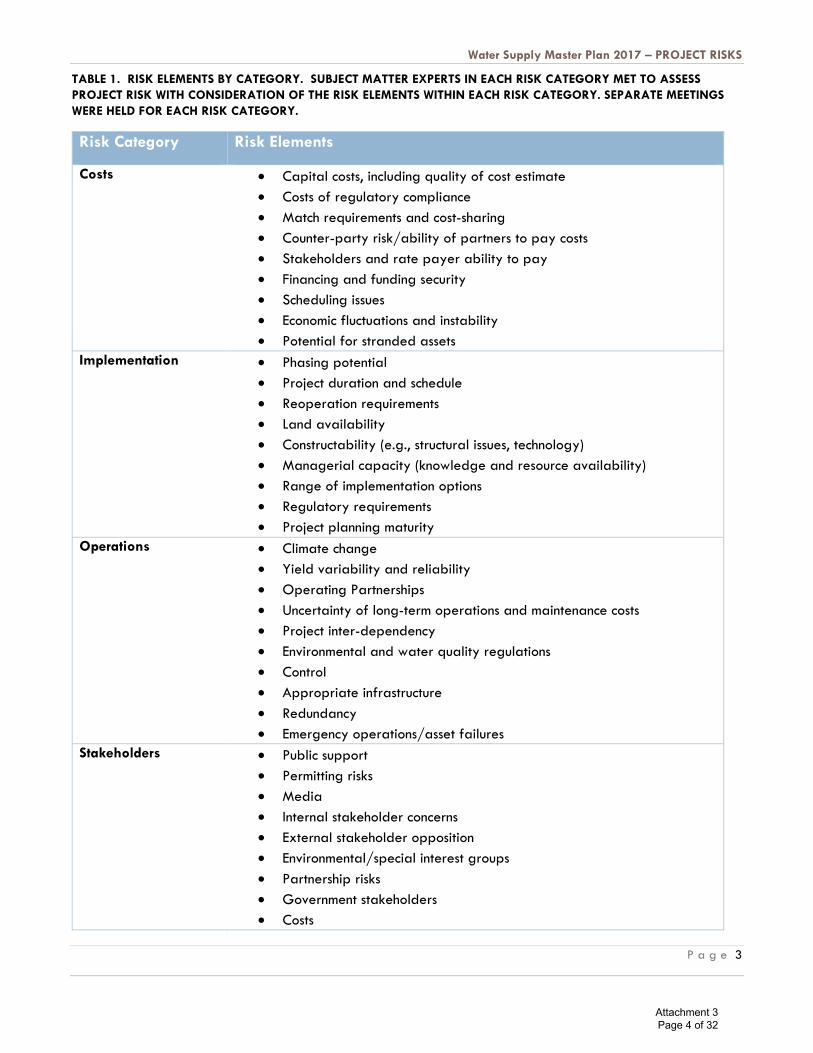
TABLE 1. RISK ELEMENTS BY CATEGORY. SUBJECT MATTER EXPERTS IN EACH RISK CATEGORY MET TO ASSESS PROJECT RISK WITH CONSIDERATION OF THE RISK ELEMENTS WITHIN EACH RISK CATEGORY. SEPARATE MEETINGS WERE HELD FOR EACH RISK CATEGORY.
Risk Category Risk Elements
Costs • Capital costs, including quality of cost estimate • Costs of regulatory compliance • Match requirements and cost-sharing • Counter-party risk/ability of partners to pay costs • Stakeholders and rate payer ability to pay • Financing and funding security • Scheduling issues • Economic fluctuations and instability • Potential for stranded assets
Implementation • Phasing potential • Project duration and schedule • Reoperation requirements • Land availability • Constructability (e.g., structural issues, technology) • Managerial capacity (knowledge and resource availability) • Range of implementation options • Regulatory requirements • Project planning maturity
Operations • Climate change • Yield variability and reliability • Operating Partnerships • Uncertainty of long-term operations and maintenance costs • Project inter-dependency • Environmental and water quality regulations • Control • Appropriate infrastructure • Redundancy • Emergency operations/asset failures
Stakeholders • Public support • Permitting risks • Media • Internal stakeholder concerns • External stakeholder opposition • Environmental/special interest groups • Partnership risks • Government stakeholders • Costs
Attachment 3 Page 4 of 32

Water Supply Master Plan 2017 – PROJECT RISKS
Page 4
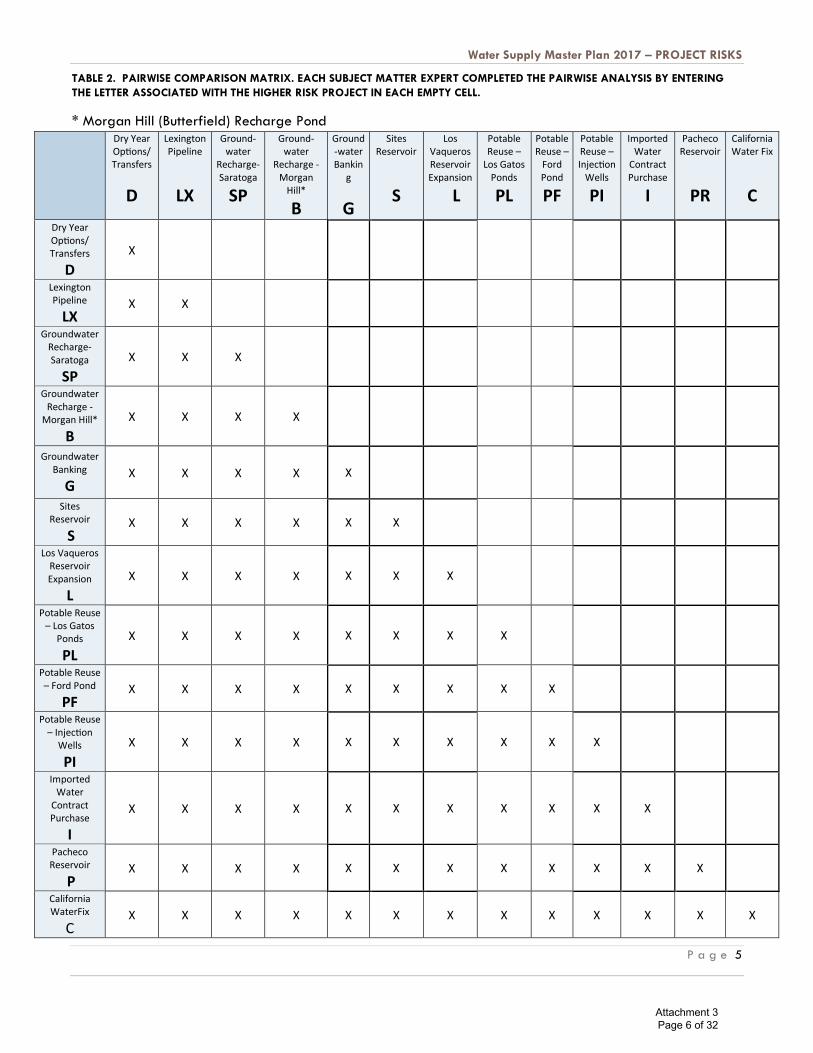
PAIRWISE RISK ANALYSIS A pairwise risk analysis provides a quantitative approach for ranking projects by risk. Having projects ranked by riskiness improves the District Board’s and community’s ability to compare projects’ ability to meet future needs. To complete the risk assessment, the project team assembled five to six subject matter experts from the District into four groups, one group for each risk category. The team chose District experts that had knowledge specific to their assigned risk category. Then, the subject matter experts compared each project against another project using the pairwise matrix in Table 2. The crossed-out boxes represent duplicate comparisons or compare the project against itself. The subject matter experts each determined which of the two projects being compared was a higher risk for the risk category. For example, the first comparison is Morgan Hill (Butterfield) Recharge and Groundwater Banking. If someone determined that Groundwater Banking has more risk, they would enter a “G” for Groundwater Banking
PAIRWISE RISK ANALYSIS BY RISK ELEMENT Tables 3a-d provide the results of the pairings by risk category. Each project is represented by an abbreviation and the numbers indicate how many people chose it as the higher risk. For example, all six participants assessing cost risks thought that Imported Water Contract Purchase was higher risk than Morgan Hill (Butterfield) Recharge, so the associated cell is filled with “I6.” Alternatively, two of the six participants thought Imported Water Rights Purchase (I) was higher risk than Groundwater Banking (G), so the associated cell is filled with “I2 G4.”
Attachment 3 Page 5 of 32
Water Supply Master Plan 2017 – PROJECT RISKS
P a g e 5
TABLE 2. PAIRWISE COMPARISON MATRIX. EACH SUBJECT MATTER EXPERT COMPLETED THE PAIRWISE ANALYSIS BY ENTERING THE LETTER ASSOCIATED WITH THE HIGHER RISK PROJECT IN EACH EMPTY CELL.
* Morgan Hill (Butterfield) Recharge Pond
Dry Year Options/ Transfers
D
Lexington Pipeline
LX
Ground-water
Recharge-Saratoga
SP
Ground-water
Recharge -Morgan
Hill*
B
Ground-water Bankin
g
G
Sites Reservoir
S
Los Vaqueros Reservoir Expansion
L
Potable Reuse –
Los Gatos Ponds
PL
Potable Reuse –
Ford Pond PF
Potable Reuse – Injection
Wells
PI
Imported Water
Contract Purchase
I
Pacheco Reservoir
PR
California Water Fix
C Dry Year Options/ Transfers
D X
Lexington Pipeline
LX X X
Groundwater Recharge- Saratoga
SP X X X
Groundwater Recharge -
Morgan Hill*
B
X X X X
Groundwater Banking
G X X X X X
Sites Reservoir
S X X X X X X
Los Vaqueros Reservoir Expansion
L
X X X X X X X
Potable Reuse – Los Gatos
Ponds
PL X X X X X X X X
Potable Reuse – Ford Pond
PF X X X X X X X X X
Potable Reuse – Injection
Wells
PI
X X X X X X X X X X
Imported Water
Contract Purchase
I
X X X X X X X X X X X
Pacheco Reservoir
P X X X X X X X X X X X X
California WaterFix
C X X X X X X X X X X X X X
Attachment 3 Page 6 of 32

Water Supply Master Plan 2017 – PROJECT RISKS
Page 6
TABLE 3A-D. PAIRWISE COMPARISON RESULTS. THE TABULATED RESULTS FOR THE COST (A), IMPLEMENTATION (B), OPERATION (C), AND STAKEHOLDER (D) PAIRWISE ANALYSIS. EACH LETTER PRESENTS A PROJECT AS SHOWN IN THE HEADER ROW AND COLUMN. THE NUMBER FOLLOWING THE LETTERS IN EACH CELL REPRESENTS THE NUMBER OF EXPERTS WHO THINK THE ASSOCIATED PROJECT IS RISKIER.
a.
COST RISKS
Dry Year Options/ Transfers
D
Lexington Pipeline
LX
Ground-water
Recharge Saratoga
SP
Ground-water
Recharge -Morgan
Hill*
B
Ground-water
Banking
G
Sites Reservoir
S
Los Vaqueros Reservoir Expansion
L
Potable Reuse –
Los Gatos Ponds
PL
Potable Reuse –
Ford Pond
PF
Potable Reuse – Injection
Wells
PI
Imported Water
Contract Purchase
I
Pacheco Reservoir
PR
California WaterFix
C Dry Year Options/ Transfers
D X D2
LX2 D2 SP2
D2 B2
D2 G2
D0 S4
D0 L4
D1 PL3
D1 PF3
D1 PI3
D2 I2
D0 PR4
D0 C4
Lexington Pipeline
LX X X LX3
SP1 LX4 B0
LX1 G3
LX0 S4
LX0 L4
LX0 PL4
LX0 PF4
LX0 PI4
LX2 I2
LX0 PR4
LX0 C4
Groundwater Recharge- Saratoga
SP X X X SP4
B0 SP1 G3
SP0 S4
SP0 L4
SP0 PL4
SP0 PF4
SP0 PI4
SP1 I3
SP0 PR4
SP0 C4
Groundwater Recharge -
Morgan Hill*
B
X X X X B0 G4
B0 S4
B0 L4
B0 PL4
BO PF4
B0 PI4
B0 I4
B0 PR4
B0 C4
Groundwater Banking
G X X X X X G1
S3 G0 L4
G0 PL4
G0 PF4
G0 PI4
G1 I3
G0 PR4
G0 C4
Sites Reservoir
S X X X X X X S3
L1 S3 PL1
S3 PF1
S3 PI1
S3 I1
S0 PR4
S0 C4
Los Vaqueros Reservoir Expansion
L
X X X X X X X L3 PL1
L3 PF1
L3 PI1
L2 I2
L0 PR4
L0 C4
Potable Reuse – Los Gatos
Ponds
PL X X X X X X X X PL1
PF3 PL0 PI4
PL2 I2
PL0 PR4
PL0 C4
Potable Reuse – Ford Pond
PF X X X X X X X X X PF0
PI4 PF2 I2
PF0 PR4
PF0 C4
Potable Reuse – Injection
Wells
PI
X X X X X X X X X X PI2 I2
PI0 PR4
PI0 C4
Imported Water
Contract Purchase
I
X X X X X X X X X X X I0 PR4
I0 C4
Pacheco Reservoir
P X X X X X X X X X X X X PR1
C3
California WaterFix
C X X X X X X X X X X X X X
Attachment 3 Page 7 of 32

Water Supply Master Plan 2017 – PROJECT RISKS
P a g e 7
* Morgan Hill (Butterfield) Recharge Pond
b.
IMPLEMEN- TATION RISKS
Dry Year Options/ Transfers
D
Lexington Pipeline
LX
Ground-water
Recharge-Saratoga
SP
Ground-water
Recharge -Morgan Hill*
B
Ground-water
Banking
G
Sites Reservoir
S
Los Vaqueros Reservoir Expansion
L
Potable Reuse –
Los Gatos Ponds
PL
Potable Reuse –
Ford Pond PF
Potable Reuse – Injection
Wells
PI
Imported Water
Contract Purchase
I
Pacheco Reservoir
PR
California WaterFix
C Dry Year Options/ Transfers
D X D1
LX3 D2 SP2
D3 B1
D4 G0
D0 S4
D0 L4
D1 PL3
D0 PF4
D0 PI4
D4 I0
D0 PR4
D0 C4
Lexington Pipeline
LX X X LX3
SP1 LX3 B1
LX3 G1
LX1 S3
LX1 L3
LX1 PL3
LX1 PF3
LX1 PI3
LX3 I1
LX0 PR4
LX0 C4
Groundwater Recharge- Saratoga
SP X X X SP3
B1 SP2 G2
SP2 S2
SP1 L3
SP1 PL3
SP0 PL4
SP0 PI4
SP3 I1
SP0 PR4
SP0 C4
Groundwater Recharge -
Morgan Hill*
B
X X X X B3 G1
B0 S4
B0 L4
B0 PL4
B0 PF4
B0 PI4
B3 I1
B0 PR4
B0 C4
Groundwater Banking
G X X X X X G0
S4 G0 L4
G0 PL4
G0 PI4
G0 PI4
G3 I1
G0 PR4
B0 C4
Sites Reservoir
S X X X X X X S3
L1 S4
PL0 S3
PF1 S4 PI0
S4 I0
S0 PR4
S0 C4
Los Vaqueros Reservoir Expansion
L
X X X X X X X L3 PL1
L2 PF2
L3 PI1
L4 I0
L1 PR3
L0 C4
Potable Reuse – Los Gatos
Ponds
PL X X X X X X X X PL3
PF1 PL0 PI4
PL4 I0
PL0 PR4
PL0 C4
Potable Reuse – Ford Pond
PF X X X X X X X X X PF1
PI3 PF4 I0
PF0 PR4
PF0 C4
Potable Reuse – Injection
Wells
PI
X X X X X X X X X X PI2 I2
PI0 PR4
PI0 C4
Imported Water
Contract Purchase
I
X X X X X X X X X X X I0 PR4
I0 C4
Pacheco Reservoir
P X X X X X X X X X X X X PR0
C4
California WaterFix
C X X X X X X X X X X X X X
* Morgan Hill (Butterfield) Recharge Pond
Attachment 3 Page 8 of 32

Water Supply Master Plan 2017 – PROJECT RISKS
Page 8
c.
OPERATIONRISKS
Dry Year Options/ Transfers
D
Lexington Pipeline
LX
Ground-water
Recharge-Saratoga
SP
Ground-water
Recharge -Morgan Hill*
B
Ground-water
Banking
G
Sites Reservoir
S
Los Vaqueros Reservoir Expansion
L
Potable Reuse –
Los Gatos Ponds
PL
Potable Reuse –
Ford Pond PF
Potable Reuse – Injection
Wells
PI
Imported Water
Contract Purchase
I
Pacheco Reservoir
PR
California Water Fix
C Dry Year Options/ Transfers
D X D3
LX2 D4 SP1
D4 B1
D3 G2
D0 S5
D2 L3
D3 PL2
D3 PF2
D2 PI3
D4 I1
D1 PR4
D0 C4
Lexington Pipeline
LX X X LX5
SP0 LX5 B0
LX0 G5
LX0 S5
LX0 L5
LX0 PL5
LX0 PF5
LX0 PI5
LX2 I3
LX0 PR5
LX0 C5
Groundwater Recharge- Saratoga
SP X X X SP1
B4 SP0 G5
SP0 S5
SP0 L5
SP0 PL5
SP0 PF5
SP0 PI5
SP0 I5
SP0 PR5
SP0 C5
Groundwater Recharge -
Morgan Hill*
B
X X X X B0 G5
B0 S5
B0 L5
B0 PL5
B0 PF5
B0 PI5
B2 I3
B0 PR5
B0 C5
Groundwater Banking
G X X X X X G0
S5 G0 L5
G3 PL2
G3 PF2
G1 PI4
G2 I3
G0 PR5
G0 C5
Sites Reservoir
S X X X X X X S5
L0 S5
PL0 S5
PF0 S4 PI1
S5 I0
S4 PR1
S0 C5
Los Vaqueros Reservoir Expansion
L
X X X X X X X L5 PL0
L5 PF0
L4 PI1
L5 I0
L5 PR0
L0 C4
Potable Reuse – Los Gatos
Ponds
PL X X X X X X X X PL3
PF2 PL1 PI4
PL3 I2
PL0 PR5
PL0 C5
Potable Reuse – Ford Pond
PF X X X X X X X X X PF0
PI5 PF3 I2
PF0 PR5
PR0 C5
Potable Reuse – Injection Wells
PI X X X X X X X X X X PI4
I1 PI0 PR5
PI0 C5
Imported Water Contract
Purchase
I
X X X X X X X X X X X I0 PR5
I0 C5
Pacheco Reservoir
P X X X X X X X X X X X X PR0
C5
California WaterFix
C X X X X X X X X X X X X X
* Morgan Hill (Butterfield) Recharge Pond
Attachment 3 Page 9 of 32
Water Supply Master Plan 2017 – PROJECT RISKS
P a g e 9
d.
STAKE- HOLDER RISKS
Dry Year Options/ Transfers
D
Lexington Pipeline
LX
Ground-water
Recharge-Saratoga
SP
Ground-water
Recharge -Morgan Hill*
B
Ground-water
Banking
G
Sites Reservoir
S
Los Vaqueros Reservoir Expansion
L
Potable Reuse –
Los Gatos Ponds
PL
Potable Reuse –
Ford Pond PF
Potable Reuse – Injection
Wells
PI
Imported Water
Contract Purchase
I
Pacheco Reservoir
PR
California WaterFix
C Dry Year Options/ Transfers
D X D1
LX2 D1 SP2
D1 B2
D1 G2
D1 S2
D1 L2
D1 PL2
D1 PF2
D1 PI2
D2 I1
D0 PR3
D0 C3
Lexington Pipeline
LX X X LX2
SP1 LX3 B0
LX1 G2
LX0 S3
LX0 L3
LX1 PL2
LX1 PF2
LX1 PI2
LX1 I2
LX0 PR3
LX0 C3
Groundwater Recharge- Saratoga
SP X X X SP3
B0 SP1 G2
SP0 S3
SP0 L3
SP0 PL3
SP0 PF3
SP0 PI3
SPI I2
SP0 PR3
SP0 C3
Groundwater Recharge -
Morgan Hill*
B
X X X X B1 G2
B0 S3
BO L3
B0 PL3
B0 PF3
B0 PI3
B2 I1
B0 PR3
B0 C3
Groundwater Banking
G X X X X X G1
S2 G1 L2
G1 PL2
G1 PF2
G1 PI2
G2 I1
G0 PR3
G0 C3
Sites Reservoir
S X X X X X S3
S0 S2 L1
S2 PL1
S2 PF1
S2 PI1
S2 I1
S0 PR3
S0 C3
Los Vaqueros Reservoir Expansion
L
X X X X X X X L1 PL2
L1 PF2
L1 PI2
L2 I1
L0 PR3
L0 C3
Potable Reuse – Los Gatos
Ponds
PL X X X X X X X X PL1
PF2 PL0 PI3
PL2 I1
Pl0 PR3
PL0 C3
Potable Reuse – Ford Pond
PF X X X X X X X X X PF0
PI3 PF2 I1
PF0 PR3
PF0 C3
Potable Reuse – Injection
Wells
PI
X X X X X X X X X X PI2 I1
PI0 PR3
PI0 C3
Imported Water
Contract Purchase
I
X X X X X X X X X X X I0 PR3
I0 C3
Pacheco Reservoir
P X X X X X X X X X X X X PR0
C3 California WaterFix
C X X X X X X X X X X X X X
* Morgan Hill (Butterfield) Recharge Pond
Attachment 3 Page 10 of 32

Water Supply Master Plan 2017 – PROJECT RISKS
Page 10
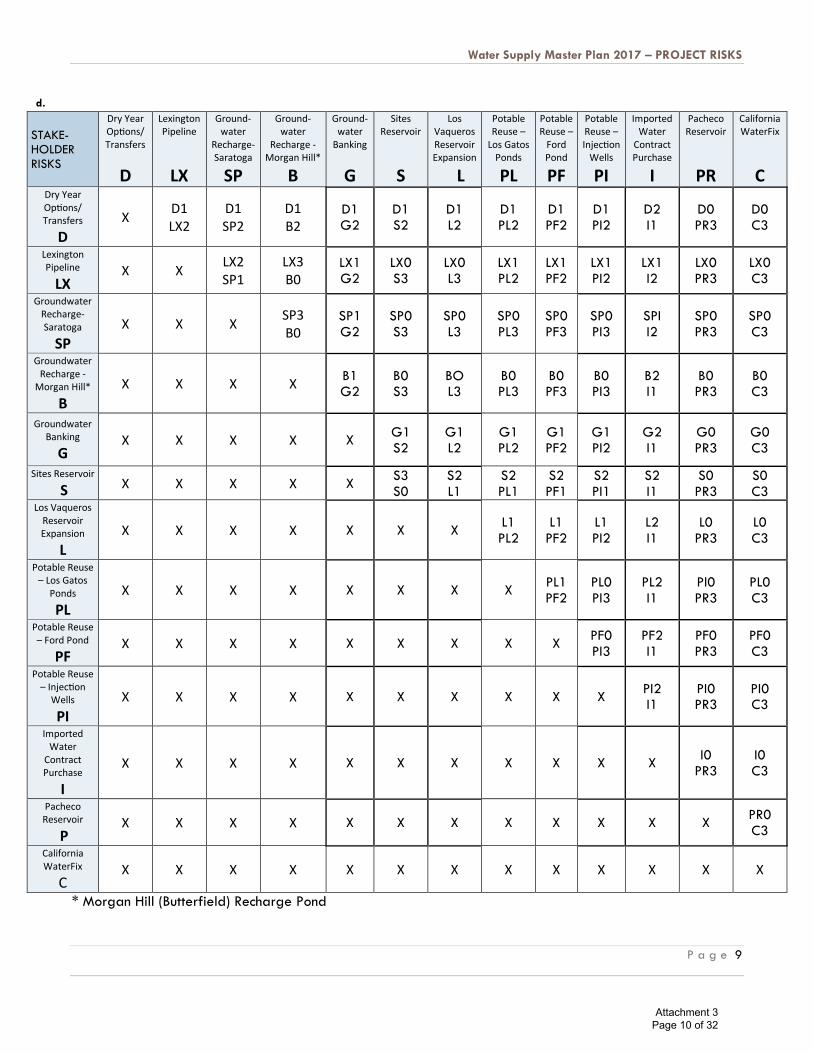
PAIRWISE RANKING RESULTS Table 4 shows the pairwise ranking results. The letter designation represents the riskier project based on the results of the four subject matter expert groups combined. The percentage indicates the amount of agreement between the four groups. 100% indicates that all four risk groups agree the project was riskier. Where 75 percent is indicated, three of four teams ranked it higher risk (where 75%* is noted, the result was three of four, and one tie). Where 66% is indicated, two of three groups agreed and a tie in the fourth group. Finally, 50 percent indicates an even split between the four risk categories. Most the comparisons had agreement among the four categories. TABLE 4. PAIRWISE RANKING RESULTS
* Morgan Hill (Butterfield) Recharge Pond
ALL RISK CATEGORIES
Dry Year Options/ Transfers
D
Lexington Pipeline
LX
Ground-water
Recharge-Saratoga
SP
Ground-water Recharge -
Morgan Hill*
B
Ground-water
Banking
G
Sites Reservoir
S
Los Vaqueros Reservoir Expansion
L
Potable Reuse –
Los Gatos Ponds
PL
Potable Reuse –
Ford Pond PF
Potable Reuse – Injection
Wells
PI
Imported Water
Contract Purchase
I
Pacheco Reservoir
PR
California WaterFix
C Dry Year Options/
Transfers
D X LX
66% D/SP 50%
D/B 50%
D 66%
S 100%
L 100%
PL 75%
PF 75%
PI 100%
D 75%
PR 100%
C 100%
Lexington Pipeline
LX X X LX 100%
LX 100%
G 75%
S 100%
L 100%
PL 100%
PF 100%
PI 100%
I 66%
PR 100%
C 100%
Groundwater Recharge- Saratoga
SP X X X SP
75%* G
75%* S
75%* L
100% PL
100% PF
100% PI
100% I
75% PR
100% C
100%
Groundwater Recharge -
Morgan Hill*
B
X X X X G 75%
S 100%
L 100%
PL 100%
PF 100%
PI 100%
B/I 50%
PR 100%
C 100%
Groundwater Banking
G X X X X X S
100% L
100% PL
75% PF
75% PI
100% G/I 50%
PR 100%
C 100%
Sites Reservoir
S X X X X X X S
100% S
100% S
100% S
100% S
100% PR
75% C
100% Los Vaqueros
Reservoir Expansion
L
X X X X X X X L 75%
L/PF 50%
L 75%
L 75%*
PR 100%
C 100%
Potable Reuse – Los Gatos Ponds
PL X X X X X X X X PL/PF
50% PI
100% PL
75%* PR
100% C
100%
Potable Reuse – Ford Pond
PF X X X X X X X X X PI
100% PF
75%* PR
100% C
100%
Potable Reuse – Injection Wells
PI X X X X X X X X X X PI
50% PR
100% C
100%
Imported Water Contract Purchase
I X X X X X X X X X X X PR
100% C
100%
Pacheco Reservoir
P X X X X X X X X X X X X C
100% California WaterFix
C X X X X X X X X X X X X X
Attachment 3 Page 11 of 32
Water Supply Master Plan 2017 – PROJECT RISKS
P a g e 11
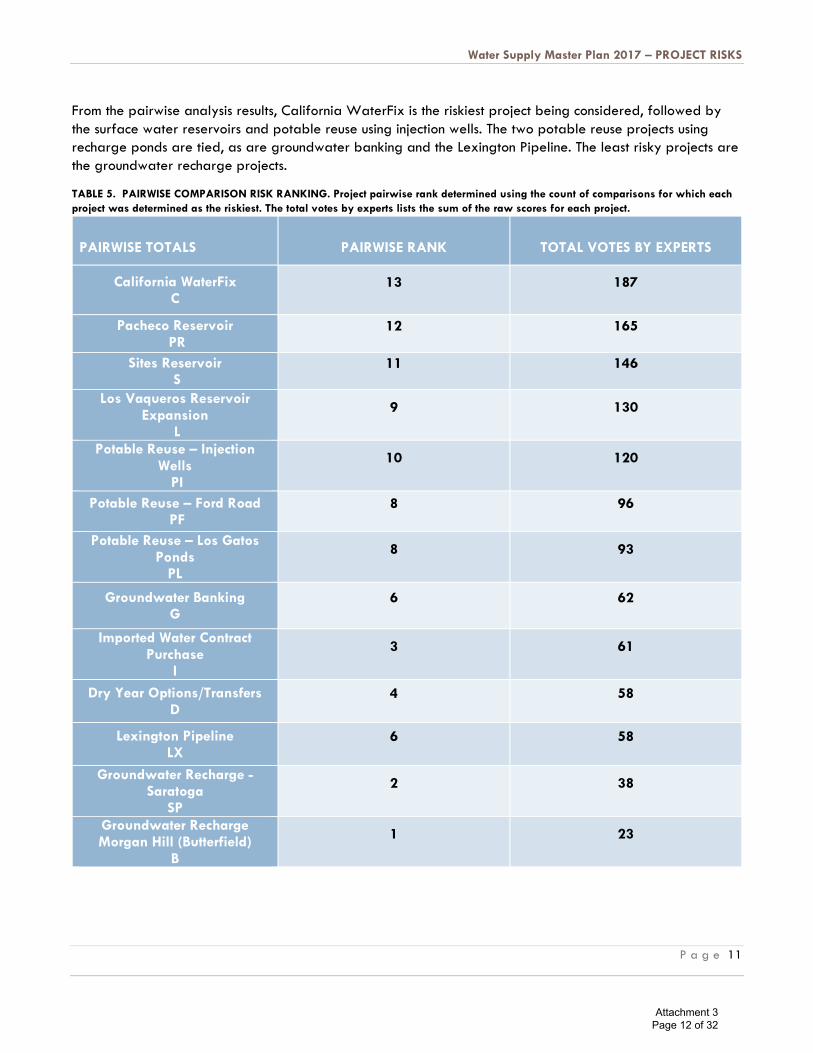
From the pairwise analysis results, California WaterFix is the riskiest project being considered, followed by the surface water reservoirs and potable reuse using injection wells. The two potable reuse projects using recharge ponds are tied, as are groundwater banking and the Lexington Pipeline. The least risky projects are the groundwater recharge projects.
TABLE 5. PAIRWISE COMPARISON RISK RANKING. Project pairwise rank determined using the count of comparisons for which each project was determined as the riskiest. The total votes by experts lists the sum of the raw scores for each project.
PAIRWISE TOTALS PAIRWISE RANK TOTAL VOTES BY EXPERTS
California WaterFix C
13 187
Pacheco Reservoir PR
12 165
Sites Reservoir S
11 146
Los Vaqueros Reservoir Expansion
L
9 130
Potable Reuse – Injection Wells
PI
10 120
Potable Reuse – Ford Road PF
8 96
Potable Reuse – Los Gatos Ponds
PL
8 93
Groundwater Banking G
6 62
Imported Water Contract Purchase
I
3 61
Dry Year Options/Transfers D
4 58
Lexington Pipeline LX
6 58
Groundwater Recharge -Saratoga
SP
2 38
Groundwater Recharge Morgan Hill (Butterfield)
B
1 23
Attachment 3 Page 12 of 32
Water Supply Master Plan 2017 – PROJECT RISKS
Page 12
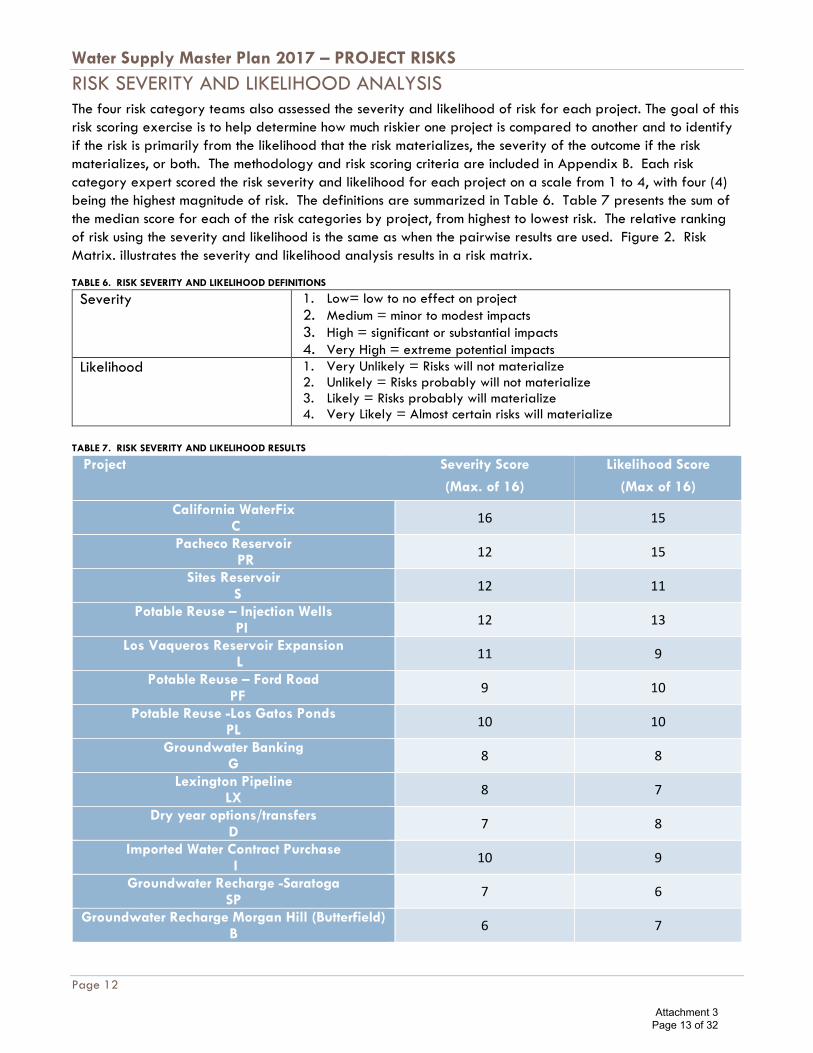
RISK SEVERITY AND LIKELIHOOD ANALYSIS The four risk category teams also assessed the severity and likelihood of risk for each project. The goal of this risk scoring exercise is to help determine how much riskier one project is compared to another and to identify if the risk is primarily from the likelihood that the risk materializes, the severity of the outcome if the risk materializes, or both. The methodology and risk scoring criteria are included in Appendix B. Each risk category expert scored the risk severity and likelihood for each project on a scale from 1 to 4, with four (4) being the highest magnitude of risk. The definitions are summarized in Table 6. Table 7 presents the sum of the median score for each of the risk categories by project, from highest to lowest risk. The relative ranking of risk using the severity and likelihood is the same as when the pairwise results are used. Figure 2. Risk Matrix. illustrates the severity and likelihood analysis results in a risk matrix.
TABLE 6. RISK SEVERITY AND LIKELIHOOD DEFINITIONS
Severity 1. Low= low to no effect on project 2. Medium = minor to modest impacts 3. High = significant or substantial impacts 4. Very High = extreme potential impacts
Likelihood 1. Very Unlikely = Risks will not materialize 2. Unlikely = Risks probably will not materialize 3. Likely = Risks probably will materialize 4. Very Likely = Almost certain risks will materialize
TABLE 7. RISK SEVERITY AND LIKELIHOOD RESULTS
Project Severity Score
(Max. of 16)
Likelihood Score
(Max of 16)
California WaterFix C 16 15
Pacheco Reservoir PR 12 15
Sites Reservoir S 12 11
Potable Reuse – Injection Wells PI 12 13
Los Vaqueros Reservoir Expansion L 11 9
Potable Reuse – Ford Road PF 9 10
Potable Reuse -Los Gatos Ponds PL 10 10
Groundwater Banking G 8 8
Lexington Pipeline LX 8 7
Dry year options/transfers D 7 8
Imported Water Contract Purchase I 10 9
Groundwater Recharge -Saratoga SP 7 6
Groundwater Recharge Morgan Hill (Butterfield) B 6 7
Attachment 3 Page 13 of 32

Water Supply Master Plan 2017 – PROJECT RISKS
P a g e 13
FIGURE 2. RISK MATRIX. LIKELIHOOD OF PROJECT IMPACT INCREASES UPWARD ALONG THE VERTICAL AXIS AND SEVERITY INCREASES ALONG THE HORIZONTAL AXIS. SEE TABLE 9 FOR THE RAW DATA USED TO DEVELOP THIS FIGURE.
Attachment 3 Page 14 of 32

Water Supply Master Plan 2017 – PROJECT RISKS
Page 14
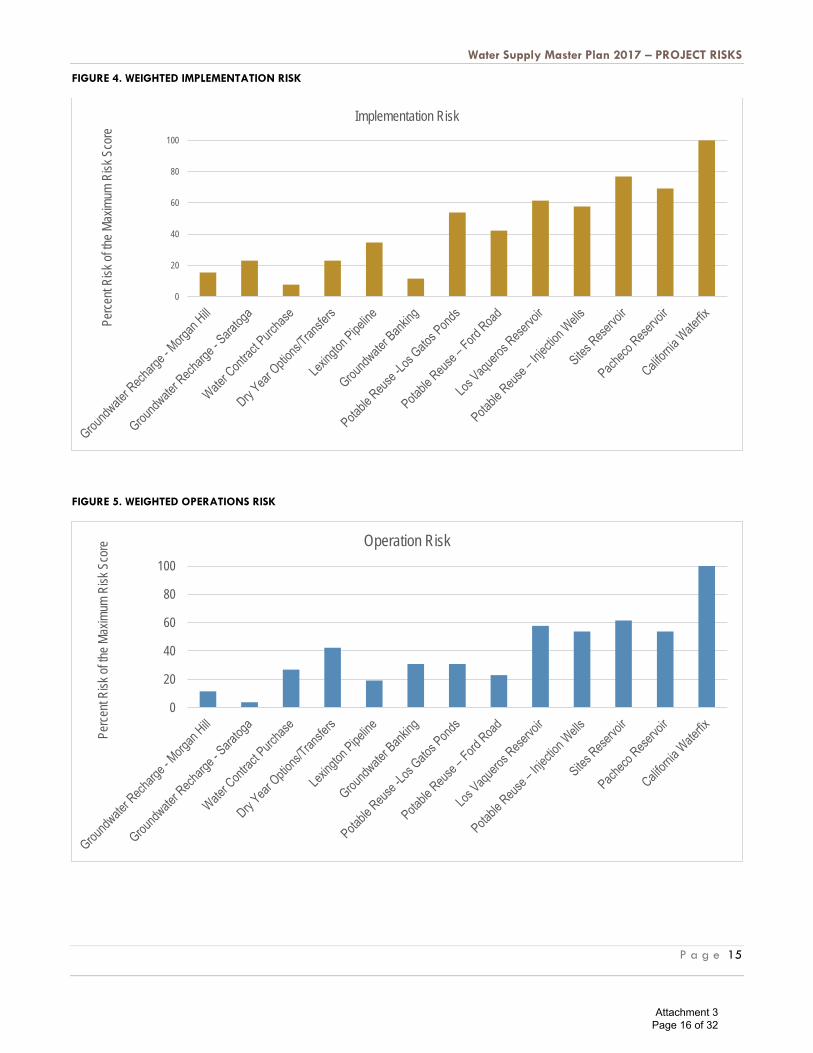
TOTAL PROJECT RISK CALCULATION Staff calculated the total project risk for each category by weighting the pairwise ranking by the severity and likelihood (equation 1).
𝑅𝑅𝑅𝑅𝑅𝑅𝑅𝑅𝑐𝑐𝑐𝑐𝑐𝑐𝑐𝑐𝑐𝑐𝑐𝑐𝑐𝑐𝑐𝑐 = (1 +𝑆𝑆𝑆𝑆𝑆𝑆𝑆𝑆𝑆𝑆𝑅𝑅𝑆𝑆𝑆𝑆 + 𝐿𝐿𝑅𝑅𝑅𝑅𝑆𝑆𝐿𝐿𝑅𝑅ℎ𝑜𝑜𝑜𝑜𝑜𝑜
8 ) × 𝑃𝑃𝑃𝑃𝑅𝑅𝑆𝑆𝑃𝑃𝑅𝑅𝑅𝑅𝑆𝑆 𝑅𝑅𝑃𝑃𝑅𝑅𝑅𝑅𝑅𝑅𝑅𝑅𝑅𝑅
The severity and likelihood score is divided by eight (the maximum possible combined score) to represent severity and likelihood as a portion of the maximum possible combined score. This proportion is then added to one (1) so that the pairwise analysis remains the primary driver of the order of risk, and then the severity and likelihood is a multiplicative factor that acts on the risk ranking. If the severity and likelihood is significant, it will substantially increase the total risk score. If the severity and likelihood score are small, there will be little impact on the total risk score. Alternatively, not adding one (1) to the severity and likelihood proportion would result in the severity and likelihood decreasing the ranking number unless the severity and likelihood proportion equals one. Then the risk score was normalized by dividing by the maximum possible score and multiplying by 100 to convert to a percentage value. The project risks for each category are in Figures 3 through 6. The combined total project risk is in Figure 7.
FIGURE 3. WEIGHTED COST RISK
0
20
40
60
80
100
Perce
nt Ri
sk o
f the M
axim
um R
isk S
core
Cost Risk
Equation 1
Attachment 3 Page 15 of 32
Water Supply Master Plan 2017 – PROJECT RISKS
P a g e 15
FIGURE 4. WEIGHTED IMPLEMENTATION RISK
FIGURE 5. WEIGHTED OPERATIONS RISK
0
20
40
60
80
100
Perce
nt Ri
sk o
f the M
axim
um R
isk S
core
Implementation Risk
0
20
40
60
80
100
Perce
nt Ri
sk o
f the M
axim
um R
isk S
core Operation Risk
Attachment 3 Page 16 of 32

Water Supply Master Plan 2017 – PROJECT RISKS
Page 16
FIGURE 6. WEIGHTED STAKEHOLDER RISK
FIGURE 7. TOTAL WEIGHTED PROJECT RISK
0
20
40
60
80
100
Perce
nt Ri
sk o
f the M
axim
um R
isk S
core
Stakeholder Risk
0
20
40
60
80
100
Perce
nt of
the M
axim
um R
isk S
core
Total Risk
Stakeholder Implementation Operations Cost
Attachment 3 Page 17 of 32

Water Supply Master Plan 2017 – PROJECT RISKS
P a g e 17
PROJECT RISK SUMMARY AND CONCLUSIONS California WaterFix and the three surface water reservoirs (Pacheco, Sites, and Los Vaqueros) are among the highest risk projects based on this analysis. California WaterFix and Sites Reservoir risk is distributed relatively evenly among the four categories, while Pacheco has more cost risk and Los Vaqueros has less stakeholders risk compared to the other risk categories.
Uncertainties related to future regulatory requirements for the California WaterFix may affect project operations and impact water supply yields. Although significant contingencies have been included in the cost estimates, there could be cost overruns due to the size and complexity of the construction project. Additionally, opposition from vocal stakeholders and potential legal challenges could lead to schedule delays and changes in proposed operations that impact the project’s water supply benefit.
Sites Reservoir would depend on Sacramento River flows and Pacheco Reservoir would store Delta-conveyed supplies (along with local water), causing uncertainty in the amount of water that either reservoir will supply. Future environmental regulations and hydrologic changes could significantly affect the modeled yields from the reservoirs. In addition, both reservoirs will likely have significant environmental mitigation requirements that could further reduce the water supply and increase the project costs.
In contrast to Sites, California WaterFix, and Los Vaqueros, the risk analysis results suggest that the Pacheco Reservoir cost-related risk is more significant than the stakeholders, implementation, and operations risks. The cost risks are based on concerns that Pacheco partners have less financial resources and the project has less secure funding sources compared to Sites, California WaterFix, or Los Vaqueros. In addition, the cost estimate for construction and operations/maintenance could increase considerably since the project is in the early phases of planning.
The analysis shows that Los Vaqueros Reservoir has a relatively low risk compared to the other reservoir proposals and California WaterFix, with 12 percent less total risk than the next riskiest reservoir (Sites Reservoir). Risk experts from each of the risk categories commented that Los Vaqueros has been expanded before with little opposition, on time, and on budget. In addition, experts from the costs group noted that there are several potential cost-sharing partners that are financially reliable. There are potential implementation and operation complexities due to the large number of partners.
The analysis also shows that potable reuse using injection wells is riskier than potable reuse using recharge ponds. Injection wells are a relatively new technology compared to recharge ponds and recharge pond operations, maintenance, and costs are better understood. However, experts were concerned that Ford Ponds will require decommissioning several retailer wells, potentially being a stakeholder acceptance and project implementation issue. General potable reuse concerns included public acceptance, poor cost estimates for advanced purification systems, and unknown regulatory requirements. However, experts thought it is less risky than reservoirs or California WaterFix because the water will be a drought-proof, reliable, local supply and that the current socio-political environmental surrounding potable reuse as a water supply will help improve public perception.
Groundwater banking and Lexington Pipeline both had the same amount of total risk. However, compared to Lexington Pipeline, groundwater banking had higher cost and operations risks and lower implementation risks. Since the District already participates in groundwater banking with Semitropic Water Storage District (Semitropic), stakeholders are familiar banking and the associated costs risks. In addition, implementation risks and operations risks are like those with Semitropic in that there needs to be exchange capacity in dry years and the storage is not in-county. While those risks exist, they are relatively small compared to other projects
Attachment 3 Page 18 of 32
Water Supply Master Plan 2017 – PROJECT RISKS
Page 18
since the District has experience planning for and mitigating those risks. However, the new potential banking partners will need to build infrastructure to be able to bank District water.
In contrast to groundwater banking, most of the risk associated with Lexington Pipeline is implementation risk. The implementation concern is the ability to build the pipeline through urban areas and potentially complex geologies. Since the pipeline would be locally maintained and operated, there are less operational and cost-related risks. The main cost risk associated with Lexington Pipeline is the construction cost. In contrast, the District would not control the groundwater banking operations and costs would be a recurrent negotiation.
Imported water contract purchase and dry year transfer risks are primarily associated with cost and operation. The contract purchase option is a permanent transfer of SWP Table A contractual water supplies, which are subject to the same regulatory restrictions and delivery uncertainties as our current imported water supplies. In addition, the SWP South Bay Aqueduct has conveyance limits that could make it difficult to receive additional Table A contract water during higher allocation years. In contrast, dry year transfers can only be delivered during specific months. However, if dry year transfers are available, there is little risk that the District will not receive the purchased transfer water. Imported water contract purchase and dry year transfer are both lower risk relative to most other projects since neither require construction, reducing their implementation and cost risks. However, stakeholder experts suggested that it may have poor optics to buy more Table A water when we already do not receive 100 percent of our contract allotment and that it may be difficult to find someone interested in selling their Table A water contract. Similarly, dry year transfers may not be available for purchase when needed.
The Morgan Hill (Butterfield) recharge channel and Saratoga recharge pond were the lowest risk projects because they are less costly than other projects, are local, and the District has successfully completed similar projects. Morgan Hill (Butterfield) recharge channel is currently owned by Morgan Hill and actively used for stormwater conveyance during the winter. To use the channel for recharge as planned, the District will need to coordinate operations with Morgan Hill and extend the District’s Madrone Pipeline to the channel. The chief concern with Saratoga recharge pond is identifying and purchasing a suitable property for recharge.
In general, the lowest risk projects are those that are locally controlled or similar to already completed projects. Imported water rights purchase, dry year transfer, and groundwater banking are current practices, so the District is prepared for the uncertainties associated with those projects. Similarly, Morgan Hill (Butterfield) recharge channel is similar to the Madrone recharge channel and is locally controlled. Potable reuse is the newest technology the District is considering, but the facilities are locally controlled and the District is currently testing potable reuse to confirm its operational capabilities. Experts did find potable reuse with recharge ponds to be lower risk than potable reuse with injection wells. The District has experience managing recharge ponds, consistent with the conclusion that lower risk projects are those that are most similar to existing District projects. Projects that require substantial construction and cost-sharing are higher risk, such as California WaterFix and the Pacheco, Sites, and Los Vaqueros Reservoirs.
This risk assessment helps provide the Board of Directors and external stakeholders more thorough understanding of each proposed project. Understanding project risks and how these risks may materialize can help determine which projects to invest in and what project-related issues to prepare for in the future as project development proceeds.
Attachment 3 Page 19 of 32

Appendix A Page 1 of 6
Appendix A: Project and Program Descriptions (as of September 2017)
Project Pros Cons
Average Annual Yield
(AFY)1
Present Value
Cost to District (2017)
Cost/AF
California WaterFix: Constructs two 40-foot diameter tunnels at least 100 feet below ground surface capable of diverting up to 9,000 cubic feet-per-second from the Sacramento River and delivering it to the federal and state pumps. Alternative to conveying water all Central Valley Project and State Water Project supplies through the Delta. Would require environmental flow and water quality criteria be met.
• Secures existing Delta-conveyed supplies
• Upgrades aging infrastructure
• Protects the environment through less impactful diversions
• Improves reliability of other Delta-conveyed supplies and transfers
• Protects water quality
• Implementation complexity • Long-term operational
uncertainty • Stakeholder opposition • Financing uncertainty
41,000 $620 million $600
Dry Year Options / Transfers: Provides 12,000 AF of State Water Project transfer water during critical dry years. Amount can be increased or decreased. Can also include long-term option agreements.
• Provides supply in critical years when needs are greatest
• Allows for phasing • Can implement in larger
increments • Complements all other
projects
• Subject to Delta-restrictions • Increases reliance on Delta • Cost volatility • Uncertainty with willing
sellers
2,000 $100 million $1,400
1 The average annual yield of many projects depends on which projects they are combined and the scenario being analyzed. For example, groundwater banking yields is higher in portfolios that include wet year supplies. Similarly, they would be lower in scenarios where demands exceed supplies and excess water is unavailable for banking.
Attachment 3 Page 20 of 32

Appendix A Page 2 of 6
Project Pros Cons
Average Annual Yield
(AFY)1
Present Value
Cost to District (2017)
Cost/AF
Groundwater Banking: Provides 120,000 AF of banking capacity for Central Valley Project and State Water Project contract water. Sends excess water to a groundwater bank south of the Delta during wet years and times of surplus for use during dry years and times of need. Annual put and take capacities of 30,000 AFY. Project more effective in portfolios that include new supplies.
• Significantly reduces drought shortages when paired with projects with all-year supply
• Allows for phasing
• Subject to Delta restrictions • Uncertainty with Sustainable
Groundwater Management Act implementation
2,000 $170 million $3,900
Groundwater Recharge – Morgan Hill Recharge: Extends the Madrone Pipeline from Madrone Channel to Morgan Hill’s Butterfield Channel and Pond near Main Street. Would need to be operated in conjunction with the City’s stormwater operations.
• Optimizes the use of existing supplies
• Conjunctive use strategy • Helps drought recovery • Local project
• Minimal impact on drought shortages
• North County locations limited
• Potential siting conflicts with existing land uses
2,000 $20 million $400
Groundwater Recharge – Saratoga: Constructs a new groundwater recharge facility in the West Valley, near the Stevens Creek pipeline.
1,000 $50 million $1,300
Attachment 3 Page 21 of 32

Appendix A Page 3 of 6
Project Pros Cons
Average Annual Yield
(AFY)1
Present Value
Cost to District (2017)
Cost/AF
Lexington Pipeline: Constructs a pipeline between Lexington Reservoir and the raw water system to provide greater flexibility in using local water supplies. The pipeline would allow surface water from Lexington Reservoir to be put to beneficial use elsewhere in the county, especially when combined with the Los Gatos Ponds Potable Reuse project which would utilize the capacity of the Los Gatos recharge ponds where most water from Lexington Reservoir is currently sent. In addition, the pipeline will enable the District to capture some wet-weather flows that would otherwise flow to the Bay.
• Optimizes the use of existing local supplies
• Increases local flexibility • Complements potable reuse
• Water quality issues will require pre-treatment/management
• Minimal reduction in drought shortages
3,000 $90 million $1,000
Attachment 3 Page 22 of 32
Appendix A Page 4 of 6
Project Pros Cons
Average Annual Yield
(AFY)1
Present Value
Cost to District (2017)
Cost/AF
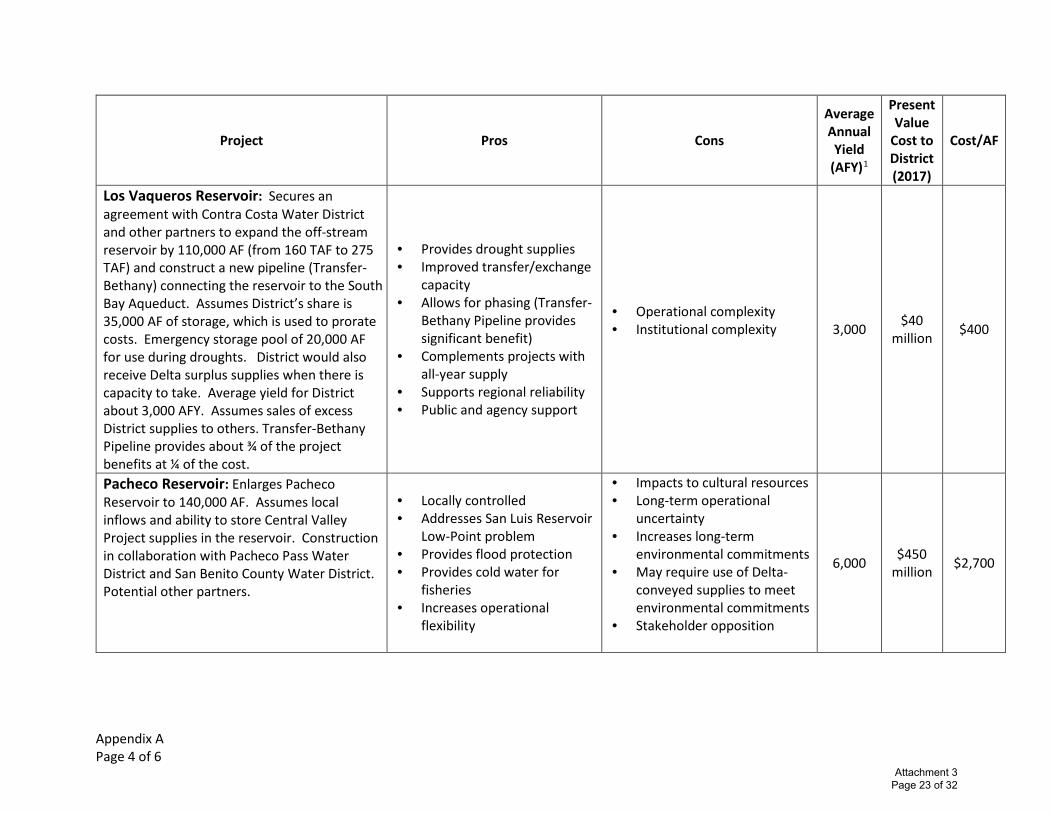
Los Vaqueros Reservoir: Secures an agreement with Contra Costa Water District and other partners to expand the off-stream reservoir by 110,000 AF (from 160 TAF to 275 TAF) and construct a new pipeline (Transfer-Bethany) connecting the reservoir to the South Bay Aqueduct. Assumes District’s share is 35,000 AF of storage, which is used to prorate costs. Emergency storage pool of 20,000 AF for use during droughts. District would also receive Delta surplus supplies when there is capacity to take. Average yield for District about 3,000 AFY. Assumes sales of excess District supplies to others. Transfer-Bethany Pipeline provides about ¾ of the project benefits at ¼ of the cost.
• Provides drought supplies • Improved transfer/exchange
capacity • Allows for phasing (Transfer-
Bethany Pipeline provides significant benefit)
• Complements projects with all-year supply
• Supports regional reliability • Public and agency support
• Operational complexity • Institutional complexity
3,000 $40
million $400
Pacheco Reservoir: Enlarges Pacheco Reservoir to 140,000 AF. Assumes local inflows and ability to store Central Valley Project supplies in the reservoir. Construction in collaboration with Pacheco Pass Water District and San Benito County Water District. Potential other partners.
• Locally controlled • Addresses San Luis Reservoir
Low-Point problem • Provides flood protection • Provides cold water for
fisheries • Increases operational
flexibility
• Impacts to cultural resources • Long-term operational
uncertainty • Increases long-term
environmental commitments • May require use of Delta-
conveyed supplies to meet environmental commitments
• Stakeholder opposition
6,000 $450 million $2,700
Attachment 3 Page 23 of 32

Appendix A Page 5 of 6
Project Pros Cons
Average Annual Yield
(AFY)1
Present Value
Cost to District (2017)
Cost/AF
Potable Reuse – Ford Pond: Constructs potable reuse facilities for 5,000 AFY of groundwater recharge capacity at/near Ford Ponds.
• Local supply • Not subject to short or long
term climate variability • Allows for phasing
• Reverse osmosis concentrate management for injections wells and Los Gatos Ponds projects
• Uncertainty with agreements with San Jose
• Injection well operations complex
• Potential public perception concerns
3,000 $190 million $2,500
Potable Reuse – Injection Wells: Constructs (or expands in conjunction with the Los Gatos Ponds project) potable reuse facilities for 5,000 to 15,000 AFY of groundwater injection capacity.
5,000 – 15,000
$290 million - $860 million
$2,000
Potable Reuse -Los Gatos Ponds: Constructs facility to purify water treated at wastewater treatment plants for groundwater recharge. Potable reuse water is a high-quality, local drought-proof supply that is resistant to climate change impacts. Assumes 24,000 AFY of advanced treated recycled water would be available for groundwater recharge at existing recharge ponds in the Los Gatos Recharge System.
19,000 $990 million $1,700
Attachment 3 Page 24 of 32

Appendix A Page 6 of 6
Project Pros Cons
Average Annual Yield
(AFY)1
Present Value
Cost to District (2017)
Cost/AF
Sites Reservoir: Establishes an agreement with the Sites JPA to build an off-stream reservoir (up to 1.8 MAF) north of the Delta that would collect flood flows from the Sacramento River and release them to meet water supply and environmental objectives. Assumes District’s share is 24,000 AF of storage, which is used to prorate yields from the project. The project would be operated in conjunction with the SWP and CVP. In some years, District would receive less Delta-conveyed supply with the project than without the project.
• Off-stream reservoir • Improves operational
flexibility of Statewide water system
• Increases reliance on the Delta
• Subject to Delta risks • Long-term operational
uncertainty • Operational complexity • Institutional complexity
8,000 $170 million $800
Water Contract Purchase: Purchase 20,000 AF of SWP Table A contract supply from other SWP agencies.
• Provides all year supply
• Increases reliance on the Delta
• Subject to Delta risks • Willing sellers’ availability
12,000 $360 million $800
Attachment 3 Page 25 of 32

APPENDIX B. WSMP 2017 PROJECT RISK ANALYSIS METHODOLOGY
CONTENTS
Background: ................................................................................................................................................................... 1
Risk Categories............................................................................................................................................................... 1
WSMP Project RIsk Assessment .................................................................................................................................... 3
Risk Scoring Methodology ......................................................................................................................................... 4
TOTAL PROJECT RISK CALCULATION ...................................................................................................................... 6
CONCLUSION ................................................................................................................................................................. 6
The following staff participating in the risk analysis:
Aaron Baker
Afshin Rouhani
Charlene Sun
Cris Tulloch
Dana Jacobson
Darin Taylor
Debra Butler
Debra Caldon
Erin Baker
Jerry De La Piedra
Jose Villarreal
Karen Uyeda
Lei Hong
Luisa Sangines
Marty Grimes
Paul Randhawa
Samantha Green
Tracy Hemmeter
Vanessa De La Piedra
Attachment 3 Page 26 of 32

Page | 1
BACKGROUND:
At the expert panel meeting on June 8, 2017, a panel member suggested that the Water Supply Planning team conduct a risk assessment on the projects being considered as part of the WSMP. A participant at the expert panel meeting suggested using a Paired Comparison Analysis. The WSMP project team and expert panel brainstormed elements of project risk, which the technical team then used to create risk categories that encompassed the risk elements. After the meeting, the project team identified internal subject matter experts for each risk category to participate in the paired comparison risk assessment. The project team then decided to combine the paired comparison risk analysis with a traditional risk ranking (severity and likelihood) to better understand the relative magnitude of each risk. This provides a detailed explanation of the methodology employed. The results and conclusions are presented in the September 8, 2017, WSMP 2017 – PROJECT RISKS: Results of Pairwise and Traditional Risk Analyses.
RISK CATEGORIES
The WSMP project team reviewed the risk elements brainstormed during the expert panel meeting and grouped them into four risk categories: stakeholder, implementation, operations, and cost (Table 1). The risk categories reflect the different stages of a project where risk can occur. Each project requires approval or support from a diverse set of stakeholders, ranging from the public to the Board of Directors. This may be needed only at the beginning of a project, or throughout as is the case with regulatory approval. Once a project is supported by stakeholders, the project enters the planning/implementation phase. Implementation risks capture risks that occur during planning, design, permitting, and construction. The cost risk category encompasses elements of uncertainty associated with the initial cost estimates through the uncertainty associated with recurring operations and maintenance costs during the project’s lifespan. Once the project is implemented, issues associated with project operations will need to be addressed throughout the lifespan of the project. An example of a potential recurring operations issue is the need to re-operate as environmental regulations or climate changes.
Once the project team determined the risk categories, they reviewed risk management references to ensure they were presenting a comprehensive assessment of risk. During the literature review, the technical team found a risk category structure named POET that is analogous to their risk categorization (TRW, Inc.). POET categories include political, operational, economic, and technical, and is used to assess challenges and opportunities associated with programs, customer challenges, and strategies, regardless of the size and complexity.
• Political: Assess and articulate associated leadership, mission/business decision drivers, organizational strengths/weaknesses, policies, governance, expectation management (e.g., stakeholder relationship), program management approach, etc.
• Operational: Obtain and evaluate mission capabilities, requirements management, operational utility, operational constraints, supporting infrastructure and processes, interoperability, supportability, etc.
• Economic: Review capital planning and investment management capabilities, and assess the maturity level of the associated processes of budgeting, cost analysis, program structure, acquisition, etc.
• Technical: Assess and determine the adequacy of planned scope/scale, technical maturity/obsolescence, policy/standards implementation, technical approach, etc.
The risk categories determined by the project team have slightly different names than the POET categories, but they cover very similar content.
Attachment 3 Page 27 of 32

Page | 2
Table 1: Risk Category and Risk Elements.
Risk Category Risks Costs • Capital costs, including quality of cost estimate
• Costs of regulatory compliance • Match requirements and cost-sharing • Counter-party risk • Stakeholders and rate payer perspective and ability to pay • Financing and funding security • Scheduling issues • Economic fluctuations and instability • Stranded assets
Implementation • Phasing potential • Required time table • Reoperation requirements • Land availability • Constructability (e.g., structural issues, technology) • Managerial capacity (knowledge and resource availability) • Range of implementation options • Regulatory requirements • Project planning maturity
Operations • Climate change • Yield variability and reliability • Operating Partnerships • Uncertainty of long-term operations and maintenance costs • Project inter-dependency • Environmental and water quality regulations • Control • Appropriate infrastructure • Redundancy • Emergency operations/asset failures
Stakeholders • Public support • Permitting risks • Media • Internal stakeholder concerns • External stakeholder opposition • Environmental/special interest groups • Partnership risks • Government stakeholders • Costs
Attachment 3 Page 28 of 32
Page | 3
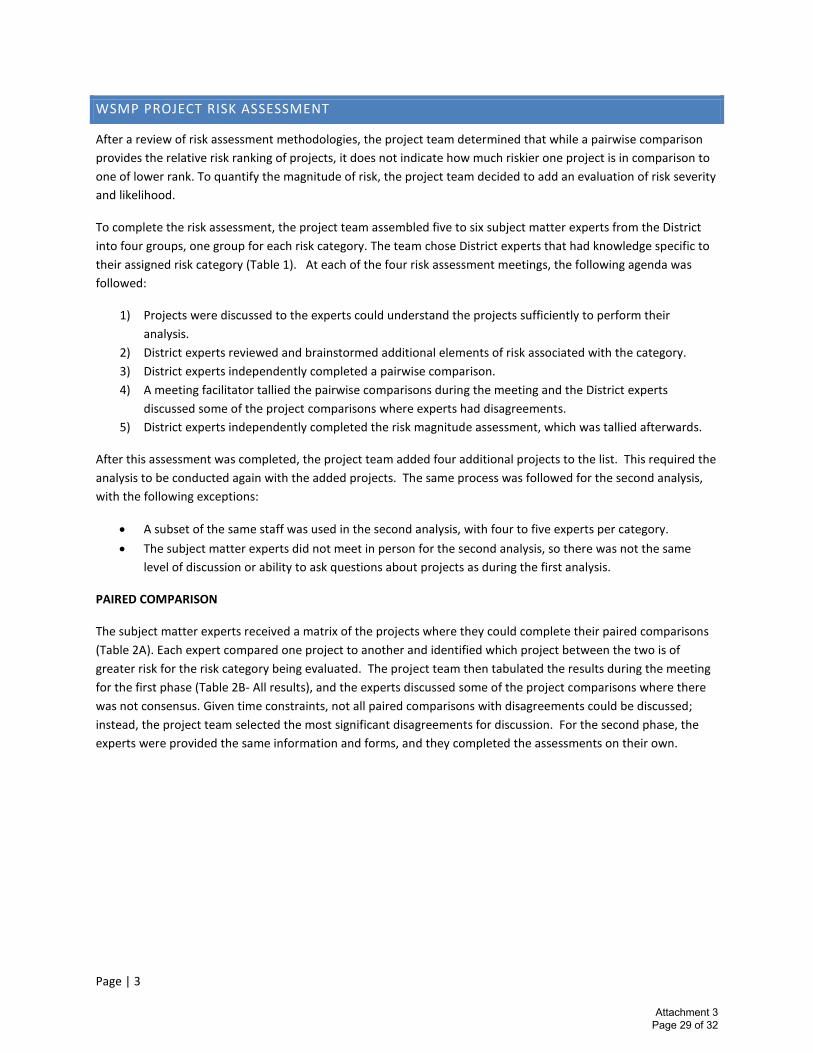
WSMP PROJECT RISK ASSESSMENT
After a review of risk assessment methodologies, the project team determined that while a pairwise comparison provides the relative risk ranking of projects, it does not indicate how much riskier one project is in comparison to one of lower rank. To quantify the magnitude of risk, the project team decided to add an evaluation of risk severity and likelihood.
To complete the risk assessment, the project team assembled five to six subject matter experts from the District into four groups, one group for each risk category. The team chose District experts that had knowledge specific to their assigned risk category (Table 1). At each of the four risk assessment meetings, the following agenda was followed:
1) Projects were discussed to the experts could understand the projects sufficiently to perform their analysis.
2) District experts reviewed and brainstormed additional elements of risk associated with the category. 3) District experts independently completed a pairwise comparison. 4) A meeting facilitator tallied the pairwise comparisons during the meeting and the District experts
discussed some of the project comparisons where experts had disagreements. 5) District experts independently completed the risk magnitude assessment, which was tallied afterwards.
After this assessment was completed, the project team added four additional projects to the list. This required the analysis to be conducted again with the added projects. The same process was followed for the second analysis, with the following exceptions:
• A subset of the same staff was used in the second analysis, with four to five experts per category. • The subject matter experts did not meet in person for the second analysis, so there was not the same
level of discussion or ability to ask questions about projects as during the first analysis.
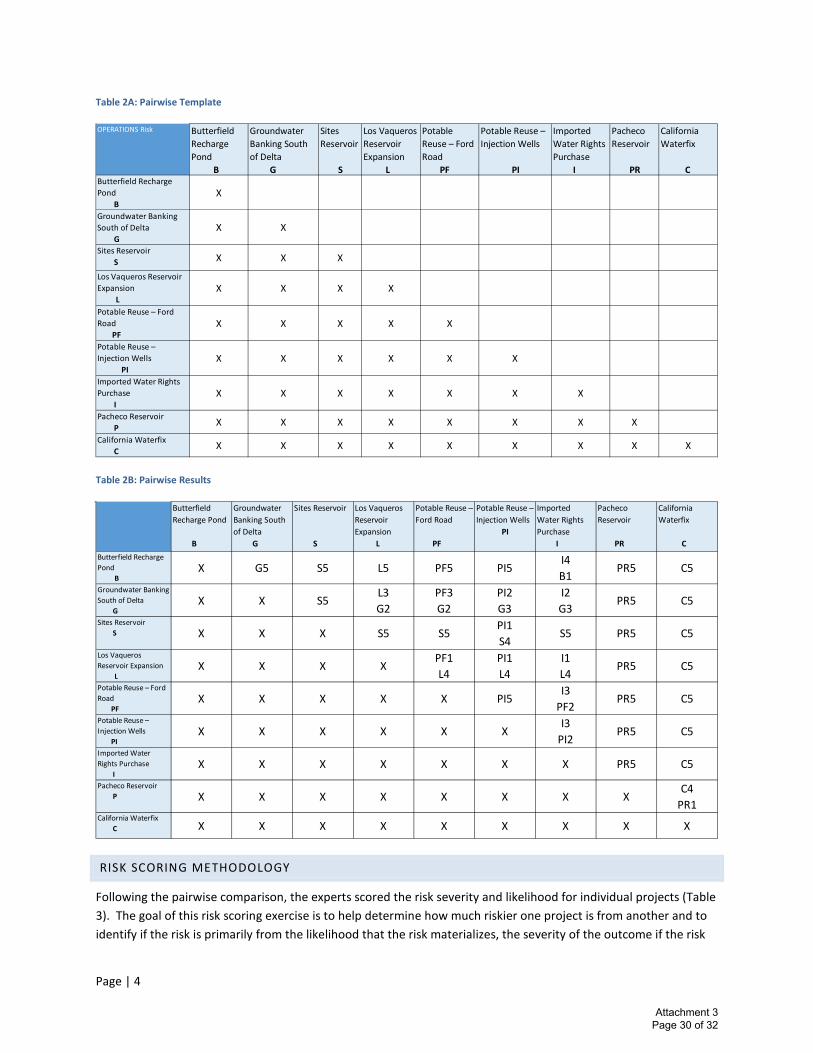
PAIRED COMPARISON
The subject matter experts received a matrix of the projects where they could complete their paired comparisons (Table 2A). Each expert compared one project to another and identified which project between the two is of greater risk for the risk category being evaluated. The project team then tabulated the results during the meeting for the first phase (Table 2B- All results), and the experts discussed some of the project comparisons where there was not consensus. Given time constraints, not all paired comparisons with disagreements could be discussed; instead, the project team selected the most significant disagreements for discussion. For the second phase, the experts were provided the same information and forms, and they completed the assessments on their own.
Attachment 3 Page 29 of 32
Page | 4
Table 2A: Pairwise Template
Table 2B: Pairwise Results
RISK SCORING METHODOLOGY
Following the pairwise comparison, the experts scored the risk severity and likelihood for individual projects (Table 3). The goal of this risk scoring exercise is to help determine how much riskier one project is from another and to identify if the risk is primarily from the likelihood that the risk materializes, the severity of the outcome if the risk
OPERATIONS Risk Butterfield Recharge Pond B
Groundwater Banking South of Delta G
Sites Reservoir S
Los Vaqueros Reservoir Expansion L
Potable Reuse – Ford Road PF
Potable Reuse – Injection Wells PI
Imported Water Rights Purchase I
Pacheco Reservoir PR
California Waterfix
CButterfield Recharge Pond B
X
Groundwater Banking South of Delta G
X X
Sites Reservoir S X X X
Los Vaqueros Reservoir Expansion L
X X X X
Potable Reuse – Ford Road PF
X X X X X
Potable Reuse – Injection Wells PI
X X X X X X
Imported Water Rights Purchase I
X X X X X X X
Pacheco Reservoir P X X X X X X X X
California Waterfix C X X X X X X X X X
Butterfield Recharge Pond B
Groundwater Banking South of Delta G
Sites Reservoir
S
Los Vaqueros Reservoir Expansion L
Potable Reuse – Ford Road
PF
Potable Reuse – Injection Wells PI
Imported Water Rights Purchase I
Pacheco Reservoir PR
California Waterfix
CButterfield Recharge Pond B
X G5 S5 L5 PF5 PI5I4B1
PR5 C5
Groundwater Banking South of Delta G
X X S5L3G2
PF3G2
PI2G3
I2G3
PR5 C5
Sites Reservoir S X X X S5 S5
PI1S4
S5 PR5 C5
Los Vaqueros Reservoir Expansion L
X X X XPF1L4
PI1L4
I1L4
PR5 C5
Potable Reuse – Ford Road PF
X X X X X PI5I3
PF2PR5 C5
Potable Reuse – Injection Wells PI
X X X X X XI3
PI2PR5 C5
Imported Water Rights Purchase I
X X X X X X X PR5 C5
Pacheco Reservoir P X X X X X X X X
C4PR1
California Waterfix C X X X X X X X X X
Attachment 3 Page 30 of 32

Page | 5
did materialize, or both. For example, it is unlikely that an earthquake would destroy a dam, but if it did, the results could be catastrophic for life and property (low likelihood, high severity). However, when completing this exercise, experts considered all the risk elements discussed during the pairwise comparison activity to determine one project risk rating for severity and one for likelihood. The ranking criteria for each risk category is explained in detail in the next section.
Table 3: Risk Scoring Template
Severity of Implementation Risk Impact 1-4, 1 - Low Severity 4 - High severity
Likelihood of Implementation Risk Impact 1-4, 1 - Very unlikely 4 - Very likely within timeframe
Butterfield Recharge Pond
Groundwater Banking South of Delta
Sites Reservoir
Los Vaqueros Reservoir Expansion
Potable Reuse – Ford Road
Potable Reuse – Injection Wells
Imported Water Rights Purchase
Pacheco Reservoir
California Waterfix The scores from this exercise were multiplied by the ordered ranking from the pairwise analysis to determine total risk. The following section provides detailed methods for the total risk calculation. An example of how the subject matter experts could consider risk rating was provided, but not relied upon due to the many different sub-elements of risk to consider.
EXAMPLE:
Rank the likelihood of a stakeholder risk adversely impacting the project
1 = Very unlikely – Support available within 5 to 10 years
2 = Unlikely – appropriate support will Probably be garnered within 5 to 10 years
3 = Likely - Probably will NOT get support within 5 to 10 years
4 = Very likely - Almost certain NOT to get needed support within 5 to 10 years
Rank the severity of a stakeholder risk adversely impacting the project:
1 = Low – Stakeholder support exists or lack of support will not affect project success
Attachment 3 Page 31 of 32

Page | 6
2 = Medium –Potential for stakeholder issues to impact project success
3 = High – Potential for stakeholder issues to significantly impact project success
4 = Very High – Likely that lack of stakeholder support would result in project failure
TOTAL PROJECT RISK CALCULATION
The project team calculated category risk for each project by weighting the pairwise ranking by the severity and likelihood (equation 1). Then, the category risks were summed to obtain each project’s total risk.
𝑅𝑅𝑅𝑅𝑅𝑅𝑅𝑅𝑐𝑐𝑐𝑐𝑐𝑐𝑐𝑐𝑐𝑐𝑐𝑐𝑐𝑐𝑐𝑐 = (1 +𝑆𝑆𝑆𝑆𝑆𝑆𝑆𝑆𝑆𝑆𝑅𝑅𝑆𝑆𝑆𝑆 + 𝐿𝐿𝑅𝑅𝑅𝑅𝑆𝑆𝐿𝐿𝑅𝑅ℎ𝑜𝑜𝑜𝑜𝑜𝑜
8) × 𝑃𝑃𝑃𝑃𝑅𝑅𝑆𝑆𝑃𝑃𝑅𝑅𝑅𝑅𝑆𝑆 𝑅𝑅𝑃𝑃𝑅𝑅𝑅𝑅𝑅𝑅𝑅𝑅𝑅𝑅
The severity and likelihood score is divided by eight (the maximum possible combined score) to represent severity and likelihood as a portion of the maximum possible combined score. The technical team then added that proportion to one (1) so that the pairwise analysis remains the primary driver of the order of risk, and then the severity and likelihood is a multiplicative factor that acts on the risk ranking. If the severity and likelihood is significant, it will substantially increase the total risk score. If the severity and likelihood score are small, there will be little impact on the total risk score. Alternatively, not adding one (1) to the severity and likelihood proportion would result in the severity and likelihood decreasing the ranking number unless the severity and likelihood proportion equals one.
CONCLUSION
The risk assessment methods were easy to apply to the projects and provided a robust and multi-variant method assess risks associated with each project. However, explaining the methods clearly to the subject matter experts was needed. Since the second phase of review with the added project did not include discussions or the opportunity to ask questions, it may have been subject to less project understanding by the experts.
The results are discussed in September 8, 2017, WSMP 2017 – PROJECT RISKS: Results of Pairwise and Traditional Risk Analyses.
Equation 1
Attachment 3 Page 32 of 32


