66
Water Supply Project Midlands and Eastern ReJion Water Demand Review
| Date post: | 03-May-2018 |
| Category: |
Documents |
| Upload: | duongquynh |
| View: | 217 times |
| Download: | 1 times |
Water Supply ProjectMidlands and Eastern Re ion
Water DemandReview

Water Supply Project Midlands and Eastern Region Water Demand Review
February 2015 Revision 1
150203WSP1_WaterDemandReview_Rev1.doc
Document Control Sheet BPP 04 F8 Version 15; March 2013
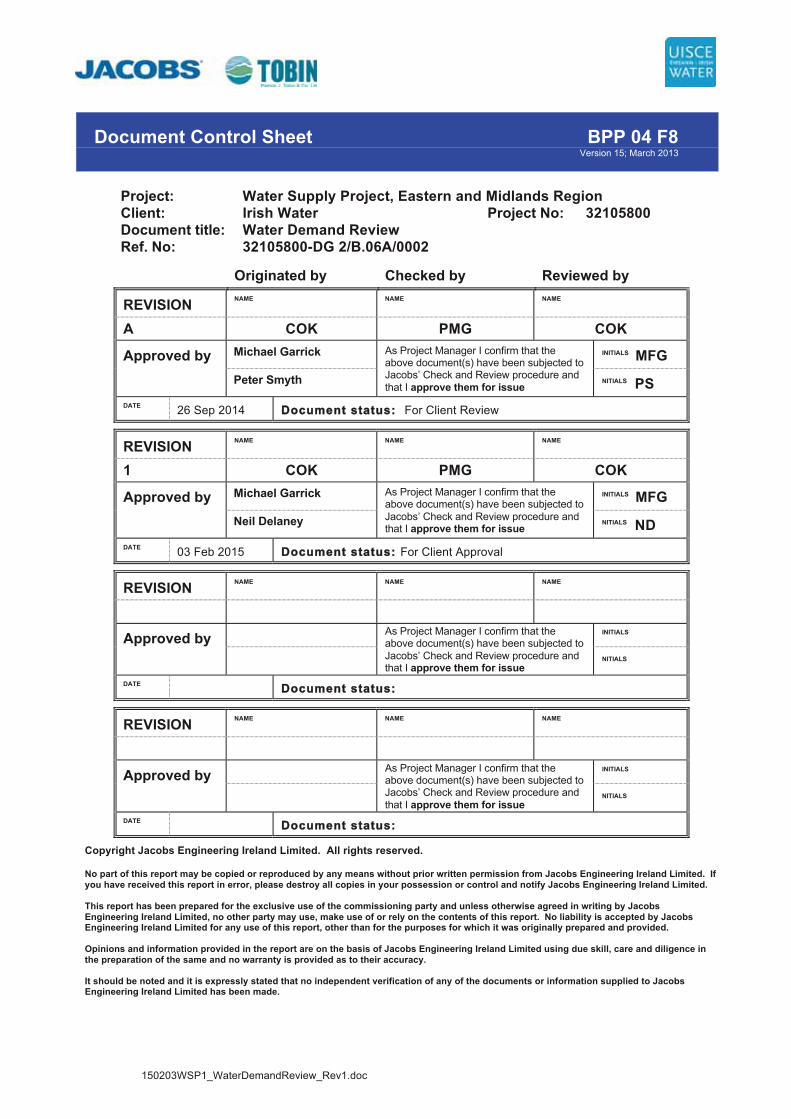
Project: Water Supply Project, Eastern and Midlands Region Client: Irish Water Project No: 32105800 Document title: Water Demand Review Ref. No: 32105800-DG 2/B.06A/0002
Originated by Checked by Reviewed by
REVISION NAME NAME NAME
A COK PMG COK
Approved by Michael Garrick As Project Manager I confirm that the above document(s) have been subjected to Jacobs’ Check and Review procedure and that I approve them for issue
INITIALS MFG Peter Smyth NITIALS PS
DATE 26 Sep 2014 DDocument status: For Client Review
REVISION NAME NAME NAME
1 COK PMG COK
Approved by Michael Garrick As Project Manager I confirm that the above document(s) have been subjected to Jacobs’ Check and Review procedure and that I approve them for issue
INITIALS MFGNeil Delaney NITIALS ND
DATE 03 Feb 2015 DDocument status: For Client Approval
REVISION NAME NAME NAME
Approved by As Project Manager I confirm that the above document(s) have been subjected to Jacobs’ Check and Review procedure and that I approve them for issue
INITIALS NITIALS
DATE DDocument status:
REVISION NAME NAME NAME
Approved by As Project Manager I confirm that the above document(s) have been subjected to Jacobs’ Check and Review procedure and that I approve them for issue
INITIALS NITIALS
DATE DDocument status:
Copyright Jacobs Engineering Ireland Limited. All rights reserved. No part of this report may be copied or reproduced by any means without prior written permission from Jacobs Engineering Ireland Limited. If you have received this report in error, please destroy all copies in your possession or control and notify Jacobs Engineering Ireland Limited. This report has been prepared for the exclusive use of the commissioning party and unless otherwise agreed in writing by Jacobs Engineering Ireland Limited, no other party may use, make use of or rely on the contents of this report. No liability is accepted by Jacobs Engineering Ireland Limited for any use of this report, other than for the purposes for which it was originally prepared and provided. Opinions and information provided in the report are on the basis of Jacobs Engineering Ireland Limited using due skill, care and diligence in the preparation of the same and no warranty is provided as to their accuracy. It should be noted and it is expressly stated that no independent verification of any of the documents or information supplied to Jacobs Engineering Ireland Limited has been made.
150203WSP1_WaterDemandReview_Rev1.doc
Contents
List of Acronyms 1
1 Introduction 11.1 Introduction 11.2 Project Brief 11.3 Previous Work and Reference Studies 11.4 Additional Reference Material 31.5 Context of the Report 31.6 Structure of the Report: 3
2 Background 52.1 Introduction 52.2 Water Supply Area 62.2.1 Combined Water Supply Area 7
3 Demand Estimation Methodology 93.1 Sub-components 93.2 Projection of sub-components 103.3 Demand Estimation of Benefiting Corridors 10
4 Planning Scenarios 11
5 Domestic Demand 135.1 Introduction 135.2 Population 135.3 Per Capita Consumption 135.3.1 Comparison with UK and Europe 145.3.2 Adopted Per Capita Consumption 155.4 Domestic Demand Projection 16
6 Non-Domestic Demand 176.1 Existing Non-Domestic Demand 176.2 Future Non-Domestic Demand 176.2.1 Validation Checks on Projected Non-Domestic Demand 186.3 Major Water Using Industry 20
7 Household (Customer Side Leakage) Losses 227.1 Introduction 227.2 Households 227.2.1 Occupancy Rates / Rate of Household Change 227.2.2 Vacant Households 237.3 Customer Side Leakage Rate 237.4 Customer Side Leakage Loss 24
8 Distribution Leakage Losses / Unaccounted for Water 25

150203WSP1_WaterDemandReview_Rev1.doc
8.1 Introduction 258.2 Sustainable Economic Level of Leakage 258.3 Adopted UFW 268.3.1 Current UFW 268.3.2 Projected UFW 26
9 Operational Usage; Peaking Factor; Headroom & Outage 289.1 Operational Usage 289.2 Peaking Factor 289.3 Headroom & Outage 299.3.1 Headroom 299.3.2 Outage 309.3.3 Overall Headroom & Outage Margin 30
10 Summary of Demand Assessment 32
11 Assessment of Existing Dublin Sources 36
12 Water Supply Area Demand / Supply Balance 39
13 Benefitting Corridors Demand / Supply Balance 4013.1 Introduction 4013.2 Demand Estimation Methodology 4013.2.1 Assessment of existing sources 4113.3 Benefitting Areas 4113.4 Summary of Demand Estimate 47
14 Extent of New Supply Requirements 48
Appendix A 51
Appendix B 53

150203WSP1_WaterDemandReview_Rev1.doc
List of Acronyms
ADPW Average Day Peak Week
AFW Accounted For Water
BME Ballymore Eustace Water Treatment Plant
CSL Customer Side Leakage
CSO Central Statistics Office
DCC Dublin City Council
DI Distribution Input
DLRCC Dun Laoghaire Rathdown County Council
DMA District Metered Area
EIS Environmental Impact Statement
FCC Fingal County Council
FDI Foreign Direct Investment
GDWSSS Great Dublin Water Supply Strategic Study
IDA Industrial Development Authority
IW Irish Water
KCC Kildare County Council
l/hd/d Litres Per Head Per Day
l/prop/d Litres Per Property Per Day
MCC Meath County Council
Ml/d Megalitres Per Day
Ofwat The Water Services Regulation Authority (UK)
PCC Per Capita Consumption
PEC Project Engineering Consultant
POWCAR Place of Work Census Anonymised Results
RWSS Regional Water Supply System

150203WSP1_WaterDemandReview_Rev1.doc
SAPS Small Area Population Statistics
SDCC South Dublin County Council
SELL Sustainable Economic Levels of Leakage
UFW Unaccounted For Water
WCC Wicklow County Council
WSP Water Supply Project, Midlands and Eastern Region
WTP Water Treatment Plants

150203WSP1_WaterDemandReview_Rev1.doc 1
1 Introduction
1.1 Introduction
The official name of the project is Water Supply Project, Midlands and Eastern Region (WSP). Following a competitive tender process Jacobs Engineering Ireland Ltd., supported by TOBIN Consulting Engineers, was appointed by Dublin City Council (DCC) to act as Project Engineering Consultant on this project. The effective commencement date for the project was September 30th 2013. The formal signing of the Contract was on October 17th 2013. The Contract was novated from DCC, through transfer of water services assets and functions to Irish Water, in January 2014. The Client for the project is Irish Water (IW). 1.2 Project Brief
The core requirement of the WSP Project Brief is to safely deliver through the entire planning process a new water supply option; as defined by its source, water transfer system and terminal point. The Project Brief incorporates a number of key stages as follows:
a) Project Inception
b) Definition of Project Need
c) Options Appraisal
d) Design Report
e) Environmental Impact Statement (EIS)
f) Wayleave / Land Acquisition
g) Additional Reports
h) Planning Stage
i) Any Other Work
1.3 Previous Work and Reference Studies
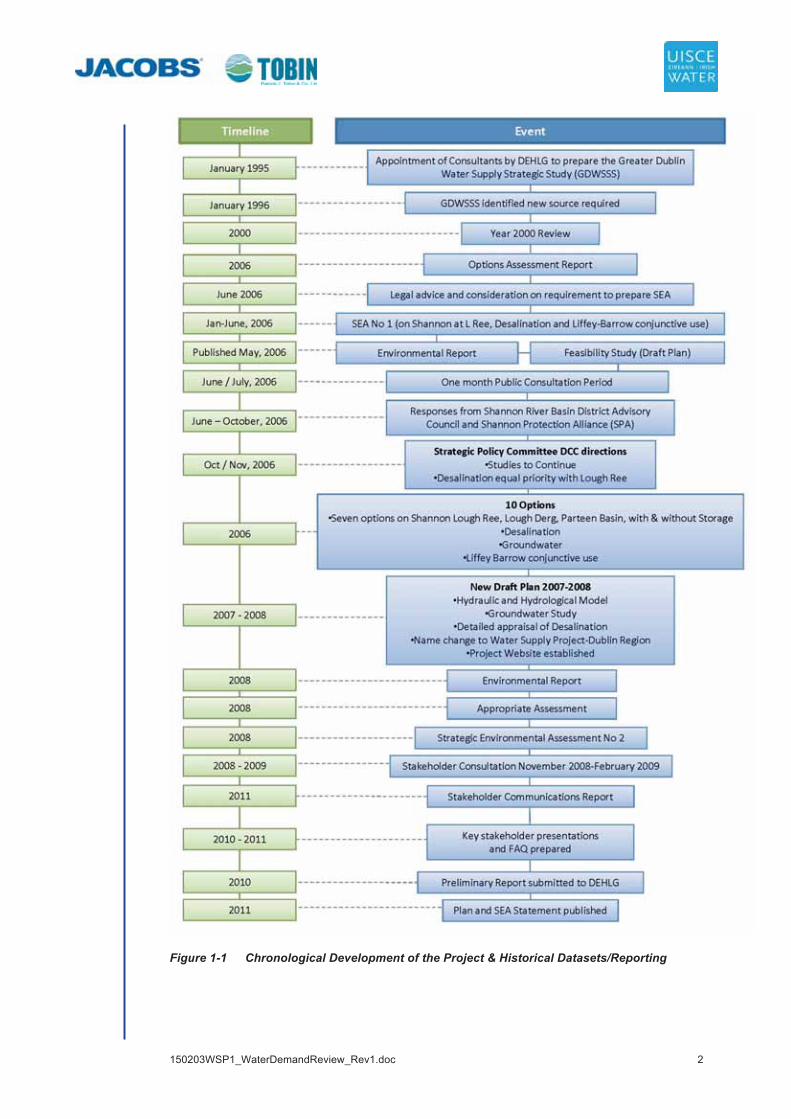
The requirement for the New Dublin Water Supply has been previously outlined and detailed via a robust programme of historical assessments and studies. The historical assessments/study reports are referred to in Figure 1-1.
150203WSP1_WaterDemandReview_Rev1.doc 2
Figure 1-1 Chronological Development of the Project & Historical Datasets/Reporting
150203WSP1_WaterDemandReview_Rev1.doc 3
1.4 AAdditional Reference Material
Further to the reports/studies identified in Figure 1-1, a number of additional reports and studies were reviewed and referenced during the analysis of water demand:
• Water Supply Project Eastern and Midlands Region: Summary of Demographic Projection, AOS, Rev.2, February 2015
• Tables 3.2.8 adj. – Monthly “Water Balance” Report to Dublin Region Water Supply Steering Group
• PCC Report, Dublin City Council, December 2013 • Customer Side Leakage Trial – Merrion Road South • DRWRP - Merrion Road South UFW Pilot Study, May 2010 • Service Indicators in Local Authorities 2011 (8th Annual Report to the
Minister of the Environment, Community and Local Government by the Local Government Management Agency)
• Service Indicators in Local Authorities 2012 (9th Annual Report to the Minister of the Environment, Community and Local Government by the Local Government Management Agency)
• Failte Ireland – “Destination Dublin: A Collective Strategy for Tourism Growth 2020”.
• County Council Assessment of Needs Reports (Various) • National Water Study; National Report Volume 1, Department of
Environment & Local Government, March 2000 • County Meath Water Strategic Plan • Strategic Review of Dundalk & Environs Water Supply, August 2008.
1.5 CContext of the Report
Given the time lag since the Preliminary Report of 2010, the need for a new water supply source is being revisited and reviewed through stage b) of the Project Brief. The review comprises three elements:
• Assessment of the demographic trends over the planning period to 2050. • A review of all components of water demand. • Independent economic assessment of the strategic importance of the project
and of the factors which define its scale. The review of water demand is presented within this Water Demand Review Report. 1.6 SStructure of the Report:
The Water Demand Review Report is structured as follows:
• Section 1 – This section • Section 2 – Introduces the requirement for water demand review and defines
areas of benefiting, and potentially benefiting, communities. • Section 3 – Outlines the methodology applied in water demand estimation. • Section 4 – Summarises the study of demographics undertaken by a
specialist planning and environmental consultant • Sections 5 through 9 – Analysis of each individual sub component of water
demand

150203WSP1_WaterDemandReview_Rev1.doc 4
• Section 10 through 12 – Definition of the demand/supply balance • Section 13 – Explores potential supply to benefitting corridors • Section 14 – Defines the requirement of a new source.

150203WSP1_WaterDemandReview_Rev1.doc 5
2 Background
2.1 IIntroduction
The need for a new water supply source for the metropolitan area of Dublin and surrounding environs (the Water Supply Area) was first identified in the Greater Dublin Water Supply Strategic Study (GDWSSS) of 1996 and endorsed in a review of the GDWSSS in 2000. The Preliminary Report (July 2010) built upon the findings of these studies, developing proposed water demand projections as based on population projections from the 2006 Census, with non-domestic demand built up from considerations of sub-catchment planning potential. These projections were developed in the time of high inward migration and economic growth. The economic landscape has since altered markedly, and in the last few years there has been a shift in migration trends, driven by the state of the Irish economy relative to other countries. The 2011 Census, and subsequently released Central Statistics Office (CSO) Population and Labour Force Projections 2016 – 2046 (April 2013) and Regional Population Projections 2016 – 2031 (December 2013), together with early validation data from the ongoing Irish Water’s (IW) domestic metering programme, collectively presented an ideal opportunity to confirm existing population and non-domestic water supply requirements for the Water Supply Area, and to re-examine population and non-domestic growth rates in the Water Supply Area, up to and beyond the 20501 design year horizon for the Project. The transfer of water services assets and functions to Irish Water in January 2014 has also permitted a more in depth strategic review of the water requirements for potentially benefitting corridors between a new water source and a terminal reservoir near the Dublin Metropolitan Area, permitting the combination of the requirements of the Water Supply Area with those of a benefitting corridor (the Combined Water Supply Area). The aim of this report is to determine the water supply requirements for the Combined Water Supply Area, from a base year of 2011, to the 2050 design year horizon, through consideration of the new and updated data available to this assessment.
1 Updated and redefined from the 2040 horizon adopted in the Preliminary Report of 2010.

150203WSP1_WaterDemandReview_Rev1.doc 6
2.2 WWater Supply Area
The Water Supply Area is defined by the existing water supply network of the Dublin metropolitan area serving an estimated 1,516,133 people (2011 Census). Split by county, it serves:
• Dublin2 – 98.33% of total County by population • Meath – 12.27% of total County by population • Kildare – 82.19% of total County by population • Wicklow – 50.40% of total County by population
The extent of the Water Supply Area is illustrated in Figure 2-A.
Figure 2-A Water Supply Area
2 Including Fingal County Council, Dublin City Council, Dun Laoghaire-Rathdown County Council and South Dublin County Council

150203WSP1_WaterDemandReview_Rev1.doc 7
2.2.1 CCombined Water Supply Area
Irish Water, in considering a position where it has inherited more than 1,000 separate water treatment plants, will
• Examine opportunities to consolidate this number, in a drive towards an equality of service standards for all citizens and operation of a consolidated, efficient and resilient water treatment and distribution system.
• Have regard, in accordance with its national remit, to securing the greatest possible national benefit from development of a new source.
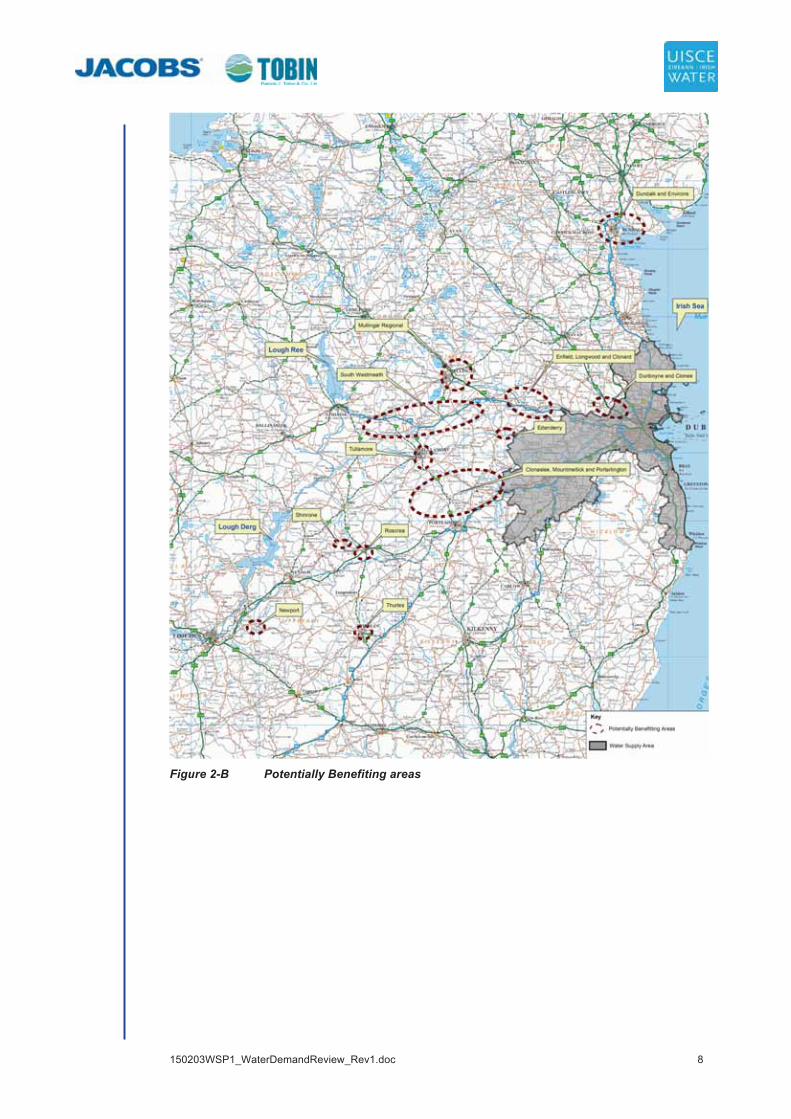
A transfer pipeline, from a new source to a Terminal Reservoir near or in the Water Supply Area could effectively function as a ‘national water spine’. The water supply position for communities adjacent to the route of such a pipeline should therefore be considered in scaling the overall requirement. Preliminary investigations, explored further in Section 13 of this report, have identified a number of areas which could benefit from provision of a ‘national water spine’. These are illustrated in Figure 2-B. Definition of a benefiting corridor will rely on definition of a new source and corridor for a transfer pipeline, the water supply requirements of a benefitting corridor may vary in that regard. For example, abstraction from the Shannon could influence the supply position for a greater number of benefitting areas than can be accessed by a desalination plant abstracting from the Irish Sea.
150203WSP1_WaterDemandReview_Rev1.doc 8
Figure 2-B Potentially Benefiting areas

150203WSP1_WaterDemandReview_Rev1.doc 9
3 Demand Estimation Methodology
Estimation of future water demand is typically based on analysis of individual sub-components of demand and on the preparation of projections for each sub-component to arrive at an overall total demand at the design horizon. 3.1 SSub-components
The typical water demand sub-components are illustrated in Figure 3-A below:
Domestic Demand Demand associated with permanently occupied residential properties. Calculated as the product of Population Served and applied Per Capita Consumption.
Accounted For Water (AFW) The daily volume of water passed into supply that can be accounted for as legitimate use by authorised parties. The sum of Domestic and Non-Domestic Demands, Household Losses, and Operational Use.
Average Demand The daily average volume of water passed into supply. The sum of accounted for water (AFW) and unaccounted for water (UFW).
Household Losses Also called Customer Side Leakage (CSL). This is an allowance for losses and wastage on the private side of domestic connections. Calculated as the product of Domestic Dwellings Served and applied Household Loss Allowance.
Non-Domestic Demand Demand associated with commercial, industrial, agricultural, tourism and institutional related activities. It is typically calculated on the basis that non-domestic use will increase in proportion to domestic water use.
Operational Use Water used in the operation and maintenance of the distribution system (excluding treatment works) (e.g. scouring of mains and reservoirs) and by authorised third party organisations (e.g. fire authority, road authority). It is typically calculated as a % of the sum of Domestic Demand, Non-Domestic Demand, and Household Losses.
Unaccounted For Water (Distribution Leakage Losses) (UFW) Real and apparent losses within the distribution system. Calculated as the difference between Total Distribution Input (DI) and the total Accounted for Water (AFW). Typically a % of DI or a per connection or per kilometre of distribution main allowance is made, derived from targets set in a water conservation plan to achieve a sustainable economic level of leakage.
Peak Demand Peak Demand is the design basis for water distribution infrastructure, such as trunk and distribution mains and service reservoirs. A peaking factor is applied to Accounted For Water to allow for seasonal variation in demand. The peaking factor is typically based on historical records of the daily volume of water passed into supply over a number of years.
Allowance for Risk and Uncertainty (Headroom and Outage) ‘Headroom’ is the allowance applied to Accounted For Water to compensate for risk and uncertainty in the assessment of its various components.
‘Outage’ is the allowance applied to Accounted For Water to allow for unavailability of the water source or treatment plant (i.e. source pollution incident, plant maintenance, etc.).
Production Requirement Production Requirement is the total of the all above sub-components and it is the design basis for water sources and treatment plants.
Table 3-A Typical Demand Sub-components
150203WSP1_WaterDemandReview_Rev1.doc 10
3.2 PProjection of sub-components
Projections of sub-components were developed on a number of planning scenarios, outlined in section 4 of this report, which reflect underlying assumptions on economic development, population growth and migration. The “behaviour” of each sub-component to variance of these assumptions under differing planning scenarios was considered through the 2011 – 2050 period, and is presented in sections 5 through 9 of this report. Variances in time for each sub-component were then combined and rationalised to produce a final projected water demand. The methodology applied to calculate each individual sub component within the Water Supply Area is outlined in Appendix A. 3.3 DDemand Estimation of Benefiting Corridors
Insufficient information was available to fully apply the methodology outlined above in estimation of the projected water demand for benefitting corridors. Therefore a ‘best fit’ approach was applied to estimation of water demand for benefitting corridors as supported by available information. The approach applied is addressed in section 13 of this report.

150203WSP1_WaterDemandReview_Rev1.doc 11
4 Planning Scenarios
AOS Planning was appointed by Jacobs/Tobin to undertake a study on demographic assessment; with the objective of examining a range of growth scenarios for State and regional population projections out to 2050 as a basis for the estimation of water demand. This work is presented in the “Water Supply Project Eastern and Midlands Region: Summary of Demographic Projection”, Rev.2, February 2015 (AOS). Hereafter referred to as ‘the Demographic Report’. The national planning scenarios3 considered in the Demographic Report were as follows:
• Scenario 1(a) – Planned Growth ‘High’ Based on the balanced approach to developing all areas of the country with a moderate increase in the Water Supply Area share of State population. The CSO M2F2 Traditional Projection was considered as ‘best fit’.
• Scenario 1(b) – Planned Growth ‘Low’ Based on the modest, balanced growth for Dublin with higher Rest of State (RoS) area regional growth. The CSO M2F2 Recent Projection was considered as ‘best fit’.
• Scenario 2 – Most Likely Growth, Based on a robust metropolitan area growth pattern, driven by consolidated Foreign Direct Investment (FDI) clusters and a recovering building industry, enhancing Dublin’s ‘Agglomeration effect’. The CSO M2F2 Modified Projection was considered as ‘best fit’.
• Scenario 3 – Minimum Expected Economic Growth, Reflecting the minimum expected economic growth, including some regional loss of population projected for the West Region, persistent high unemployment, negative migration and limited FDI growth. The CSO M3F2 Recent Projection considered as ‘best fit’.
• Scenario 4(a) – Maximum Expected Economic Growth ‘Low’, Based on growth led by the metropolitan area and Ireland’s strong economic performance reflected in its steady net inward migration and robust natural growth. The CSO M2F1 Projection was considered as ‘best fit’.
• Scenario 4(b) –Maximum Expected Economic Growth ‘High’, Based on the Scenario 4(a) predictions, with the highest available 2031 Regional population figures reflecting subsequent growth as an urban agglomeration effect that applies primarily to Ireland’s cities, generated by higher employment and sustained levels of external in-migration into city regions. The CSO M2F1 Modified Projection moving to M1F2 Projection after 2031 was considered as ‘best fit’.
Analysis of the outcomes and the key assumptions underpinning the above planning scenarios suggests that, for water supply planning purposes, Scenario 3 is
3 National planning scenarios are derived from CSO projected scenarios to maintain consistency with the National Spatial Strategy and Regional Planning Guidelines.
150203WSP1_WaterDemandReview_Rev1.doc 12
unrealistically pessimistic and Scenario’s 4a & 4b are unrealistically optimistic. They have therefore been noted, but not further referenced, in developing projections of water demand in the Water Supply Area. Therefore, the remaining three planning scenarios have been considered for developing projections of water demand up to the design year horizon of 2050:
• Scenario 1(a) – Planned Growth ‘High’ • Scenario 1(b) – Planned Growth ‘Low’ • Scenario 2 – Most Likely Growth
The following sections 5 to 10 of this report present the water demand calculation results for each of the components of water demand identified in Table 3-A, as projected under the selected planning scenarios.
150203WSP1_WaterDemandReview_Rev1.doc 13
5 Domestic Demand
5.1 IIntroduction
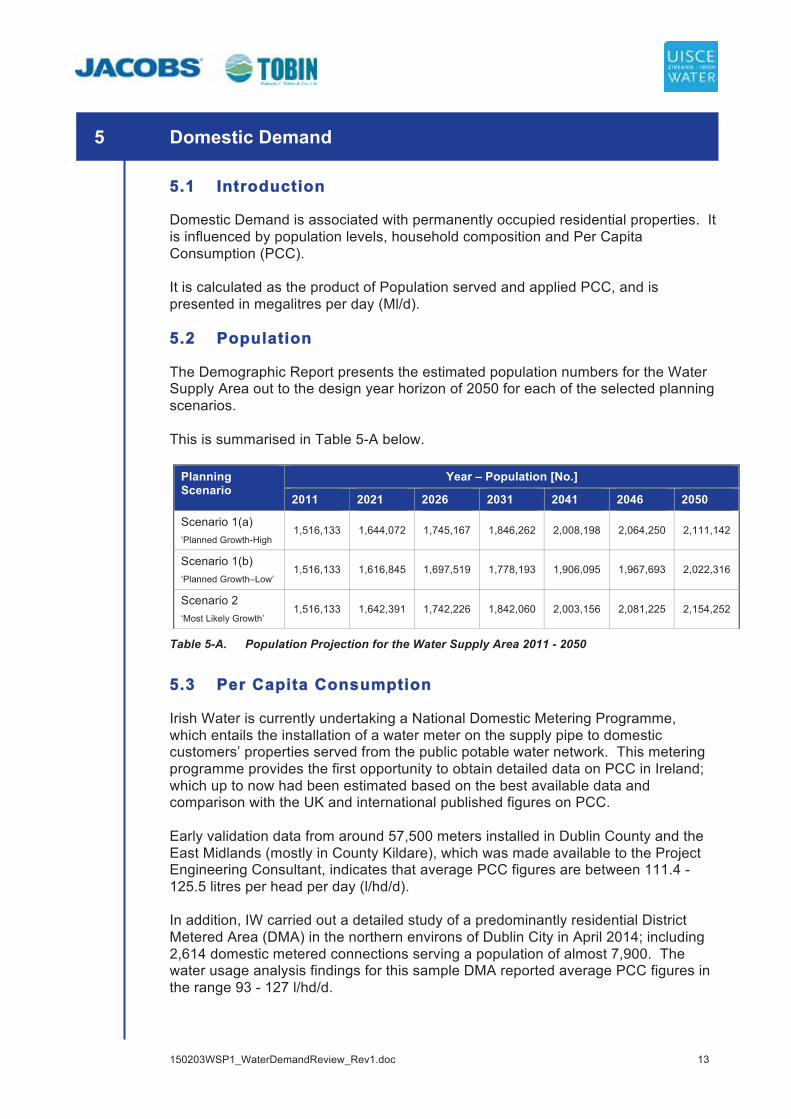
Domestic Demand is associated with permanently occupied residential properties. It is influenced by population levels, household composition and Per Capita Consumption (PCC). It is calculated as the product of Population served and applied PCC, and is presented in megalitres per day (Ml/d). 5.2 PPopulation
The Demographic Report presents the estimated population numbers for the Water Supply Area out to the design year horizon of 2050 for each of the selected planning scenarios. This is summarised in Table 5-A below.
Planning Scenario
Year – Population [No.]
2011 2021 2026 2031 2041 2046 2050
Scenario 1(a) ‘Planned Growth-High
1,516,133 1,644,072 1,745,167 1,846,262 2,008,198 2,064,250 2,111,142
Scenario 1(b) ‘Planned Growth–Low’
1,516,133 1,616,845 1,697,519 1,778,193 1,906,095 1,967,693 2,022,316
Scenario 2 ‘Most Likely Growth’
1,516,133 1,642,391 1,742,226 1,842,060 2,003,156 2,081,225 2,154,252
Table 5-A. Population Projection for the Water Supply Area 2011 - 2050
5.3 PPer Capita Consumption
Irish Water is currently undertaking a National Domestic Metering Programme, which entails the installation of a water meter on the supply pipe to domestic customers’ properties served from the public potable water network. This metering programme provides the first opportunity to obtain detailed data on PCC in Ireland; which up to now had been estimated based on the best available data and comparison with the UK and international published figures on PCC. Early validation data from around 57,500 meters installed in Dublin County and the East Midlands (mostly in County Kildare), which was made available to the Project Engineering Consultant, indicates that average PCC figures are between 111.4 - 125.5 litres per head per day (l/hd/d). In addition, IW carried out a detailed study of a predominantly residential District Metered Area (DMA) in the northern environs of Dublin City in April 2014; including 2,614 domestic metered connections serving a population of almost 7,900. The water usage analysis findings for this sample DMA reported average PCC figures in the range 93 - 127 l/hd/d.

150203WSP1_WaterDemandReview_Rev1.doc 14
Jacobs-Tobin also undertook an exercise to sense check these findings for average PCC. This consisted of identifying validated water meter locations, aligned with small residential areas in North Dublin and Kildare, and utilising information on population numbers, occupancy rates and numbers of households from the CSO’s Small Area Population Statistics and calculating the average PCC based on the total average water consumption for each area. The average PCC figures were found to be in the range of 90.6 - 104.1 l/hd/d, with the lower figures noted in the East Midland areas and the higher figures in North Dublin areas. 5.3.1 CComparison with UK and Europe
England & Wales In England & Wales water companies distinguish between metered and un-metered households when reporting PCC figures to Ofwat4, as illustrated in Table 5-B. 10 Regional Water &
Sewerage Companies 12 Water – only
Companies (l/hd/d and range) (l/hd/d and range) Un-metered Households 151 (141 – 163) 165 (128 – 176)
Metered Households 131 (115 – 142) 141 (111 – 153)
Table 5-B. Reported Average PCC in England & Wales, 2007/2008 (source:Ofwat, 2008)
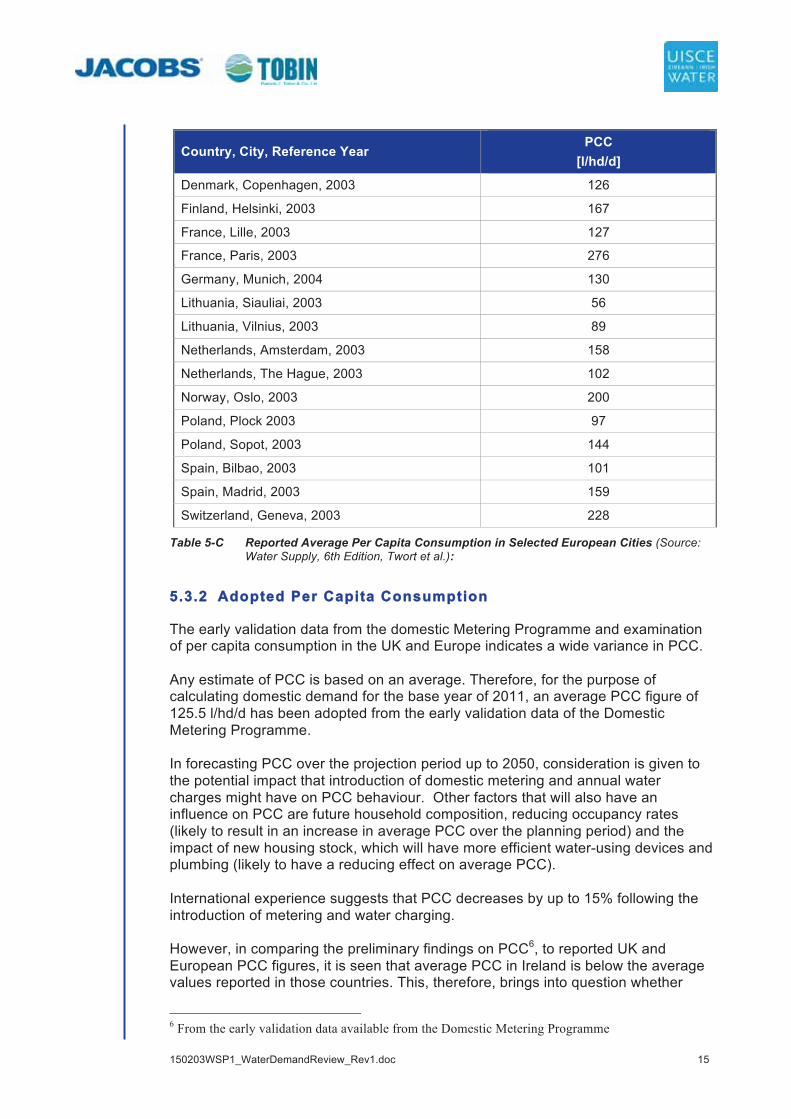
Scotland In Scotland, where household supply is predominantly un-metered at present, the estimated average PCC in 2009/2010 was 154 l/hd/d5. Europe Reported PCC, in litres per head per day (l/hd/d), for a selection of European cities, both under metered and un-metered conditions, is presented in Table 5-C. For the selected cities, reported PCC in 2003/2004 is seen to lie within the range 56 – 276 l/hd/d, with an average value of 144 l/hd/d.
4 The economic regulator of the water and sewerage sectors in England and Wales 5 Water Efficiency Plan 2011 – 2015; Scottish Water
150203WSP1_WaterDemandReview_Rev1.doc 15
Country, City, Reference Year PCC
[l/hd/d]
Denmark, Copenhagen, 2003 126
Finland, Helsinki, 2003 167
France, Lille, 2003 127
France, Paris, 2003 276
Germany, Munich, 2004 130
Lithuania, Siauliai, 2003 56
Lithuania, Vilnius, 2003 89
Netherlands, Amsterdam, 2003 158
Netherlands, The Hague, 2003 102
Norway, Oslo, 2003 200
Poland, Plock 2003 97
Poland, Sopot, 2003 144
Spain, Bilbao, 2003 101
Spain, Madrid, 2003 159
Switzerland, Geneva, 2003 228
Table 5-C Reported Average Per Capita Consumption in Selected European Cities (Source: Water Supply, 6th Edition, Twort et al.):
5.3.2 AAdopted Per Capita Consumption
The early validation data from the domestic Metering Programme and examination of per capita consumption in the UK and Europe indicates a wide variance in PCC. Any estimate of PCC is based on an average. Therefore, for the purpose of calculating domestic demand for the base year of 2011, an average PCC figure of 125.5 l/hd/d has been adopted from the early validation data of the Domestic Metering Programme. In forecasting PCC over the projection period up to 2050, consideration is given to the potential impact that introduction of domestic metering and annual water charges might have on PCC behaviour. Other factors that will also have an influence on PCC are future household composition, reducing occupancy rates (likely to result in an increase in average PCC over the planning period) and the impact of new housing stock, which will have more efficient water-using devices and plumbing (likely to have a reducing effect on average PCC). International experience suggests that PCC decreases by up to 15% following the introduction of metering and water charging. However, in comparing the preliminary findings on PCC6, to reported UK and European PCC figures, it is seen that average PCC in Ireland is below the average values reported in those countries. This, therefore, brings into question whether
6 From the early validation data available from the Domestic Metering Programme

150203WSP1_WaterDemandReview_Rev1.doc 16
further targeted reductions in PCC can realistically be fully achieved, and maintained, over the planning period. To allow for this uncertainty, a range of assumptions on future PCC figures have been applied as follows:
• It is assumed that a reduction of 5% on base year 2011 PCC will be achieved by 2016 for planning scenario 2 – ‘Most Likely Growth’ as a result of the introduction of domestic metering and annual water charges.
• For planning scenario 1(b) – Planned Growth – Low’ it is assumed that a reduction of 10% on base year 2011 PCC will be achieved by 2016 following the introduction of metering and annual water charges.
• For planning scenario 1(a) – ‘Planned Growth - High’ it is assumed that PCC will not respond to the introduction of metering and charging.
• The combined impact of future household composition, occupancy rate and new build is applied across all three planning scenarios.
The Table 5-D below summarises the projected PCC figures:
Planning Scenario
Year – PCC [l/hd/d.]
2011 2021 2026 2031 2041 2046 2050
Scenario 1(a) ‘Planned Growth-High
125.5 127.0 126.8 126.5 125.9 125.3 124.7
Scenario 1(b) ‘Planned Growth–Low’
125.5 113.7 114.5 114.1 113.5 113.3 113.2
Scenario 2 ‘Most Likely Growth’
125.5 120.4 120.6 120.7 120.9 121.0 121.0
Table 5-D PCC Projection (2011 – 2050)
5.4 DDomestic Demand Projection
The projected domestic demand for 2011 – 2050 has been calculated based on the projected population number and the projected PCC figures. A summary of the resulting domestic demand is presented in Table 5-E below:
Planning Scenario
Year – Domestic Demand [Ml/d.]
2011 2021 2026 2031 2041 2046 2050
Scenario 1(a) ‘Planned Growth-High
190.3 208.8 221.3 233.6 252.8 258.7 263.3
Scenario 1(b) ‘Planned Growth–Low’
190.3 183.8 194.4 202.9 216.3 222.9 228.9
Scenario 2 ‘Most Likely Growth’
190.3 197.7 210.1 222.3 242.2 251.8 260.7
Table 5-E Domestic Demand Projections for the Water Supply Area 2011 - 2050
150203WSP1_WaterDemandReview_Rev1.doc 17
6 Non-Domestic Demand
6.1 EExisting Non-Domestic Demand
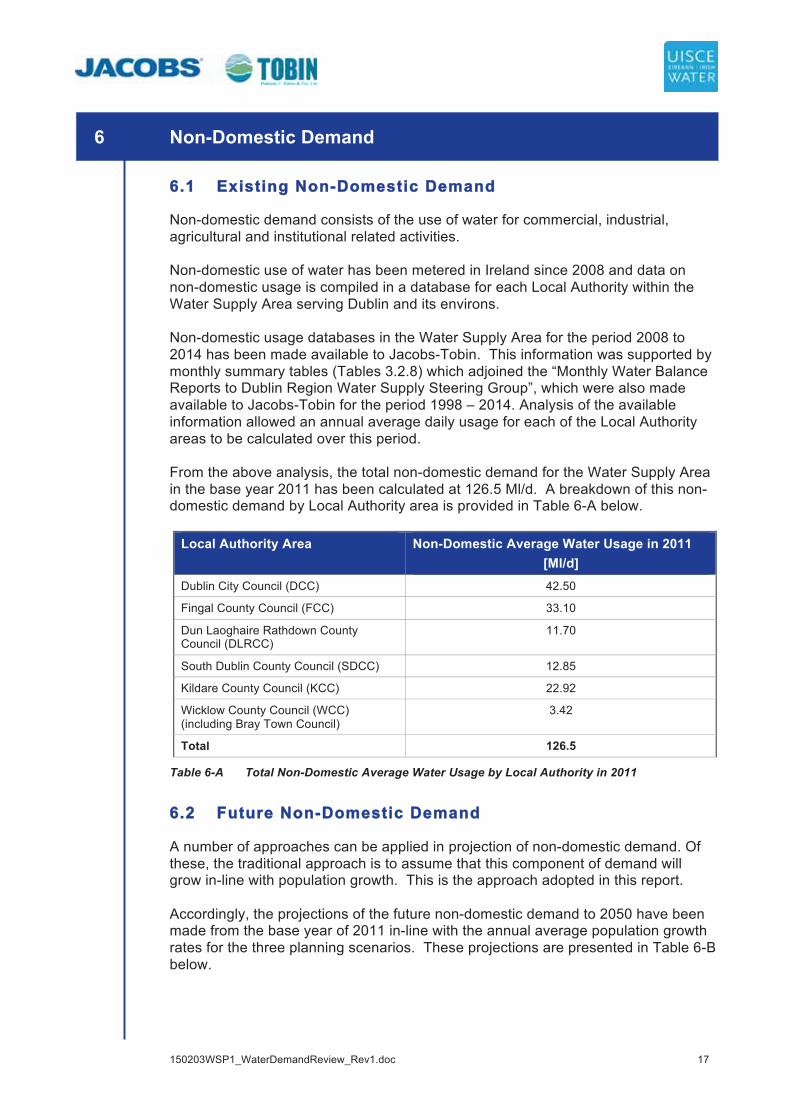
Non-domestic demand consists of the use of water for commercial, industrial, agricultural and institutional related activities. Non-domestic use of water has been metered in Ireland since 2008 and data on non-domestic usage is compiled in a database for each Local Authority within the Water Supply Area serving Dublin and its environs. Non-domestic usage databases in the Water Supply Area for the period 2008 to 2014 has been made available to Jacobs-Tobin. This information was supported by monthly summary tables (Tables 3.2.8) which adjoined the “Monthly Water Balance Reports to Dublin Region Water Supply Steering Group”, which were also made available to Jacobs-Tobin for the period 1998 – 2014. Analysis of the available information allowed an annual average daily usage for each of the Local Authority areas to be calculated over this period. From the above analysis, the total non-domestic demand for the Water Supply Area in the base year 2011 has been calculated at 126.5 Ml/d. A breakdown of this non-domestic demand by Local Authority area is provided in Table 6-A below.
Local Authority Area Non-Domestic Average Water Usage in 2011 [Ml/d]
Dublin City Council (DCC) 42.50
Fingal County Council (FCC) 33.10
Dun Laoghaire Rathdown County Council (DLRCC)
11.70
South Dublin County Council (SDCC) 12.85
Kildare County Council (KCC) 22.92
Wicklow County Council (WCC) (including Bray Town Council)
3.42
Total 126.5
Table 6-A Total Non-Domestic Average Water Usage by Local Authority in 2011
6.2 FFuture Non-Domestic Demand
A number of approaches can be applied in projection of non-domestic demand. Of these, the traditional approach is to assume that this component of demand will grow in-line with population growth. This is the approach adopted in this report. Accordingly, the projections of the future non-domestic demand to 2050 have been made from the base year of 2011 in-line with the annual average population growth rates for the three planning scenarios. These projections are presented in Table 6-B below.

150203WSP1_WaterDemandReview_Rev1.doc 18
Planning Scenario
Year – Non-Domestic Demand [Ml/d]
2011 2021 2026 2031 2041 2046 2050
Scenario 1(a) ‘Planned Growth-High’
126.5 138.5 146.5 155.2 169.4 173.7 177.7
Scenario 1(b) ‘Planned Growth-Low’
126.5 136.2 142.4 149.4 160.5 165.6 170.0
Scenario 2 ‘Most Likely Growth’
126.5 138.3 146.2 154.8 168.7 175.3 181.1
Table 6-B Non-Domestic Demand Projections for the Water Supply Area 2011 - 2050
The particular requirements of large industrial users are discussed in Section 6.3. 6.2.1 VValidation Checks on Projected Non-Domestic Demand
A number of checks on the projected non-domestic demand were undertaken to ensure that the non-domestic demand would be accurately and sufficiently covered for the planning period. Tourism Existing water use by the tourism industry is captured within the metered non-domestic demand. However, as target growth rates identified by Fáilte Ireland7 for the tourism industry in the Dublin area in the period up to 2020 are higher than the projected population growth rates of the Demographic Report over the same period, future potential water use by this sector has been examined to ensure it has been sufficiently covered in the future non-domestic demand projections for the planning period. To account for the higher growth rates in the sector, an allowance for ‘tourism’, equivalent to the difference between the tourism growth rate and projected population growth rate, has been included in the projected non-domestic demand outlined in Table 6-B above. A summary of this additional allowance for ‘tourism’ is presented in the Table 6-C below:
Planning Scenario
Year – Tourism Allowance (included in Non-Domestic Demand) [Ml/d]
2011 2021 2026 2031 2041 2046 2050
Scenario 1(a) 0.00 0.60 0.41 0.41 1.00 0.61 0.66
Scenario 1(b) 0.00 0.60 0.18 0.30 0.71 0.42 0.46
Scenario 2 0.00 0.60 0.34 0.32 0.75 0.44 0.49
Table 6-C Tourism Allowance Projection for 2011 - 2050
7 “Destination Dublin: A Collective Strategy for Tourism Growth 2020”, January 2014; (Grow Dublin Taskforce)
150203WSP1_WaterDemandReview_Rev1.doc 19
Commuting Workforce The commuting workforce comprises those people who live outside the Water Supply Area and travel into it for work purposes. Those who already live and commute within it, have no net impact on water demand. Commuter figures were sourced from the 2006 POWCAR8 dataset. Existing water use by commuters is already captured within the metered non-domestic demand. Future potential water use by this sector has been examined to ensure it has been sufficiently covered in the future non-domestic demand projections for the planning period. The projected growth rates for the commuting workforce over the planning period to 2050 have been assumed as being similar to the population growth rates reported in the Demographic Projection report9 for the regions outside the Water Supply Area. Examination of these growth rates indicates that they are lower than those projected for the population within the Water Supply Area. As future non-domestic demand has been assumed to grow in-line with population growth within that Water Supply Area, it is considered that future water use by the commuting workforce is already adequately covered by the projected non-domestic demand as summarised in Table 6-B above. Land-Zoning Approach A sense check was carried out on the projected non-domestic demand using a land-zoning approach. This approach assumed that the total area of available land zoned for commercial/industrial/institutional use would be developed by 2050. The area of undeveloped land zoned for commercial / industrial / institutional use in each Local Authority area was determined from the County Development Plans, MyMap GIS data and previous studies The current average non-domestic water demand per hectare of land zoned for commercial/industrial/institutional purposes has been established based on analysis of existing non-domestic water demand for a number of commercial/industrial business parks within the Water Supply Area. This existing non-domestic water demand per hectare of commercial / business lands has been determined at 13.5 m3/ha/d. The non-domestic water demand for each Local Authority area at 2050, if based on a land-zoning approach, would therefore be calculated by applying the average non-domestic demand per hectare to the area of undeveloped land zoned for commercial/industrial/institutional use. The non-domestic water demand by Local Authority area at 2050 calculated in this manner is presented in the Table 6-D below:
8 Place of Work – Census of Anonymised Records (POWCAR) 9 “Water Supply Project, Eastern and Midlands Region: Summary of Demographic Projection”, Rev.2, February 2015 (AOS)
150203WSP1_WaterDemandReview_Rev1.doc 20
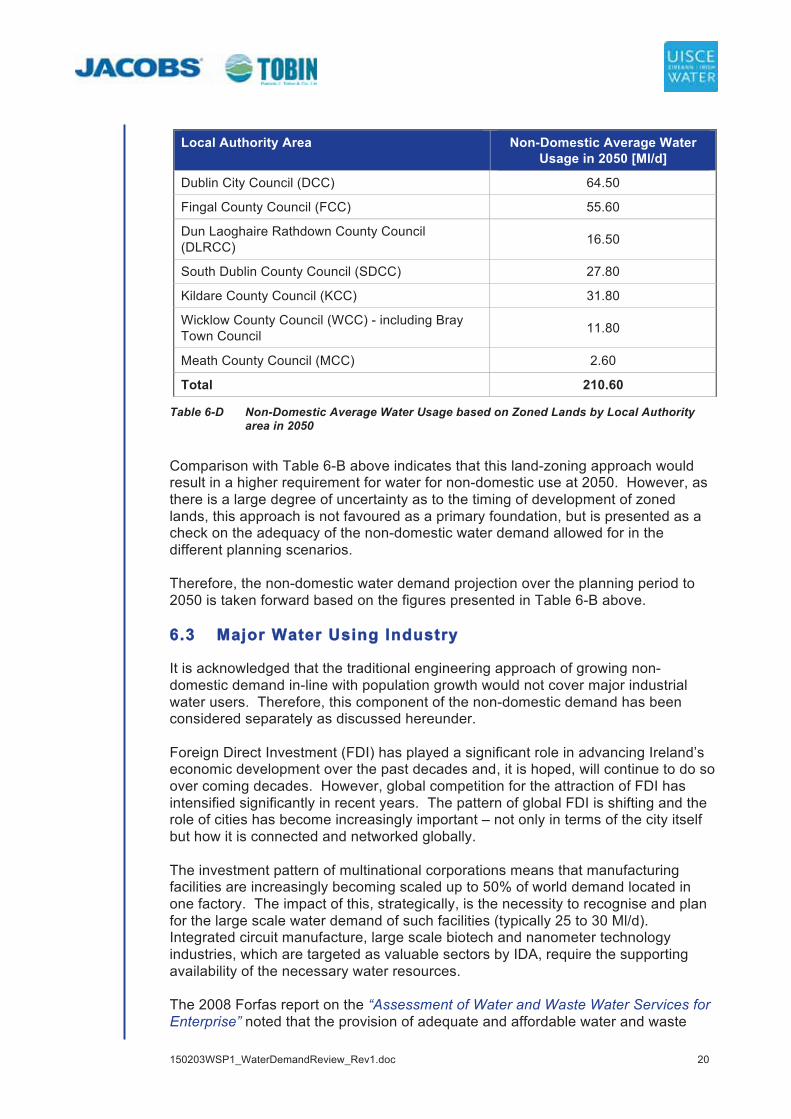
Local Authority Area Non-Domestic Average Water
Usage in 2050 [Ml/d]
Dublin City Council (DCC) 64.50
Fingal County Council (FCC) 55.60
Dun Laoghaire Rathdown County Council (DLRCC) 16.50
South Dublin County Council (SDCC) 27.80
Kildare County Council (KCC) 31.80
Wicklow County Council (WCC) - including Bray Town Council 11.80
Meath County Council (MCC) 2.60
Total 210.60
Table 6-D Non-Domestic Average Water Usage based on Zoned Lands by Local Authority area in 2050
Comparison with Table 6-B above indicates that this land-zoning approach would result in a higher requirement for water for non-domestic use at 2050. However, as there is a large degree of uncertainty as to the timing of development of zoned lands, this approach is not favoured as a primary foundation, but is presented as a check on the adequacy of the non-domestic water demand allowed for in the different planning scenarios. Therefore, the non-domestic water demand projection over the planning period to 2050 is taken forward based on the figures presented in Table 6-B above. 6.3 MMajor Water Using Industry
It is acknowledged that the traditional engineering approach of growing non-domestic demand in-line with population growth would not cover major industrial water users. Therefore, this component of the non-domestic demand has been considered separately as discussed hereunder. Foreign Direct Investment (FDI) has played a significant role in advancing Ireland’s economic development over the past decades and, it is hoped, will continue to do so over coming decades. However, global competition for the attraction of FDI has intensified significantly in recent years. The pattern of global FDI is shifting and the role of cities has become increasingly important – not only in terms of the city itself but how it is connected and networked globally. The investment pattern of multinational corporations means that manufacturing facilities are increasingly becoming scaled up to 50% of world demand located in one factory. The impact of this, strategically, is the necessity to recognise and plan for the large scale water demand of such facilities (typically 25 to 30 Ml/d). Integrated circuit manufacture, large scale biotech and nanometer technology industries, which are targeted as valuable sectors by IDA, require the supporting availability of the necessary water resources. The 2008 Forfas report on the “Assessment of Water and Waste Water Services for Enterprise” noted that the provision of adequate and affordable water and waste
150203WSP1_WaterDemandReview_Rev1.doc 21
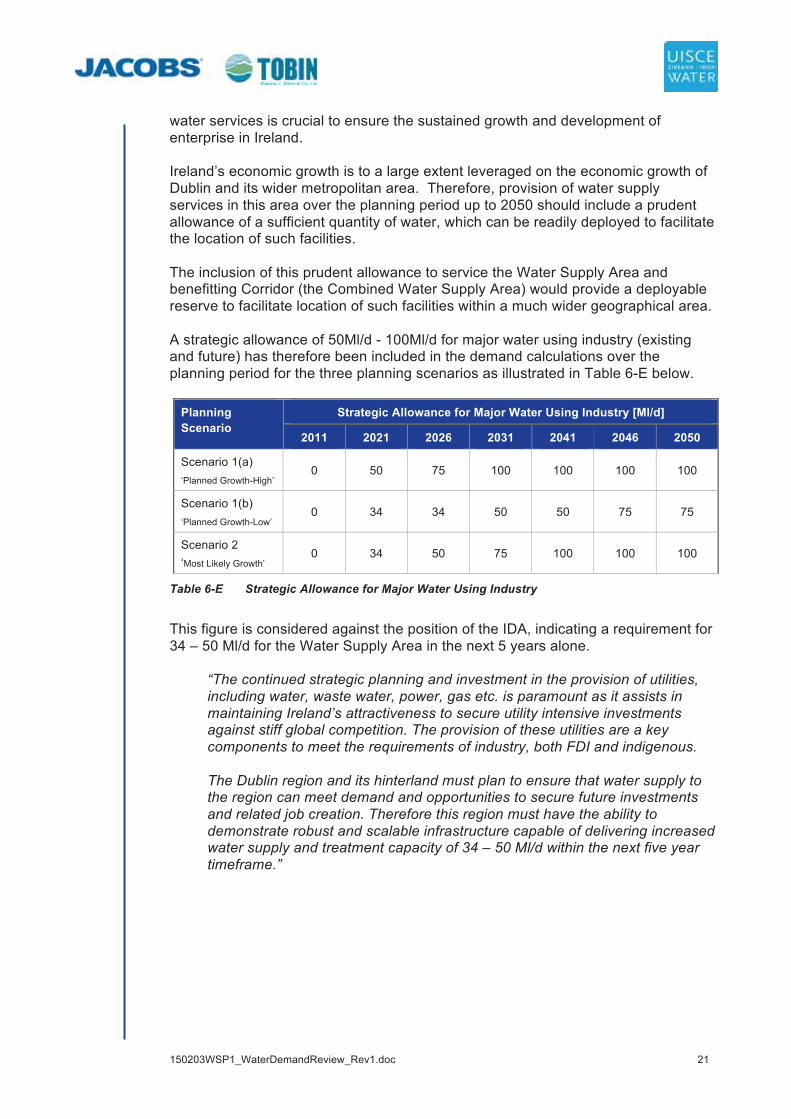
water services is crucial to ensure the sustained growth and development of enterprise in Ireland. Ireland’s economic growth is to a large extent leveraged on the economic growth of Dublin and its wider metropolitan area. Therefore, provision of water supply services in this area over the planning period up to 2050 should include a prudent allowance of a sufficient quantity of water, which can be readily deployed to facilitate the location of such facilities. The inclusion of this prudent allowance to service the Water Supply Area and benefitting Corridor (the Combined Water Supply Area) would provide a deployable reserve to facilitate location of such facilities within a much wider geographical area. A strategic allowance of 50Ml/d - 100Ml/d for major water using industry (existing and future) has therefore been included in the demand calculations over the planning period for the three planning scenarios as illustrated in Table 6-E below.
Planning Scenario
Strategic Allowance for Major Water Using Industry [Ml/d]
2011 2021 2026 2031 2041 2046 2050
Scenario 1(a) ‘Planned Growth-High’
0 50 75 100 100 100 100
Scenario 1(b) ‘Planned Growth-Low’
0 34 34 50 50 75 75
Scenario 2 ‘Most Likely Growth’
0 34 50 75 100 100 100
Table 6-E Strategic Allowance for Major Water Using Industry
This figure is considered against the position of the IDA, indicating a requirement for 34 – 50 Ml/d for the Water Supply Area in the next 5 years alone.
“The continued strategic planning and investment in the provision of utilities, including water, waste water, power, gas etc. is paramount as it assists in maintaining Ireland’s attractiveness to secure utility intensive investments against stiff global competition. The provision of these utilities are a key components to meet the requirements of industry, both FDI and indigenous. The Dublin region and its hinterland must plan to ensure that water supply to the region can meet demand and opportunities to secure future investments and related job creation. Therefore this region must have the ability to demonstrate robust and scalable infrastructure capable of delivering increased water supply and treatment capacity of 34 – 50 Ml/d within the next five year timeframe.”

150203WSP1_WaterDemandReview_Rev1.doc 22
7 Household (Customer Side Leakage) Losses
7.1 IIntroduction
Customer Side Leakage (CSL) is defined as a necessary allowance for losses and wastage on the private side of domestic connections10. It is calculated as the product of the households served and the applied CSL rate per property. 7.2 HHouseholds
The number of households in the Water Supply Area for the base year 2011 was collated from the Small Area Population Statistics (SAPS) figures, published from the results of the 2011 Census data. This data also includes vacant properties as recorded in the Census. Projected household numbers in the Water Supply Area over the planning period have been sourced from work undertaken by AOS Planning. Projected household numbers were calculated based on the projected occupancy rates over the planning period, with an appropriate allowance for vacant properties; as discussed in Sections 7.2.1 & 7.2.3 hereunder. The total projected household numbers over the planning period under each planning scenario are presented in the Table 7-A below:
Planning Scenario
Year – Households [No.]
2011 2021 2026 2031 2041 2046 2050
Scenario 1(a) 618,460 712,000 789,993 835,756 909,061 934,434 955,661
Scenario 1(b) 618,460 700,208 768,424 804,943 862,841 890,725 915,452
Scenario 2 618,460 728,480 798,520 873,391 1,020,126 1,100,648 1,184,839
Table 7-A Estimate of Household numbers in the Water Supply Area (2011 – 2050)
7.2.1 OOccupancy Rates / Rate of Household Change
Occupancy rate is an important factor in the assessment of CSL as it directly influences the projected number of households for the planning period. The Demographic Report provides occupancy rates for the three planning scenarios based on the following assumptions:
• Planning scenarios 1(a) and 1(b) - the occupancy rates are based on a continuation of the trends observed over the period 2002 - 2011 as sourced from census data, resulting in an average household size of 2.43 persons in urban areas by 2051.
10 A necessary allowance as water supply must be made available even despite these losses
150203WSP1_WaterDemandReview_Rev1.doc 23
• Planning scenario 2 – the occupancy rates are based on the assumption that average household sizes in Ireland will progressively decline and will reach 2.0 by 2051. As a comparison, Eurostat data confirms that Germany and Denmark had an average household size of 2.0 in 2011.
7.2.2 VVacant Households
As referenced in the Demographic Report, vacancy rates were sourced from the Housing Agency report “Housing Supply Requirements in Ireland’s Urban Settlements 2014 – 2018”. For the water supply area serving Dublin and its environs, a range of 7 – 10% is considered to best represent the vacancy rate. In this report the upper limit of this range (10%) has been applied to the projected household numbers, as a ‘worst case’ scenario. 7.3 CCustomer Side Leakage Rate
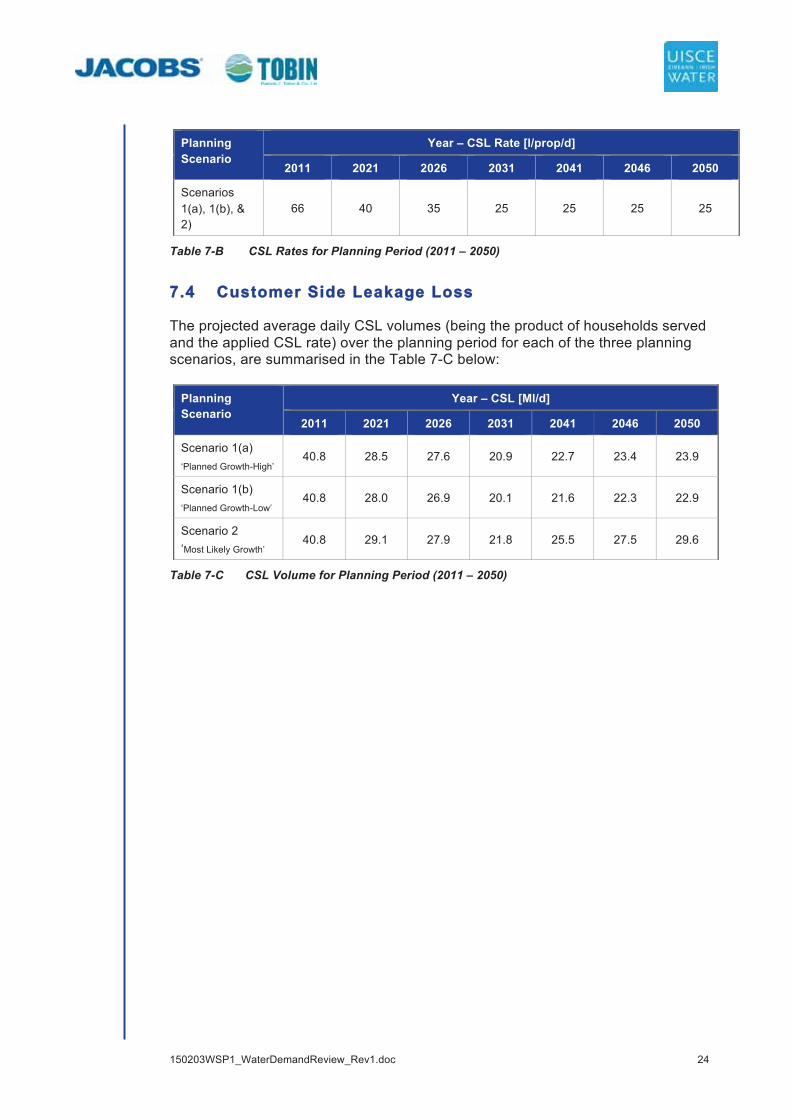
Analysis of the early validation data provided by IW from the ongoing domestic metering programme has established the current average value of CSL at 66 litres per property per day (l/prop/d). Analysis of the early validation of domestic metering data has also indicated that 5 – 6% of households exhibit water consumption in excess of twice the average daily household consumption, which suggests potential significant customer side leakage on these properties. As part of their water conservation strategy, Irish Water is reducing CSL through active leakage control and customer focussed demand management initiatives. To assist in achieving reductions in CSL, the Government is introducing a ‘First Fix’ scheme, whereby Irish Water will repair the first leak found on the supply pipe to a customer’s property for free. International evidence indicates that domestic consumption generally reduces by around 5 – 15% following the introduction of meters and water charges and similar reductions were also noticed in CSL. Detailed studies by Wessex Water11 showed CSL reducing by up to 21 l/prop/day following meter installation. In recognition of Irish Water’s stated water conservation strategy, future demand projections arising from this component of demand are assumed to reduce significantly over the planning period to a level of 25 l/prop/d, which is in line with the lowest achievable average CSL rate for metered supplies to households as reported in the Walker Report12 for the UK. Projected CSL rates over the planning period for each of the planning scenarios are presented in the Table 7-B below:
11 http://www.wessexwater.co.uk/WorkArea/DownloadAsset.aspx?id=9027 12 The Independent Review of Charging for Household Water and Sewerage Services. Final Report, December 2009 (A. Walker CB)
150203WSP1_WaterDemandReview_Rev1.doc 24
Planning Scenario
Year – CSL Rate [l/prop/d]
2011 2021 2026 2031 2041 2046 2050
Scenarios 1(a), 1(b), & 2)
66 40 35 25 25 25 25
Table 7-B CSL Rates for Planning Period (2011 – 2050)
7.4 CCustomer Side Leakage Loss
The projected average daily CSL volumes (being the product of households served and the applied CSL rate) over the planning period for each of the three planning scenarios, are summarised in the Table 7-C below:
Planning Scenario
Year – CSL [Ml/d]
2011 2021 2026 2031 2041 2046 2050
Scenario 1(a) ‘Planned Growth-High’
40.8 28.5 27.6 20.9 22.7 23.4 23.9
Scenario 1(b) ‘Planned Growth-Low’
40.8 28.0 26.9 20.1 21.6 22.3 22.9
Scenario 2 ‘Most Likely Growth’
40.8 29.1 27.9 21.8 25.5 27.5 29.6
Table 7-C CSL Volume for Planning Period (2011 – 2050)
150203WSP1_WaterDemandReview_Rev1.doc 25
8 Distribution Leakage Losses / Unaccounted for Water
8.1 IIntroduction
Distribution Leakage (DL) losses, also known as Unaccounted for Water (UFW) is the volume of water passed in to supply that cannot be accounted for as legitimate water use. It is calculated as the difference between Total Distribution Input (DI) and the total Accounted for Water (AFW)13. Nationally, UFW is a significant component of water demand. The principal components of UFW are:
• Real Losses - consisting of leakage from trunk and distribution mains, leakage from service pipes and fittings (to the customer stopcock), and leakage and overflows from storage reservoirs.
• Apparent Losses – consisting of unauthorised or illegal consumption (illegal connections or hydrant use), bulk meter inaccuracies (i.e. over reporting of water into supply) and customer meter inaccuracies (i.e. inaccuracies in meter reading, legal unmetered connections).
Distribution Leakage is complex and can be affected by many factors such as:
• Operational strategies (e.g. pressure management), • Network characteristics (e.g. length of mains), • The climate (e.g. freezing ground in the winter or dry summers), • Asset condition (e.g. age of network), and • Level of intensity and sophistication of the leakage reduction effort.
Leaks in water distribution networks are inevitable as all joints are susceptible to seepage and pipes can become damaged over time by ground movements caused by freezing weather or the weight of traffic on roads. Therefore, allowance must be made for UFW in the projection of future demand, even as the determined effort to minimise it continues. 8.2 SSustainable Economic Level of Leakage
Water companies globally are working to operate at sustainable economic levels of leakage (SELL), which identifies the level of leakage that gives consumers the best value for money. SELL is the level of leakage at which it would cost more to make further reductions in leakage than to produce the water from another source. Leakage from the water networks is in excess of 40% across the country, twice the level of that in the UK, where the assets are comparable but have been more intensively managed over the last 20 years. Leakage is several times the typical figures in Germany, Denmark and the Netherlands, where networks are much newer from decades of investment in mains renewal. 13 AFW is the total of Domestic Demand, Customer Side Leakage (CSL), Non-domestic Demand and Operational Use.
150203WSP1_WaterDemandReview_Rev1.doc 26
This gives a general indication of the relative state of our water infrastructure and it underlines the fact that significant investment will be needed over several years for Irish Water to catch up with international norms in the water utility sector. Irish Water is committed to moving from a relatively passive leakage control status to a proactive approach, with the long-term objective of ultimately reducing public and customer side leakage nationally to a sustainable economic level. However, SELL analysis can only be applied to an existing network where baseline leakage levels are well established. The SELL calculation should include all costs and benefits associated with different levels of leakage, including environmental and social ones. As much of this information is not yet known to Irish Water, it is therefore necessary to apply a working assumption for UFW until such time as the SELL calculation can be undertaken with any degree of confidence. 8.3 AAdopted UFW
8.3.1 CCurrent UFW
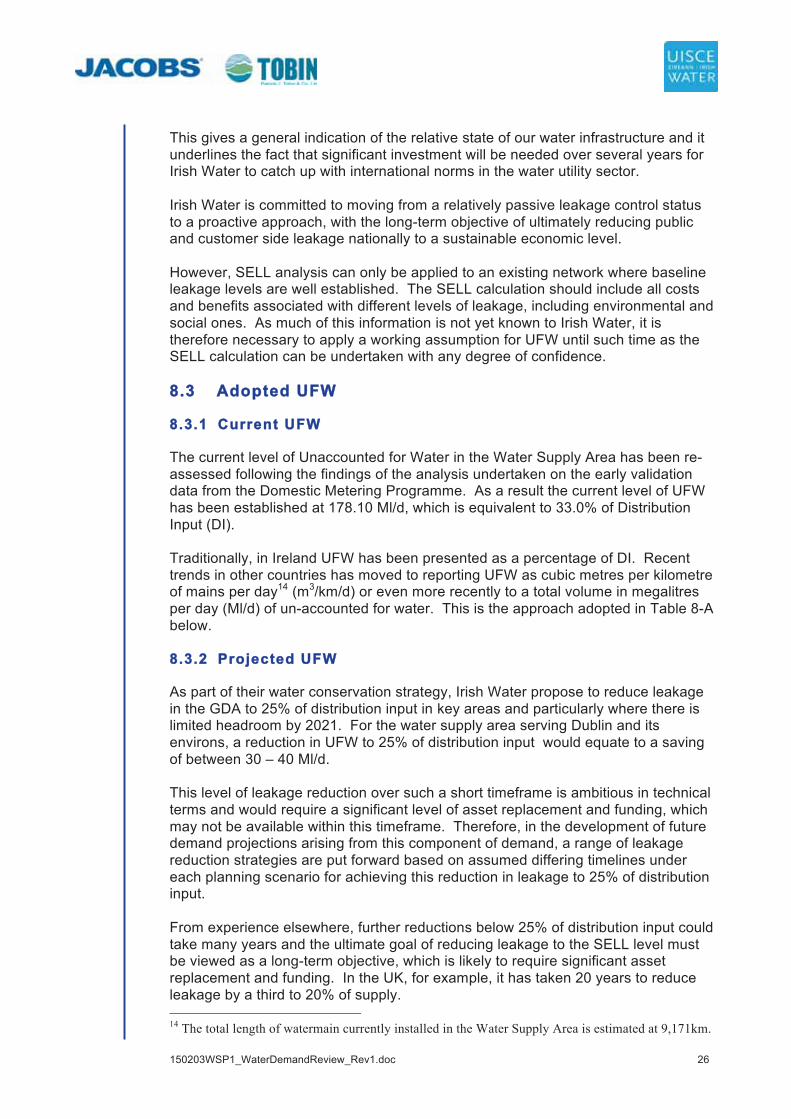
The current level of Unaccounted for Water in the Water Supply Area has been re-assessed following the findings of the analysis undertaken on the early validation data from the Domestic Metering Programme. As a result the current level of UFW has been established at 178.10 Ml/d, which is equivalent to 33.0% of Distribution Input (DI). Traditionally, in Ireland UFW has been presented as a percentage of DI. Recent trends in other countries has moved to reporting UFW as cubic metres per kilometre of mains per day14 (m3/km/d) or even more recently to a total volume in megalitres per day (Ml/d) of un-accounted for water. This is the approach adopted in Table 8-A below. 8.3.2 PProjected UFW
As part of their water conservation strategy, Irish Water propose to reduce leakage in the GDA to 25% of distribution input in key areas and particularly where there is limited headroom by 2021. For the water supply area serving Dublin and its environs, a reduction in UFW to 25% of distribution input would equate to a saving of between 30 – 40 Ml/d. This level of leakage reduction over such a short timeframe is ambitious in technical terms and would require a significant level of asset replacement and funding, which may not be available within this timeframe. Therefore, in the development of future demand projections arising from this component of demand, a range of leakage reduction strategies are put forward based on assumed differing timelines under each planning scenario for achieving this reduction in leakage to 25% of distribution input. From experience elsewhere, further reductions below 25% of distribution input could take many years and the ultimate goal of reducing leakage to the SELL level must be viewed as a long-term objective, which is likely to require significant asset replacement and funding. In the UK, for example, it has taken 20 years to reduce leakage by a third to 20% of supply. 14 The total length of watermain currently installed in the Water Supply Area is estimated at 9,171km.

150203WSP1_WaterDemandReview_Rev1.doc 27
Therefore, the future demand projection of UFW, post the reduction to 25% of distribution input, seeks to maintain UFW at an absolute volumetric level of 130 Ml/d, which would equate to a leakage rate of between 18 – 21%, if expressed as a percentage of distribution input (DI) at 2050. The projected distribution leakage volume (UFW) and the corresponding leakage rate, expressed as a percentage of DI and as cubic metres per kilometre of existing installed mains per day (m3/km/d), over the planning period for each of the three planning scenarios is summarised in Table 8-A below:
Planning Scenario
Year
2011 2021 2026 2031 2041 2046 2050
Scenario 1(a) Planned Growth-High
UFW
[Ml/d] 178.1 143.2 137.5 130.00 130.00 130.00 130.00
Leakage Rate [%]
33.0% 25.0% 22.5% 20.2% 19.1% 18.8% 18.6%
Leakage Rate
[m3/km/d] 19.42 15.61 14.99 14.18 14.18 14.18 14.18
Scenario 1(b) Planned Growth-Low
UFW
[Ml/d], 178.1 156.4 133.8 130.0 130.0 130.0 130.0
Leakage Rate [%]
33.0% 28.9% 25.0% 23.4% 22.3% 21.0% 20.6%
UFW [m3/km/d]
19.42 17.05 14.59 14.18 14.18 14.18 14.18
Scenario 2 UFW
[Ml/d], 178.1 164.8 146.0 140.8 130.00 130.00 130.00
Most Likely Growth
Leakage Rate [%]
33.0% 29.0% 25.0% 22.8% 19.4% 18.9% 18.4%
UFW
[m3/km/d] 19.42 17.97 15.92 15.35 14.18 14.18 14.18
Table 8-A UFW Volume and Rate of Leakage (as % of DI & m3/km/d) over Planning Period (2011 – 2050)

150203WSP1_WaterDemandReview_Rev1.doc 28
9 Operational Usage; Peaking Factor; Headroom & Outage
9.1 OOperational Usage
Operational usage covers water used in the operation and maintenance of the distribution system (e.g. scouring of mains and reservoirs) and by authorised third party organisations (e.g. fire authority, road authority)15. In these cases, the total quantities of water used are relatively small. Typically in Ireland an allowance of 1% of “legitimate demand” has been applied. In this instance, legitimate demand is defined as the sum of domestic demand, household losses, and non-domestic demand. In assessing the future demand projections arising from this component of demand, an allowance of 1% of “legitimate demand” has been applied across all three planning scenarios. This operational usage allowance over the planning period for the three planning scenarios is presented in Table 9-A below.
Planning Scenario
Year – Operational Usage Allowance [Ml/d]
2011 2021 2026 2031 2041 2046 2050
Scenario 1(a) ‘Planned Growth-High’
3.6 3.8 4.0 4.1 4.4 4.6 4.6
Scenario 1(b) ‘Planned Growth-Low’
3.6 3.5 3.6 3.7 4.0 4.1 4.2
Scenario 2 ‘Most Likely Growth’
3.6 3.7 3.8 4.0 4.4 4.5 4.7
Table 9-A Operational Usage Allowance over Planning Period (2011 – 2050)
9.2 PPeaking Factor
Demand for water varies throughout the year with seasonal peaks occurring. For example, summer peaks may occur primarily due to increased water usage associated with warm dry weather, whereas winter peaks are primarily due to bursts associated with cold weather and with consumers, against advice, running water to waste to prevent their supply plumbing from freezing. Other peaks may occur throughout the year as a result of sporting or cultural events occurring within the Water Supply Area. International practice requires that “Average Day Peak Week”, or peak demand, be taken as the design basis for water distribution infrastructure. In order to size distribution systems, an estimate of peak demands must be made to allow for seasonal variations. Some typical peaking factors are tabulated in Table 9-B below.
15 Operational usage does not account for operational water use in water treatment plants. This is typically provisioned for in the raw water abstraction requirement of the water treatment plant.
150203WSP1_WaterDemandReview_Rev1.doc 29
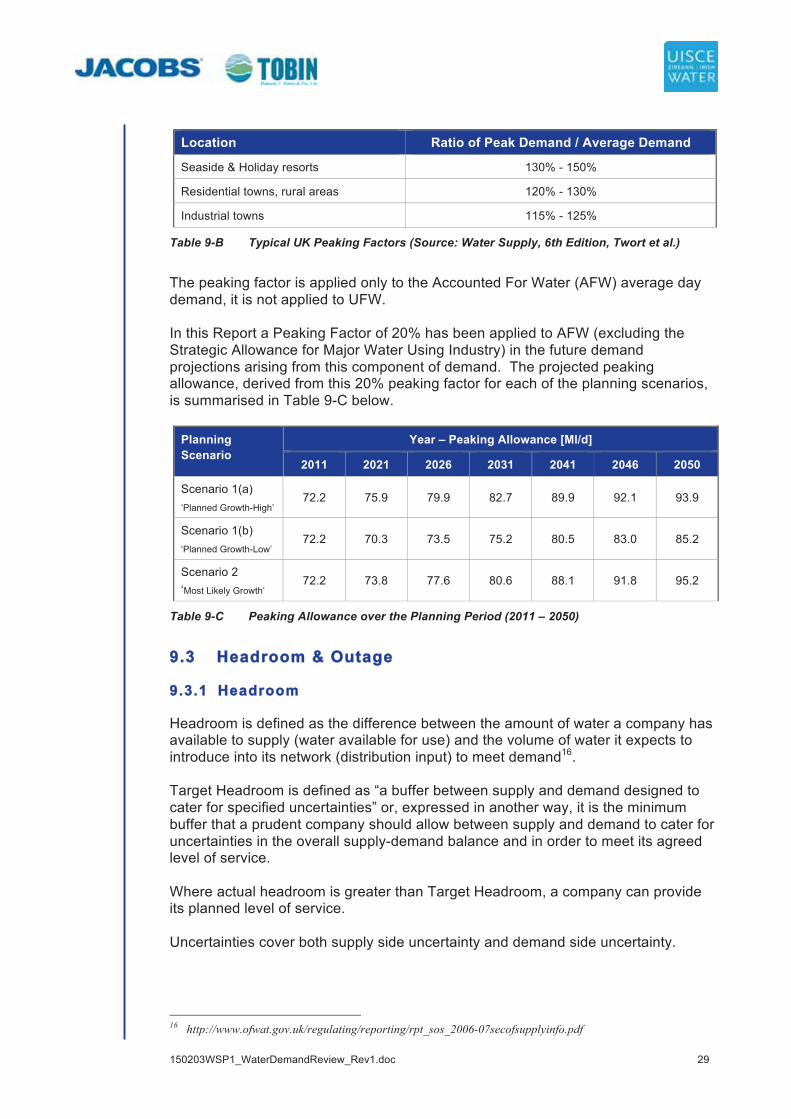
Location Ratio of Peak Demand / Average Demand
Seaside & Holiday resorts 130% - 150%
Residential towns, rural areas 120% - 130%
Industrial towns 115% - 125%
Table 9-B Typical UK Peaking Factors (Source: Water Supply, 6th Edition, Twort et al.)
The peaking factor is applied only to the Accounted For Water (AFW) average day demand, it is not applied to UFW. In this Report a Peaking Factor of 20% has been applied to AFW (excluding the Strategic Allowance for Major Water Using Industry) in the future demand projections arising from this component of demand. The projected peaking allowance, derived from this 20% peaking factor for each of the planning scenarios, is summarised in Table 9-C below.
Planning Scenario
Year – Peaking Allowance [Ml/d]
2011 2021 2026 2031 2041 2046 2050
Scenario 1(a) ‘Planned Growth-High’
72.2 75.9 79.9 82.7 89.9 92.1 93.9
Scenario 1(b) ‘Planned Growth-Low’
72.2 70.3 73.5 75.2 80.5 83.0 85.2
Scenario 2 ‘Most Likely Growth’
72.2 73.8 77.6 80.6 88.1 91.8 95.2
Table 9-C Peaking Allowance over the Planning Period (2011 – 2050)
9.3 HHeadroom & Outage
9.3.1 HHeadroom
Headroom is defined as the difference between the amount of water a company has available to supply (water available for use) and the volume of water it expects to introduce into its network (distribution input) to meet demand16. Target Headroom is defined as “a buffer between supply and demand designed to cater for specified uncertainties” or, expressed in another way, it is the minimum buffer that a prudent company should allow between supply and demand to cater for uncertainties in the overall supply-demand balance and in order to meet its agreed level of service. Where actual headroom is greater than Target Headroom, a company can provide its planned level of service. Uncertainties cover both supply side uncertainty and demand side uncertainty.
16 http://www.ofwat.gov.uk/regulating/reporting/rpt_sos_2006-07secofsupplyinfo.pdf

150203WSP1_WaterDemandReview_Rev1.doc 30
Components of Supply side uncertainty typically include the following:
• Vulnerable surface/ground water abstraction licences • Gradual pollution of sources (causing a reduction in abstraction) • Accuracy of supply side data • Impact of climate change on source yields • Accuracy of assumptions for output from new source developments
Components of Demand side uncertainty typically include the following:
• Accuracy of sub-component data • Demand forecast variation • Impacts of climate change on demand • Success of demand management measures.
In England and Wales, the water companies undertake “Monte Carlo type” risk analysis of these uncertainties to arrive at a headroom allowance at each source. The necessary information on supply side and demand side uncertainty, to enable a risk based approach to be undertaken to determine this component of demand, is not yet available to Irish Water. Until a risk based approach can be developed it is therefore necessary to apply a working assumption for an allowance for headroom in the projections of future demand. Analysis of headroom allowances provided by water companies in England and Wales indicate typical values in the range of 5% - 10% of AFW. Values are generally at the higher end of this range. 9.3.2 OOutage
Outage is an additional allowance incorporated into the overall ‘headroom’ allowance to cover instances where the achievable output from treatment facilities falls below normal output. This can be for a variety of reasons, such as asset failures, planned maintenance, etc. Typical international figures for outage allowance range from 5% - 7.5% of AFW. The relative state of our water infrastructure brings with it increased risk of outage. 9.3.3 OOverall Headroom & Outage Margin
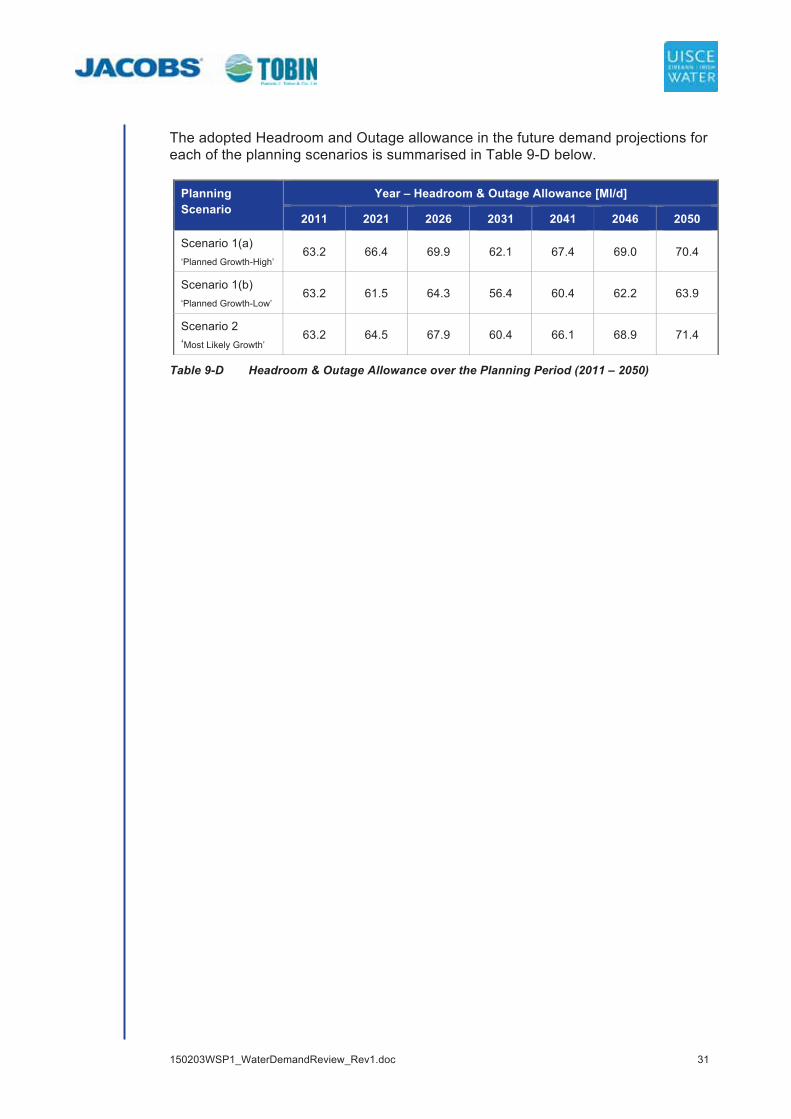
Combining allowances for headroom and outage, international figures typically range from 10% - 17.5% of AFW - average day demand. In the absence of a detailed quantitative analysis of headroom and outage requirements, and considering the current degree of uncertainty in supply side and demand side estimates, an overall allowance of 17.5% of AFW (excluding the strategic allowance for major water users) at base year 2011 has been included in the projections of future demand. This allowance for headroom and outage has been reduced to 15% of AFW at 2031, as a better understanding of the ‘uncertainties’ will be developed with time, and maintained at this level out to 2050.
150203WSP1_WaterDemandReview_Rev1.doc 31
The adopted Headroom and Outage allowance in the future demand projections for each of the planning scenarios is summarised in Table 9-D below.
Planning Scenario
Year – Headroom & Outage Allowance [Ml/d]
2011 2021 2026 2031 2041 2046 2050
Scenario 1(a) ‘Planned Growth-High’
63.2 66.4 69.9 62.1 67.4 69.0 70.4
Scenario 1(b) ‘Planned Growth-Low’
63.2 61.5 64.3 56.4 60.4 62.2 63.9
Scenario 2 ‘Most Likely Growth’
63.2 64.5 67.9 60.4 66.1 68.9 71.4
Table 9-D Headroom & Outage Allowance over the Planning Period (2011 – 2050)
150203WSP1_WaterDemandReview_Rev1.doc 32
10 Summary of Demand Assessment
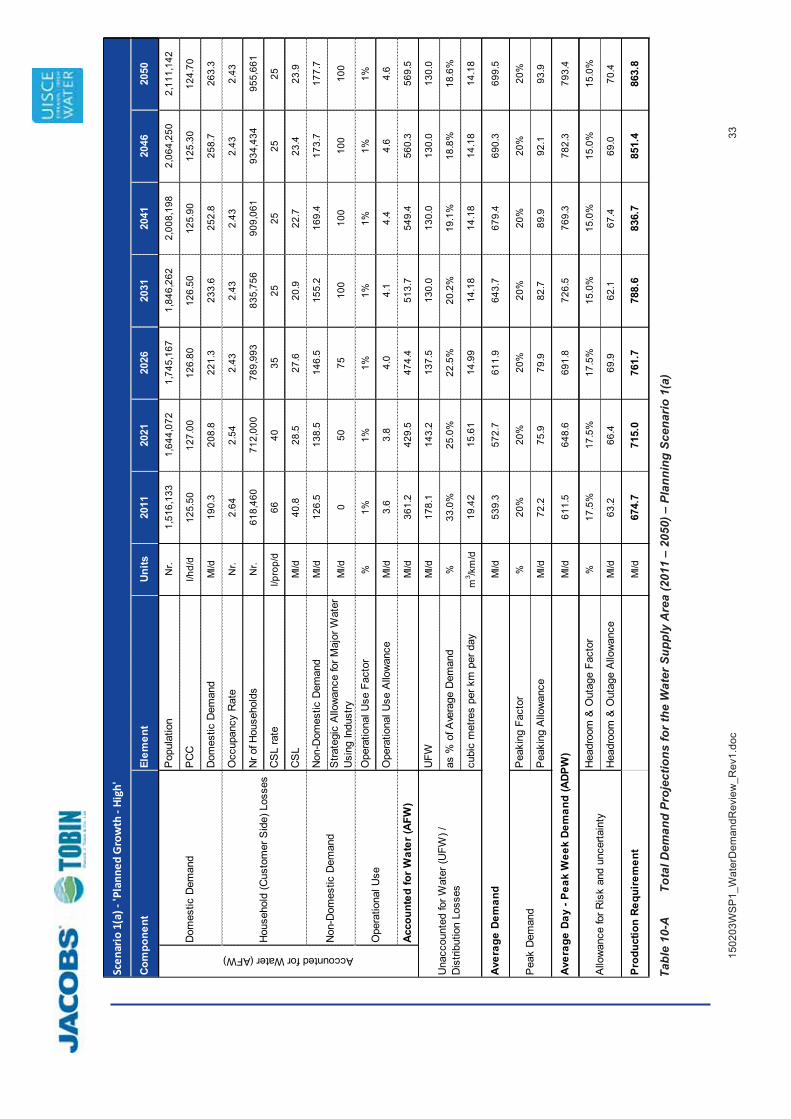
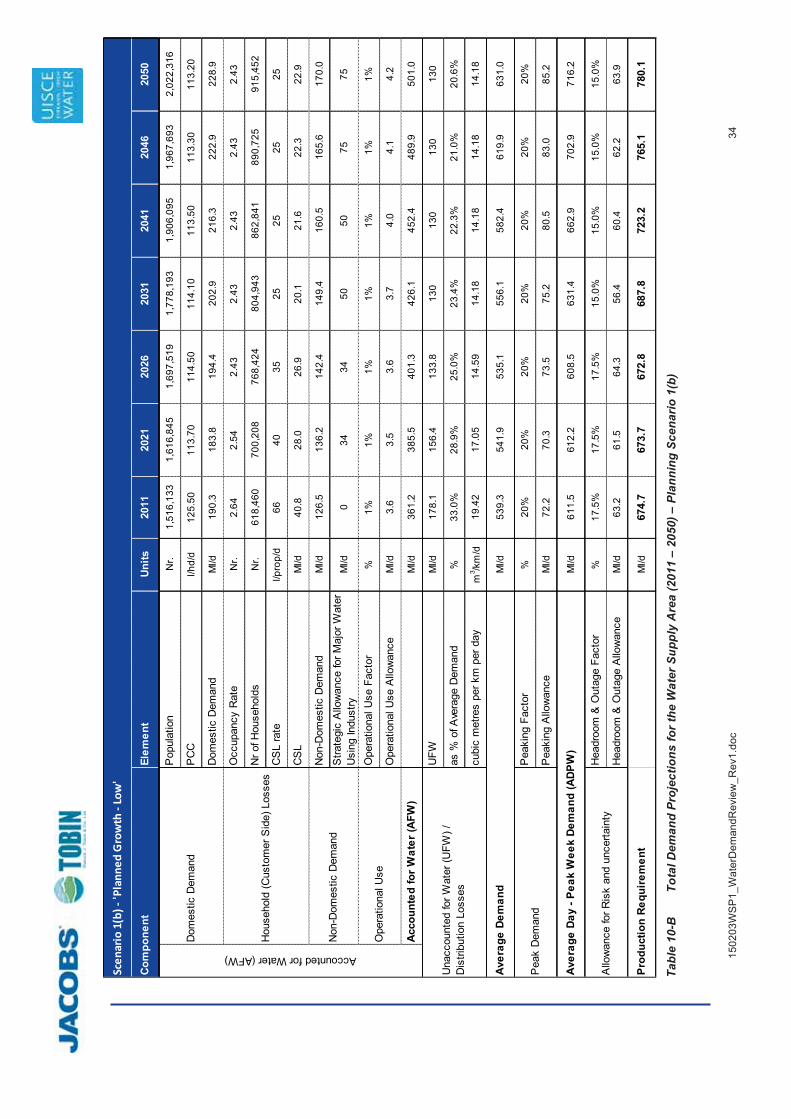
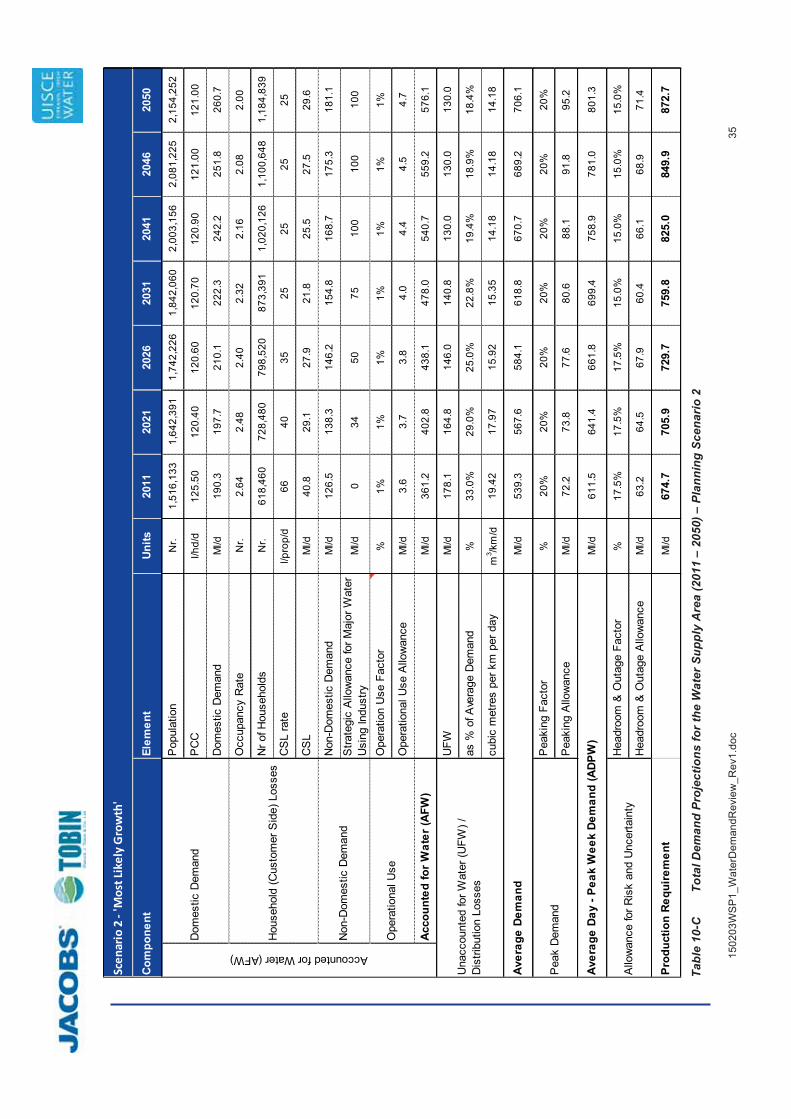
Tables 10-A, 10-B and 10-C present the summary of the assessment of sub-components of water demand. They present the projected future water demand of the Water Supply Area for each of the three planning scenarios. Values in the tables are provided in 5-year tranches over the planning period. The separate provision of water supply for potentially benefitting areas adjacent to a transmission system (from new source to terminal reservoir) is discussed in Section 13.
1502
03W
SP
1_W
ater
Dem
andR
evie
w_R
ev1.
doc
33
Elem
ent
Units
2011
2021
2026
2031
2041
2046
2050
Pop
ulat
ion
Nr.
1,51
6,13
31,
644,
072
1,74
5,16
71,
846,
262
2,00
8,19
82,
064,
250
2,11
1,14
2
PC
Cl/h
d/d
125.
5012
7.00
126.
8012
6.50
125.
9012
5.30
124.
70
Dom
estic
Dem
and
Ml/d
190.
320
8.8
221.
323
3.6
252.
825
8.7
263.
3
Occ
upan
cy R
ate
Nr.
2.64
2.54
2.43
2.43
2.43
2.43
2.43
Nr o
f Hou
seho
lds
Nr.
618,
460
712,
000
789,
993
835,
756
909,
061
934,
434
955,
661
CS
L ra
tel/p
rop/
d66
4035
2525
2525
CS
LM
l/d40
.828
.527
.620
.922
.723
.423
.9
Non
-Dom
estic
Dem
and
Ml/d
126.
513
8.5
146.
515
5.2
169.
417
3.7
177.
7
Stra
tegi
c A
llow
ance
for M
ajor
Wat
er
Usi
ng In
dust
ryM
l/d0
5075
100
100
100
100
Ope
ratio
nal U
se F
acto
r%
1%1%
1%1%
1%1%
1%
Ope
ratio
nal U
se A
llow
ance
Ml/d
3.6
3.8
4.0
4.1
4.4
4.6
4.6
Acco
unte
d fo
r Wat
er (A
FW)
Ml/d
361.
242
9.5
474.
451
3.7
549.
456
0.3
569.
5
UFW
Ml/d
178.
114
3.2
137.
513
0.0
130.
013
0.0
130.
0
as %
of A
vera
ge D
eman
d%
33.0
%25
.0%
22.5
%20
.2%
19.1
%18
.8%
18.6
%
cubi
c m
etre
s pe
r km
per
day
m3 /k
m/d
19.4
215
.61
14.9
914
.18
14.1
814
.18
14.1
8
Ml/d
539.
357
2.7
611.
964
3.7
679.
469
0.3
699.
5
Pea
king
Fac
tor
%20
%20
%20
%20
%20
%20
%20
%
Pea
king
Allo
wan
ceM
l/d72
.275
.979
.982
.789
.992
.193
.9
Ml/d
611.
564
8.6
691.
872
6.5
769.
378
2.3
793.
4
Hea
droo
m &
Out
age
Fact
or%
17.5
%17
.5%
17.5
%15
.0%
15.0
%15
.0%
15.0
%
Hea
droo
m &
Out
age
Allo
wan
ceM
l/d63
.266
.469
.962
.167
.469
.070
.4
Prod
uctio
n Re
quire
men
tM
l/d67
4.7
715.
076
1.7
788.
683
6.7
851.
486
3.8
Allo
wan
ce fo
r Ris
k an
d un
certa
inty
Com
pone
nt
Aver
age
Day
- Pea
k W
eek
Dem
and
(ADP
W)
Aver
age
Dem
and
Accounted for Water (AFW)
Dom
estic
Dem
and
Hou
seho
ld (C
usto
mer
Sid
e) L
osse
s
Non
-Dom
estic
Dem
and
Pea
k D
eman
d
Ope
ratio
nal U
se
Una
ccou
nted
for W
ater
(UFW
) /
Dis
tribu
tion
Loss
es
Ta
ble
10-A
To
tal D
eman
d Pr
ojec
tions
for t
he W
ater
Sup
ply
Are
a (2
011
– 20
50) –
Pla
nnin
g Sc
enar
io 1
(a)
1502
03W
SP
1_W
ater
Dem
andR
evie
w_R
ev1.
doc
34
Elem
ent
Units
2011
2021
2026
2031
2041
2046
2050
Pop
ulat
ion
Nr.
1,51
6,13
31,
616,
845
1,69
7,51
91,
778,
193
1,90
6,09
51,
967,
693
2,02
2,31
6
PC
Cl/h
d/d
125.
5011
3.70
114.
5011
4.10
113.
5011
3.30
113.
20
Dom
estic
Dem
and
Ml/d
190.
318
3.8
194.
420
2.9
216.
322
2.9
228.
9
Occ
upan
cy R
ate
Nr.
2.64
2.54
2.43
2.43
2.43
2.43
2.43
Nr o
f Hou
seho
lds
Nr.
618,
460
700,
208
768,
424
804,
943
862,
841
890,
725
915,
452
CS
L ra
tel/p
rop/
d66
4035
2525
2525
CS
LM
l/d40
.828
.026
.920
.121
.622
.322
.9
Non
-Dom
estic
Dem
and
Ml/d
126.
513
6.2
142.
414
9.4
160.
516
5.6
170.
0
Stra
tegi
c A
llow
ance
for M
ajor
Wat
er
Usi
ng In
dust
ryM
l/d0
3434
5050
7575
Ope
ratio
nal U
se F
acto
r%
1%1%
1%1%
1%1%
1%
Ope
ratio
nal U
se A
llow
ance
Ml/d
3.6
3.5
3.6
3.7
4.0
4.1
4.2
Acco
unte
d fo
r Wat
er (A
FW)
Ml/d
361.
238
5.5
401.
342
6.1
452.
448
9.9
501.
0
UFW
Ml/d
178.
115
6.4
133.
813
013
013
013
0
as %
of A
vera
ge D
eman
d%
33.0
%28
.9%
25.0
%23
.4%
22.3
%21
.0%
20.6
%
cubi
c m
etre
s pe
r km
per
day
m3 /k
m/d
19.4
217
.05
14.5
914
.18
14.1
814
.18
14.1
8
Ml/d
539.
354
1.9
535.
155
6.1
582.
461
9.9
631.
0
Pea
king
Fac
tor
%20
%20
%20
%20
%20
%20
%20
%
Pea
king
Allo
wan
ceM
l/d72
.270
.373
.575
.280
.583
.085
.2
Ml/d
611.
561
2.2
608.
563
1.4
662.
970
2.9
716.
2
Hea
droo
m &
Out
age
Fact
or%
17.5
%17
.5%
17.5
%15
.0%
15.0
%15
.0%
15.0
%
Hea
droo
m &
Out
age
Allo
wan
ceM
l/d63
.261
.564
.356
.460
.462
.263
.9
Prod
uctio
n Re
quire
men
tM
l/d67
4.7
673.
767
2.8
687.
872
3.2
765.
178
0.1
Aver
age
Dem
and
Pea
k D
eman
d
Aver
age
Day
- Pea
k W
eek
Dem
and
(ADP
W)
Allo
wan
ce fo
r Ris
k an
d un
certa
inty
Una
ccou
nted
for W
ater
(UFW
) /
Dis
tribu
tion
Loss
es
Com
pone
ntAccounted for Water (AFW)
Dom
estic
Dem
and
Hou
seho
ld (C
usto
mer
Sid
e) L
osse
s
Non
-Dom
estic
Dem
and
Ope
ratio
nal U
se
Ta
ble
10-B
To
tal D
eman
d Pr
ojec
tions
for t
he W
ater
Sup
ply
Are
a (2
011
– 20
50) –
Pla
nnin
g Sc
enar
io 1
(b)
1502
03W
SP
1_W
ater
Dem
andR
evie
w_R
ev1.
doc
35
Elem
ent
Units
2011
2021
2026
2031
2041
2046
2050
Pop
ulat
ion
Nr.
1,51
6,13
31,
642,
391
1,74
2,22
61,
842,
060
2,00
3,15
62,
081,
225
2,15
4,25
2
PC
Cl/h
d/d
125.
5012
0.40
120.
6012
0.70
120.
9012
1.00
121.
00
Dom
estic
Dem
and
Ml/d
190.
319
7.7
210.
122
2.3
242.
225
1.8
260.
7
Occ
upan
cy R
ate
Nr.
2.64
2.48
2.40
2.32
2.16
2.08
2.00
Nr o
f Hou
seho
lds
Nr.
618,
460
728,
480
798,
520
873,
391
1,02
0,12
61,
100,
648
1,18
4,83
9
CS
L ra
tel/p
rop/
d66
4035
2525
2525
CS
LM
l/d40
.829
.127
.921
.825
.527
.529
.6
Non
-Dom
estic
Dem
and
Ml/d
126.
513
8.3
146.
215
4.8
168.
717
5.3
181.
1
Stra
tegi
c A
llow
ance
for M
ajor
Wat
er
Usi
ng In
dust
ryM
l/d0
3450
7510
010
010
0
Ope
ratio
n U
se F
acto
r%
1%1%
1%1%
1%1%
1%
Ope
ratio
nal U
se A
llow
ance
Ml/d
3.6
3.7
3.8
4.0
4.4
4.5
4.7
Acco
unte
d fo
r Wat
er (A
FW)
Ml/d
361.
240
2.8
438.
147
8.0
540.
755
9.2
576.
1
UFW
Ml/d
178.
116
4.8
146.
014
0.8
130.
013
0.0
130.
0
as %
of A
vera
ge D
eman
d%
33.0
%29
.0%
25.0
%22
.8%
19.4
%18
.9%
18.4
%
cubi
c m
etre
s pe
r km
per
day
m3 /k
m/d
19.4
217
.97
15.9
215
.35
14.1
814
.18
14.1
8
Ml/d
539.
356
7.6
584.
161
8.8
670.
768
9.2
706.
1
Pea
king
Fac
tor
%20
%20
%20
%20
%20
%20
%20
%
Pea
king
Allo
wan
ceM
l/d72
.273
.877
.680
.688
.191
.895
.2
Ml/d
611.
564
1.4
661.
869
9.4
758.
978
1.0
801.
3
Hea
droo
m &
Out
age
Fact
or%
17.5
%17
.5%
17.5
%15
.0%
15.0
%15
.0%
15.0
%
Hea
droo
m &
Out
age
Allo
wan
ceM
l/d63
.264
.567
.960
.466
.168
.971
.4
Prod
uctio
n Re
quire
men
tM
l/d67
4.7
705.
972
9.7
759.
882
5.0
849.
987
2.7
Aver
age
Dem
and
Pea
k D
eman
d
Aver
age
Day
- Pea
k W
eek
Dem
and
(ADP
W)
Allo
wan
ce fo
r Ris
k an
d U
ncer
tain
ty
Una
ccou
nted
for W
ater
(UFW
) /
Dis
tribu
tion
Loss
es
Com
pone
ntAccounted for Water (AFW)
Dom
estic
Dem
and
Hou
seho
ld (C
usto
mer
Sid
e) L
osse
s
Non
-Dom
estic
Dem
and
Ope
ratio
nal U
se
Ta
ble
10-C
To
tal D
eman
d Pr
ojec
tions
for t
he W
ater
Sup
ply
Are
a (2
011
– 20
50) –
Pla
nnin
g Sc
enar
io 2
150203WSP1_WaterDemandReview_Rev1.doc 36
11 Assessment of Existing Dublin Sources
The Water Supply Area is supplied with potable water from Water Treatment Plants (WTP) located at:
• Ballymore Eustace, treating water from the Upper River Liffey. • Leixlip, treating water from the Middle River Liffey. • Vartry (near Roundwood), treating water from the Vartry impoundments. • Ballyboden, treating water from the River Dodder. • Srowland (near Athy), a newly commissioned plant treating water from the
River Barrow.
The main WTP listed above are supplemented by three smaller water treatment plants located at:
• Bog of the Ring, Fingal, treating groundwater & supplementing the Leixlip supply;
• Rathangan Wellfield, Kildare, treating groundwater & supplementing the Srowland supply; and
• Monasterevin Wellfield, Kildare, treating groundwater & supplementing the Srowland supply.
Figure 11-A shows the location of each of these water treatment plants.

150203WSP1_WaterDemandReview_Rev1.doc 37
Fig 11-A Location of Existing Water Treatment Plants in the Water Supply Area
These water treatment plants have a maximum potential combined treatment capacity (i.e the maximum total volume of water these plants are capable of treating) of 658 Ml/d. However, because of current constraints at a number of the treatment plants and bottlenecks in the supply network, this production capacity does not translate into an ability to deliver this volume of water (the deployable output), or to an equal availability of supply across the Water Supply Area. The Vartry supply (built in 1865-70) is particularly vulnerable, both as regards the treatment plant and the transfer system to Dublin. The Srowland supply can deliver water to the mid-Kildare area at present, but network interconnectivity from Old

150203WSP1_WaterDemandReview_Rev1.doc 38
Kilcullen Reservoir may need to be improved to make that supply more deployable to the wider Water Supply Network. Table 11-A outlines the current and projected production/deployable capacities of the water treatment plants. Water Treatment Plant Production Capacity / Deployable Output (Ml/d)
2011 2015 2022 2026
Ballymore Eustace 310 310 310 310
Leixlip 148 215 215 215
Vartry 65 65 75 75
Ballyboden 12 12 12 12
Srowland 0 13 13 38
Bog of the Ring 3 3 3 3
Rathangan Wellfield 3 3 3 3
Monasterevin Wellfield 2 2 2 2
Total 543 623 633 658
Table 11-A Production Capacity / Deployable Output of existing Water Treatment Plants
The maximum sustainable availability of water from the River Liffey is 533 Ml/d17, comprised of 318 Ml/d from Ballymore Eustace (BME) and 215 Ml/d from Leixlip. BME has recently been upgraded to nominal 318Ml/d maximum treatment capacity, however the deployable output to the Dublin area is currently limited to 310 Ml/d. Commissioning work on the upgrade of Leixlip WTP to 215 Ml/d maximum treatment capacity was completed in 2014. Planned upgrade works on the Vartry system are due for completion in 2022. This report assumes that all existing treatment plants will be capable of treating and delivering into supply, the maximum historic sustainable yield of their sources by 2026.
17 Based on the historic drought of 1975 – 1976.

150203WSP1_WaterDemandReview_Rev1.doc 39
12 Water Supply Area Demand / Supply Balance
International practice requires that “Average Day Peak Week” (ADPW), or peak demand, be taken as the design basis for water distribution infrastructure. A prudent water supply company should also allow a buffer (headroom) between supply and demand to cater for uncertainties in the overall supply-demand balance to ensure that it meets its agreed levels of service. The ADPW demand, plus the allowance for headroom is the total Production Requirement. Table 12-A summarises the Demand / Supply Balance over the planning period (2011 – 2050) for the Water Supply Area. The demand projections illustrated are based on the Most Likely Growth Scenario (planning scenario 2).
Year Production Capacity / Deployable Output Existing Sources
[Ml/d]
ADPW Demand [Ml/d]
Production Requirement [Ml/d]
2011 543 611.5 674.7
2021 623 673.8 705.9
2026 658 661.8 729.7
2031 658 699.4 759.8
2041 658 758.9 825.0
2046 658 781.0 849.9
2050 658 801.3 872.7
Table 12-A Demand / Supply Balance in the Water Supply Area over the planning period (2011 – 2050) – Planning Scenario 2 (Most Likely Growth)
It is clear from examination of the above table, that the sustainable production of the existing sources is not capable of meeting the Production Requirement for the Water Supply Area currently or at any stage of the planning period. The demand / supply balance is currently in deficit when minimum headroom and outage allowances are made. By 2026, the date assumed in this report by which all existing treatment plants will be capable of treating and delivering into supply the maximum historic sustainable yield of their source, the projected demand / supply deficit under planning scenario 2 will be 71.7 Ml/d, and by 2050 this is projected to grow to 214.7 Ml/d.
150203WSP1_WaterDemandReview_Rev1.doc 40
13 Benefitting Corridors Demand / Supply Balance
13.1 IIntroduction
As previously noted, a transfer pipeline, from a new source to a Terminal Reservoir near or in the Water Supply Area, could effectively function as a ‘national water spine’; providing the opportunity to consolidate existing water treatment plants and improve resilience of supply networks, in a drive towards equality of service standards for all citizens. To support this national context, Jacobs-Tobin first sought to identify areas which would benefit from this provision, and then to estimated projected water demand for these areas as a sub-component to the overall water demand requirement of the Combined Water Supply Area. The estimation methodology applied to projection of water demand for benefitting areas is outlined below. 13.2 DDemand Estimation Methodology
The demand estimation methodology applied to the benefitting corridor comprised two elements:
• Determination of water ‘demand’ realised through the replacement of existing stressed and/or vulnerable water supplies with that from a transfer pipeline.
• Estimation of projected water demand of areas where new or additional water supply is being, or is projected to be, sought.
Existing ‘Demand’ Assessment of stressed and/or vulnerable water supplies was carried out via strategic review with Irish Water. The findings of this review are presented subsequently. Additional Demand From a base year 2011, additional water demand was sourced through review of available County Council Assessment of Needs Reports (as produced in support of previous Water Services Investment Programs). Drawing upon the assumptions underlying projection of water demand within the Water Supply Area, the projection of the sub-components of water demand within benefitting corridors was undertaken as follows:
• Population growth – average annual growth of 0.67% (between 2011 – 2050) for Midlands extracted from the Demographic Report.
• Non-domestic growth assumed to grow in-line with population. • Leakage then deducted to give estimate of existing Accounted for Water
(AFW) • AFW then grown at 0.67% per annum to 2050 • Leakage calculated as a % of AFW on sliding annual scale to 25% at 2050 • Peaking factor of 20% of AFW included • Headroom factor of 17.5% of AFW included.
150203WSP1_WaterDemandReview_Rev1.doc 41
Projected water demand estimates were then combined into a total figure at the 2050 design horizon. Estimates have been produced for a potential Benefitting Corridor for both a new water source from the Shannon and new water source from the Irish Sea (Desalination) due to the eastern and western ‘boundaries’ that these large water bodies present. These differ in the benefitting areas defined by a pipeline commencing at their shorelines. 13.2.1 AAssessment of existing sources
Current level of water into supply networks was sourced from information made available by the Environmental Protection Agency (EPA) & IW. 13.3 BBenefitting Areas
Benefitting areas identified through this study as presented in Figure 13-A below.
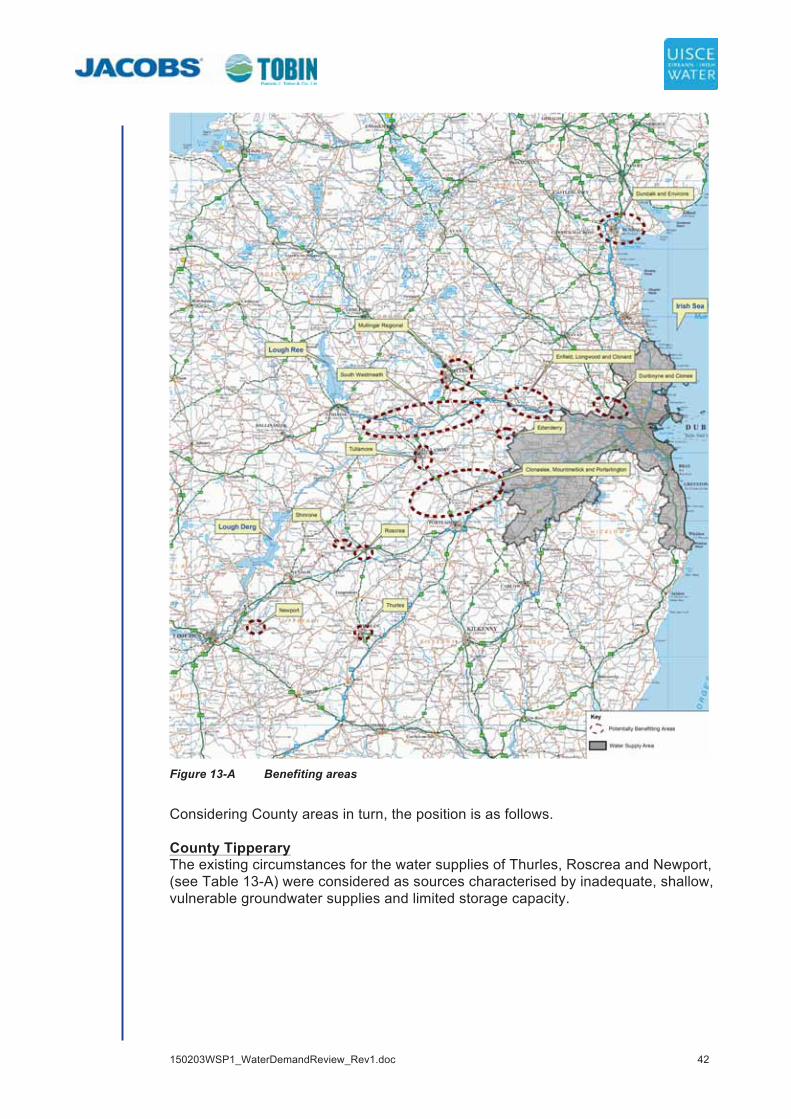
150203WSP1_WaterDemandReview_Rev1.doc 42
Figure 13-A Benefiting areas
Considering County areas in turn, the position is as follows. County Tipperary The existing circumstances for the water supplies of Thurles, Roscrea and Newport, (see Table 13-A) were considered as sources characterised by inadequate, shallow, vulnerable groundwater supplies and limited storage capacity.
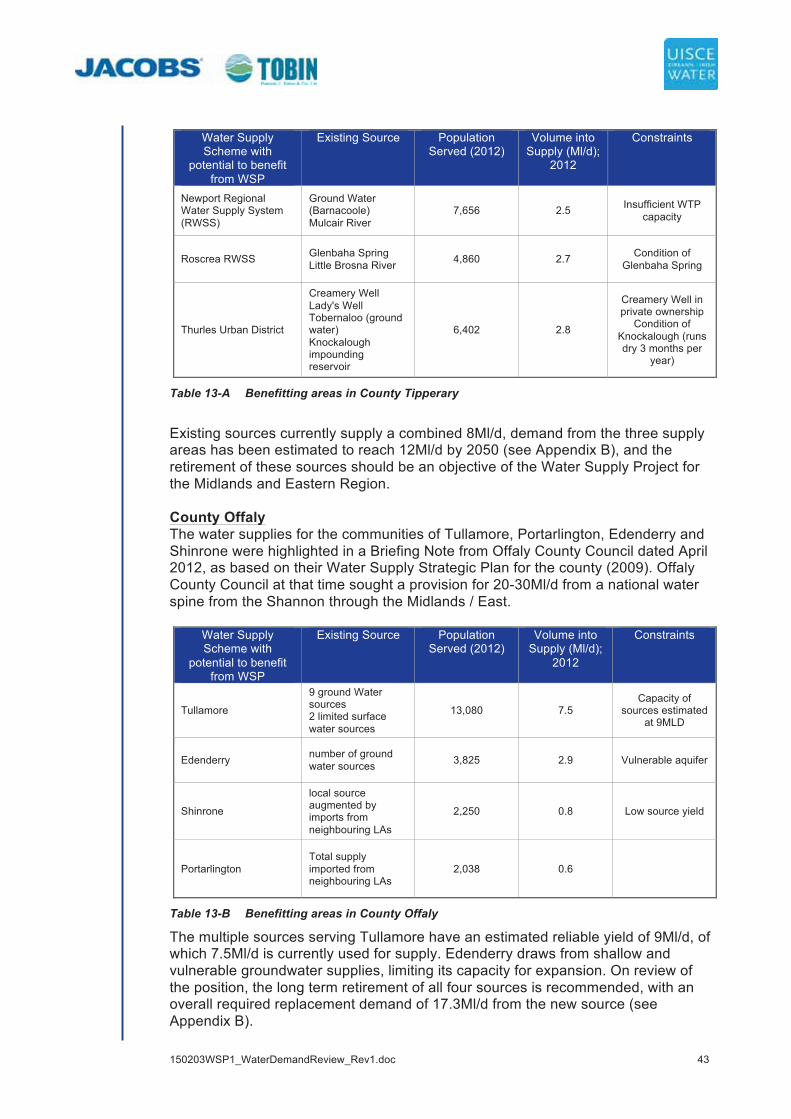
150203WSP1_WaterDemandReview_Rev1.doc 43
Water Supply Scheme with
potential to benefit from WSP
Existing Source Population Served (2012)
Volume into Supply (Ml/d);
2012
Constraints
Newport Regional Water Supply System (RWSS)
Ground Water (Barnacoole) Mulcair River
7,656 2.5 Insufficient WTP capacity
Roscrea RWSS Glenbaha Spring Little Brosna River 4,860 2.7 Condition of
Glenbaha Spring
Thurles Urban District
Creamery Well Lady's Well Tobernaloo (ground water) Knockalough impounding reservoir
6,402 2.8
Creamery Well in private ownership
Condition of Knockalough (runs dry 3 months per
year)
Table 13-A Benefitting areas in County Tipperary
Existing sources currently supply a combined 8Ml/d, demand from the three supply areas has been estimated to reach 12Ml/d by 2050 (see Appendix B), and the retirement of these sources should be an objective of the Water Supply Project for the Midlands and Eastern Region. County Offaly The water supplies for the communities of Tullamore, Portarlington, Edenderry and Shinrone were highlighted in a Briefing Note from Offaly County Council dated April 2012, as based on their Water Supply Strategic Plan for the county (2009). Offaly County Council at that time sought a provision for 20-30Ml/d from a national water spine from the Shannon through the Midlands / East.
Water Supply Scheme with
potential to benefit from WSP
Existing Source Population Served (2012)
Volume into Supply (Ml/d);
2012
Constraints
Tullamore
9 ground Water sources 2 limited surface water sources
13,080 7.5 Capacity of
sources estimated at 9MLD
Edenderry number of ground water sources 3,825 2.9 Vulnerable aquifer
Shinrone
local source augmented by imports from neighbouring LAs
2,250 0.8 Low source yield
Portarlington Total supply imported from neighbouring LAs
2,038 0.6
Table 13-B Benefitting areas in County Offaly
The multiple sources serving Tullamore have an estimated reliable yield of 9Ml/d, of which 7.5Ml/d is currently used for supply. Edenderry draws from shallow and vulnerable groundwater supplies, limiting its capacity for expansion. On review of the position, the long term retirement of all four sources is recommended, with an overall required replacement demand of 17.3Ml/d from the new source (see Appendix B).
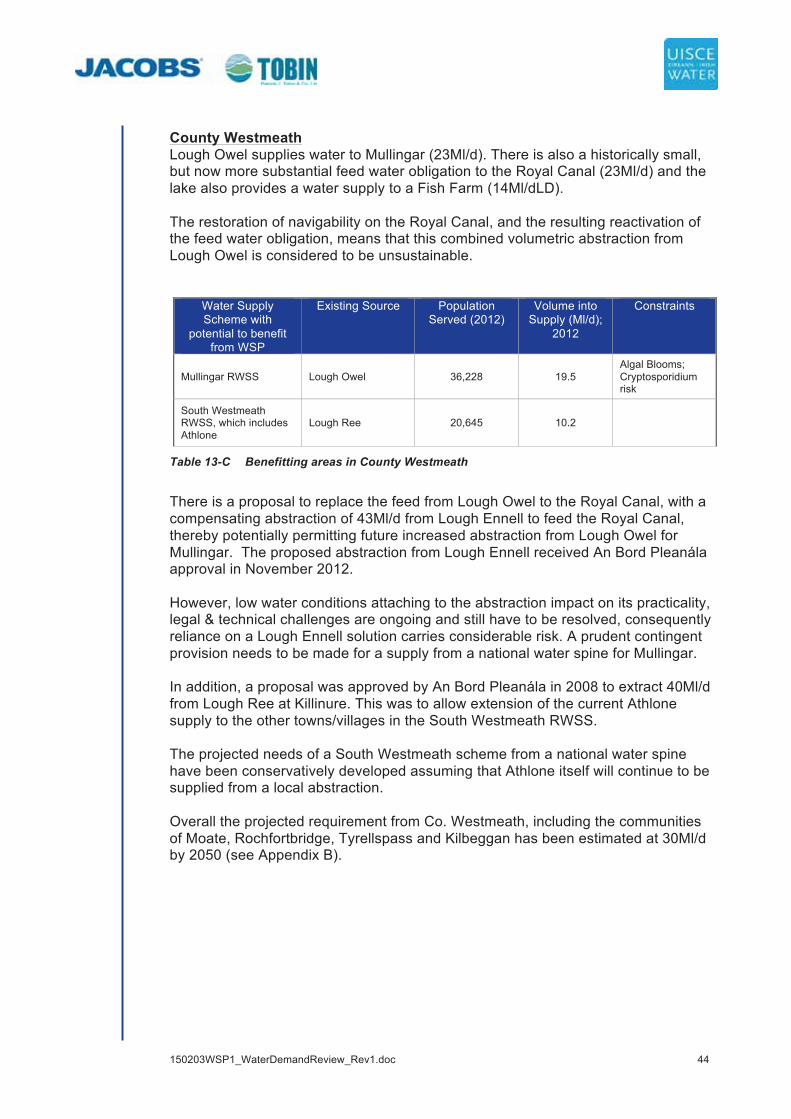
150203WSP1_WaterDemandReview_Rev1.doc 44
County Westmeath Lough Owel supplies water to Mullingar (23Ml/d). There is also a historically small, but now more substantial feed water obligation to the Royal Canal (23Ml/d) and the lake also provides a water supply to a Fish Farm (14Ml/dLD). The restoration of navigability on the Royal Canal, and the resulting reactivation of the feed water obligation, means that this combined volumetric abstraction from Lough Owel is considered to be unsustainable.
Water Supply Scheme with
potential to benefit from WSP
Existing Source Population Served (2012)
Volume into Supply (Ml/d);
2012
Constraints
Mullingar RWSS Lough Owel 36,228 19.5 Algal Blooms; Cryptosporidium risk
South Westmeath RWSS, which includes Athlone
Lough Ree 20,645 10.2
Table 13-C Benefitting areas in County Westmeath
There is a proposal to replace the feed from Lough Owel to the Royal Canal, with a compensating abstraction of 43Ml/d from Lough Ennell to feed the Royal Canal, thereby potentially permitting future increased abstraction from Lough Owel for Mullingar. The proposed abstraction from Lough Ennell received An Bord Pleanála approval in November 2012. However, low water conditions attaching to the abstraction impact on its practicality, legal & technical challenges are ongoing and still have to be resolved, consequently reliance on a Lough Ennell solution carries considerable risk. A prudent contingent provision needs to be made for a supply from a national water spine for Mullingar. In addition, a proposal was approved by An Bord Pleanála in 2008 to extract 40Ml/d from Lough Ree at Killinure. This was to allow extension of the current Athlone supply to the other towns/villages in the South Westmeath RWSS. The projected needs of a South Westmeath scheme from a national water spine have been conservatively developed assuming that Athlone itself will continue to be supplied from a local abstraction. Overall the projected requirement from Co. Westmeath, including the communities of Moate, Rochfortbridge, Tyrellspass and Kilbeggan has been estimated at 30Ml/d by 2050 (see Appendix B).
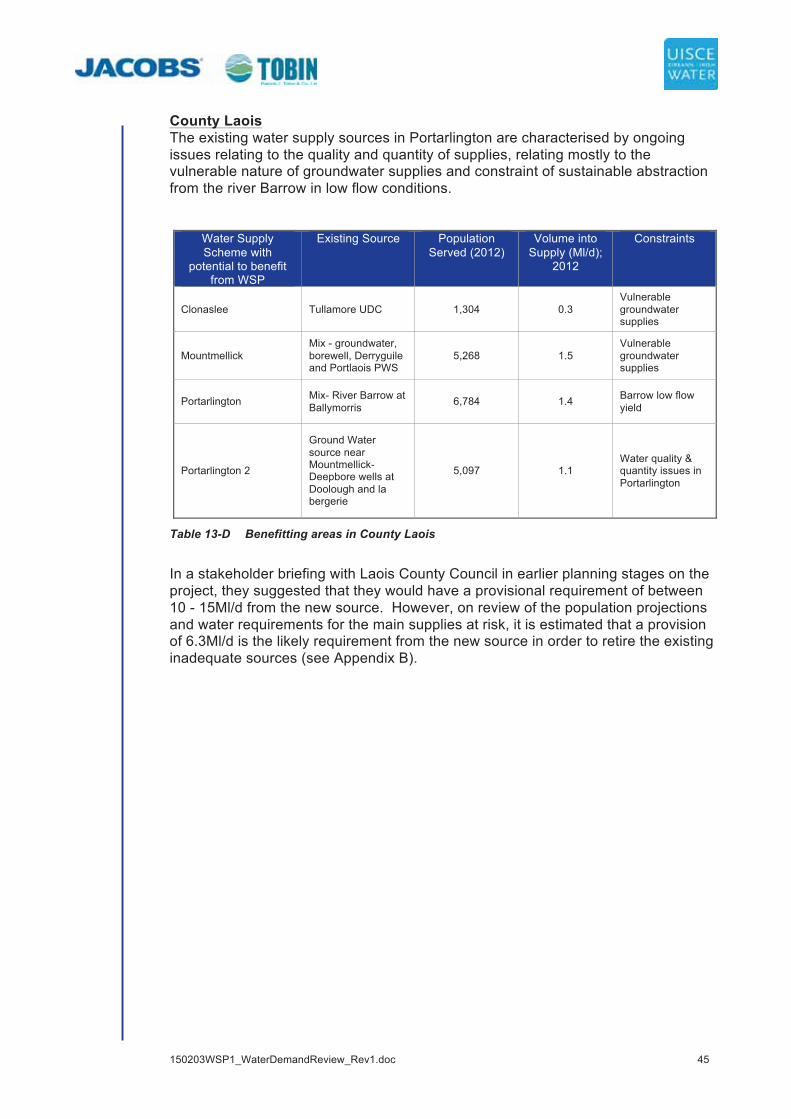
150203WSP1_WaterDemandReview_Rev1.doc 45
County Laois The existing water supply sources in Portarlington are characterised by ongoing issues relating to the quality and quantity of supplies, relating mostly to the vulnerable nature of groundwater supplies and constraint of sustainable abstraction from the river Barrow in low flow conditions.
Water Supply Scheme with
potential to benefit from WSP
Existing Source Population Served (2012)
Volume into Supply (Ml/d);
2012
Constraints
Clonaslee Tullamore UDC 1,304 0.3 Vulnerable groundwater supplies
Mountmellick Mix - groundwater, borewell, Derryguile and Portlaois PWS
5,268 1.5 Vulnerable groundwater supplies
Portarlington Mix- River Barrow at Ballymorris 6,784 1.4 Barrow low flow
yield
Portarlington 2
Ground Water source near Mountmellick- Deepbore wells at Doolough and la bergerie
5,097 1.1 Water quality & quantity issues in Portarlington
Table 13-D Benefitting areas in County Laois
In a stakeholder briefing with Laois County Council in earlier planning stages on the project, they suggested that they would have a provisional requirement of between 10 - 15Ml/d from the new source. However, on review of the population projections and water requirements for the main supplies at risk, it is estimated that a provision of 6.3Ml/d is the likely requirement from the new source in order to retire the existing inadequate sources (see Appendix B).
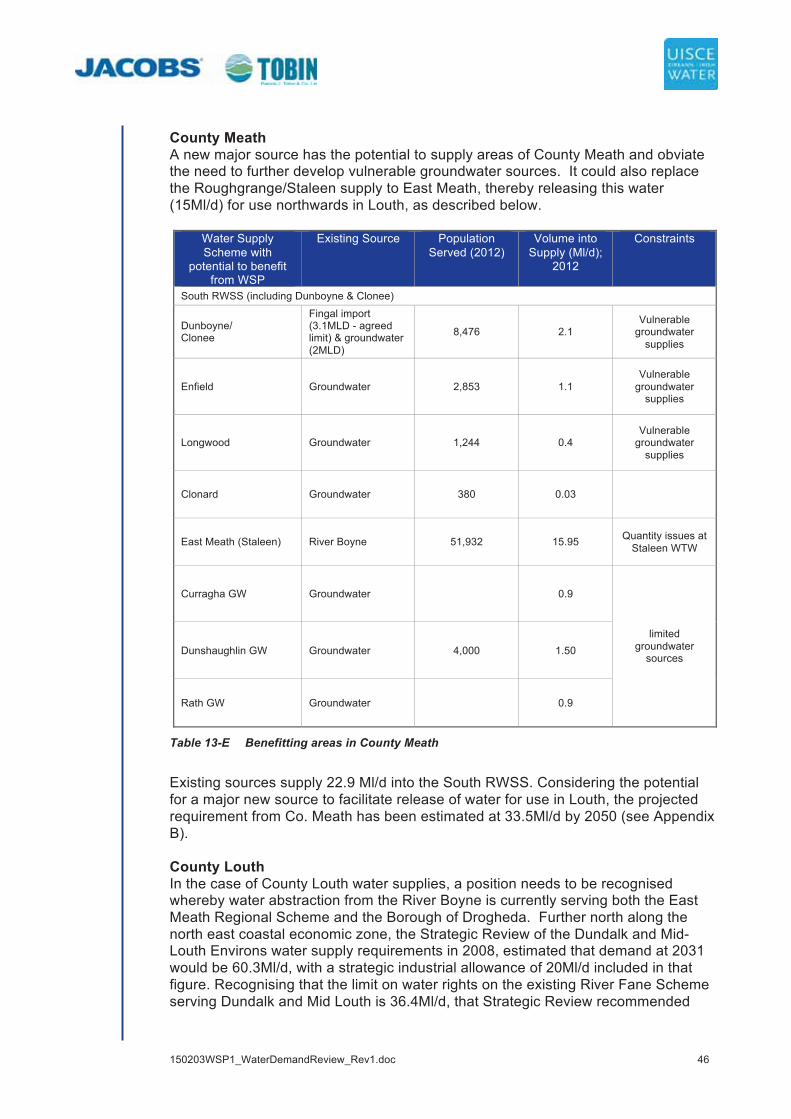
150203WSP1_WaterDemandReview_Rev1.doc 46
County Meath A new major source has the potential to supply areas of County Meath and obviate the need to further develop vulnerable groundwater sources. It could also replace the Roughgrange/Staleen supply to East Meath, thereby releasing this water (15Ml/d) for use northwards in Louth, as described below.
Water Supply Scheme with
potential to benefit from WSP
Existing Source Population Served (2012)
Volume into Supply (Ml/d);
2012
Constraints
South RWSS (including Dunboyne & Clonee)
Dunboyne/ Clonee
Fingal import (3.1MLD - agreed limit) & groundwater (2MLD)
8,476 2.1 Vulnerable
groundwater supplies
Enfield Groundwater 2,853 1.1 Vulnerable
groundwater supplies
Longwood Groundwater 1,244 0.4 Vulnerable
groundwater supplies
Clonard Groundwater 380 0.03
East Meath (Staleen) River Boyne 51,932 15.95 Quantity issues at Staleen WTW
Curragha GW Groundwater 0.9
limited groundwater
sources Dunshaughlin GW Groundwater 4,000 1.50
Rath GW Groundwater 0.9
Table 13-E Benefitting areas in County Meath
Existing sources supply 22.9 Ml/d into the South RWSS. Considering the potential for a major new source to facilitate release of water for use in Louth, the projected requirement from Co. Meath has been estimated at 33.5Ml/d by 2050 (see Appendix B). County Louth In the case of County Louth water supplies, a position needs to be recognised whereby water abstraction from the River Boyne is currently serving both the East Meath Regional Scheme and the Borough of Drogheda. Further north along the north east coastal economic zone, the Strategic Review of the Dundalk and Mid-Louth Environs water supply requirements in 2008, estimated that demand at 2031 would be 60.3Ml/d, with a strategic industrial allowance of 20Ml/d included in that figure. Recognising that the limit on water rights on the existing River Fane Scheme serving Dundalk and Mid Louth is 36.4Ml/d, that Strategic Review recommended
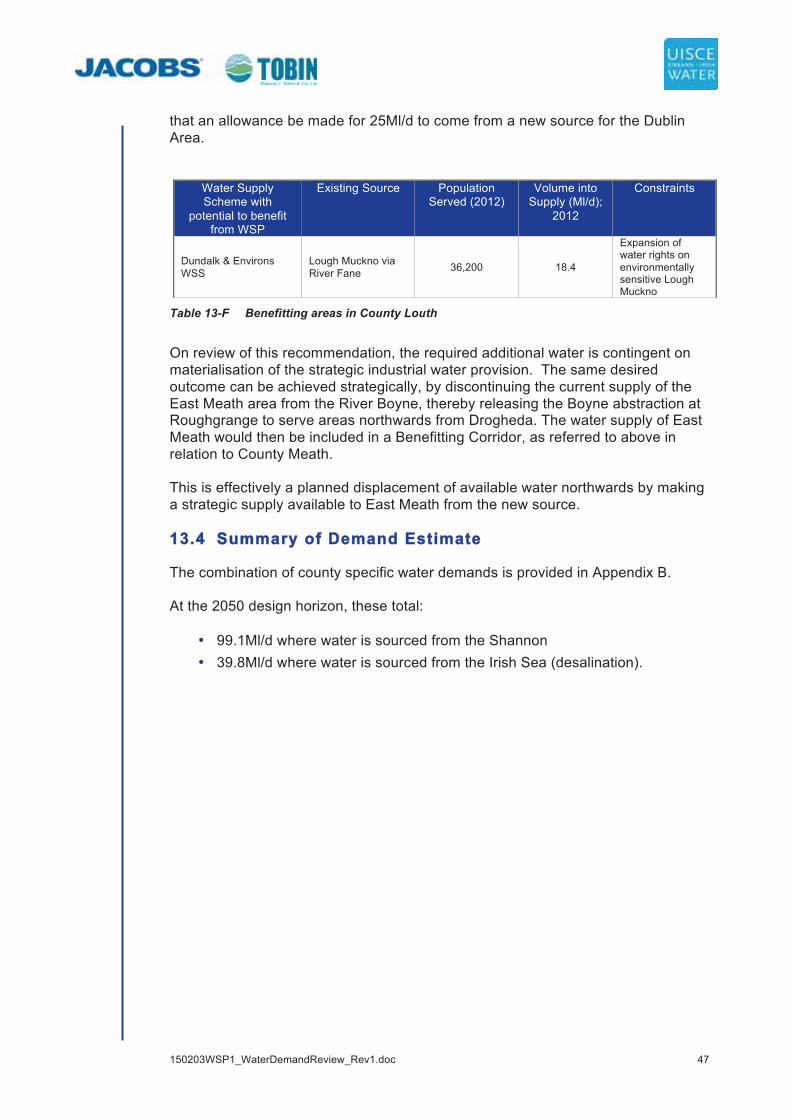
150203WSP1_WaterDemandReview_Rev1.doc 47
that an allowance be made for 25Ml/d to come from a new source for the Dublin Area.
Water Supply Scheme with
potential to benefit from WSP
Existing Source Population Served (2012)
Volume into Supply (Ml/d);
2012
Constraints
Dundalk & Environs WSS
Lough Muckno via River Fane 36,200 18.4
Expansion of water rights on environmentally sensitive Lough Muckno
Table 13-F Benefitting areas in County Louth
On review of this recommendation, the required additional water is contingent on materialisation of the strategic industrial water provision. The same desired outcome can be achieved strategically, by discontinuing the current supply of the East Meath area from the River Boyne, thereby releasing the Boyne abstraction at Roughgrange to serve areas northwards from Drogheda. The water supply of East Meath would then be included in a Benefitting Corridor, as referred to above in relation to County Meath. This is effectively a planned displacement of available water northwards by making a strategic supply available to East Meath from the new source. 13.4 SSummary of Demand Estimate
The combination of county specific water demands is provided in Appendix B. At the 2050 design horizon, these total:
• 99.1Ml/d where water is sourced from the Shannon • 39.8Ml/d where water is sourced from the Irish Sea (desalination).

150203WSP1_WaterDemandReview_Rev1.doc 48
14 Extent of New Supply Requirements
Future water demand projections for the Water Supply Area have been estimated for three planning scenarios out to year 2050 as follows:
• Planning Scenario 1(a) – ‘Planned Growth - High’ (Table 10-A); • Planning Scenario 1(b) – ‘Planned Growth - Low’, (Table 10-B); and • Planning Scenario 2 – ‘Most Likely Growth’ (Table 10-C).
Under the three planning scenarios examined the water production requirement for the Water Supply Area at 2050 ranges from 780 Ml/d to 873 Ml/d. Under planning scenario 2 – ‘Most Likely Growth’ the total production requirement for the Water Supply Area is projected to grow from a 2011 requirement of 674.7 Ml/d to 872.7 Ml/d by 2050. The existing water treatment plants, operating at the sustainable production of their sources, can deliver a maximum of 658 Ml/d into supply. This report has assumed that this maximum production capability from the existing water treatment plants will be available from 2026 onwards. At 2026, the demand / supply deficit for the Water Supply Area is projected under planning scenario 2 to be 71.7 Ml/d, and by 2050 this deficit is projected to grow to 214.7 Ml/d. In addition to the requirement of the Water Supply Area, a transfer pipeline, from a new source to a Terminal Reservoir near or in the Water Supply Area, would effectively function as a ‘national water spine’; providing the opportunity to consolidate existing small water treatment plants and improve resilience of supply networks, in a drive towards equality of service standards for all citizens. The additional potential supply requirements of a ‘benefitting corridor’ have been estimated, under a ‘most likely growth scenario’, at between 40 – 99 Ml/d depending on potential source of new supply. Therefore, the total production requirements of a new source supplying the Combined Water Supply Area under a Most Likely Scenario are projected at between 254.718 – 313.719 Ml/d at 2050. In order to provide treatment capacity of between 254.7– 313.7 Ml/d at a new water treatment plant (and acknowledging process water requirements in the treatment plant itself), it will be necessary to provide for an abstraction in the order of 267 – 329.5 Ml/d from a new source of supply. Total abstraction requirements are summarised and presented figuratively in Tables and Figures 14-A (Shannon Scheme) and 14-B (Desalination Scheme) below. 18 Water Supply Area deficit of 214.7 Ml/d plus Benefitting Corridor deficit of 40Ml/d (desalination plan from the Irish Sea) 19 Water Supply Area deficit of 214.7 Ml/d plus Benefitting Corridor deficit of 99Ml/d (abstraction from the Shannon)
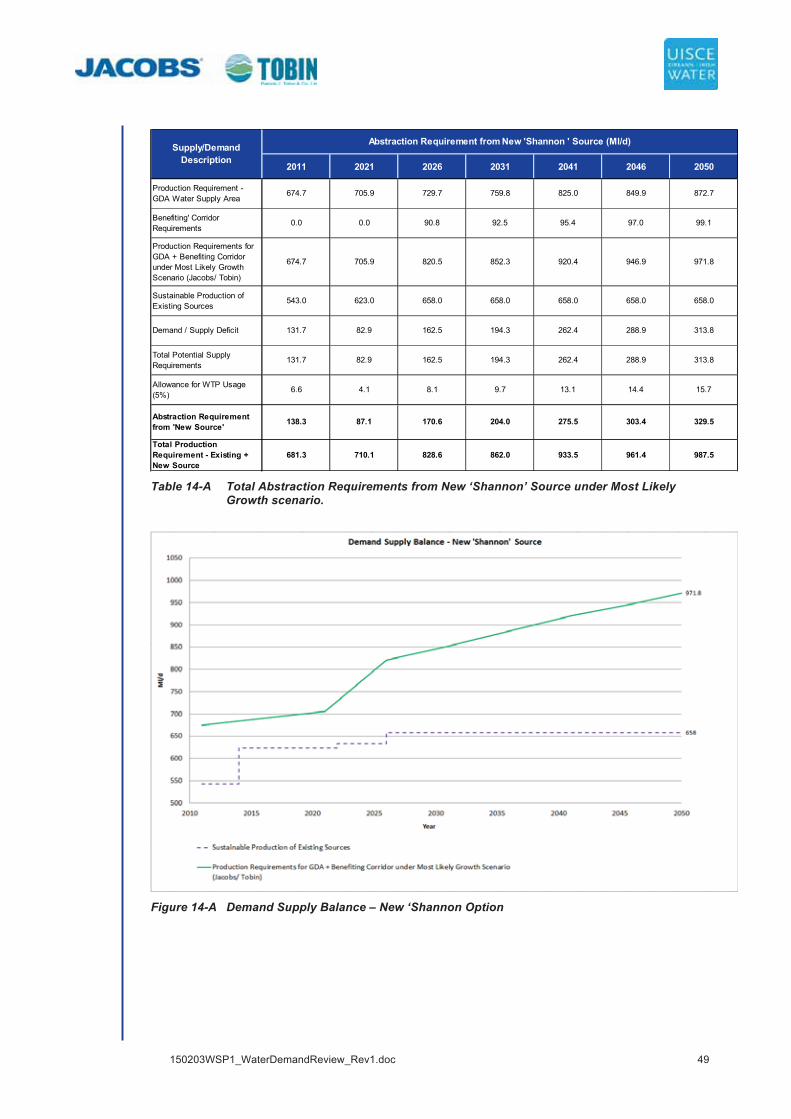
150203WSP1_WaterDemandReview_Rev1.doc 49
2011 2021 2026 2031 2041 2046 2050
Production Requirement - GDA Water Supply Area
674.7 705.9 729.7 759.8 825.0 849.9 872.7
Benefiting' Corridor Requirements
0.0 0.0 90.8 92.5 95.4 97.0 99.1
Production Requirements for GDA + Benefiting Corridor under Most Likely Growth Scenario (Jacobs/ Tobin)
674.7 705.9 820.5 852.3 920.4 946.9 971.8
Sustainable Production of Existing Sources
543.0 623.0 658.0 658.0 658.0 658.0 658.0
Demand / Supply Deficit 131.7 82.9 162.5 194.3 262.4 288.9 313.8
Total Potential Supply Requirements
131.7 82.9 162.5 194.3 262.4 288.9 313.8
Allowance for WTP Usage (5%)
6.6 4.1 8.1 9.7 13.1 14.4 15.7
Abstraction Requirement from 'New Source' 138.3 87.1 170.6 204.0 275.5 303.4 329.5
Total Production Requirement - Existing + New Source
681.3 710.1 828.6 862.0 933.5 961.4 987.5
Supply/Demand Description
Abstraction Requirement from New 'Shannon ' Source (Ml/d)
Table 14-A Total Abstraction Requirements from New ‘Shannon’ Source under Most Likely
Growth scenario.
Figure 14-A Demand Supply Balance – New ‘Shannon Option

150203WSP1_WaterDemandReview_Rev1.doc 50
2011 2021 2026 2031 2041 2046 2050
Production Requirement - GDA Water Supply Area
674.7 705.9 729.7 759.8 825.0 849.9 872.7
Benefiting' Corridor Requirements
0.0 0.0 36.4 37.1 38.3 39.0 39.8
Production Requirements for GDA + Benefiting Corridor under Most Likely Growth Scenario (Jacobs/ Tobin)
674.7 705.9 766.1 796.9 863.3 888.9 912.5
Sustainable Production of Existing Sources
543.0 623.0 658.0 658.0 658.0 658.0 658.0
Demand / Supply Deficit 131.7 82.9 108.1 138.9 205.3 230.9 254.5
Total Potential Supply Requirements
131.7 82.9 108.1 138.9 205.3 230.9 254.5
Allowance for WTP Usage (5%)
6.6 4.1 5.4 6.9 10.3 11.5 12.7
Abstraction Requirement from 'New Source' 138.3 87.1 113.5 145.8 215.6 242.5 267.3
Total Production Requirement - Existing + New Source
681.3 710.1 771.5 803.8 873.6 900.5 925.3
Supply/Demand Description
Abstraction Requirement from New 'Desalination ' Source (Ml/d)
Table 14-B Total Abstraction Requirements from New ‘Desalination’ Source under Most Likely
Growth scenario.
Figure 14-B Demand Supply Balance – New ‘Desalination’ Option

150203WSP1_WaterDemandReview_Rev1.doc
Appendix A
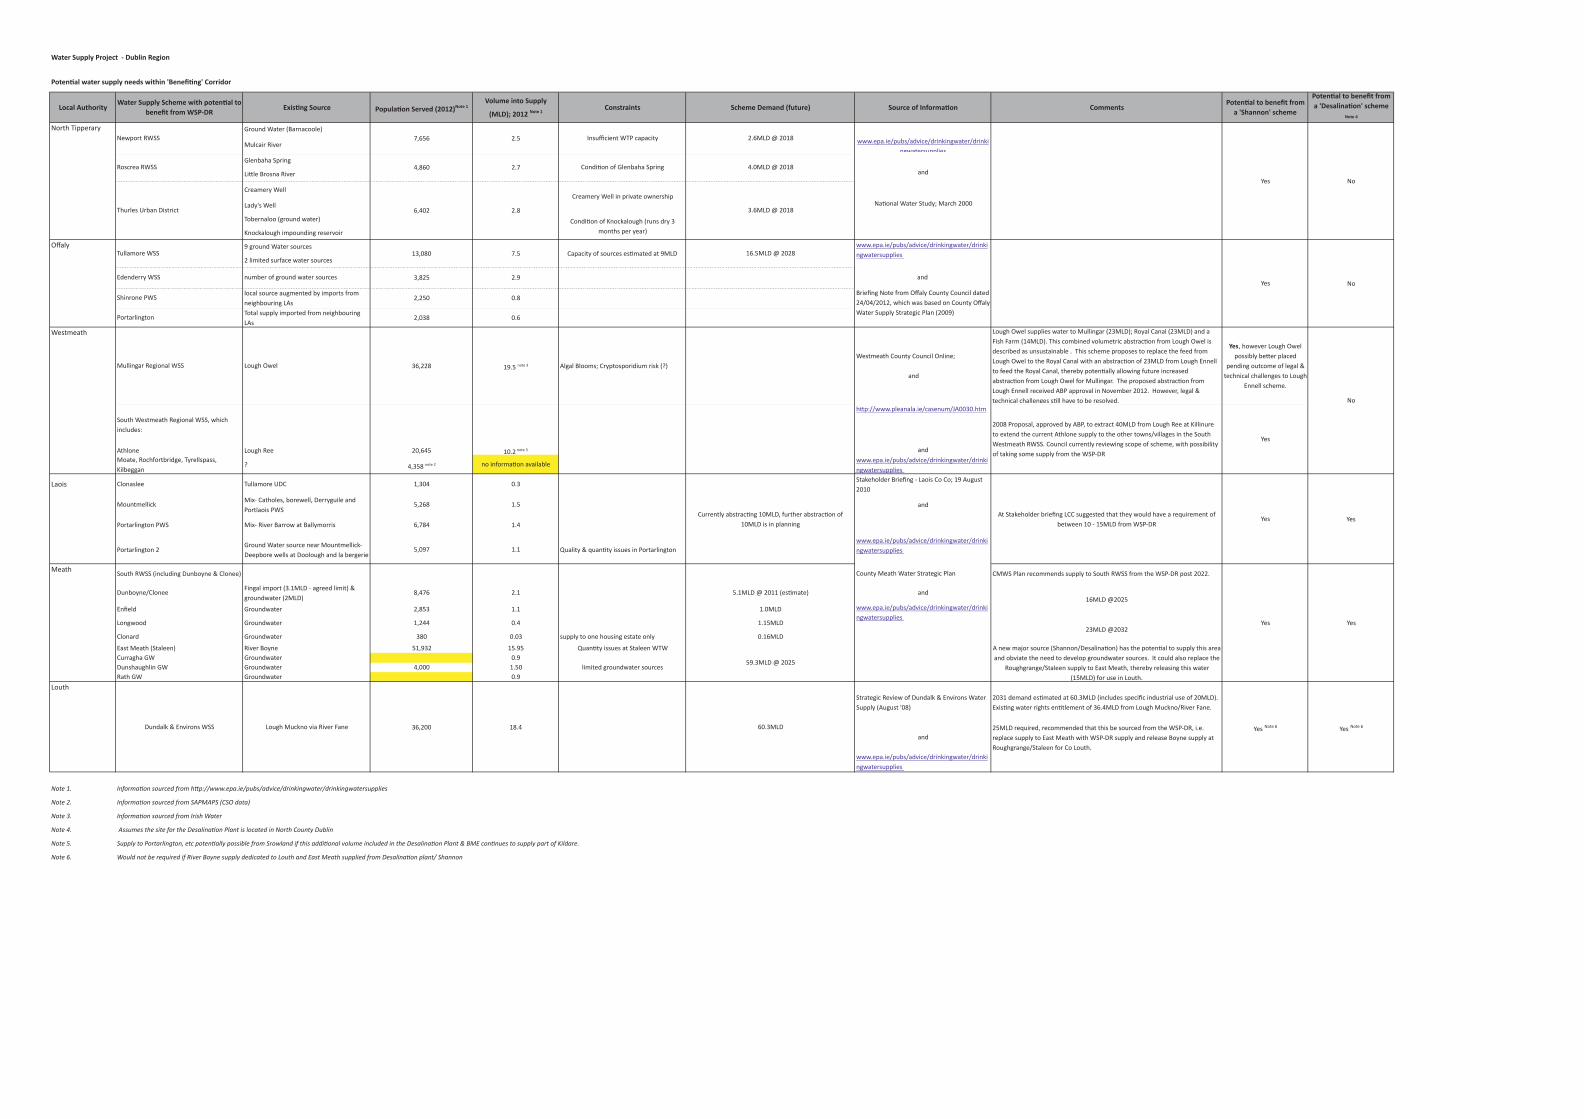


150203WSP1_WaterDemandReview_Rev1.doc
Appendix B
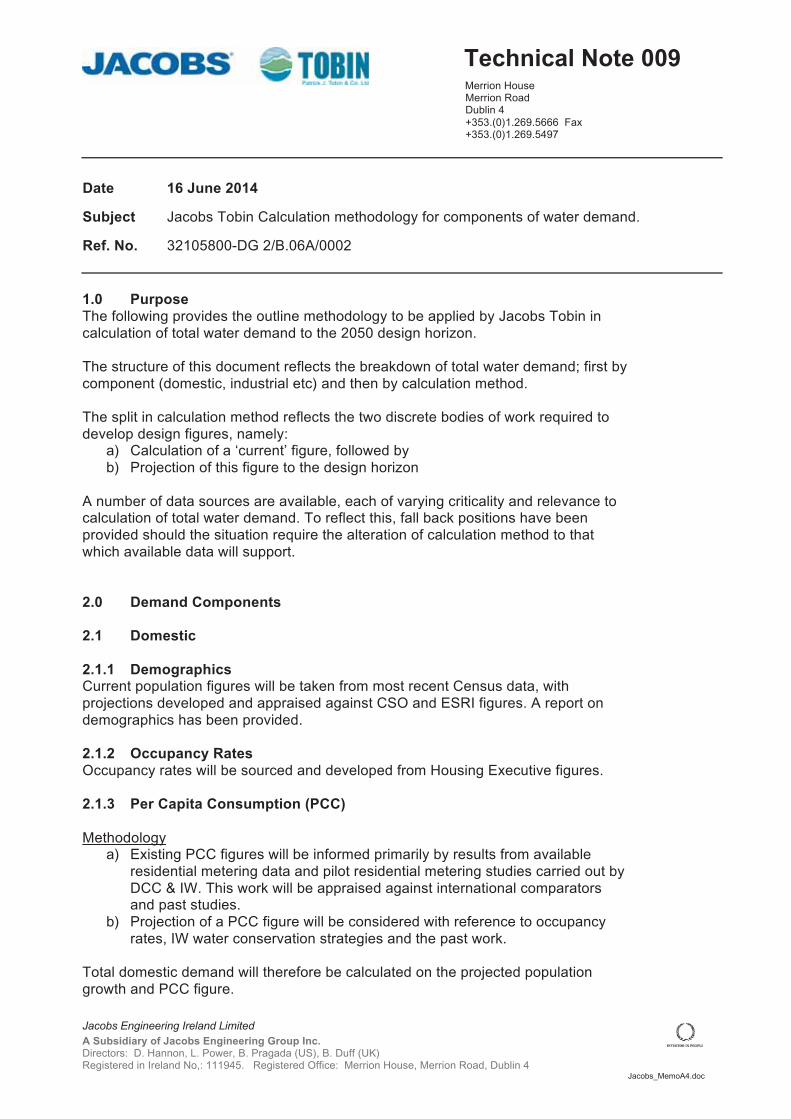
Merrion House Merrion Road Dublin 4 +353.(0)1.269.5666 Fax +353.(0)1.269.5497
Jacobs Engineering Ireland Limited A Subsidiary of Jacobs Engineering Group Inc. Directors: D. Hannon, L. Power, B. Pragada (US), B. Duff (UK) Registered in Ireland No,: 111945. Registered Office: Merrion House, Merrion Road, Dublin 4 Jacobs_MemoA4.doc
Technical Note 009
Date 16 June 2014
Subject Jacobs Tobin Calculation methodology for components of water demand.
Ref. No. 32105800-DG 2/B.06A/0002
1.0 Purpose The following provides the outline methodology to be applied by Jacobs Tobin in calculation of total water demand to the 2050 design horizon. The structure of this document reflects the breakdown of total water demand; first by component (domestic, industrial etc) and then by calculation method. The split in calculation method reflects the two discrete bodies of work required to develop design figures, namely:
a) Calculation of a ‘current’ figure, followed by b) Projection of this figure to the design horizon
A number of data sources are available, each of varying criticality and relevance to calculation of total water demand. To reflect this, fall back positions have been provided should the situation require the alteration of calculation method to that which available data will support. 2.0 Demand Components 2.1 Domestic 2.1.1 Demographics Current population figures will be taken from most recent Census data, with projections developed and appraised against CSO and ESRI figures. A report on demographics has been provided. 2.1.2 Occupancy Rates Occupancy rates will be sourced and developed from Housing Executive figures. 2.1.3 Per Capita Consumption (PCC) Methodology
a) Existing PCC figures will be informed primarily by results from available residential metering data and pilot residential metering studies carried out by DCC & IW. This work will be appraised against international comparators and past studies.
b) Projection of a PCC figure will be considered with reference to occupancy rates, IW water conservation strategies and the past work.
Total domestic demand will therefore be calculated on the projected population growth and PCC figure.

Technical Note 009 (Continued)
Page 2 of 4
Jacobs Engineering Ireland LimitedJacobs_MemoA4.doc
2.1.4 Customer Side Leakage (CSL) Nb. With CSL commonly referenced as a whole figure for each domestic connection, CSL will therefore be calculated as a per property figure. As a result CSL projection will be based in consideration of occupancy rates and property construction.
Methodology a) Existing CSL figures will be informed primarily by results from available
residential metering data and pilot residential metering studies carried out by DCC & IW. This assessment of CSL will be appraised against international comparators and relevant past studies.
b) Projection of CSL will be in two componentso Leakage per household will be developed from relevant studies.
supported by continued discussion with IW on water conservation strategies and reference to international comparators.
o Housing demand growth projections will then be aligned with %population growth scenarios based on a projected occupancy rate.
Total CSL will therefore be calculated on the housing demand growth and CSL per property figure.
2.2 Commercial/Retail
Methodology a) Existing commercial water demand will be extracted from the sorted and
categorised non-domestic metering records. b) Commercial water demand growth projections will then be aligned with %
population growth scenarios.
Sense Check • This projection of commercial demand will be sense checked against
available land currently zoned for commercial development (up to 2050). An average figure of usage per hectare (or similar), sourced from metering results, will be applied to the area of zoned lands and compared to projected scenarios.
2.2.1 Tourism Nb. Water use by tourists is considered to wholly manifest itself in metered usage in related commercial businesses. This will therefore not be a reported element of water demand in its own right due to its manifestation within metered commercial demand. However, anticipated growth rates here will be sense checked against anticipated commercial growth rates to ensure it can be comfortably assumed within the projected commercial demand.
Methodology a) Current and projected tourism figures will be sourced from Bord Failte
reports (or similar). b) Growth figures will be considered in relation to overall commercial demand
figures. Provided tourism growth does not constitute a significant proportion of commercial demand, these figures will be reported under commercial demand to ensure double counting does not occur.
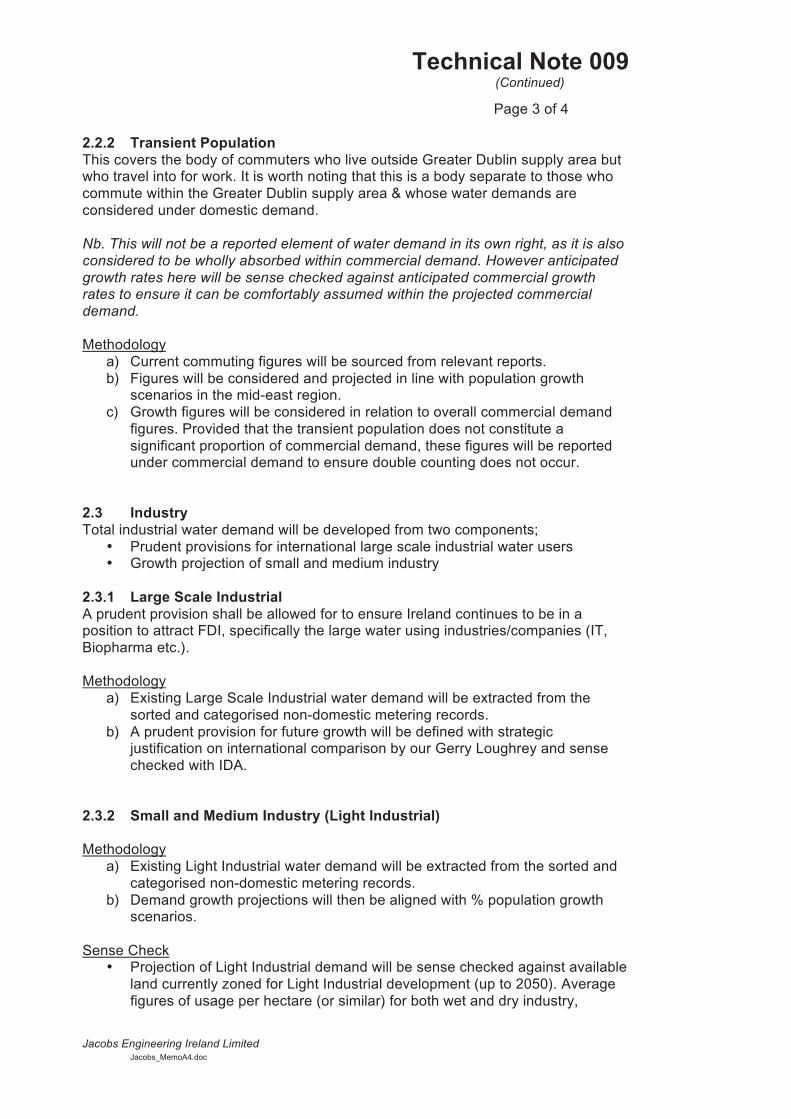
Technical Note 009 (Continued)
Page 3 of 4
Jacobs Engineering Ireland Limited Jacobs_MemoA4.doc
2.2.2 Transient Population This covers the body of commuters who live outside Greater Dublin supply area but who travel into for work. It is worth noting that this is a body separate to those who commute within the Greater Dublin supply area & whose water demands are considered under domestic demand. Nb. This will not be a reported element of water demand in its own right, as it is also considered to be wholly absorbed within commercial demand. However anticipated growth rates here will be sense checked against anticipated commercial growth rates to ensure it can be comfortably assumed within the projected commercial demand. Methodology
a) Current commuting figures will be sourced from relevant reports. b) Figures will be considered and projected in line with population growth
scenarios in the mid-east region. c) Growth figures will be considered in relation to overall commercial demand
figures. Provided that the transient population does not constitute a significant proportion of commercial demand, these figures will be reported under commercial demand to ensure double counting does not occur.
2.3 Industry Total industrial water demand will be developed from two components;
• Prudent provisions for international large scale industrial water users • Growth projection of small and medium industry
2.3.1 Large Scale Industrial A prudent provision shall be allowed for to ensure Ireland continues to be in a position to attract FDI, specifically the large water using industries/companies (IT, Biopharma etc.). Methodology
a) Existing Large Scale Industrial water demand will be extracted from the sorted and categorised non-domestic metering records.
b) A prudent provision for future growth will be defined with strategic justification on international comparison by our Gerry Loughrey and sense checked with IDA.
2.3.2 Small and Medium Industry (Light Industrial) Methodology
a) Existing Light Industrial water demand will be extracted from the sorted and categorised non-domestic metering records.
b) Demand growth projections will then be aligned with % population growth scenarios.
Sense Check
• Projection of Light Industrial demand will be sense checked against available land currently zoned for Light Industrial development (up to 2050). Average figures of usage per hectare (or similar) for both wet and dry industry,

Technical Note 009 (Continued)
Page 4 of 4
Jacobs Engineering Ireland Limited Jacobs_MemoA4.doc
sourced from metering results, will be applied to the area of zoned lands and compared to projected scenarios.
2.4 Distribution Leakage Methodology
a) Existing distribution leakage will be calculated by way of water balance. i.e. Distribution Leakage = Input – maintenance – commercial – industrial – average demand per metered property.
b) Projections of distribution leakage will be based on the ELL discussion, UK comparators and considered and reassessed against relevant past studies.
c) Efforts will be made to draw comparison with similar UK supply networks that include long distance transmission pipelines.
3.0 Water Conservation and Costing Strategy Guidance will be required from IW on conservation strategies and pricing tariffs that will be implemented in the near future. Should this information not become available, the likely impact of probable incentives & costing strategies will be derived from corresponding experience in the UK. 4.0 Regional Demand along a pipeline Corridor The Shannon options include a 50Ml/d figure for counties located along pipeline routes. Requirement for this 50Ml/d figure will be confirmed through the Needs Assessment reports submitted by individual county councils.


