Water-use requirements associated with hydraulic fracturing within the Williston Basin Joanna Thamke Kyle Blasch Cooperator: GWPC’s Groundwater Research and Education Foundation Partners: Mike Hove, ND State Water Commission The data and interpretations within this presentation are preliminary and have not been reviewed or approved by the U.S. Geological Survey. 2016 GWPC Annual UIC Conference Denver, Colorado Drilling of hydraulically-fractured wells in Williston Basin Vern Whitten Photography
Transcript
Water-use requirements associated with
hydraulic fracturing within the Williston Basin
Joanna Thamke
Kyle Blasch
Cooperator: GWPC’s Groundwater
Research and Education Foundation
Partners: Mike Hove, ND State Water Commission
The data and interpretations within this presentation are preliminary and have not been reviewed or approved by
the U.S. Geological Survey.
2016 GWPC Annual UIC Conference
Denver, Colorado
Drilling of hydraulically-fractured wells in Williston Basin
Vern Whitten Photography
North Dakota Water Withdrawals (2010)
0
100
200
300
400
500
600
700
800
900W
ate
r W
ith
dra
wal
s (M
gal/
d)
2
Water Use
Primary water use1. Supplemental fluid in enhanced recovery
2. Drilling and completion of an oil or gas well
3. Work over or remediation (repeat completion)
4. Gas plant coolant or boiler water
Secondary water use1. Watering down roads and pads
2. Rig wash water
3. Coolant for vehicles and other engines
4. Sanitary purposes
5. Laboratory purposes
Ancillary water use1. Residential water use (man camps)
2. Wastewater treatment
3. Restaurants
3
Purpose
(1) obtain and analyze water use data at a
process level,
(2) identify the primary factors (predictor
variables) controlling water use, and
(3) identify the primary variables controlling
water recycling and disposal.
4
Well development in the Bakken Formation
Year
0
200
400
600
800
1000
1200
1400
1600
1917 1941 1961 1981 2001
Nu
mb
er
of
We
lls
0
2000
4000
6000
8000
10000
12000
14000
16000
18000
Cu
mu
lative
Nu
mb
er
of
We
lls
Williston basin—
Oil and Gas development
7
Modified from Caldwell, 2015 and Haines, 2015
Water Use to Fracture Formation
2.9 million gallons (Mgal) per well (or 9 acre-ft)
Daily use for a city of 50,000 people is 10 Mgal
Daily pumping for a center-pivot irrigator for 130 acres is 1 Mgal
Daily 400 MW Coal fire plant 365 Mgal
Data from Northern Great Plains Water Consortium Water Use Fact Sheet: Nov 2008
Data from North Dakota State Water Commission: Oct ,2011
Future: Oil and Gas Division estimate 2500 new wells per year (15-25 yrs)
Data from North Dakota Water Commission: Aug 2014
9
Water Use to Fracture Formation
North Dakota Oil and Gas Division: April 5, 2012
Year Well Count Total AcFt Mean AcFt
2006 30 31 1.03
2007 128 206 1.61
2008 504 797 1.58
2009 572 1,355 2.37
2010 792 3,632 4.59
2011 1027 5,960 5.8
2012 48 392 8.18
Water use per well (hydraulic fracturing job)
10
Methods
Compilation of data and information oil and gas
water usage
1. Identify Data
2. Obtain Data Resources (North Dakota Oil and Gas
Division, Montana Board of Oil and Gas)
3. Develop Predictor Variables (type of proppant used,
amount of proppant used, number of laterals per well, treatment type, number
of fracturing instances per lateral, length of each lateral, proximity to a water
source, proximity to injection wells, number of stages, etc.)
4. Database Development (put data into Access database)
11
Methods
Data Analysis
1. Statistical Interpretation (bootstrap random forest
classification using R and error measured using Gini coefficient)
2. Develop Functions based on Primary
Predictor Variables (water use based on predictor variable
such as driller or location)
3. Trends Determination (changes over time and space)
4. Predict Future Water-Use Requirements for
Varied Sources (projections possible for WAPR)
12
Laterals
Produced by Mike Hove ND State Water Commission
Horizontal Distance (Length)
Produced by Mike Hove ND State Water Commission
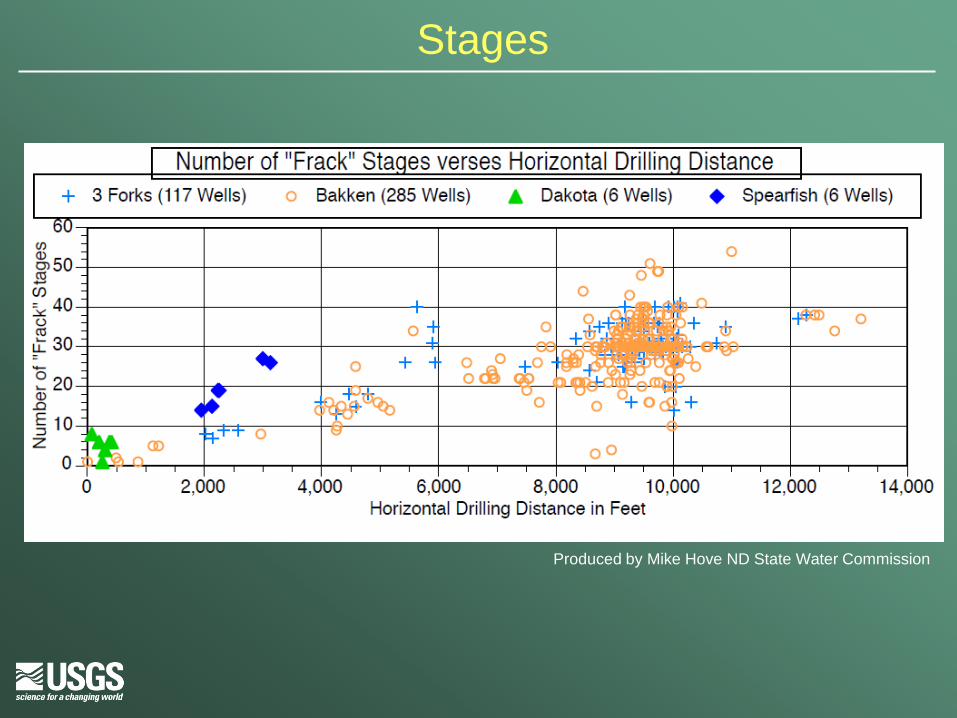
Stages
Stages
Produced by Mike Hove ND State Water Commission
2013 Water UseGW – 6700 Ac-Ft
SW – 12,986 Ac-Ft
North Dakota Water Disposal Wells
Preliminary Results: Important Predictor Variables