Wavelet-Based Image Compression System with Linear Distortion Control Je-Hung Liu, King-Chu Hung Institute of Engineering Science and Technology National Kaohsiung First University of Science and Technology No 2 Jhuoyue Rd. , Nanzih District, Kaohsiung City 811, Taiwan , R.O.C. Taiwan [email protected]Abstract: - In this paper, an optimized quantization of wavelet transform coefficients and low complex distortion control system for image compression is proposed. Distortion control is an important issue in maintaining the desired quality in the retrieved signal of compressed data. We construct a linear relationship between the distortion and quantization scale, which is crucial for efficient quality maintenance due to its simplicity and accuracy. This method can provide wavelet-based image data compression with a precise linear prediction model, resulting in high compression performance. A genetic algorithm (GA) is used to optimize the indices of distortion and compression ratio (CR). The optimization can induce linear relationships among multi- level quantization scales and enable the control of multi-level quantization scales with a single variable. Then a curve fitting technique is used to produce the quantization scales formula which is controlled by a single value. The experimental results showed that the proposed method can obtain better compression performance and distortion control exactly as predicted, with low complexity. Key-Words: - distortion control, genetic algorithm, image coding 1 Introduction Images acting as instruments of information transmission are the most popular media tool on the internet. Since images inherently contain significant amounts of data, image compression is crucial for efficient transmission and storage. One image compression technique which cannot offer perfect reconstruction of the original data is called lossy compression otherwise called lossless compression [1]. Lossy compression entails the permanent loss of some original image information to yield a high CR result. The compromise between high CR and distortion usually greatly depends on transmission control and user satisfaction. The information loss occurs during the quantization process [2]. Therefore, a quantization scheme will strongly impact compression performance due to irreversible processing. Optimization schemes generally can be partitioned into filter selection and quantization scale design groups. With lattice parameterization, Nielsen et al. [3] proposed a signal-based optimization process that found the optimal mother wavelet with minimal distortion rates for some fixed CRs. He and Mitra [4] designed an optimal quantization error feedback filter by minimizing synthesis filtering errors. Filter selection is also a concern in 3D signal compression [5]. These methods optimize the compromise between compression ratio (CR) and distortion, but do not consider the capability of quality control before coding. GA offers a robust method for both searching and optimization [6], with wide applications in numerical optimization. In our method, GA is used to optimize the indices of distortion and compression ratio At the present time, the estimation of image and video quality also plays an important role in image and video broadcasting, i.e., transmission control, because the quality is a criterion determinant of user satisfaction and a key indicator of transmission quality. Therefore, quality prediction of an image is important and many works have focused on this topic. For optimizing the compromise, reconstruction quality of compressed image should be precisely predictable. A quality prediction survey can be achieved from the quality measurement of received images [7-11]. The automatic quality measurement methods can assign quality scores to images or videos in meaningful agreement with subjective human assessment of quality. Such methods can be used to monitor image and video quality for a quality control system and can be WSEAS TRANSACTIONS on SIGNAL PROCESSING Je-Hung Liu, King-Chu Hung E-ISSN: 2224-3488 41 Volume 10, 2014
Transcript
Wavelet-Based Image Compression System with Linear Distortion Control
Je-Hung Liu, King-Chu Hung
Institute of Engineering Science and Technology National Kaohsiung First University of Science and Technology
No 2 Jhuoyue Rd. , Nanzih District, Kaohsiung City 811, Taiwan , R.O.C. Taiwan
[email protected] Abstract: - In this paper, an optimized quantization of wavelet transform coefficients and low complex distortion control system for image compression is proposed. Distortion control is an important issue in maintaining the desired quality in the retrieved signal of compressed data. We construct a linear relationship between the distortion and quantization scale, which is crucial for efficient quality maintenance due to its simplicity and accuracy. This method can provide wavelet-based image data compression with a precise linear prediction model, resulting in high compression performance. A genetic algorithm (GA) is used to optimize the indices of distortion and compression ratio (CR). The optimization can induce linear relationships among multi-level quantization scales and enable the control of multi-level quantization scales with a single variable. Then a curve fitting technique is used to produce the quantization scales formula which is controlled by a single value. The experimental results showed that the proposed method can obtain better compression performance and distortion control exactly as predicted, with low complexity. Key-Words: - distortion control, genetic algorithm, image coding 1 Introduction
Images acting as instruments of information transmission are the most popular media tool on the internet. Since images inherently contain significant amounts of data, image compression is crucial for efficient transmission and storage. One image compression technique which cannot offer perfect reconstruction of the original data is called lossy compression otherwise called lossless compression [1]. Lossy compression entails the permanent loss of some original image information to yield a high CR result. The compromise between high CR and distortion usually greatly depends on transmission control and user satisfaction. The information loss occurs during the quantization process [2]. Therefore, a quantization scheme will strongly impact compression performance due to irreversible processing. Optimization schemes generally can be partitioned into filter selection and quantization scale design groups. With lattice parameterization, Nielsen et al. [3] proposed a signal-based optimization process that found the optimal mother wavelet with minimal distortion rates for some fixed CRs. He and Mitra [4] designed an optimal quantization error feedback filter by minimizing synthesis filtering errors. Filter selection is also a
concern in 3D signal compression [5]. These methods optimize the compromise between compression ratio (CR) and distortion, but do not consider the capability of quality control before coding. GA offers a robust method for both searching and optimization [6], with wide applications in numerical optimization. In our method, GA is used to optimize the indices of distortion and compression ratio
At the present time, the estimation of image and video quality also plays an important role in image and video broadcasting, i.e., transmission control, because the quality is a criterion determinant of user satisfaction and a key indicator of transmission quality. Therefore, quality prediction of an image is important and many works have focused on this topic. For optimizing the compromise, reconstruction quality of compressed image should be precisely predictable. A quality prediction survey can be achieved from the quality measurement of received images [7-11]. The automatic quality measurement methods can assign quality scores to images or videos in meaningful agreement with subjective human assessment of quality. Such methods can be used to monitor image and video quality for a quality control system and can be
WSEAS TRANSACTIONS on SIGNAL PROCESSING Je-Hung Liu, King-Chu Hung
E-ISSN: 2224-3488 41 Volume 10, 2014
employed to benchmark image and video processing systems. These researches can be divided into three categories: full-reference metrics, reduced-reference metrics and no-reference metrics [11]. For limitless bandwidth communication, maintaining reconstruction quality is an essential requirement for lossy image compression [17, 20]. These works predict the image quality before encoding the image data (JPEG2000). [17] indicated that it is necessary for rate allocation [12, 13], filter selection [14] and encoding parameter decisions [15, 16]. [14] experimentally created a relation between spatial and frequency indices of filter banks with the quality for a bit-rate. Many methods establish models of quality prediction; [15, 16] grouped videos into various categories and built quality vs. bit-rate curve for every category. [17] produced a model which integrates image feature and CR together; the image quality at various CRs can be predicted without coding. The PSNR difference is less than 2db for over 95% of the images. [20] proposed a pre-compression quality-control(PCQC) algorithm to solve the complex embedded block coding (EBC) with optimized truncation (EBCOT) tier-1 of JPEG2000. The rate and distortion of coding passes is approximately predicted by using the propagation property and the randomness property of the EBC algorithm. The drawback of the method is that the average peak-signal-to-noise ratio (PSNR) degrades about 0.1~0.3 db and the PSNR difference is smaller than 1.5db at the range of 25 to 45 db. EBCOT tier-2 is used to find a set of optimal truncation points for all the code-blocks. The set of optimal truncation points gives an overall bitstream length that is within the desired rate. Therefore, the individual code-block streams have the property that they can be truncated to a variety of lengths R1,R2, … , Rn and distortion D1,D2, … ,Dn. EBCOT calculates the rate-distortion slope values of all passes for each code-block by the following
equation: i
ii
zi
ziz
i RD
S∆∆
= [20], where and mean the
difference of Mean Squared Error (MSE) and the difference of number of code bytes between the z-th and (z-1)th truncation point for the ith code-block, respectively. If there are some values of slope that do not follow the rule that becomes smaller, we should delete this kind of truncation points to avoid
1−> ii zi
zi SS . EBCOT can iterate a few cycles to
find the optimum truncation points for the best quality of the compressed image at the desired bit
rate. A simple algorithm to find the optimal truncation point, λ
iz , which minimizes )(λλ
λ ii zi
zi RD + ,
is as follows: Initialize ; 0=λ
iz
for =1,2,3,…
setλiz
ixi
xi RRR −=∆ and
λiz
ixi
xi DDD −=∆ ;
if λ>∆∆
xi
xi
RD then update .jzi =λ
In addition to rate control, EBCOT can also minimize the total rate R at the target distortion; this is called quality control. As the rate control, optimal quality control is achieved by minimizing
( )∑ ′+ ii zi
zi DR λ , where λ′ is the Lagrange
multiplier for quality control, as is the Lagrange multiplier for rate control.
Currently, image and video are widely used, and quality prediction is important for transmission control, user satisfaction, etc. In this paper, the 9/7 wavelet, which is the most popular wavelet filter, is used in our transform coding. The 9/7 filter is the default filter of the JPEG2000 standard and the MPEG4 standard because of its good performance. We propose that the wavelet coefficients can be quantized by non-uniform quantization scales in different subbands. Use a variable value to calculate the quantization scales and to predict the image quality at the pre-coding stage without inverse quantization, wavelet transform coding and decoding of Set Partitioning in Hierarchical Trees (SPIHT) [19]. Based on the linear programming, a linear quantization scale prediction model can automatically guarantee the desired quality for reconstructed signals with a few iterations. The result of our experiment shows that our method has higher PSNR than SPIHT does at the same CR, and the predicted PSNR of quality control is close to the target PSNR.
The remainder of this paper is organized as follows. In section 2, GA is briefly described. In addition, we express how to produce the different quantization scales in GA and how to design the parameters of GA. We discuss our proposed method in section 3. The experiment results are illustrated in section 4 and a conclusion is offered in section 5. 2 Problem Formulation
WSEAS TRANSACTIONS on SIGNAL PROCESSING Je-Hung Liu, King-Chu Hung
E-ISSN: 2224-3488 42 Volume 10, 2014
2.1 The Wavelet-Based Image Compression System with Linear Distortion Characteristic
The proposed method encoding processes involves three functional blocks: the 9/7 wavelet transform, quantization and lossless SPIHT coding, as shown in Fig. 1. The decoding process also works with inverse direction. Original image signals will be transformed into wavelet coefficients *
jd by the 9/7 wavelet filter; *
jd is a vector consisting of the wavelet coefficients of the jth level. The subband coefficients will be quantized for dynamic range reduction that derives the quantized data *d with:
=
)(,,
)(,
)(*
*
1
*1
0
*0
QFcd
QFcd
QFcd
dj
j
where X denotes the truncation of the elements of vector into an integer, and )(QFc j is the quantization scale of the jth level. In the inverse quantization process, each retrieved datum will be compensated by half of the quantization scale, namely:
( )( ) )(*5.0** QFcdsigndd j×+=
where denotes the sign vector of , e.g., given ,
then ( ) ]1,1[* −=dsign . )(QFc j is an adjustable parameter controlled by
the single variable QF. The multi-level quantization scheme using single control variable is favorable for data compression. Then, the QF and quantized data will be encoded with the lossless SPIHT scheme due to the high efficiency.
Guaranteeing the quality of reconstructed data is an important feature required for image compression. One simple approach for this requirement is using an error control loop that recursively adjusts the quantization scale until the reconstruction error is located in a specified small region. To this end, GA optimization followed by a curve fitting is applied for the value determination of )(QFc j . The former improves the compression performance and the latter transforms the distortion curve into a linear control. GA optimization is based on a competition of using 60 images which are divided into six different datasets according to the entropy. We calculate the entropy of all of the images; then the entropy of two of the six datasets is low, high for another two of them, while the others are medium. The )(QFc j determination process consists of three steps described as follows:
Step 1: By using six datasets, find the seven quantization schemes by two processes, i.e., GA optimization and curve fitting. Step 2: Apply each quantization scheme for all databases where the signals with compression performance will be recorded. Step 3: Choose the one with best compression performance as the desired quantization scheme. The specification of GA optimization is defined in the following: Objective: Find the values of )(QFc j , 018 ≤≤− j . Fitness function:Minimizing the ratio of (1/PSNR)/CR Group size:100 sets with each set defined as:
( ){ }) (,,) (), (), ( 18210 cccc . Selection:Eighty sets with smallest (1/PSNR)/CR are selected for crossover in each iteration. Crossover: 1)The choice of { }) (), ( 180 cc
for crossover is random where the value of j is also randomly chosen. 2) Crossover processing number for each iteration is defined as 40. Mutation: 1)Mutation process is defined as exchanging the values of ) (ic and ) (jc when they are selected. 2)The mutation probability is defined as 0.3. Termination: 1)Iteration times should exceed 150. 2)Select the set with minimum (1/PSNR)/CR and terminate the iteration.
For evolution, the mutation strategy can effectively increase convergence speed. There are six { }) (), ( 180 cc
sets generated in every dataset; we calculate the performance of six sets by using the seven { }) (), ( 180 cc sets and select the best { }) (), ( 180 cc
. For the desire of linearly controlling
) (jc generation, we introduce another set which is QF=15, with the average 1/PSNR1=0.046387 of 60 images and we assume that QF=0 means there is no quantization values; then 1/PSNR=0 because of PSNR=∞ . Only considering the behavior of PSNR, we introduce 19 quadratic equations for fitting the 19 curves of ) (jc using a single control variable QF. The )(QFc j corresponds to PSNRn with
( ) ( )1n PSNR/1/PSNR/1=QF . The coefficients of
WSEAS TRANSACTIONS on SIGNAL PROCESSING Je-Hung Liu, King-Chu Hung
E-ISSN: 2224-3488 43 Volume 10, 2014
19 quadratic equations are found by curve fitting. )(QFc j are given in the follow
C1 = 0.2689×QF3-6.2364×QF2+50.4051×QF -133.9474 C2 = 0.2664×QF3-6.1768×QF2+49.9104×QF -132.5439 C3 = 0.2547×QF3-5.8338×QF2+46.7632×QF -123.5992 C4 = 0.2695×QF3-6.2752×QF2+50.8589×QF -135.3308 C5 = 0.2714×QF3-6.324×4QF2+51.3357×QF -136.8375 C6 = 0.2695×QF3-6.2685×QF2+50.8232×QF -135.3724 C7 = 0.2751×QF3-6.433×QF2+52.3333×QF -139.7041 C8 = 0.2714×QF3-6.3209×QF2+51.2746×QF -136.6183 C9 = 0.2728×QF3-6.3627×QF2+51.6754×QF -137.7979 C10 = 0.2724×QF3-6.3505×QF2+51.5742×QF -137.5351 C11 = 0.2721×QF3-6.3402×QF2+51.4686×QF -137.2094 C12 = 0.2722×QF3-6.3431×QF2+51.4876×QF -137.2441 C13 = 0.2705×QF3-6.2953×QF2+51.0688×QF -136.084 C14 = 0.2717×QF3-6.33×QF2+51.3816×QF -136.9783 C15 = 0.272×QF3-6.3394×QF2+51.473×QF -137.2517 C16 = 0.2719×QF3-6.3364×QF2+51.4443×QF -137.1664 C17 = 0.2718×QF3-6.3326×QF2+51.4098×QF -137.0696 C18 = 0.2716×QF3-6.3275×QF2+51.3665×QF -136.9526 C19 = 0.2719×QF3-6.3392×QF2+51.4837×QF -137.3087 2.2 The Linear Dynamic Error Control Scheme In this section, highly efficient quality predetermination and control schemes are proposed. The reconstructed error is predicted by the wavelet coefficients in the frequency-domain. In other words, it is without the inverse quantization process and inverse wavelet transform in the quality control loop for low computational complexity. For our compression system, the errors are produced by Qe , which is the truncation process after quantization,
and the Be round-off process of reconstructing data. The quantization process will produce an error
Qe such that Qed
QFcd
+= ** ~
)(, where the Qe is less
than one, 1<Qe . Let ( )QeSign denotes the sign of
Qe , where the Qe is positive or negative. Thus
( )QeSign = ( )*d̂Sign = ( )*dSign . Be denotes the round-off error of the reconstruct data with
5.0<Be . We define ))(5.0)(( QQ eSigneQFceq −=′
where eq ′ means the differences between *d̂ and *d . For reducing the complexity of PSNR
computation, it only uses the Qe value in transform domain. To this end, we propose a simplified PSNR (SPSNR) parameter for the distortion measurement such as:
SPSNR = SMSE
)255(log102
10
where SMSE is the simplified mean square error between *d̂ and *d . We define the SMSE as:
SMSE = ( )NM
eq×′ 2
where M and N are the height and width of the image. The computation of SPSNR does not need the process of inverse quantization and inverse wavelet transform. Using SPSNR can reduce more of the complexity of distortion measurement than PSNR can. Fig. 2 shows the relationships between SPSNR and PSNR; our curve is the average result of 18 images selected from the six databases. SPSNR is ever closer to the PSNR when the PSNR is ever high. Even in low PSNR, the difference between SPSNR and PSNR is less than 0.4 dB, as shown in Fig. 3. For the goal of error control, we proposed a high efficient error prediction and control system. In this system, a dynamic linear QF determination algorithm is proposed and the error of wavelet coefficients is calculated in the frequency domain for obtaining low complexity. This algorithm can predetermine the QF factor according to the desired PSNR with less iteration. The entire compression procedure and the QF prediction algorithm are given in the following steps. Step 1: Initial setting: target quality (PSNRt); a QF (QFr); control loop (n); error bound (ε) Step 2: Wavelet coefficients will be quantized by a QF(n) Step 3: Using 002634.0/)0044.0)PSNR/1(( t1 −=QF for the SPSNR1 predetermination
WSEAS TRANSACTIONS on SIGNAL PROCESSING Je-Hung Liu, King-Chu Hung
E-ISSN: 2224-3488 44 Volume 10, 2014
Step 4: if ( rt SPSNRPSNR − ) >ε, then: 4.1) n+1 4.2) if n=1, then:
−
−×=
0044.0SPSNR
1
0044.0PSNR
1
r
t12 QFQF
Then QF2 will get a SPSNR2 4.3) if loop>1, then:
221
2t21
))))SPSNR/1()SPSNR/1((())))SPSNR/1()PSNR/1((()(((
)( QFQFQF
nQF +−
−×−=
4.4) QF2→QF1 SPSNR2→ SPSNR1 QF(n) →QF2 SPSNRn→SPSNR2 go to Step 4 until tn PSNRSPSNR − <ε Step 5: Lossless SPIHT coding 3 Problem Solution
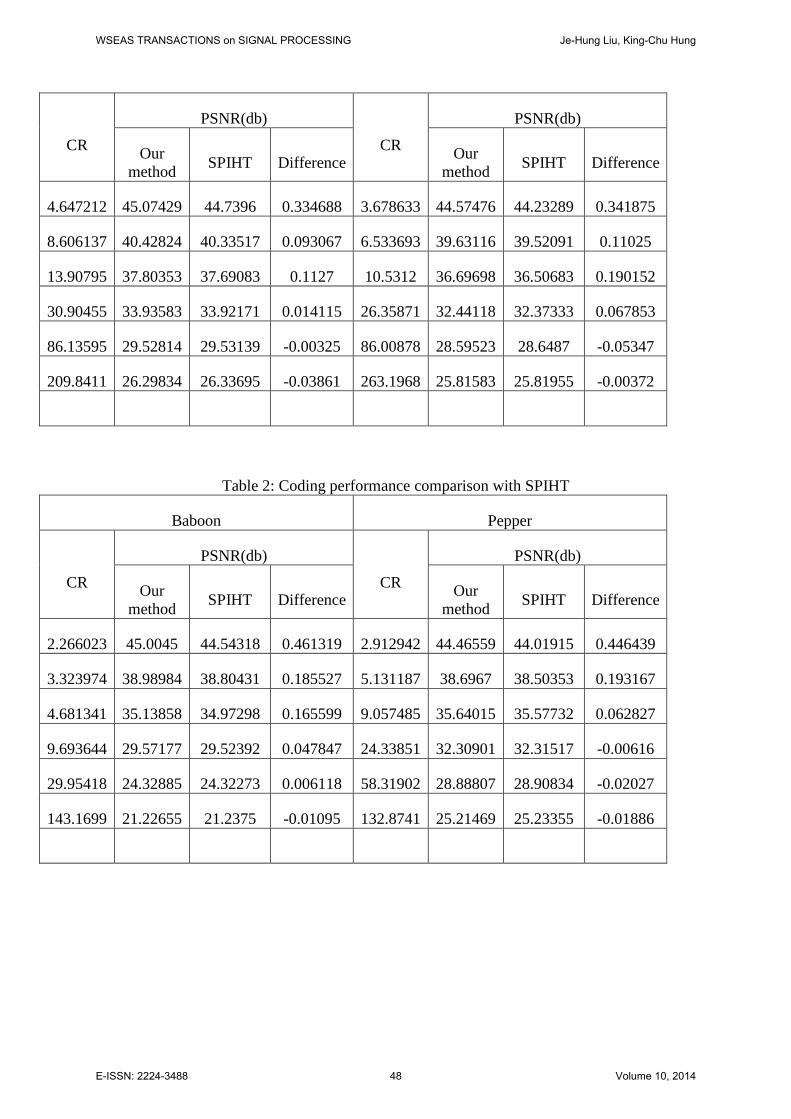
In this section, the performance of the proposed method was studied in some experiments. In the comparison with schemes SPIHT and [18], the performance evaluation was based on 4 images (Lena, GoldHill, Baboon and Pepper) which are gray level 512×512 pixels. The compressed data file consists of a QF value and quantized data. The former was encoded with the lossless SPIHT scheme. Tables 1 and 2 show the compression performance results, where the value denotes the PSNR of a CR. The proposed method can obtain better performance, especially for the low CR region. In the best case, the quality can improve about 0.2~0.46 db, and the quality degrades less than 0.03db in the worst case. The results show that the proposed quantization scheme can obtain much better compression performance.
In the study of distortion control, the Lena, Baboon, Jet and Pepper were tested for the comparison with [19]. Distortion control precision signifies how close it is between the target PSNR and the result PSNR. Tolerable bound ε was considered in the closed-loop error control process. Tables 3 and 4 show the result of our proposed method when ε<0.1 dB and Tables 5 and 6 show another result when ε<0.5 dB. [19] is not suitable for the distortion control at low CR because of the degrading reconstruction quality of about 0.5dB~1dB, and the difference of true PSNR is less than 1.5 dB at the range 25 to 45. The experimental results show that the quality of our method is
usually better than SPIHT and the distortion control precision is always smaller than ε. According to the target PSNR, we calculate the QF(n) with a few iterations. Due to the near linear relationship between QF and PSNR, we can predict the PSNR precisely with low complexity. The evaluation results with good compression performance and quality control capability show that the proposed quantization scheme is well applicable for image signals. 4 Conclusion For efficient distortion control and compression performance of wavelet-based image data, a single quantization value method has been proposed for the design of a linear distortion quantization scheme in this paper. The GA showed that the criterion of minimal (1/PSNR)/CR can induce a linear relationship among multi-level quantization scales. This implies that multi-level quantization scales can be generated with a single variable, which can easily control the reconstruction error and save the bits of all levels’ quantization scales for the adaptive quantization scheme. As shown by the experimental results, the compression performance is similar to SPIHT at high CR, and is better than SPIHT at low CR. Compared with [19] for distortion control, the precision is less than ε which is set by users. The distortion control of our proposed method can be suitable for any rates. References: [1] H.Pan, W.-C. Siu, Lossless image compression
using binary wavelet transform, IET Image Processing, Vol.1, 2007, pp. 353-362
[2] M. Antonini, P. Mathieu and I. Daubechies, Image Coding Using Wavelet Transform, IEEE Trans. Image Processing, Vol.1, 1992, pp. 205-220.
[3] M. Nielsen, E. N. Kamavuako, M. M. Andersen, M. Franc¸ O. Lucas, D. Farina, Optimal wavelets for biomedical signal compression, Med. Bio. Eng. Comput, Vol.44, 2006, pp. 561–568.
[4] Z. He and Mitra S. K., Optimal quantization error feedback filter for wavelet image compression, International Conference on Image Processing, Vol.3, 2000, pp. 166-169.
[5] B. Demir, S. Erturk, O. Urhan, Improved quality multiple description 3D mesh coding with optimal filtering, International Conference on Image Processing, 2009, pp. 3541 – 3544.
WSEAS TRANSACTIONS on SIGNAL PROCESSING Je-Hung Liu, King-Chu Hung
E-ISSN: 2224-3488 45 Volume 10, 2014
[6] M. Srinivas, L. Patnaik, Genetic Algorithms: A Survey, IEEE Computer, 1994, pp. 17-26.
[7] T. N. Pappas and R. J. Safranek, Perceptual criteria for image quality evaluation, in Handbook of Image &Video Proc. (A. Bovik, ed.), Academic Press, 2000
[8] B. Watson, Ed., Digital Images and Human Vision, Cambridge, MA, MIT Press, 1993.
[9] H. R. Sheikh, A. Bovic and L. Cormack, No-Reference Quality Assessment using Natural Scene Statistics: JPEG 2000, IEEE Transactions on Image Processing, Vol.14, 2005 pp. 1918-1927.
[10] Z. Wang, H. Sheikh, A. Bovic, No Reference Perceptual Quality Assessment of JPEG compressed image, Proceedings of IEEE 2002 International Conferencing on Image Processing, 2002, pp. 22-25.
[11] T. M. Kusuma and H.-J. Zepernick, A reduced-reference perceptual quality metric for in-service image quality assessment, in Proc. Joint First Workshop Mobile Future Symp. Trends Commun. 2003, pp. 71–74.
[12] W. J. Kim, J. W. Yi, and S. D. Kim, A bit allocation method based on picture activity for still image coding, IEEE Trans. Image Process, Vol.8, 1999, pp. 974-977
[13] P. Fleury, J. Reichel, and T. Ebrahimi, Image quality prediction for bitrate allocation, in Proc. Int. Conf. Image Processing, Vol.3, 1996, pp. 339-342.
[14] A. Kourzi, D. Nuzillard, G. Millon, and F. Nicolier, Quality estimation in wavelet image
coding, in 13th European Signal Processing Conf. Antalya, Turkey, 2005.
[15] [15] H. Koumaras, A. Kourtis, C.-H. Lin, and C.-K. Shieh, A Theoretical Framework for End-to-End Video Quality Prediction of MPEG-based Sequences, in 3rd Int. Conf. Networking and Services: IEEE Computer Society, 2007, pp. 62-62
[16] H. Koumaras and A. Kourtis, Video Quality Prediction based on the Spatial and Temporal Classification of the Uncompressed Content, in PIMRC 2007. IEEE 18th International Symposium on, 2007, pp. 1-5.
[17] L. Li and Z. Wang, A quality prediction model for JPEG2000-based color images, Acoustics, ICASSP 2009. IEEE International Conference on, 2009, pp. 1013-1016.
[18] A.Said and W. Pearlman, A new fast and efficient image codec based on set partitioning in hierarchal trees, IEEE Transactions on Circuits and Systems for Video Technology, Vol.6, 1996, pp. 243-250.
[19] Y. W. Chang and H. C. Fang, Precompression Quality-Control Algorithm for JPEG2000, IEEE Transactions on Image Processing, Vol.15, 2006, pp. 3279-3293.
[20] D. Taubman, High Performance Scalable Image Compression with EBCOT, IEEE Transactions on Image Processing, Vol.9, 2000, pp. 1158-1170.
Figure 1: Function block of our image compression system
WSEAS TRANSACTIONS on SIGNAL PROCESSING Je-Hung Liu, King-Chu Hung
E-ISSN: 2224-3488 46 Volume 10, 2014
Figure 2: The relationship between SPSNR and PSNR
Figure 3: The difference between SPSNR and PSNR
Table 1: Coding performance comparison with SPIHT
Lena GoldHill
WSEAS TRANSACTIONS on SIGNAL PROCESSING Je-Hung Liu, King-Chu Hung