Chapter 27 WAVELET METHODS IN DATA MINING Tao Li School of Computer Science Florida Intemtional University Miami, FL 331 99 taoli8cs.fiu.edu Sheng Ma Machine Learning for Systems IBM ZJ. Watson Research Center 19 Skyline Drive Hawthorne, NY 10532 [email protected]Mitsunori Ogihara Computer Science Department University of Rochester Rocheste~ NY 14627-0226 Abstract Recently there has been significant development in the use of wavelet methods in various Data Mining processes. This article presents general overview of their applications in Data Mining. It first presents a high-level data-mining framework in which the overall process is divided into smaller components. It reviews a p plications of wavelets for each component. It discusses the impact of wavelets on Data Mining research and outlines potential future research directions and applications. Keywords: Wavelet Transform, Data Management, Short Time Fourier Transform, Heisenberg's Uncertainty Principle, Discrete Wavelet Transform, Multiresolu-
Transcript
Chapter 27
WAVELET METHODS IN DATA MINING
Tao Li School of Computer Science Florida Intemtional University Miami, FL 331 99 taoli8cs.fiu.edu
Sheng Ma Machine Learning for Systems IBM ZJ. Watson Research Center 19 Skyline Drive Hawthorne, NY 10532 [email protected]
Mitsunori Ogihara Computer Science Department University of Rochester Rocheste~ NY 14627-0226
Abstract Recently there has been significant development in the use of wavelet methods in various Data Mining processes. This article presents general overview of their applications in Data Mining. It first presents a high-level data-mining framework in which the overall process is divided into smaller components. It reviews a p plications of wavelets for each component. It discusses the impact of wavelets on Data Mining research and outlines potential future research directions and applications.
Keywords:
Wavelet Transform, Data Management, Short Time Fourier Transform, Heisenberg's Uncertainty Principle, Discrete Wavelet Transform, Multiresolu-
604 DATA MINING AND KNOWLEDGE DISCOVERY HANDBOOK
tion Analysis, Harr Wavelet Transform, Trend and Surprise Abstraction, Pre- processing, Denoising, Data Transformation, Dimensionality Reduction, Dis- tributed Data Mining
1. Introduction The wavelet transform is a synthesis of ideas that emerged over many
years from different fields. Generally speaking, the wavelet transform is a tool that partitions data, functions, or operators into different frequency com- ponents and then studies each component with a resolution matched to its scale (Daubechies, 1992). Therefore, it can provide economical and infor- mative mathematical representation of many objects of interest (Abramovich et al., 2000). Nowadays many software packages contain fast and efficient pro- grams that perform wavelet transforms. Due to such easy accessibility wavelets have quickly gained popularity among scientists and engineers, both in theo- retical research and in applications.
Data Mining is a process of automatically extracting novel, useful, and un- derstandable patterns from a large collection of data. Over the past decade this area has become significant both in academia and in industry. Wavelet theory could naturally play an important role in Data Mining because wavelets could provide data presentations that enable efficient and accurate mining process and they can also could be incorporated at the kernel for many algorithms. Al- though standard wavelet applications are mainly on data with temporalhpatial localities (e.g., time series data, stream data, and image data), wavelets have also been successfully applied to various Data Mining domains.
In this chapter we present a general overview of wavelet methods in Data Mining with relevant mathematical foundations and of research in wavelets ap- plications. An interested reader is encouraged to consult with other chapters for further reading (for references, see (Li, Li, Zhu, and Ogihara, 2003)). This chapter is organized as follows: Section 2 presents a high-level Data Mining framework, which reduces Data Mining process into four components. Sec- tion 3 introduces some necessary mathematical background. Sections 4, 5, and 6 review wavelet applications in each of the components. Finally, Sec- tion 7 concludes.
2. A Framework for Data Mining Process Here we view Data Mining as an iterative process consisting of: data man-
agement, data preprocessing, core mining process and post-processing. In data management, the mechanism and structures for accessing and storing data are specified. The subsequent data preprocessing is an important step, which ensures the data quality and improves the efficiency and ease of the mining process. Real-world data tend to be 'incomplete, noisy, inconsistent,
Wavelet Methods in Data Mining 605
high dimensional and multi-sensory etc. and hence are not directly suitable for mining. Data preprocessing includes data cleaning to remove noise and outliers, data integration to integrate data from multiple information sources, data reduction to reduce the dimensionality and complexity of the data, and data transformation to convert the data into suitable forms for mining. Core mining refers to the essential process where various algorithms are applied to perform the Data Mining tasks. The discovered knowledge is refined and evaluated in post-processing stage.
The four-component framework above provides us with a simple systematic language for understanding the steps that make up the data mining process. Of the four, post-processing mainly concerns the non-technical work such as documentation and evaluation, we will focus our attention on the first three components.
3. Wavelet Background
3.1 Basics of Wavelet in L2(R) So, first, what is a wavelet? Simply speaking, a mother wavelet is a func-
tion $(x) such that {$(2jx - k) , i, k E 2) is an orthonormal basis of L~ (R) . The basis functions are usually referred to wavelets l. The term wavelet means a small wave. The smallness refers to the condition that we desire that the function is of finite length or compactly supported. The wave refers to the condition that the function is oscillatory. The term mother implies that the functions with different regions of support that are used in the transformation process are derived by dilation and translation of the mother wavelet.
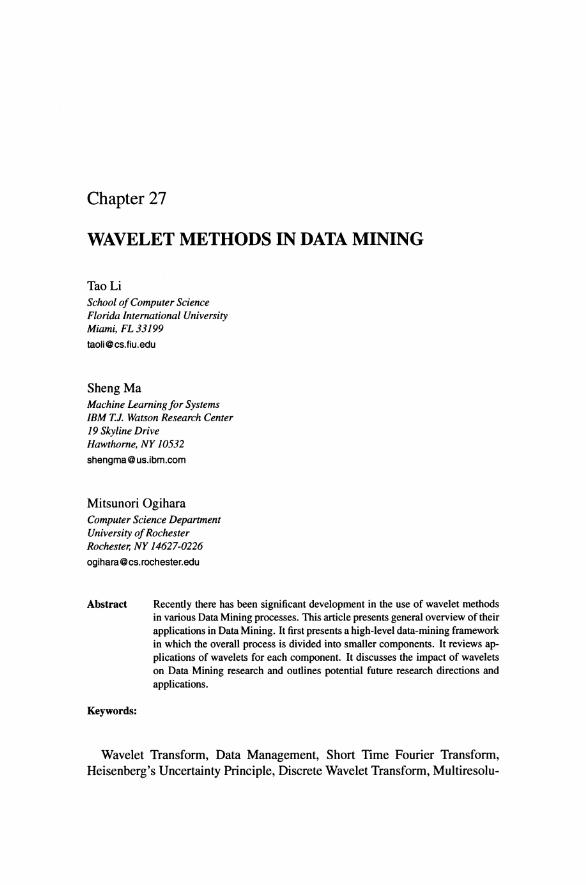
At first glance, wavelet transforms are very much the same as Fourier trans- forms except they have different bases. So why bother to have wavelets? What are the real differences between them? The simple answer is that wavelet transform is capable of providing time and frequency localizations simultaneously while Fourier transforms could only provide frequency repre- sentations. Fourier transforms are designed for stationary signals because they are expanded as sine and cosine waves which extend in time forever, if the rep- resentation has a certain frequency content at one time, it will have the same content for all time. Hence Fourier transform is not suitable for non-stationary signal where the signal has time varying frequency (Polikar, 2005). Since FT doesn't work for non-stationary signal, researchers have developed a revised version of Fourier transform, The Short Time Fourier Transform (STFT). In STFT, the signal is divided into small segments where the signal on each of these segments could be assumed as stationary. Although STFT could provide a time-frequency representation of the signal, Heisenberg's Uncertainty Prin- ciple makes the choice of the segment length a big problem for STFI: The principle states that one cannot know the exact time-frequency representation
606 DATA MINING AND KNOWLEDGE DISCOVERY HANDBOOK
of a signal and one can only know the time intervals in which certain bands of frequencies exist. So for STFT, longer length of the segments gives better frequency resolution and poorer time resolution while shorter segments lead to
Tinoea-nm IlrO=-mTJ
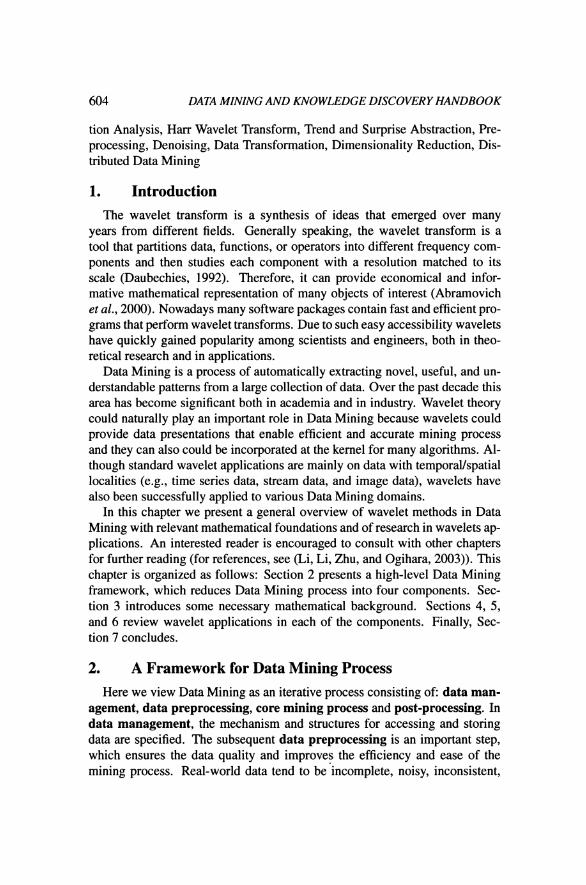
Figure 27.1. 'lime-Frequency Structure of Figure 27.2. 'lime Frequency structure of STFT. The graph shows that time and fre- WT. The graph shows that frequency reso- quency localizations are independent. The lution is good for low frequency and time cells are always square. resolution is good at high frequencies.
better time resolution but poorer frequency resolution. Another serious prob- lem with STFT is that there is no inverse, i.e., the original signal can not be reconstructed from the time-frequency map or the spectrogram.
Wavelet is designed to give good time resolution and poor frequency res- olution at high frequencies and good frequency resolution and poor time res- olution at low frequencies (Polikar, 2005). This is useful for many practical signals since they usually have high frequency components for a short dura- tions (bursts) and low frequency components for long durations (trends). The time-frequency cell structures for STFT and WT are shown in Figure 27.1 and Figure 27.2 , respectively. In Data Mining practice, the key concept in use of wavelets is the discrete wavelet transform (DWT). Our discussions will focus on DWT.
S .-
3.2 Dilation Equation
2
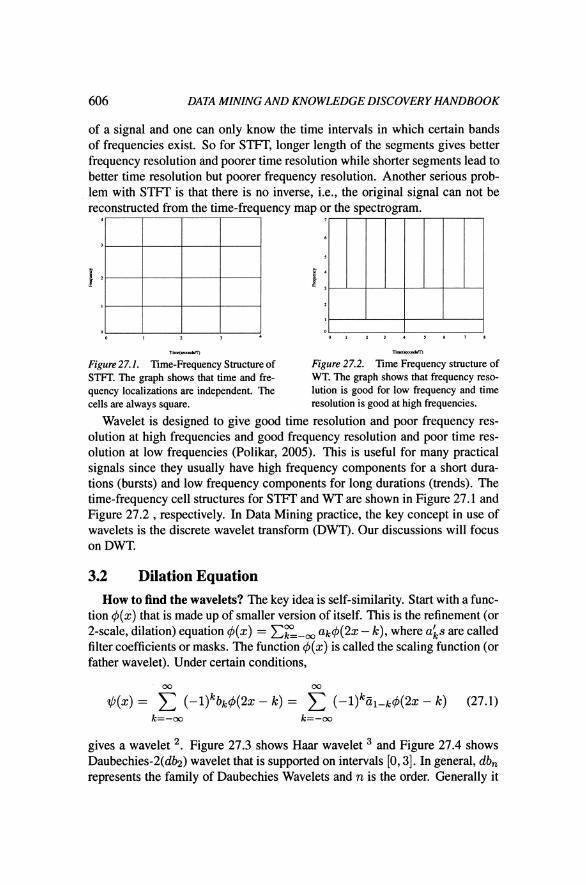
How to find the wavelets? The key idea is self-similarity. Start with a func- tion $(x) that is made up of smaller version of itself. This is the refinement (or 2-scale, dilation) equation $(x) = CEO=_, ak$(2x - k), where aLs are called filter coefficients or masks. The function $(x) is called the scaling function (or father wavelet). Under certain conditions,
gives a wavelet 2. Figure 27.3 shows Haar wavelet and Figure 27.4 shows Daubechies-2(db) wavelet that is supported on intervals [O, 31. In general, db, represents the family of Daubechies Wavelets and n is the order. Generally it
Wavelet Methods in Data Mining 607
can be shown that: (1) The support for db, is on the interval [O,2n - 11, (2) The wavelet db, has n vanishing moments, and (3) The regularity increases with the order. db, has rn continuous derivatives (r is about 0.2).
Figure 27.3. Haar Wavelet. Figure 27.4. Daubechies-2(d4) Wavelet.
3.3 Multiresolution Analysis (MRA) and Fast DWT Algorithm
How to efficiently compute wavelet transforms? To answer the ques- tion, we need to touch on some material of Multiresolution Analysis (MRA). MRA was first introduced in (Mallat, 1989) and there is a fast family of algo- rithms based on it. The motivation of MRA is to use a sequence of embedded subspaces to approximate L2(R) so that a proper subspace for a specific ap- plication task can be chosen to get a balance between accuracy and efficiency. Mathematically, MRA studies the property of a sequence of closed subspaces 5, j E Z which approximate L ~ ( R ) and satisfy . - - V - 2 c V-1 c & c & c & c . . . , U j E z 6 = L ~ ( R ) (L2(R) space is the closure of the union of all V,), and njEz V, = 0 (the intersection of all I$ is empty). So what does multiresolution mean? The multiresolution is reflected by the addi- tional requirement f E 5 u f (22) E I$+l , j E Z (This is equivalent to f ( x ) E & u f (2jx) E G), i.e., all the spaces are scaled versions of the central space Vo.
So how does this related to wavelets? Because the scaling function + easily generates a sequence of subspaces which can provide a simple multiresolution analysis. First, the translations of +(x), i.e., +(x - k), k E 2, span a subspace, say Vo (Actually, +(x - k) , k E Z constitutes an orthonormal basis of the sub- space &). Similarly 2-lI2+(2x - k) , k E Z span another subspace, say &. The dilation equation tells us that + can be represented by a basis of Vl. It im- plies that + falls into subspace Vl and so the translations +(x - k) , k E Z also fall into subspace Vl. Thus Vo is embedded into Vl. With different dyadic, it is straightforward to obtain a sequence of embedded subspaces of L2(R) from only one function. It can be shown that the closure of the union of these
608 DATA MINING AND KNOWLEDGE DISCOVERY HANDBOOK
subspaces is exactly L2(R) and their intersections are empty sets (Daubechies, 1992). here, j controls the observation resolution while k controls the obser- vation location. Formal proof of wavelets' spanning complement spaces can be found in (Daubechies, 1992).
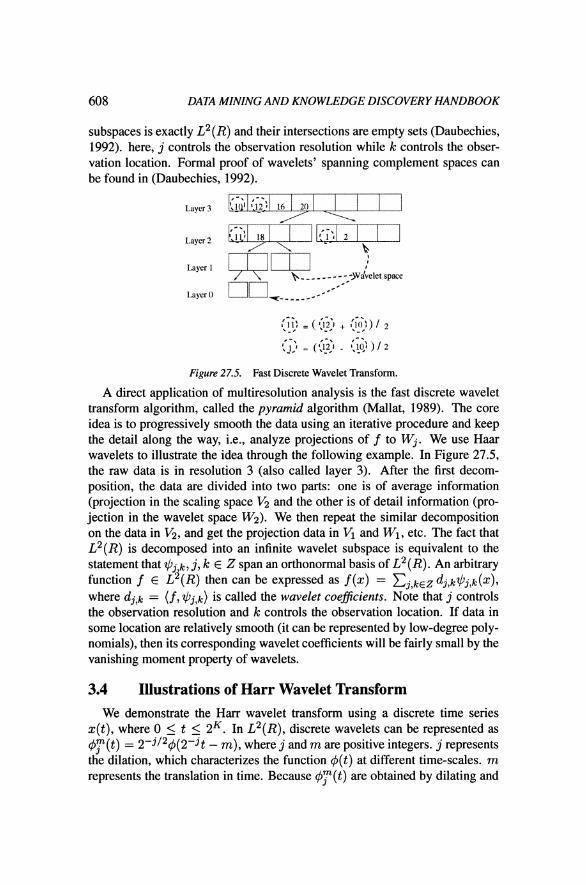
Figure 27.5. Fast Discrete Wavelet Transform.
A direct application of multiresolution analysis is the fast discrete wavelet transform algorithm, called the pyramid algorithm (Mallat, 1989). The core idea is to progressively smooth the data using an iterative procedure and keep the detail along the way, i.e., analyze projections of f to W j . We use Haar wavelets to illustrate the idea through the following example. In Figure 27.5, the raw data is in resolution 3 (also called layer 3). After the first decom- position, the data are divided into two parts: one is of average information (projection in the scaling space V2 and the other is of detail information (pro- jection in the wavelet space W2). We then repeat the similar decomposition on the data in V2, and get the projection data in Vl and Wl, etc. The fact that L2(R) is decomposed into an infinite wavelet subspace is equivalent to the statement that Gj k , j, k E Z span an orthonormal basis of L2(R). An arbitrary
9 function f E L ( R ) then can be expressed as f (x) = &EZdj,k$j,k(x), where dj,k = ( f , ?+hjlk) is called the wavelet coeficients. Note that j controls the observation resolution and k controls the observation location. If data in some location are relatively smooth (it can be represented by low-degree poly- nomials), then its corresponding wavelet coefficients will be fairly small by the vanishing moment property of wavelets.
3.4 Illustrations of Harr Wavelet Transform We demonstrate the Harr wavelet transform using a discrete time series
x(t) , where 0 < t < 2K. In L2(R), discrete wavelets can be represented as + y ( t ) = 2-jI24(2-jt - m ) , where j and m are positive integers. j represents the dilation, which characterizes the function 4( t ) at different time-scales. m represents the translation in time. Because 4 y ( t ) are obtained by dilating and
Wavelet Methods in Data Mining 609
translating a mother function +(t), they have the same shape as the mother wavelet and therefore self-similar to each other.
A discrete-time process x(t) can be represented through its inverse wavelet K 2K-j-1
transform x(t) = Ern=, T + y ( t ) + +,, where 0 I t < 2 K . is equal to the average value of x(t) over t E [0, 2K - 11. Without loss of generality, is assumed to be zero. q ' s are wavelet coefficients and can be
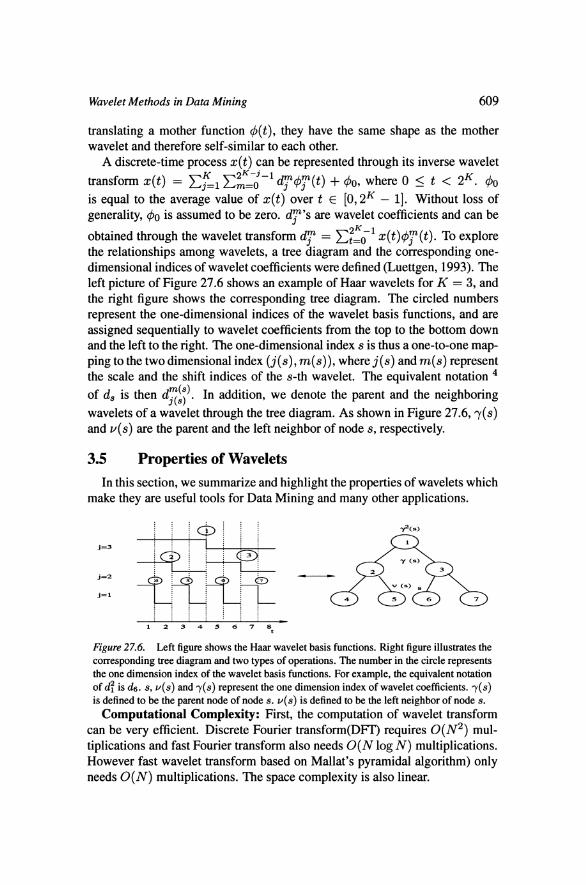
2K-1 obtained through the wavelet transform T = Ct=, x(t)4y(t). TO explore the relationships among wavelets, a tree diagram and the corresponding one- dimensional indices of wavelet coefficients were defined (Luettgen, 1993). The left picture of Figure 27.6 shows an example of Haar wavelets for K = 3, and the right figure shows the corresponding tree diagram. The circled numbers represent the one-dimensional indices of the wavelet basis functions, and are assigned sequentially to wavelet coefficients from the top to the bottom down and the left to the right. The one-dimensional index s is thus a one-to-one m a p ping to the two dimensional index (j(s), m(s)), where j(s) and m(s) represent the scale and the shift indices of the s-th wavelet. The equivalent notation of d, is then d ~ : ; ) . In addition, we denote the parent and the neighboring wavelets of a wavelet through the tree diagram. As shown in Figure 27.6, y(s) and v(s) are the parent and the left neighbor of node s, respectively.
3.5 Properties of Wavelets In this section, we summarize and highlight the properties of wavelets which
make they are useful tools for Data Mining and many other applications.
Figure 27.6. Left figure shows the Haar wavelet basis functions. Right figure illustrates the corresponding tree diagram and two types of operations. The number in the circle represents the one dimension index of the wavelet basis functions. For example, the equivalent notation of 4 is &. s, v(s) and y(s) represent the one dimension index of wavelet coefficients. y(s) is defined to be the parent node of node s. v(s) is defined to be the left neighbor of node s.
Computational Complexity: First, the computation of wavelet transform can be very efficient. Discrete Fourier transform@FT) requires 0 ( N 2 ) mul- tiplications and fast Fourier transform also needs O(N log N) multiplications. However fast wavelet transform based on Mallat's pyramidal algorithm) only needs O(N) multiplications. The space complexity is also linear.
610 DATA MINING AND KNOWLEDGE DISCOVERY HANDBOOK
Vanishing Moments: Another important property of wavelets is vanish- ing moments. A function f (x) which is supported in bounded region w is called to have n-vanishing moments if it satisfies the following equation: Jw f (x)xjdx = 0, j = 0 , 1 , . . . , n. For example, Haar wavelet has 1-vanishing moment and d 4 has 2-vanishing moment. The intuition of vanishing moments of wavelets is the oscillatory nature which can thought to be the characteriza- tion of difference or details between a datum with the data in its neighborhood. Note that the filter [I, -11 corresponding to Haar wavelet is exactly a differ- ence operator. With higher vanishing moments, if data can be represented by low-degree polynomials, their wavelet coefficients are equal to zero.
Compact Support: Each wavelet basis function is supported on a finite interval. Compact support guarantees the localization of wavelets. In other words, processing a region of data with wavelet does not affect the the data out of this region.
Decorrelated Coefficients: Another important aspect of wavelets is their ability to reduce temporal correlation so that the correlation of wavelet coef- ficients are much smaller than the correlation of the corresponding temporal process (Flandrin, 1992). Hence, the wavelet transform could be able used to reduce the complex process in the time domain into a much simpler process in the wavelet domain.
Parseval's Theorem: Assume that e E L2 and qi be the orthonormal basis of L2. Parseval's theorem states that Ilellz = xi I < e, qi > 1 2 . In other words, the energy, which is defined to be the square of its L2 norm, is preserved under the orthonormal wavelet transform.
In addition, the multi-resolution property of scaling and wavelet functions leads to hierarchical representations and manipulations of the objects and has widespread applications. There are also some other favorable properties of wavelets such as the symmetry of scaling and wavelet functions, smoothness and the availability of many different wavelet basis functions etc.
4. Data Management One of the features that distinguish Data Mining from other types of data an-
alytic tasks is the huge amount of data. The purpose of data management is to find methods for storing data to facilitate fast and efficient access. The wavelet transformation provides a natural hierarchy structure and multidimensional data representation and hence could be applied to data management. A novel wavelet based tree structures was introduced in (Shahabi et al., 2001; Shahabi et al., 2000): TSA-tree and 2D TSA-tree, to improve the efficiency of multi- level trends and surprise queries on time sequence data. Frequent queries on time series data are to identify rising and falling trends and abrupt changes at multiple level of abstractions. To support such multi-level queries, a large
Wavelet Methods in Data Mining 61 1
amount of raw data usually needs to be retrieved and processed. TSA (Trend and Surprise Abstraction) tree is designed to expedite the query process. It is constructed based on the procedure of discrete wavelet transform. The root is the original time series data. Each level of the tree corresponds to a step in wavelet decomposition. At the first decomposition level, the original data is decomposed into a low frequency part (trend) and a high frequency part (sur- prise). The left child of the root records the trend and the right child records the surprise. At the second decomposition level, the low frequency part obtained in the first level is further divided into a trend part and a surprise part. This process is repeated until the last level of the decomposition. The structure of the TSA tree is described in Figure 27.7. The 2D TSA tree is just the two di- mensional extensions of the TSA tree using two dimensional discrete wavelet transform.
Figure 27.7. 1D TSA Tree Structure: X is the input sequence. AXi and DX, are the trend and surprise sequence at level i.
5. Preprocessing Real world data sets are usually not directly suitable for performing Data
Mining algorithms. They contain noise, missing values and may be inconsis- tent. In addition, real world data sets tend to be too large and high-dimensional.
612 DATA MINING AND MVOWLEDGE DISCOVERY HANDBOOK
Wavelets provide a way to estimate the underlying function from the data. With the vanishing moment property of wavelets, we know that only some wavelet coefficients are significant in most cases. By retaining selective wavelet coeffi- cients, wavelet transform could then be applied to denoising and dimensional- ity reduction. Moreover, since wavelet coefficients are generally decorrelated, we could transform the original data into wavelet domain and then carry out Data Mining tasks.
5.1 Denoising Noise is a random error or variance of a measured variable. Removing noise
from data can be considered as a process of identifying outliers or constructing optimal estimates of unknown data from available noisy data. Wavelet tech- niques provide an effective way to denoise and have been successfully applied in various areas especially in image research. Formally, Suppose observation data y = (yl, . . . , y,) is a noisy realization of the signal x = (xl,. . . , x,): yi = xi + ~ i , i = 1, . . . , n, where ei is noise. It is commonly assumed that ei are independent from the signal and are independent and identically distributed (iid) Gaussian random variables. A usual way to denoise is to find f such that
2 it minimizes the mean square error (MSE), MSE(2) = C Z l ( f i - xi) . The main idea of wavelet denoising is to transform the data into a different basis, the wavelet basis, where the large coefficients are mainly the useful in- formation and the smaller ones represent noise. By suitably modifying the coefficients in the new basis, noise can be directly removed from the data.
A methodology called WaveShrink for estimating x was developed in (Donoho and Johnstone, 1998). WaveShrink includes three steps: (1) Trans- form data y to the wavelet domain, (2) Shrink the empirical wavelet coefficients towards zero, and (3) Transform the shrunk coefficients back to the data do- main. There are three commonly used shrinkage functions: the hard, the soft, and the non-negative garrote shrinkage functions:
where X E [0, oo) is the threshold. Wavelet denoising is generally different from traditional filtering approaches and it is nonlinear, due to a thresholding step. Determining threshold X is the key issue in WaveShrink denoising. Min- imax threshold is one of commonly used thresholds. The minimax (Minimize Maximal Risk) threshold A* is defined as threshold X which minimizes expres-
sion infh supe (-1, where RA(B) = E(dA(x) - o ) ~ , x - N(B, I).
Wavelet Methods in Data Mining 613
The use of wavelet preprocessing to alleviate the effect of noisy data for biological data classification was investigated in (Li et al., 2002). The research has showed that, if the localities of the attributes are strong enough, wavelet denoising is able to improve the performance .
5.2 Data Transformation A wide class of operations can be performed directly in the wavelet do-
main by operating on coefficients of the wavelet transforms of original data sets. Operating in the wavelet domain enables to perform these operations progressively in a coarse-to-fine fashion, to operate on different resolutions, manipulate features at different scales, and localize the operation in both spa- tial and frequency domains. Performing such operations in the wavelet domain and then reconstructing the result is more efficient than performing the same operation in the standard direct fashion and reduces the memory footprint. In addition, wavelet transformations have the ability to reduce temporal correla- tion so that the correlation of wavelet coefficients are much smaller than the correlation of corresponding temporal process. Hence simple models that are insufficient in the original domain may be quite accurate in the wavelet domain. Researchers have proposed a new approach of applying Principal Component Analysis (PCA) on the wavelet subband (Feng et al., 2000). Wavelet trans- form is used to decompose an image into different frequency subbands and a mid-range frequency subband is used for PCA representation. A probability model for natural images, based on empirical observation of their statistics in the wavelet transform domain was developed in (Buccigrossi and Simoncelli, 1997). The researchers noted that pairs of wavelet coefficients, corresponding to basis functions at adjacent spatial locations, orientations, and scales, gener- ally to be non-Gaussian in both their marginal and joint statistical properties and specifically, their marginals are heavy-tailed, and although they are typi- cally decorrelated, their magnitudes are highly correlated.
5.3 Dimensionality Reduction The goal of dimension reduction is to express the original data set using
some smaller set of data with or without a loss of information. Dimensionality reduction can be thought as an extension of the data transformation presented in Section 5.2: while data transformation just transforms original data into wavelet domain without discarding any coefficients, dimensionality reduction only keeps a collection of selective wavelet coefficients. More formally, the dimensionality reduction problem is to project the n-dimensional tuples that represent the data in a k-dimensional space so that k << n and the distances are preserved as well as possible. Based on the different choices of wavelet coefficients, there are two different ways for dimensionality reduction using
614 DATA MINING AND KNOWLEDGE DISCOVERY HANDBOOK
wavelet: (a) Keeping the largest k coefficients and approximate the rest with 0, and (b) Keeping the first k coefficients and approximate the rest with 0. Keeping the largest k coefficients achieves more accurate representation while keeping the first k coefficients is useful for indexing. Keeping the first k coef- ficients implicitly assumes a priori the significance of all wavelet coefficients in the first k coarsest levels and that all wavelet coefficients at a higher resolu- tion levels are negligible. Such a strong prior assumption heavily depends on a suitable choice of k and essentially denies the possibility of local singularities in the underlying function (Abramovich et al., 2000).
It has been shown that (Stonllnitz et al., 1996), if the basis is orthonormal, in terms of L2 loss, maintaining the largest k wavelet coefficients provides the optimal k-term Haar approximation. Using the largest k wavelet coefficients, given a predefined precision E , Dimension reduction procedure can be sum- marized in the following steps: (1) Compute the wavelet coefficients of the original data set, (2) Sort the'coefficients in order of decreasing magnitude to produce the sequence q,, CI, . . . , C M - ~ , and (3) Starting with MI = M , find the best MI such that cEG, I ~ Q 1 1 5 E . I ~ Q 1 1 is the norm of Q. In general, the norm can be chosen as L2 norm or L1 norm or other norms.
6. Core Mining Process Core mining refers to the essential procedure where intelligent methods are
applied to extract useful information patterns. There are many Data Mining tasks such as clustering and classification etc. Each task can be thought as a particular kind of problem to be solved by a Data Mining algorithm. Generally there are many different algorithms could serve the purpose of the same task. Meanwhile, some algorithms can be applied to different tasks. In this section, we review the wavelet applications in Data Mining tasks and algorithms.
6.1 Clustering Intuitively, the clustering problem can be described as follows: Let W be
a set of n data points in a multi-dimensional space. Find a partition of W into classes such that the points within each class are similar to each other. The multi-resolution property of wavelet transforms inspires the researchers to consider algorithms that could identify clusters at different scales. WaveClus- ter (Sheikholeslami et al., 1998) is a multi-resolution clustering approach for very large spatial databases. Spatial data objects can be represented in an n- dimensional feature space and the numerical attributes of a spatial object can be represented by a feature vector where each element of the vector corresponds to one numerical attribute (feature). Partitioning the data space by a grid re- duces the number of data objects while inducing only small errors. From a signal processing perspective, if the collection of objects in the feature space is
Wavelet Methods in Data Mining 615
viewed as an n-dimensional signal, the high frequency parts of the signal cor- respond to the regions of the feature space where there is a rapid change in the distribution of objects (i.e., the boundaries of clusters) and the low frequency parts of the n-dimensional signal which have high amplitude correspond to the areas of the feature space where the objects are concentrated (i.e., the clusters). Applying wavelet transform on a signal decomposes it into different frequency sub-bands. Hence identifying clusters is converted to finding connected com- ponents in the transformed feature space. Moreover, application of wavelet transformation provides multiresolution data representation and hence finding the connected components could be carried out at different resolution levels.
6.2 Classification Classification problems aim to identify the characteristics that indicate the
group to which each instance belongs. Classification can be used both to under- stand the existing data and to predict how new instances will behave. Wavelets can be very useful for classification tasks. First, classification methods can be applied on the wavelet domain of the original data as discussed in Section 5.2 or selective dimensions of the wavelet domain as we will discussed in this sec- tion. Second, the multi-resolution property of wavelets can be incorporated into classification procedures to facilitate the process.
A wavelet-based classification algorithm on large two-dimensional data sets typically large digital images was developed by (Castelli et al., 1996). The image is viewed as a real-valued configuration on a rectangular subset of the integer lattice Z2 and each point on the lattice (i.e. pixel) is associated with a vector denoting as pixel-values and a label denoting its class. The classifi- cation problem here consists of observing an image with known pixel-values but unknown labels and assigning a label to each point and it was motivated primarily by the need to classify quickly and efficiently large images in digi- tal libraries. Traditional pixel-by-pixel analysis (Cromp and Campbell, 1993) is fairly computationally expensive and does not consider the correlation be- tween the labels of adjacent pixels. The wavelet-based classification method is based on the progressive classification (Castelli et al., 1996) framework: It uses generic classifiers on a low-resolution representation of the data obtained using discrete wavelet transform. The wavelet transformation produces a mul- tiresolution pyramid representation of the data. In this representation, at each level each coefficient corresponds to a k x k pixel block in the original image. At each step of the classification, the algorithm decides whether each coeffi- cient corresponds to a homogeneous block of pixels and assigns the same class label to the whole block or to re-examine the data at a higher resolution level. And the same process is repeated iteratively. The wavelet-based classification method achieves a significant speedup over traditional pixel-wise classification
616 DATA MINING AND KNOWLEDGE DISCOVERY HANDBOOK
methods. For images with pixel values that are highly correlated, the method will give more accurate results than the corresponding non-progressive classi- fier because DWT produces a weight average of the values for a k x k block and the algorithm tend to assume more uniformity in the image than may appear when we look at individual pixels. A paper by (Mojsilovic and Popovic, 1997) also proposed a wavelet-based approach for classification of texture samples with small dimensions. The idea is first to decompose the given image with a filter bank derived from an orthonormal wavelet basis and to form an image approximation with nigher resolution. Texture energy measures calculated at each output of the filter bank as well as energies if synthesized images are used as texture features for a classification procedure based on modified statistical t-test. A paper by (Aggarwal, 2002) exploited the multi-resolution property of wavelet decomposition to create a scheme which can mine classification characteristics at different levels of granularity.
6.3 Regression Regression uses existing values to forecast what other values will be and it
is one of the fundamental tasks of Data Mining. Consider the standard uni- variate nonparametric regression setting: y i = g ( t i ) + ~ i , i = 1, . . . , n where ~ i are independent N(0, u2) random variables. The goal is to recover the un- derlying function g from the noisy data ya, without assuming any particular parametric structure for g. The basic approach of using wavelets for nonpara- metric regression is to consider the unknown function g expanded as a general- ized wavelet series and then to estimate the wavelet coefficients from the data. Hence the original nonparametric problem is thus transformed to a parametric one (Abramovich et al., 2000). Note that the denoise problem we discussed in Section 5.1 can be regarded as a subtask of the regression problem since the estimation of the underlying function involves the noise removal from the observed data.
Linear Regression. For linear regression, we can express g ( t ) = &(t) + EGO z:=il wjk '$ ' jk ( t ) . where Q =< g , 4 >, W j k =< g, '$'jk >. If we assume g belongs to a class of functions with certain regularity, then the cor- responding norm of the sequence of w i k is finite and wik's decay to zero.
SO g ( t ) = @ 4 ( t ) -I- zgo~z=il wjk '$ ' jk ( t ) . for Some M and a c o n e sponding truncated wavelet estimator is (Abramovich et al., 2000) g ~ ( t ) =
$)(t) + zgO z:)=i1 ~ j ~ * ~ ( t ) . Thus the original nonparametric problem reduces to linear regression and the sample estimates of the coefficients are given by: $ = Cy=l 4 ( t i ) y i , 2i;.k = + ELl $ j k ( t i ) y i . The performance of the truncated wavelet estimator clearly depends on an appropriate choice of M. Various methods such as Akaike's Information Criterion and cross-
Wavelet Methods in Data Mining 617
validation can be used for choosing M. We should point out that: the linear regression approach here is similar to the dimensionality reduction by keep- ing the first several wavelet coefficients discussed in section 5.3. There is an implicit strong assumption underlying the approach: all wavelet coefficients in the first M coarsest levels are significant while all wavelet coefficients at a higher resolution levels are negligible. Such a strong assumption clearly would not hold for many functions. It has been shown that no linear estimator will be optimal in minimax sense for estimating inhomogeneous functions with local singularities (Donoho and Johnstone, 1998).
Nonlinear Regression. A nonlinear wavelet estimator of g based on recon- struction from a more judicious selection of the empirical wavelet coefficients was proposed in (Donoho and Johnstone, 1998). The vanishing moments prop- erty of wavelets makes it reasonable to assume that essentially only a few 'large' Gjk contain information about the underlying function g, while 'small' ti$k can be attributed to noise. If we can decide which are the 'significant' large wavelet coefficients, then we can retain them and set all the others equal to zero, so obtaining an approximate wavelet representation of underlying func- tion g. The key concept here is thresholding. Thresholding allows the data itself to decide which wavelet coefficients are significant. Clearly an appropri- ate choice of the threshold value X is fundamental to the effectiveness of the estimation procedure. Too large threshold might "cut off' important parts of the true function underlying the data while too small a threshold retains noise in the selective reconstruction. As described in Section 5.1, there are three commonly used thresholding functions. It has been shown that hard threshold- ing results in larger variance in the function estimate while soft thresholding has large bias. To comprise the trade-off between bias and variance, Bruce and Gao (Bruce and Gao, 1996) suggested a firm thresholding that combines the hard and soft thresholding. More discussion on nonlinear regression can be found in (Antoniadis, 1999).
6.4 Distributed Data Mining Over the years, data set sizes have grown rapidly. Moreover, many of these
data sets are, in nature, geographically distributed across multiple sites. To mine such large and distributed data sets, it is important to investigate efficient distributed algorithms to reduce the communication overhead, central storage requirements, and computation times. The orthogonal property of wavelet ba- sis could play an important role in distributed data mining since the orthogo- nality guarantees correct and independent local analysis that can be used as a building-block for a global model. In addition, the compact support property of wavelets could be used to design parallel algorithms since the compact sup-
618 DATA MINING AND KNOWLEDGE DISCOVERY HANDBOOK
port guarantees the localization of wavelet and processing a region of data with wavelet does not affect the the data out of this region.
The idea of performing distributed data analysis using wavelet-based Col- lective Data Mining(CDM) from heterogeneous sites was introduced by (Kar- gupta et al., 2000). The main steps for the approach can be summarized as follows: (1) choose an orthonormal representation that is appropriate for the type of data model to be constructed, (2) generate approximate orthonormal basis coefficients at each local site, (3) if necessary, move an approximately chosen sample of the datasets from each site to a single site and generate the approximate basis coefficients corresponding to non-linear cross terms, and (4) combine the local models, transform the model into the user described canon- ical representation and output the model. The foundation of CDM is based on the fact that any function can be represented in a distributed fashion using an appropriate basis. If we use wavelet basis, The orthogonality guarantees cor- rect and independent local analysis that can be used as a building-block for a global model.
6.5 Similarity SearcMndexing The problem of similarity search in Data Mining is: given a pattern of in-
terest, try to find similar patterns in the data set based on some similarity mea- sures. This task is most commonly used for time series, image and text data sets. Formally, A dataset is a set denoted DB = {XI, Xz, . . . ,Xi, . . . , XN), where Xi = [xh, xf , . . . , xk] and a given pattern is a sequence of data points Q = [go, 91, . . . , qn]. Given a pattern Q, the result set R from the data set is R = {Xil,Xiz7.. . ,Xij,. . . ,Xi,), where {i17iz, ,i,) {I,.. - , N), such that D(Xij, Q) < d. If we use Euclidean distance between X and Y as
the distance function D(X, Y), then D(X7 Y) = ,/-, which is v -
the aggregation of the point to point distance of two patterns. Wavelets could be applied into similarity search in several different ways. First, wavelets could transform the original data into the wavelet domain as described in Section 5.2 and we may also only keep selective wavelet coefficients to achieve dimen- sionality reduction as in Section 5.3. The similarity search are then conducted in the transformed domain and could be more efficient. Although the idea here is similar to that reviewed in Section 5.2 and Section 5.3: both involves trans- forming the original data into wavelet domain and may also selecting some wavelet coefficients. However, it should be noted that here for the data set: to project the n-dimensional space into a k-dimensional space using wavelets, the same k-wavelet coefficients should be stored for objects in the data set. Obvi- ously, this is not optimal for all objects. To find the k optimal coefficients for the data set, we need to compute the average energy for each coefficient. Sec- ond, wavelet transforms could be used to extract compact feature vectors and
Wavelet Methods in Data Mining 619
define new similarity measure to facilitate search. Third, wavelet transforms are able to support similarity search at different scales. The similarity measure could then be defined in an adaptive and interactive way.
Wavelets have been extensively used in similarity search in time series and excellent can be found in (Chiann and Morettin, 1999). Chan and Fu (Chan and Fu, 1999) proposed efficient time series matching strategy by wavelets. Haar transform wavelet transform is first applied and the first few coefficients of the transformed sequences are indexed in an R-Tree for similarity search. The method provides efficient for range and nearest neighborhood queries. A comprehensive comparison between DFT and DWT in time series matching was presented in (Wu et al., 2000). The experimental results show that al- though DWT does not reduce relative matching error and does not increase query precision in similarity search, DWT based techniques have several ad- vantage such as DWT has multi-resolution property and DWT has complex- ity of O ( N ) while DFT has complexity of O ( N log N ) . A new similarity measures based on the special presentations derived from Ha& wavelet trans- form was presented by (Struzik and Siebes, 1999). Instead of keeping selec- tive wavelet coefficients, the special representations keep only the sign of the wavelet coefficients (sign representation) or keep the difference of the loga- rithms (DOL) of the values of the wavelet coefficient at highest scale and the working scale (DOL representation).
Wavelets also have widespread applications in content-based similarity search in imagelaudio databases. A method of using image querying metric for fast and efficient content-based image querying was presented by (Jacobs et al., 1995). The image querying metric is computed on the wavelet signatures which are obtained by truncated and quantized wavelet decomposition. WAL- RUS (WAveLet-based Retrieval of User-specified Scenes) (Natsev et al., 1999) is an algorithm for similarity retrieval in image diastases. WALRUS first uses dynamic programming to compute wavelet signatures for sliding windows of varying size, then clusters the signatures in wavelet space and finally the sim- ilarity measure between a pair of images is calculated to be the fraction of the area the two images covered by matching signatures. Windsurf(Wave1et-Based Indexing of Images Using Region Fragmentation) (Ardizzoni et al., 1999) is a new approach for image retrieval. Windsurf uses Haar wavelet transform to extract color and texture features and applies clustering techniques to partition the image into regions. Similarity is then computed as the Bhattcharyya met- ric (Campbell, 1997) between matching regions. Brambilla (Brambilla, 1999) defined an effective strategy which exploits multi-resolution wavelet transform to effectively describe image content and is capable of interactive learning of the similarity measure. WBIIS (Wavelet-Based Image Indexing and Searching) (Wang, Wiederhold, Firschein and Wei, 1997) is a new image indexing and re- trieval algorithm with partial sketch image searching capability for large image
620 DATA MINING AND KNOWLEDGE DISCOVERY HANDBOOK
databases. WBIIS applies Daubechies-8 wavelets for each color component and low frequency wavelet coefficients and their variance are stored as feature vectors. Wang, Wiederhold and Firschein (Wang, Wiederhold and Firschein, 1997) described WIPETM (Wavelet Image Pornography Elimination) for im- age retrieval. WIPETM uses Daubechies-3 wavelets, normalized central mo- ments and color histograms to provide feature vector for similarity matching. Subramanya and Youssef (Subramanya and Youssef, 1998) presented a scal- able content-based image indexing and retrieval system based on vector coef- ficients of color images where highly decorrelated wavelet coefficient planes are used to acquire a search efficient feature space. A fast wavelet histogram techniques for image indexing was proposed in (Mandal et al., 1999). There are also lots of applications of wavelets in audio/music information processing such as (Tzanetakis and Cook, 2002; Li, Ogihara, and Li, 2003).
6.6 Approximate Query Processing Query processing is a general task in Data Mining and similarity search dis-
cussed in Section 6.5 is one of the specific form of query processing. Approxi- mate query processing has recently emerged as a viable solution for large-scale decision support. Due to the exploratory nature of many decision support ap- plications, there are a number of scenarios where an exact answer may not be required and a user may in fact prefer a fast approximate answer. Wavelet- based techniques can be applied as a data reduction mechanism to obtain wavelet synopses of the data on which the approximate query could then op- erate. The wavelet synopses are compact sets of wavelet coefficients obtained by the wavelet decomposition. Note that some of wavelet methods described here might overlap with those described in Section 5.3. The wavelet synopses reduce large amount of data to compact sets and hence could provide fast and reasonably approximate answers to queries.
A wavelet-based technique to build histograms on the underlying data distri- butions for selectivity estimation was presented in (Matias et al., 1998; Matias et al., 2000). Moreover s wavelet-based techniques for the approximation of range-sum queries over OLAP data cubes was proposed in (Vitter and Wang, 1999; Vitter et al., 1998). Generally, the central idea is to apply multidimen- sional wavelet decomposition on the input data collection (attribute columns or OLAP cube) to obtain a compact data synopsis by keeping a selective small collection of wavelet coefficients.
An extension (Chakrabarti et al., 2001) to previous work on wavelet tech- niques in approximate query answering demonstrates that wavelets could be used as a generic and effective tool for decision support applications. The generic approach consists of three steps: the wavelet-coefficient synopses are first computed and then using novel query processing algorithms SQL opera-
Wavelet Methods in Data Mining 62 1
tors such as select, project and join can be executed entirely in the wavelet- coefficient domain. Finally the results is mapped from the wavelet domain to relational tuples (Rendering).
Techniques for computing small space representations of massive data streams by keeping a small number of wavelet coefficients and using the rep- resentations for approximate aggregate queries was presented in (Gilbert et al., 2001). Garofalakis and Gibbons (Garofalakis and Gibbons, 2002) introduced probabilistic wavelet synopses that provably enabled unbiased data reconstruc- tion with guarantees on the accuracy of individual approximate answers. The probabilistic technique is based on probabilistic thresholding scheme to assign each coefficient a probability of being retained instead of deterministic thresh- olding.
6.7 Traffic Modeling Traffic modeling and understanding is imperative to providing Quality of
Service (QoS) to network management and control, and to network design and simulation. It is therefore important to accurately model key statistical proper- ties of traffic; while achieving computational efficiency when the model is used for generating synthetic traffic or for prediction. In early 90s, a surge of work have shown that Internet IP traffic, web traffic and multimedia stream (e.g. MPEG traffic) have the complex temporal correlation structure best charac- terized by both the short-range dependence (SRD) and long-range dependence (LRD) (Garrett and Willinger, 1994). SRD traffic has a short memory; its auto- correlation function decays exponentially. In contrast, LRD has a long memory and a self-similar property; its auto-correlation function decays hyperbolically. Figure 27.8 shows the correlation function of FARIMA (fractional differentia- tion of an auto-regressive moving average) model that possesses both SRD (the correlation function drops exponentially when the lag is small) and LRD (the correlation function drops polynomially when the lag is large). Its correlation is still non-negligible when lag is 400.
Wavelet models have been demonstrated as a good candidate to charac- terize traffic (Abry and Darryl, 1998) and further model traffic (Ma and Ji, 2001; Ribeiro et al., 1999) with a complex temporal correlation structure as its base functions match the self-similar property of traffic. Let x ( t ) be a time series representing traffic, t E [O, 2K - 11. Through wavelet transformation,
K 2K-3-1 we have x ( t ) = Cj=l T + ? ( t ) + 40, where is equal to the av- erage value of x ( t ) over t E [0, 2K - 11. When x ( t ) is a random process, the corresponding wavelet coefficients T's define a two-dimensional random processes in terms of j and m. Due to the one-to-one correspondence between x ( t ) and its wavelet coefficients, the statistical properties of the wavelet coef- ficients are completely determined by those of x ( t ) . Likewise, if the statistical
622 DATA MINING AND KNOWLEDGE DISCOVERY HANDBOOK
Figure 27.8. Correlation Function of Figure 27.9. Correlation Matrix of "FARIMA(l,OA,O)". "FARIMA(1 ,OA,O)".
properties of the wavelet coefficients are well specified, they can be used to characterize the original random process. This motivates the approach of traf- fic modeling by characterizing statistical properties of waveletcoefficients.
Why modeling in wavelet domain can be more effective than that in time domain? Figure 27.9 shows the correlation matrix of wavelet coefficients of the FARIMA model, in which a pixel (i, k) in an image represents the correlation between the i-th and the k-th wavelet coefficients, where i and k result in the one dimension index. The gray level is proportional to the magnitude of the correlation. The higher the magnitude of the correlation, the whiter the pixel in the image. The diagonal line is corresponding to the variance of each wavelet. The bright lines (i.e. significant correlations) from diagonal correspond to the correlations between yk(s) and s, where y(s) represents the parent of the node s, and ?"s) denotes the parent of the node y"' ( s ) with k being 1,2,3,4 from the diagonal line. Comparing Figure 27.8 and Figure 27.9, we can see that the complicated temporal correlation concentrates on only a few key correlation patterns in the wavelet domain. Thus, we can use a compact model in the wavelet domain to represent the original traffic. Ma and Ji (Ma and Ji, 2001) have demonstrated an independent wavelet model can have a very satisfactory accuracy in matching the possible complex temporal correlation and matching the queuing loss behaviors. Further, a low order Markov model in the wavelet domain that model father-son relationships can boost modeling accuracy. A further development of multiscale wavelet model and its theoretical inside was presented in (Ribeiro et al., 1999).
7. Conclusion Wavelet techniques have a lot of advantages and there already exists numer-
ous successful applications in Data Mining. It goes without saying that wavelet approaches will be of growing importance in Data Mining.
Wavelet Methods in Data Mining 623
It should also be mentioned that most of current works on wavelet applica- tions in Data Mining are based orthonormal wavelet basis. However, we argue that orthonormal basis may not be the best representation for noisy data even though the vanishing moments can help them achieve denoising and dimen- sionality reduction purpose. Intuitively, orthogonality is the most economical representation. In other words, in each direction, it contains equally important information. Therefore, it is usually likely that thresholding wavelet coeffi- cients remove useful information when they try to remove the noise or redun- dant information (noise can also be regarded as one kind of redundant informa- tion). To represent redundant information, it might be good to use redundant wavelet representation - wavelet frames. Except orthogonality, wavelet frames preserve all other properties that an orthonormal wavelet basis owns, such as vanishing moment, compact support, multiresolution. The redundancy of a wavelet frame means that the frame functions are not independent anymore. For example, vectors [O,1] and [I, 0] is an orthonormal basis of a plane R ~ , while vectors [1/2,1/2], [-1/2,1/2], and [O, -11 are not independent, and consist a frame for R ~ . SO when data contain noise, frames may provide some specific directions to record the noise. Our work will be the establishment of criteria to recognize the direction of noise or redundant information.
Wavelets could also potentially enable many other new researches and appli- cations such as conventional database compression, multiresolution data anal- ysis and fast approximate Data Mining etc. Finally we eagerly await many future developments and applications of wavelet approaches in Data Mining.
Notes 1. Note that this orthogonality is not an essential property of wavelets. We include it in the definition
because we discuss wavelet in the context of Daubechies wavelet and orthogonality is a good property in many applications.
2. 7i means the conjugate of a. 3. Haar wavelet represents the same wavelet as Daubechies wavelets with support at [0, 11, called dbl. 4. For example, d,j is 4 (The shift index, rn, starts from 0.) in the given example.
References F. Abramovich, T. Bailey, and T. Sapatinas. Wavelet analysis and its statistical
applications. JRSSD, (48): 1-30,2000. P. Abry and V. Darryl. Wavelet analysis of long-range-dependent traffic. IEEE
Transactions on Information Theory, 44(1):2-16, 1998. C. C. Aggarwal. On effective classification of strings with wavelets. In Pro-
ceedings of the eighth ACM SIGKDD international conference on Knowl- edge discovery and Data Mining, pages 163-172,2002.
A. Antoniadis. Wavelets in statistics: a review. J. It. Statist. Soc., 1999.
624 DATA MINING AND KNOWLEDGE DISCOVERY HANDBOOK
S. Ardizzoni, I. Bartolini, and M. Patella. Windsurf: Region-based image re- trieval using wavelets. In DEXA Workshop, pages 167-173, 1999.
C. Brambilla, A. D. Ventura, I. Gagliardi, and R. Schettini. Multiresolution wavelet transform and supervised learning for content-based image re- trieval. In Proceedings of the IEEE International Conference on Multimedia Computing and Systems, pages 9 183-91 88,1999.
A. Bruce and H.-Y. Gao. Waveshrink with firm shrinkage. Statistics Sinica, (4):855-874, 1996.
R. W. Buccigrossi and E. P. Simoncelli. Image compression via joint statis- tical characterization in the wavelet domain. In Proceedings ICASSP-97 (IEEE International Conference on Acoustics, Speech and Signal Process- ing), number 414, pages 168&1701,1997.
J. P. Campbell. Speaker recognition: A tutorial. In Proceedings of the IEEE, volume 85, pages 1437-1461, Sept. 1997.
V. Castelli, C. Li, J. Turek, and I. Kontoyiannis. Progressive classification in the compressed domain for large EOS satellite databases, April 1996.
K. Chakrabarti, M. Garofalakis, R. Rastogi, and K. Shim. Approximate query processing using wavelets. VLDB Journal, lO(2-3): 199-223,2001.
K. P. Chan and A. W.-C. Fu. Efficient time series matching by wavelets. In ICDE, pages 126133,1999.
C. Chiann and P. A. Morettin. A wavelet analysis for time series. Journal of Nonparametric Statistics, lO(1): 1-46, 1999.
R. F. Cromp and W. J. Campbell. Data Mining of multidimensional remotely sensed images. In Pmc. 2nd International Conference of Information and Knowledge Management,, pages 471480,1993.
I. Daubechies. Ten Lectures on' Wavelets. Capital City Press, Montpelier, Ver- mont, 1992.
D. L. Donoho and I. M. Johnstone. Minimax estimation via wavelet shrinkage. Annals of Statistics, 26(3):879-921, 1998.
G. C. Feng, P. C. Yuen, and D. Q. Dai. Human face recognition using PCA on wavelet subband. SPIE Journal of Electronic Imaging, 9(2):226-233,2000.
P. Flandrin. Wavelet analysis and synthesis of fractional Brownian motion. IEEE Transactions on Information Theory, 38(2):9 10-9 17, 1992.
M. Garofalakis and P. B. Gibbons. Wavelet synopses with erro guarantee. In Proceedings of 2002 ACM SIGMOD, pages 476-487,2002.
M. W. Garrett and W. Willinger. Analysis, modeling and generation of self- similar VBR video traffic. In Proceedings of SIGCOM, pages 269-279, 1994.
A. C. Gilbert, Y. Kotidis, S. Muthukrishnan, and M. Strauss. Surfing wavelets on streams: One-pass summaries for approximate aggregate queries. In The VLDB Journal, pages 79-88,2001.
Wavelet Methods in Data Mining 625
C. E. Jacobs, A. Finkelstein, and D. H. Salesin. Fast multiresolution image querying. Computer Graphics, 29:277-286, 1995.
J.S.Vitter, M. Wang, and B. Iyer. Data cube approximation and histograms via wavelets. In Proc. of the 7th Intl. Con$ On Infomration and Knowledge Management, pages 96104,1998.
H. Kargupta, B. Park, D. Hershbereger, and E. Johnson. Collective Data Min- ing: A new perspective toward distributed data mining. In Advances in Dis- tributed Data Mining, pages 133-184.2000.
Q. Li, T. Li, and S. Zhu. Improving medicaVbiological data classification per- formance by wavelet pre-processing. In ICDM, pages 657460,2002.
T. Li, Q. Li, S. Zhu, and M. Ogihara. A survey on wavelet applications in Data Mining. SIGKDD Explorations, 4(2):49-68,2003.
T. Li, M. Ogihara, and Q. Li. A comparative study on content-based music genre classification. In Proceedings of 26th Annual ACM Conference on Research and Development in Information Retrieval (SIGIR 2003), pages 282-289,2003.
M. Luettgen, W. C. Karl, and A. S. Willsky. Multiscale representations of markov random fields. IEEE Trans. Signal Processing, 41:3377-3396, 1993.
S. Ma and C. Ji. Modeling heterogeneous network traffic in wavelet domain. IEEELACM Transactions on Networking, 9(5):634-649,2001.
S. Mallat. A theory for multiresolution signal decomposition: the wavelet rep- resentation. IEEE Transactions on Pattern Analysis and Machine Intelli- gence, 11(7):674-693, 1989.
M. K. Mandal, T. Aboulnasr, and S. Panchanathan. Fast wavelet histogram techniques for image indexing. Computer Vision and Image Understanding: CVIU, 75(1-2):99-110, 1999.
Y. Matias, J. S. Vitter, and M. Wang. Wavelet-based histograms for selectivity estimation. In ACM SIGMOD, pages 448-459. ACM Press, 1998.
Y. Matias, J. S. Vitter, and M. Wang. Dynamic maintenance of wavelet-based histograms. In Proceedings of 26th International Conference on Very Large Data Bases, pages 10 1- 1 10,2000.
A. Mojsilovic and M. V. Popovic. Wavelet image extension for analysis and classification of infarcted myocardial tissue. IEEE Transactions on Biomed- ical Engineering, 44(9):856-866, 1997.
A. Natsev, R. Rastogi, and K. Shim. Wa1ms:a similarity retrieval algorithm for image databases. In Proceedings of ACM SIGMOD International Confer- ence on Management of Data, pages 395406. ACM Press, 1999.
R. Polikar. The wavelet tutorial. Internet Resources:http://engineering.rowan. edul polikar/WAVELETS/WTtutorial.html.
626 DATA MINING AND KNOWLEDGE DISCOVERY HANDBOOK
V. Ribeiro, R. Riedi, M. Crouse, and R. Baraniuk. Simulation of non- gaussian long-range-dependent traffic using wavelets. In Proc. ACM SIGMETRICS'99, pages 1-12,1999.
C. Shahabi, S. Chung, M. Safar, and G. Hajj. 2d TSA-tree: A wavelet-based approach to improve the efficiency of multi-level spatial Data Mining. In Statistical and Scientijc Database Management, pages 5948,2001.
C. Shahabi, X. Tian, and W. Zhao. TSA-tree: A wavelet-based approach to improve the efficiency of multi-level surprise and trend queries on time- series data. In Statistical and Scientijc Database Management, pages 55- 68,2000.
G. Sheikholeslami, S. Chatterjee, and A. Zhang. Wavecluster: A multi- resolution clustering approach for very large spatial databases. In Proc. 24th Int. Con$ Very Large Data Bases, VLDB, pages 428-439, 1998.
E. J. Stonllnitz, T. D. DeRose, and D. H. Salesin. Wavelets for computer graph- ics, theory and applications. Morgan Kaufman Publishers, San Francisco, CA, USA, 1996.
Z. R. Struzik and A. Siebes. The haar wavelet transform in the time series similarity paradigm. In Proceedings of PKDD'99, pages 12-22, 1999.
S. R. Subramanya and A. Youssef. Wavelet-based indexing of audio data in audio/multimedia databases. In IW-MMDBMS, pages 46-53, 1998.
G. Tzanetakis and P. Cook. Musical genre classification of audio signals. IEEE Transactions on Speech and Audio Processing, 10(5):293-302, July 2002.
J. S. Vitter and M. Wang. Approximate computation of multidimensional ag- gregates of sparse data using wavelets. In Proceedings of the 1999 ACM SIGMOD International Conference on Management of Data, pages 193- 204,1999.
J. Z. Wang, G. Wiederhold, and 0. Firschein. System for screening objec- tionable images using daubechies' wavelets and color histograms. In In- teractive Distributed Multimedia Systems and Telecommunication Services, pages 20-30,1997.
J . Z. Wang, G. Wiederhold, 0. Firschein, and S. X. Wei. Content-based image indexing and searching using daubechies' wavelets. International Journal on Digital Libraries, 1(4):311-328, 1997.
Y.-L. Wu, D. Agrawal, and A. E. Abbadi. A comparison of DFT and DWT based similarity search in time-series databases. In CIKM, pages 488-495, 2000.