he efforts to determine the source wavelength beganany years ago, when chemists based their studies
egarding chemical elements on their ability to distin-uish between different wavelengths in a particularpectrum.1
These studies essentially focused on grating spec-rographs, which were analyzed by use of densitom-try and other related techniques. These studiesead and interpreted the spectrograph responses, en-bling the discovery of new atomic elements as wells the classification of ones previously known and theecognition of some compounds.
Because of the spectrographic procedures, spectro-raphs were used as wavelength meters until require-ents of greater accuracy, precision, and resolution
ropelled the development of new systems, many ofhem based on interferometric principles.2 Perhapshe most powerful of those interferometric approacheso determine the source wavelength are the Fizeau andhe Fabry–Perot wavemeters,2 which presently incor-orate sophisticated fringe-analysis systems.Nowadays, the research and development of im-
roved wavemeter systems are the focus of part of theptical community. In this way, these systems
The authors are with the School of Physics, Universidad Nacio-al de Colombia Sede Medellin, A.A. 3840, Medellin, Colombia.. Hincapie is also with the School of Mechanical Engineering at
he Universidad Nacional de Colombia Sede Medellin. J. Garcia-ucerquia’s e-mail address is [email protected] 16 March 2004; revised manuscript received 23 June
004; accepted 10 July 2004.0003-6935�04�336095-05$15.00�0
volved from very simple systems that were based onptical fiber and were compact and cheap to veryophisticated systems that relied on Fabry–Perot in-erferometers and complex systems of signalnalyses.1–5 Those efforts have allowed theavemeter technology to reach such important reso-
utions as 1 part in 108, and currently commercialevices provide accuracies of �0.3 pm.6In this paper a simple method to measure the wave-
ength of cw lasers is shown that is based on the use ofMichelson interferometer, which produces a moire
attern at its output that allows us to determine annknown wavelength in terms of a reference wave-
ength. The implemented idea is supported on thenalyses of the intensity recorded at the output planef a Michelson interferometer illuminated by twolane waves that are individually coherent but mutu-lly incoherent. At that output plane, an incoherenti.e., intensity-based� superposition of the interfero-rams generated by the reference and the problemource produces a moire pattern, which carries thenformation of the unknown wavelength.
In the recorded intensity, two easily differentiablepatial frequencies are presented that allow us toetermine the unknown wavelength in terms of theeference wavelength. Theoretical analysis and ex-erimental results show that the proposed methodrovides wavelength information with uncertaintiesf few nanometers. In addition to the simplicity ofhis technique in order to obtain an unknown wave-ength, it can be used as a simple teaching tool, too.
. Fundamentals
et us consider the Michelson interferometric setupepicted in Fig. 1. In this arrangement two individ-
avelength �A and �B are located at the entrancelane of the interferometer. The behavior of thisnterferometric setup under single coherent illumina-ion has been widely studied because of its numerouspplications.7–12
Owing to the mutually incoherent relationship be-ween the two sources SA and SB, it is possible toetermine the separate setup responses in intensityor each input and to merge the results afterwards forbtaining the complete response.An amplitude-splitting interferometer can be un-
erstood as composed of two virtual sources, whichrise from the imaging process of the optical sourceor the observation plane. The separation betweenhe virtual sources accounts for the optical-path dif-erence of the interferometer.8–10 This idea allowss to analyze the relative tilt between mirrors M1nd M2 by means of the geometrical arrangementhown in Fig. 2.9,10
Assuming unitary refraction index for the wedgeetermined by M1 and M2� �M2 image�, the opticalath difference can be provided by the separationetween the two virtual sources, S1 located on M1nd S located on M2�. Consequently, the opticalath difference regarding the observation point PPS1, PS� for each source can be appropriately ex-ressed as9,10
� x, y� � 2d cos���
�2�d0 � D tan��tan�� � D tan���tan���
�1 � tan2�� � tan2��� 1�2 .
(1)
ere, 2d is the distance between an arbitrary point
ig. 1. Michelson interferometer with tilted mirror. SA and SBre mutually incoherent pointlike sources, L1 is the collimationens, Bs is the 50�50 beam splitter, M1 and M2 are the plane
irrors, M2� is the M2 image, L2 is the observation lens, and theCD camera is the registration device.
n M1 and its image on M2�, 2d0 is the smallest width d
f the wedge measured along the perpendiculartraight line to M2� on A, �, �, �� are the observationngles shown in Fig. 2, and 2� and 2 denote theelative apertures in terms of which any tilt of theirrors can be expressed.For the wavelength measurement we are consider-
ng, the analysis is simpler if the interferometer isuned to obtain parallel straight fringes to any coor-inate axis x or y, which are denoted at the observa-ion by D tan�� � x and D tan��� � y, respectively.
Let us consider parallel straight fringes to the yxis, with � � 0 and � 0. Then, the optical pathifference �Eq. �1� becomes
�� x, y� �2�d0 � D tan��tan��
�1 � tan2�� � tan2��� 1�2
� 2�d0 � x tan�� , (2)
eaching equality for the paraxial observation. Thisptical path difference depends only on the geometricalarameters of the experiment; therefore it is the sameor each illuminating source SA and SB independentlyf their wavelengths �A and �B, respectively.Owing to the amplitude superposition of the optical
elds generated on S1 and S by each mutually inco-erent source SA and SB, an intensity distribution ofhe form8,9
I� x, y�j � 2I0�1 � cos�2�
�j�� x, y��� (3)
ill be recorded at the output plane of the interferom-ter. Here, j � A, B describes the contributions dueo the illumination sources of wavelengths �A and �B,espectively, and uniform illumination I0 has beenonsidered for each mirror.
From Eq. �3� the optical path difference ��x, y� will
ig. 2. Geometry of the wedge determined by mirror M1 and themage of mirror M2 in the Michelson interferometer. The angles� and 2 denote the relative aperture in terms of which any tiltf the mirrors can be expressed. D is the observation distance.
etermine the illumination at each point on the ob-
sf
ws
aa
wirb
Tpavtiso
nmpta
Acss
mt
tdolf
ws�iTuiso
rse
3
Tsta�rap
rtgsdPL
s
tmsm
chAmcem
c
ervation plane in such a way that dark and brightringes will appear, following the rule
�� x, y� � ��m �12�j dark fringes
m�j bright fringes,
here m is an integer and �j represents the corre-ponding wavelengths �A and �B, respectively.Under paraxial observation, i.e., small angles
nd �, Eq. �2� points out that dark and bright fringesppear along the x axis according to the condition
x � ��m �12 �j
2 tan �
d0
tan dark fringes
m�j
2 tan �
d0
tan bright fringes
,
(4)
here m is an integer. Then the maximum and min-mum intensity loci are straight lines equally sepa-ated and parallel to the y axis. The separationetween consecutive maxima �minima� will be given by
Px ��j
2 tan��.
hus the spatial period of the interference fringes isrovided by each wavelength �A and �B and by the tiltngle between mirrors M1 and M2. However,ariations of the smallest wedge’s width d0 will shifthe interferogram phase as a whole without modify-ng the separation or the orientation of the fringeystem. Therefore this parameter can be droppedut of our analysis.Since such tilt angle is the same for each illumi-
ating source SA and SB, and taking into account theutual incoherence between them, two interference
atterns described by Eq. �3� will superimpose in in-ensity at the observation plane �CCD plane�, gener-ting a moire pattern4 in the following fashion:
I� x, y� � IA� x, y� � IB� x, y�
� 4I0�1 � cos���� x, y�� 1�A
�1�B�cos���� x, y�� 1
�A�
1�B�� . (5)
ccording to Eq. �5� the intensity distribution re-orded by the CCD camera is a cosine-like fringeystem, given by the first cosine term on the rightide of Eq. �5�, with spatial period
Px� ���
tan��, �� �
�A�B
�A � �B,
odulated by a second cosine pattern of bigger spa-ial period
�� �A�B
Px� �tan��
, �� ��A � �B
.p
2
Both spatial periods can be measured directly fromhe CCD register, and these quantities can be used toetermine one of the wavelengths through knowledgef the other one. For instance, if we know the wave-ength �A, then the value of �B will be given by theollowing expression:
�B � �A�Px� � Px�
Px� � Px�
��Px� � �Px�
Px� � Px�
� �1 �Px� � Px�
Px� � Px�� , (6)
here �Px�, �Px� are the uncertainties in the mea-urements of Px� and Px�, respectively. From Eq.5� the uncertainty of the measured wavelength isnversely proportional to the periods Px� and Px�.herefore it is possible to control the uncertainty val-es of the unknown wavelength by correctly adjust-
ng the tilt angle of the movable mirror, i.e., themaller the tilt angle is, the smaller the uncertaintyf the measured wavelength is.This uncertainty is also directly proportional to the
eference wavelength, suggesting that the use ofhort wavelengths is as possible as the use of refer-nce wavelengths.
. Experimental Results
o validate the proposed method of wavelength mea-uring, we implemented the experimental configura-ion depicted in Fig. 1. Two He–Ne lasers were useds illumination sources with wavelengths of 543 nmused as reference� and 633 nm �used as unknown�,espectively. The shorter wavelength was chosen asreference in order to keep the uncertainty as lower asossible.A TM-6703 CCD camera �Pulnix, Sunnyvale, Calif.�
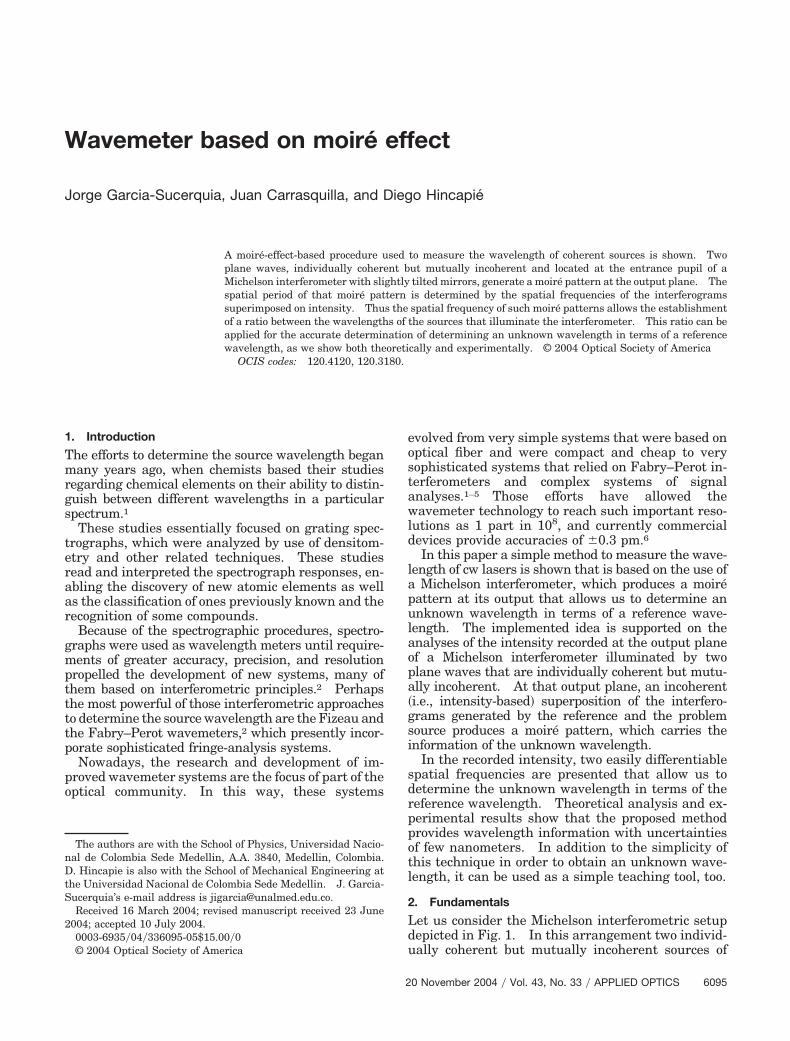
ecorded the interferometric patterns and transferredhem to a personal computer through a Genesis framerabber �Matrox, Dorval, Quebec, Canada�. Thetored images were analyzed by means of softwareeveloped in MATLAB, which determines the quantitiesx� and Px�, illustrated in Fig. 3. Afterwards, MAT-
AB calculates the unknown wavelength and the re-pective uncertainty by applying Eq. �6�.
Several experiments with different tilt angles forhe movable mirror were performed. These experi-ents confirmed the theoretical statement that
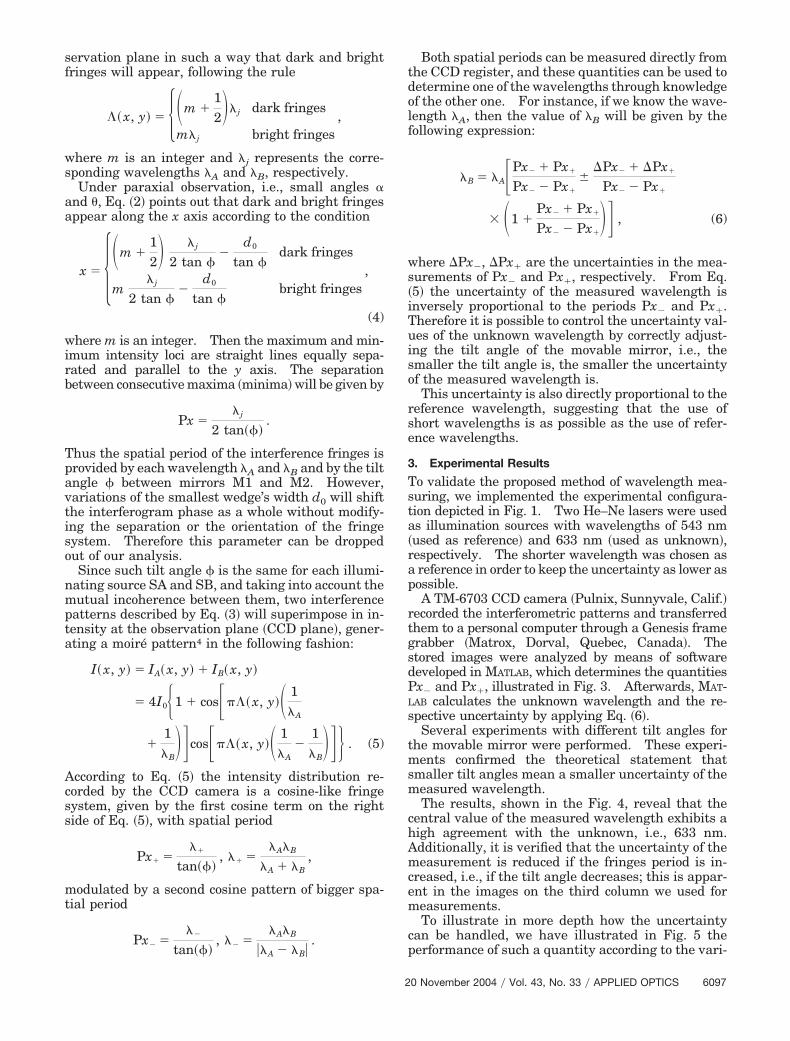
maller tilt angles mean a smaller uncertainty of theeasured wavelength.The results, shown in the Fig. 4, reveal that the
entral value of the measured wavelength exhibits aigh agreement with the unknown, i.e., 633 nm.dditionally, it is verified that the uncertainty of theeasurement is reduced if the fringes period is in-
reased, i.e., if the tilt angle decreases; this is appar-nt in the images on the third column we used foreasurements.To illustrate in more depth how the uncertainty
an be handled, we have illustrated in Fig. 5 the
erformance of such a quantity according to the vari-
tions of the tilt angle and the unknown wavelength,hen a reference wavelength of 543 nm is used.As was implied by the theoretical analyses and
onfirmed by the experimental results, the uncer-ainty in the measurement process will evolve con-istent with the period of the fringe systems,ontrolled by the tilt angle of the mirrors in the in-erferometer and according to the relationship be-ween the reference and the unknown wavelengths.
For the particular case illustrated in Fig. 5, wherereference wavelength of 543 nm was chosen, it is
pparent that as the unknown wavelength and theeference wavelength are closer, the uncertainty wille smaller. Therefore the uncertainty will vanish ifhe unknown wavelength is 543 nm. Additionally, its clear from Fig. 5 that for each unknown wave-ength the uncertainty will be smaller as the tilt an-le of the mirrors in the interferometer is alsomaller. Therefore for all the unknown wave-engths the uncertainty will vanish at zero tilt angle.
Certainly, such ideal conditions are impossible toe implemented in an experimental measuring pro-ess. Because of this, a more realistic evolution ofhe uncertainty is shown in Fig. 6 for the same ref-rence wavelength of 543 nm. Figure 6�a� depictshe uncertainty when a tilt angle of 3° is selected,herefore it is evident that the uncertainty will van-sh if the unknown wavelength is 543 nm. Other-ise, a linear behavior of the uncertainty isredominant if the unknown wavelength is greaterhan the reference wavelength, but in the contraryase such a performance will no longer be linear.
This linear evolution also supports the previouslytated fact that the best reference wavelength has aalue as small as possible in comparison with thenknown wavelength. This does not mean thathoosing a bigger reference wavelength is impossible.he only difference will be the nonlinear behavior of
he uncertainty with the changing of the unknownavelength for a particular tilt angle.On the other hand, Fig. 6�b� illustrates the progress
ig. 3. Moire pattern recorded by the CCD camera at the outputlane. Px� and Px� are the measurements required for determin-ng the unknown wavelength and its uncertainty by use of Eq. �5�.
f the uncertainty for a particular unknown wave- t
ength, when the tilt angle is swept. We considerhe case of 633-nm unknown wavelength in order toupport the experiments developed in this research.
fully linear performance of such quantity is evi-ent, indicating that for all unknown wavelengthshe variations of the uncertainty will be linear, start-ng from zero nanometers when the mirrors are par-llel. This performance states more clearly that thencertainty will be smaller as the tilt angle between
Fig. 4. Experimental results of wavelength determination.
he mirrors is also smaller.
Fecaat
4
Ienstrilt
tsmsp
atTdtfl
SSClsi
R
1
1
1
Fal
Fwa6
Finally, according to the above paragraphs andigs. 5 and 6, it is possible to tune up the interferom-ter to obtain the smallest possible uncertainty, re-alling that such a tuneup is reached by selecting theppropriate reference wavelength and the right tiltngle and by considering the experimental limita-ions to reach a configuration.
ig. 5. Uncertainty behavior according to the variations of the tiltngle and the unknown wavelength by use of a reference wave-ength of 543 nm.
ig. 6. Marginal figures of the uncertainty when a reference aavelength of 543 nm was chosen. �a� Uncertainty consideredlong the tilt angle of 3°, �b� Uncertainty measured along the
33-nm unknown wavelength.
2
. Conclusions
t is possible to determine the wavelength of a coher-nt optical �problem� source by illuminating simulta-eously a Michelson interferometer with the problemource and a source of known wavelength. The in-ensity pattern recorded at the observation plane cor-esponds to a moire pattern that delivers the requirednformation to determine the wavelength of the prob-em source by simply measuring the spatial periodshat are noticeable on it.
Although the experimental uncertainties are biggerhan those obtained by more sophisticated and expen-ive techniques, the central values are in good agree-ent with the value corresponding to the problem
ource, allowing us to state the correctness and theerformance of this simple and inexpensive technique.The simplicity of the experimental arrangement
nd its analysis show this method to be the right toolo measure the wavelength of a problem source.his proposal can also be applied to teaching proce-ures of metrological issues at different levels ofraining, providing insight on the Michelson inter-erometer, its analysis, the moire effect and wave-ength measuring.
The authors thank Division de Investigacionesede Medellın �Universidad Nacional de Colombiaede Medellın Grant 20201004539�, and Institutoolombiano para el Desarrollo de la Ciencia y Tecno-
ogıa, “Francisco Jose de Caldas,” for their financialupport. We also thank R. Castanada for his inspir-ng discussions and readings.
eferences1. J. L. Hall and J. L. Carlsten, Laser Spectroscopy III, Vol. 7 of
Springer Series in Optical Sciences �Springer-Verlag, New York,1977�.
2. J. Snyder, “Laser wavelength meters,” Laser Focus 18, 55–61�1982�.
3. W. DeGraffenreid and C. Sansonetti, “Reference lines in theoptogalvanic spectra of uranium and thorium over the wave-length range 694755 nm,” J. Opt. Soc. A. 19, 1711–1715 �2002�.
4. T. Dimmick and J. Weidner, “Simple, inexpensive wavemeterimplemented with a fused fiber coupler,” Appl. Opt. 36, 1898–1901 �1997�.
5. R. Salimbeni and R. Pole, “Compact high-accuracy waveme-ter,” Opt. Lett. 5, 39–41 �1980�.
7. D. Malacara, Optical Shop Testing, 2nd ed. �Wiley, New York,1992�.
8. A. W. Ian and D. Malacara, “First-order parameters for ageneral two-beam interferometer,” Appl. Opt. 34, 3571–3575�1995�.
9. J. Valasek, Introduction to Theoretical and Experimental Op-tics �Wiley, New York, 1949�.
0. R. Castaneda and J. Garcia-Sucerquia, “Fourier analysis ap-plied to the characterization of optical wedges with small an-gles,” Appl. Opt. 38, 6522–6527 �1999�.
1. B. E. A. Saleh and M. C. Teich, Fundamentals of Photonics�Wiley, New York, 1991�.
2. M. Born and E. Wolf, Principles of Optics, 7th ed. �Cambridge