3/25/2016 Making Homeownership More Accessible Using Fixed-COFI Mortgages Wayne Passmore Ѱ Board of Governors of the Federal Reserve System, Washington, DC 20551 Abstract JEL CODES: G01, G21, G28 KEY WORDS: GSE, Fannie Mae, Freddie Mac, mortgage-backed securities (MBS), mortgages, interest rates. Ѱ Wayne Passmore, Senior Advisor, is in the Division of Research and Statistics at the Board of Governors of the Federal Reserve System. The views expressed are the author’s and should not be interpreted as representing the views of the FOMC, its principals, the Board of Governors of the Federal Reserve System, or any other person associated with the Federal Reserve System. I thank Diana Hancock for her useful comments. I also thank Alex von Hafften for his excellent research assistance. Wayne Passmore’s contact information is: Mail Stop 66, Federal Reserve Board, Washington, DC 20551; phone: (202) 452-6432; e-mail: [email protected].
Transcript
3/25/2016
Making Homeownership More Accessible Using Fixed-COFI Mortgages
Wayne PassmoreѰ Board of Governors of the Federal Reserve System, Washington, DC 20551
Ѱ Wayne Passmore, Senior Advisor, is in the Division of Research and Statistics at the Board of Governors of the Federal Reserve System. The views expressed are the author’s and should not be interpreted as representing the views of the FOMC, its principals, the Board of Governors of the Federal Reserve System, or any other person associated with the Federal Reserve System. I thank Diana Hancock for her useful comments. I also thank Alex von Hafften for his excellent research assistance. Wayne Passmore’s contact information is: Mail Stop 66, Federal Reserve Board, Washington, DC 20551; phone: (202) 452-6432; e-mail: [email protected].
3/25/2016
1
Introduction
Affordable housing is a substantial problem in the United States. In particular, potential
first-time home buyers face higher home prices and limited starter home inventory in recent years
(Duncan, et.al. 2016). With both rents and home prices at relatively high levels in many
metropolitan areas, many renters may not be able to save for a typical down payment required by
a conventional mortgage.
The 30-year, fixed-rate mortgage is the dominant mortgage in the United States (see Green
and Watcher 2005 for a history of U.S. mortgages.) Campbell (2013) and Shiller (2014) note the
little innovation in U.S. mortgage contracts since the 30-year fixed-rate mortgage was established
during the Great Depression, despite compelling reasons to believe a better mortgage contract
could be designed for households, bankers, and investors alike. In Hancock and Passmore (2016),
we analyzed the feasibility as well as the potential costs and benefits of an adjustable-rate mortgage
product tied to a nationwide bank cost of funds index (COFI), which is equal to the total interest
expenses of domestic commercial banks divided by their total interest-bearing liabilities.1 The
costs and benefits associated with these contracts were considered from household, banker,
investor, and policymaker perspectives using estimates of the rates on these COFI-based
mortgages constructed from historical data over 2000-2014, inclusive.2 We found substantial
benefits for market participants had they used these mortgages.
Here, I propose a new type of mortgage, called a Fixed-COFI Mortgage, which is designed
to help renters, who may be paying rents that are as high as comparable mortgage payments, but
1 Quarterly data on total interest expenses and on interest-bearing liabilities for US commercial banks are reported in Federal Financial Institutions Examination Council Consolidated Reports of Condition and Income (FFIEC, 2016) . Values are merger-adjusted. Monthly values are inferred by calculating an annual rate and linearly interpolating between quarterly data points. Throughout this paper, when I say a depository institution, it is a U.S. commercial bank. 2 This mortgage product also includes actuarial-based government-backed tail-risk insurance provided either to bankers directly or to investors who purchase pools of such mortgages. The premiums for this actuarial-based tail-risk insurance were estimated using an expected loss distribution constructed in Hancock and Passmore (forthcoming). This insurance makes the mortgage more tradable in secondary mortgage markets, similar to 30-year fixed-rate mortgages securitized by Fannie Mae and Freddie Mac. Here, we put aside the topic of secondary market viability (discussed in Hancock and Passmore, 2016) and focus on housing affordability. However, we use a gross margin that includes compensation for these risks.
3/25/2016
2
have little or no savings for a down payment. In essence, this mortgage is a traditional 30-year,
fixed-rate mortgage with little or no down payment. The depository institution forgoes the
traditional down payment and, in return, the household engages in a form of forced savings.3 The
mortgage is designed to assure that a depository institution can usually hold the mortgage
profitability. In addition, the household’s forced savings program often leads to the rapid
accumulation of home equity, which lowers default risk relative to a conventional traditional 30-
year fixed-rate mortgage that has no down payment. Finally, the mortgage is affordable, in that
for many households, the monthly payment would be smaller than the household’s current rent
payments.4
The Fixed-COFI mortgage exploits the often-present wedge between the fixed-rate
mortgage rate and the estimated COFI mortgage rate. These contracts have the following key
characteristics: (1) the bank receives COFI plus a reasonable (and highly profitable) margin; (2)
the household makes monthly payments calculated to amortize the principle over 30 years using
the prevailing 30-year fixed-rate mortgage rate at origination; (3) excess payments are placed into
a home equity savings account, which pays down the principle and weathers high interest rate
periods; and (4) the household puts forward no or little down payment. Households, who pay high
rents and can qualify for a mortgage on a cash-flow basis, are able to purchase a home, and then
often accumulate the savings to quickly build their home equity.
This paper proceeds as follows: Section 2 (not completed) discusses how down payments
can be a barrier to homeownership. Section 3 compares time-series estimates for Fixed-COFI
mortgage rates based on historical U.S. data to the mortgage rates on traditional 30-year fixed-rate
mortgages, and provides an example of how the Fixed-COFI mortgage works. Section 4 calculates
the historically-based probabilities that COFI mortgage rates can exceed the mortgage rates on
traditional 30-year fixed-rate mortgages. Sections 5 simulates the payoff structure of Fixed-COFI
mortgages and discuss when these mortgages are successful. Section 6 concludes with
observations relevant to the policy of promoting this type of affordable homeownership mortgage.
3 The influence of the down payment on mortgage performance is much debated. Economists generally find that lower down payments lead to a greater likelihood of default, but others argue that mortgages with lower down payments that are appropriately underwritten can perform very well and also increase access to housing (See Freeman and Harden, 2015).
3/25/2016
3
.
2. The Down Payment as a Barrier to Homeownership
Zillow.com calculates that the average renter nationwide would have to live in a house “a
scant 1.9 years” before purchasing the home would be more financially advantageous than
renting it (Olsen 2016a). This calculation assumes a 20 percent down payment, but high rents in
American’s most populous cities make it difficult for households to save. Zillow finds that
roughly 50 percent of households with rents of more than 25 percent income save nothing (Olsen
2016b). Nationally, 52.3 percent of renter households have a gross rent that is 30 percent or
more of their household income (Federal Reserve Bank of Richmond 2015).
A recent survey of “millennials” in the United States (people between 18 and 34 years of
age) found that the top reason for not owning a home is that they have not saved enough for a
down payment. In addition, high rents played a significant role in this lack of saving (Consumer
Reports, 2016). Other survey evidence also indicates that the down payment is the major
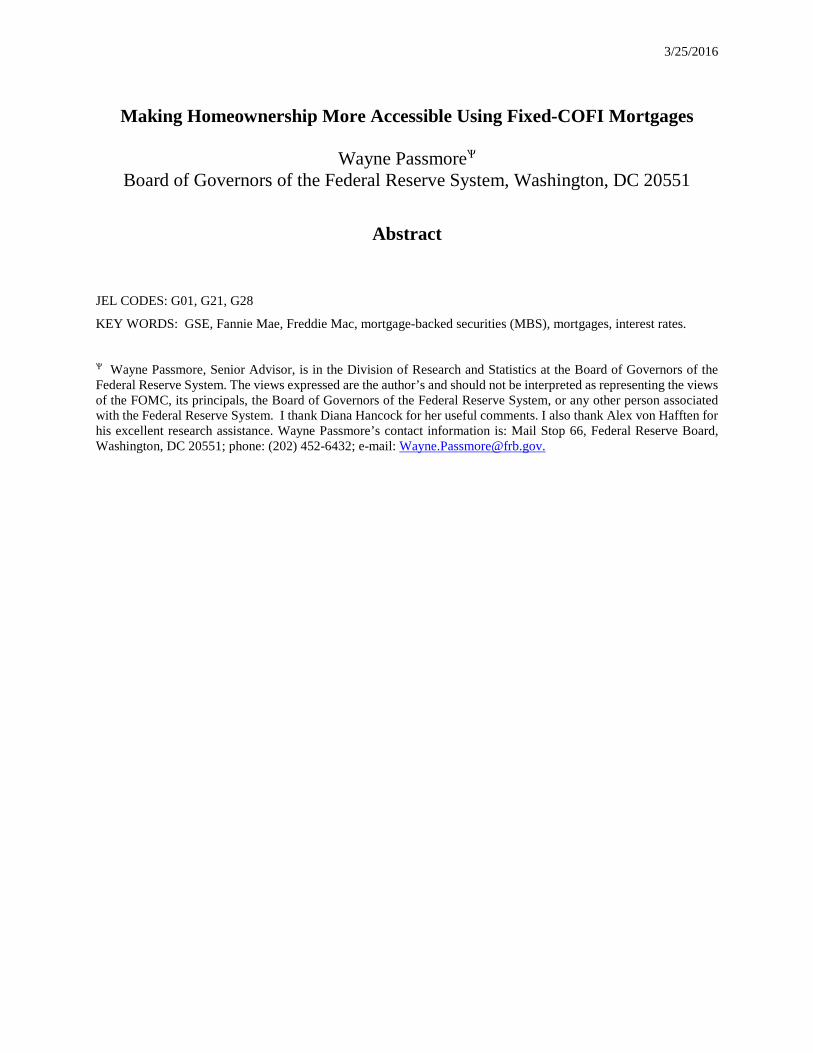
impediment to home ownership for relatively poorer households (Fuster and Zafar, 2014). As
shown in the top panel of Figure 1, the rent-to-home-value ratio in most American cites has
increased sharply over the past 20 years.5 Rents for comparable single-family housing units are
often more than twice the 30-year, fixed-rate mortgage payment (middle panel). High rents
relative to home values make it more difficult for households to save for the down payment
needed to purchase a home. These households are less able to take advantage of the relative
price shift in the relationship between rental properties to purchased homes, where homes are
now relatively more affordable (bottom panel). Moreover, the inability to move into homes may
imply less wealth accumulation by these households, particularly for low- and moderate-income
households (Grinstein-Weiss, Key, Guo, Yeo, and Holub, 2013.)
3. COFI and Homeownership
We provide a comprehensive review of mortgages based on COFIs in Hancock and
Passmore (2016), including developing a method of estimating the gross margin for a nationwide
COFI that yields competitive rate of returns to the bank. We show that a profitable margin that
5 This data is taken from http://www.zillow.com/research/data. See Zillow, 2016.
covers historical servicing costs, credit risks and mark-ups on mortgages assets almost always fall
between 1.75 percent and 2.5 percent over COFI.6 Here, I extend the history of that time-series as
a first step in developing a comparison between a Fixed-COFI mortgage and a traditional 30-year
fixed-rate mortgage.
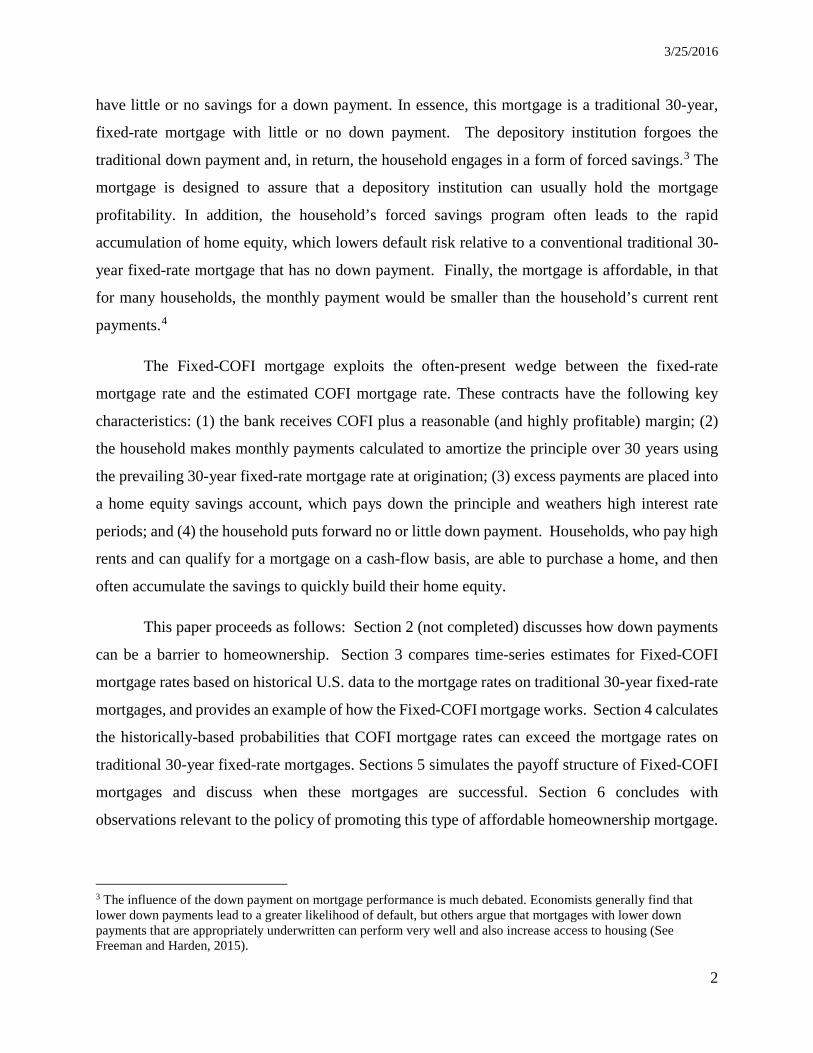
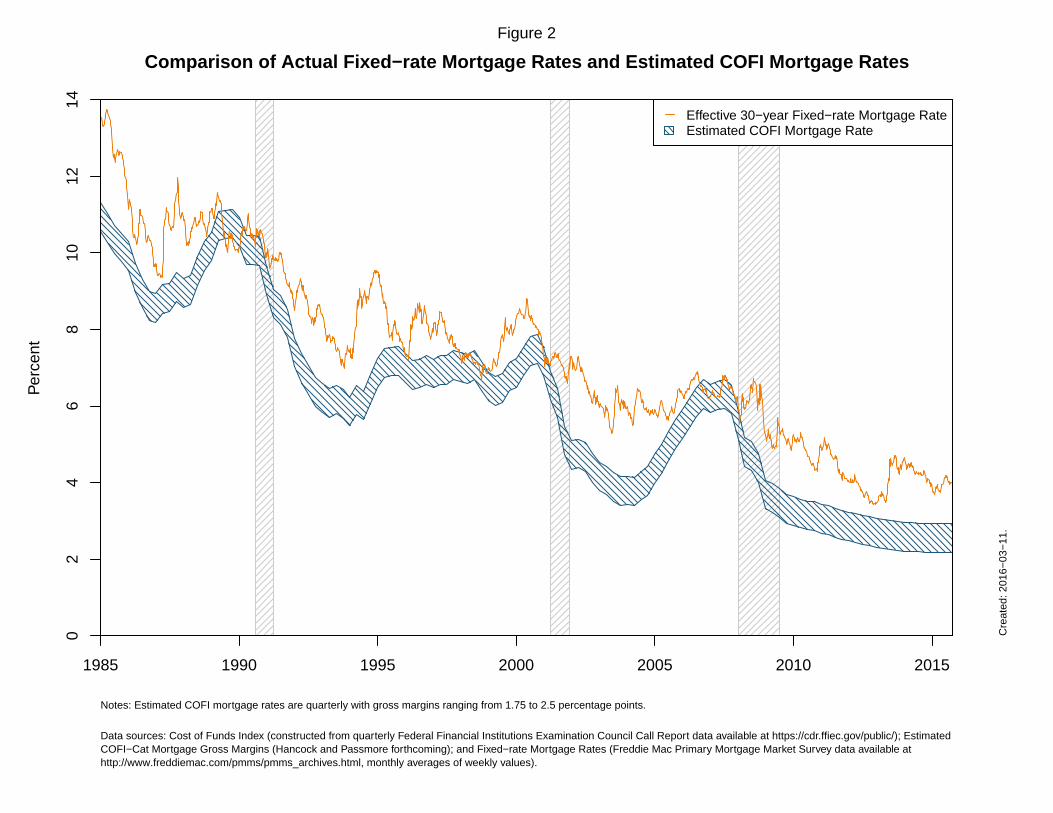
In Figure 2, the time-series for effective rates on 30-year fixed-rate first-lien prime
conventional conforming home purchase mortgages with a loan-to-value of 80 percent from
Freddie Mac surveys is compared to the time-series for estimated rates for COFI.7 COFI is
presented as an actual nationwide COFI plus gross margins ranging from 1.75 percent to 2.5
percent. As noted above, this range is consistent with (almost) all profitable COFI mortgages.
Although the estimated COFI rates are similar to 30-year fixed-rate mortgage rates in
some periods (e.g., during the thrift/banking crisis in the late 1980s and during the run-up to the
recent financial crisis), the range of profitable COFI mortgage rates are generally considerably
below 30-year fixed mortgage rates. These fixed-rate mortgage rates are typically higher than
adjustable mortgage rates because the borrower must compensate the lender for the risk that market
rates might rise in the future and for option to prepay the mortgage when desired. Moreover, fixed-
rate mortgages (which here reflect limited credit risk to the lender because they are GSE-
conforming mortgages and reflect the GSE credit guarantee fee) may also reflect market risk
premiums (e.g., uncertainties and risk-premiums) that are not reflected in the deposit rates that
predominate in the COFI. Indeed, during period of market uncertainty, there may be greater
inflows to insured deposits, which would drive COFI lower. We will discuss other possible
6 The mean profitable gross margin is 2.2 percent with a standard deviation of 16 basis points. See Table 2 in Hancock and Passmore (2016). We use a time-varying technique to calculate net margins in Hancock and Passmore (2016). But the profitability can be readily establish by the following “back-of-the-envelope” calculation. Let the bank’s net interest income for a COFI mortgage be 𝐼𝐼𝐼𝐼𝐼𝐼𝐼𝐼𝐼𝐼𝐼𝐼 = (𝛼𝛼 + 𝐶𝐶𝐶𝐶𝐶𝐶𝐼𝐼) ∗ 𝐴𝐴 − 𝐶𝐶𝐶𝐶𝐶𝐶𝐼𝐼 ∗ 𝐿𝐿 where asset is COFI-based assets, L is interest-bearing liabilities and α is the gross margin. Let 𝐿𝐿 = 𝐴𝐴 − 𝐾𝐾, where K is equity capital. Then the return-on-equity is 𝐼𝐼𝐼𝐼𝐼𝐼𝐼𝐼𝐼𝐼𝐼𝐼
𝐾𝐾= (𝛼𝛼 ∗ 𝐿𝐿𝐿𝐿𝐿𝐿 + 𝐶𝐶𝐶𝐶𝐶𝐶𝐼𝐼) where LEV is the bank’s leverage or 𝐴𝐴 𝐾𝐾� . If
leverage is 20 times on a mortgage (the current risk-based capital weight on mortgages), then the gross margin return-on-equity for a margin of 2 percent and a COFI of 5 percent is 45 percent. For a leverage of 10 times capital, a gross margin of 2 percent and a COFI of 2 percent, this return-on-equity is 22 percent. So long as non-interest bearing liabilities and non-interest expenses are not large, this calculation suggest a relatively high return. 7 To calculate the effective 30-year fixed-rate mortgage rate, we assume that the points and fees reported in the Freddie Mac Primary Mortgage Market Survey are evenly allocated over the average life of a mortgage loan that is equal to six years, which is consistent with the results for low spread, low coupon conforming mortgages in Mattey and Wallace (2001) and the estimates for the empirical prepayment functions for conforming mortgages of Schwartz and Torous (1989).
3/25/2016
5
reasons for the persistence of this wedge between the fixed-rate mortgage rate and COFI mortgage
rates in our discussion at the end of this paper.
To examine the attractiveness of Fixed-COFI mortgages for households with borrowing
constraints, we consider monthly payments associated with a 30-year fixed-rate mortgage
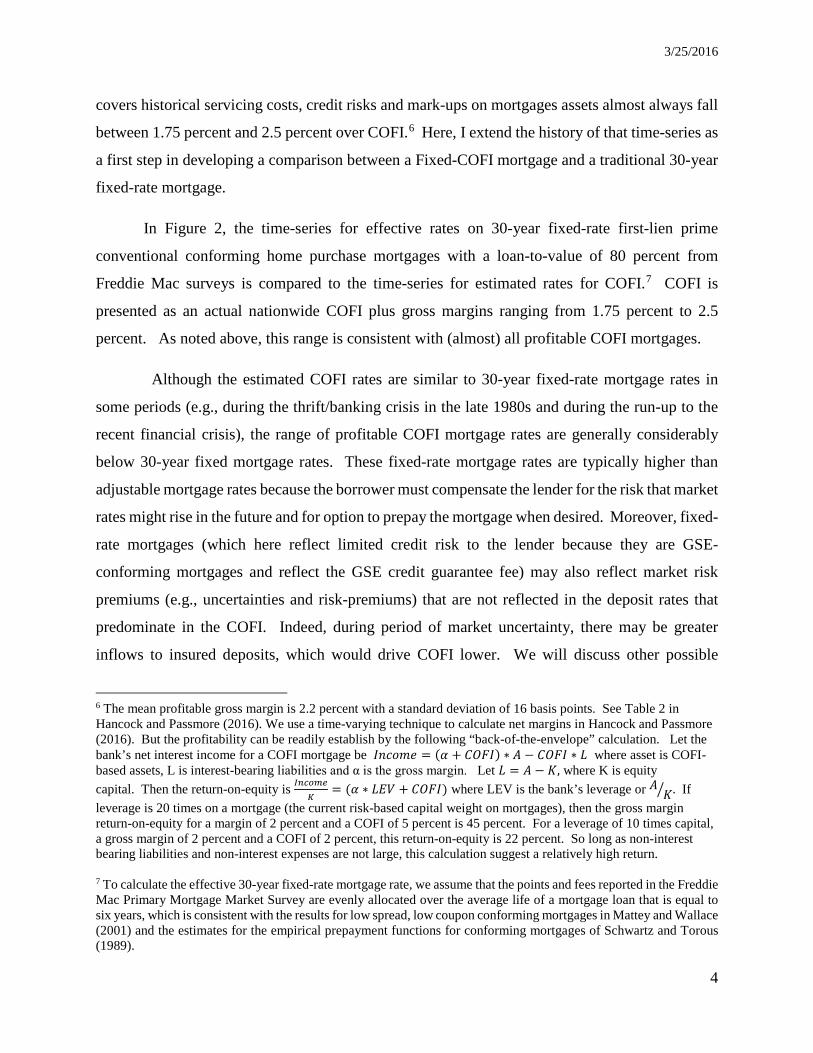
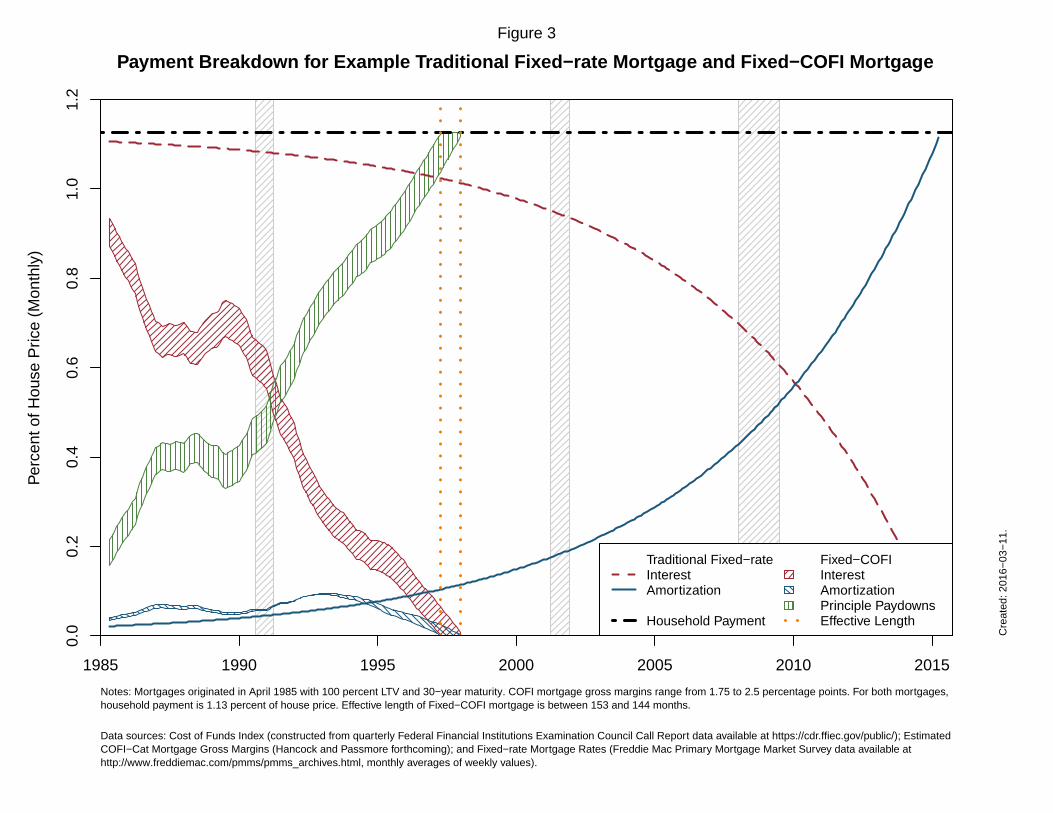
contracts that have an embedded COFI contract. As is done in Figure 3, these monthly payments
are calculated as a percent of the home price.8
Let’s start with an example. Consider a fixed-rate mortgage originated in April 1985. As
show in Figure 3, the monthly fixed-rate mortgage payment (heavy black ball-and chain line) is
equal to 1.13 percent of the house price. This payment has two components: the interest owed on
the mortgage (red dashed line) and the amortization of the mortgage (solid blue line). By design,
the mortgage pays off in thirty years, as the amortizing portion of the mortgage payment become
larger over time.
For the Fixed-COFI mortgage, the household makes the same fixed-rate mortgage payment
each month, but the bank only receives a payment based on the COFI rate plus a gross margin that
embeds a profitable rate of return. Like the fixed-rate mortgage, the COFI payment has two
components: interest and amortization. The interest payment (the red “right-slanted” hatched
band) follows the decline in both the remaining principal and COFI (and interest rates generally)
over this period. The amortization that is associated with these COFI payments is also shown (blue
“left-slanted” hatched band). The band width of COFI payments represent a range of profitable
gross margins from 1.75 percent to 2.5 percentage points.
When the COFI mortgage rate is lower than the fixed-rate mortgage rate, the difference is
put into the home equity savings account and used to pay down the mortgage loan. These pay
downs are shown by the green vertical hatched band in Figure 3. As a result of the pay downs, the
Fixed-COFI mortgage pays off around 1998, roughly 13 years after the mortgage is originated.
The Fixed-COFI mortgage used the “wedge” that is almost always present between the traditional
8 Monthly mortgage payments for each type of mortgage contract considered are calculated as follows:
where 𝑀𝑀 = 𝐴𝐴𝐼𝐼𝐼𝐼𝐴𝐴𝐴𝐴𝐴𝐴 𝑀𝑀𝐼𝐼𝑀𝑀𝑀𝑀𝑀𝑀𝐴𝐴𝑀𝑀𝐼𝐼 𝑅𝑅𝐴𝐴𝑀𝑀𝐼𝐼12
and 𝐼𝐼 is the number remaining months of the mortgage. When expressed as a percent of the home price, the house price drops out.
3/25/2016
6
fixed-rate mortgage and a profitable COFI mortgage to accelerate the pay down of the mortgage
loan.
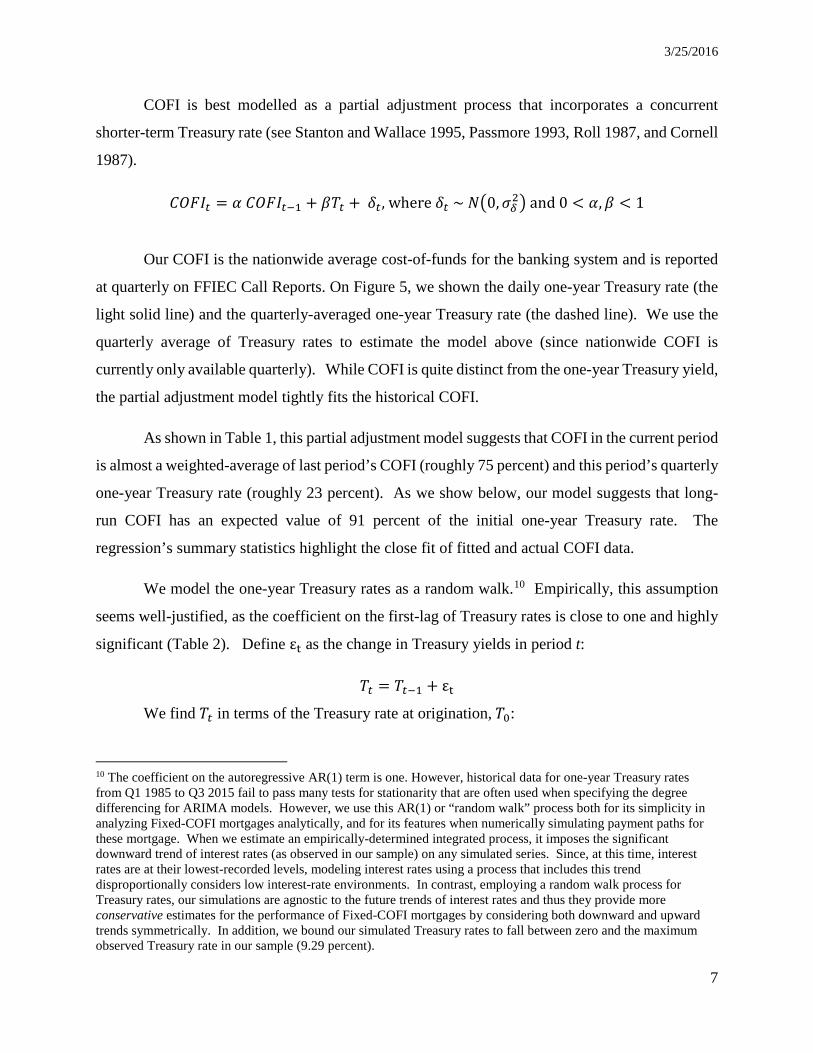
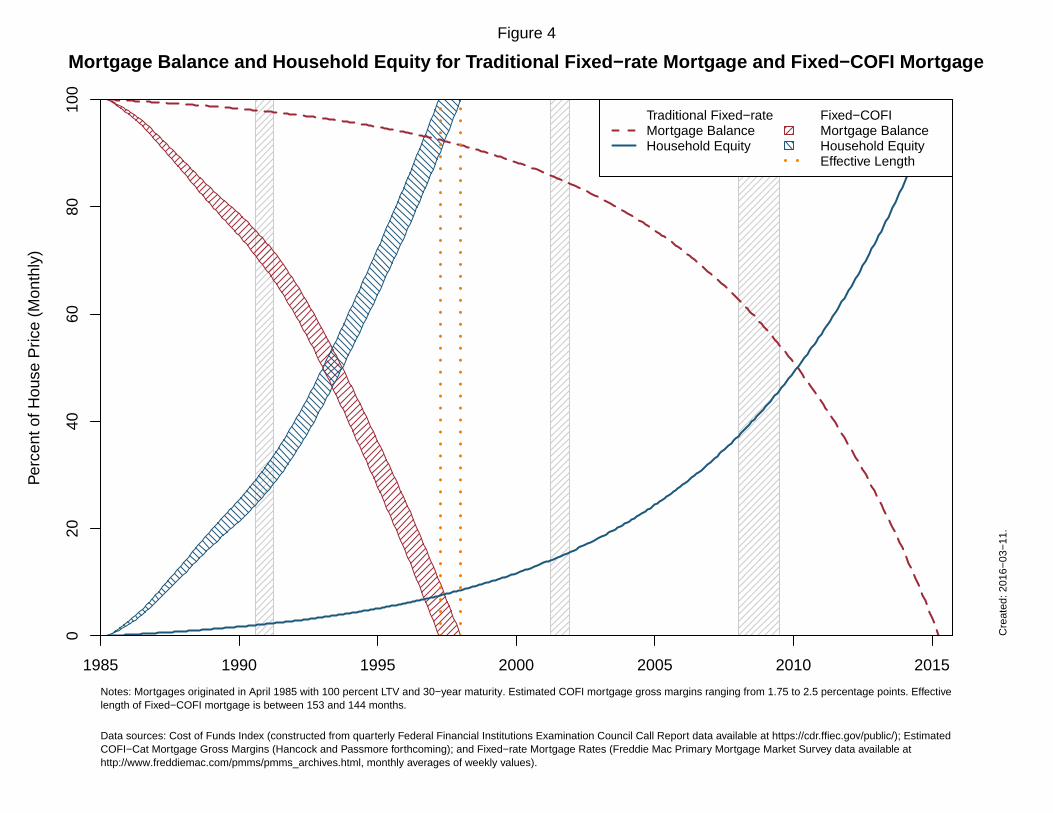
Because of these additional principal pay downs (based on the wedge between the fixed-
rate mortgage rate and the COFI mortgage rate), the Fixed-COFI mortgage is paid off rapidly. As
shown in Figure 4, the equity accumulates quickly for the Fixed-COFI mortgage. After the first
five years, the homeowner’s equity is between 22 percent and 27 percent of the home value. After
ten years, home equity has risen to between 67 percent and 76 percent. In contrast, a traditional
fixed-rate mortgage holder owns 1.8 percent of her home after five years and 5.3 percent after ten
years. In this example, the Fixed-COFI mortgage holder owns her house after 12 to 14 years,
depending on the gross margin charged by the bank.
The increasing home equity associated with Fixed-COFI mortgages implies that default
risks to the bank fall substantially early in the life of the mortgage9. After five years, the bank
holds the equivalent of a 25-year fixed-rate mortgage with a more-than-20-percent down payment
(if home prices hold constant), and thus there is a significantly lower risk of homeowner default
than the no-down payment traditional fixed-rate mortgage. In addition, the household has
significantly increased its wealth and has the resources to weather future financial stress. We now
turn to quantifying the risks to the household and the bank, particularly in those first five years.
4. Fixed-Rate Mortgage Rates versus Fixed-COFI Mortgage Rates
Our example highlights the potential homeowner equity gains from a Fixed-COFI
mortgage. To begin to assess how representative this example is, we derive a distribution for long-
run COFI based on estimating models of COFI and Treasury rates, and consider the likelihood of
a shock to interest rates that pushes the expected path of the COFI mortgage rates higher than the
fixed-rate mortgage rate.
9 Negative equity is a necessary, but not a sufficient, cause of mortgage default. See Campbell and Cocco (2015), Gerardi, Herkenhoff, Ohanian, and Willen (2015), and Mayer, Pence and Sherlund (2009) for discussions of the importance of negative home equity in determining mortgage default.
3/25/2016
7
COFI is best modelled as a partial adjustment process that incorporates a concurrent
shorter-term Treasury rate (see Stanton and Wallace 1995, Passmore 1993, Roll 1987, and Cornell
1987).
𝐶𝐶𝐶𝐶𝐶𝐶𝐼𝐼𝑀𝑀 = 𝛼𝛼 𝐶𝐶𝐶𝐶𝐶𝐶𝐼𝐼𝑀𝑀−1 + 𝛽𝛽𝐿𝐿𝑀𝑀 + 𝛿𝛿𝑀𝑀, where 𝛿𝛿𝑀𝑀 ~ 𝑁𝑁�0,𝜎𝜎𝛿𝛿2� and 0 < 𝛼𝛼,𝛽𝛽 < 1
Our COFI is the nationwide average cost-of-funds for the banking system and is reported
at quarterly on FFIEC Call Reports. On Figure 5, we shown the daily one-year Treasury rate (the
light solid line) and the quarterly-averaged one-year Treasury rate (the dashed line). We use the
quarterly average of Treasury rates to estimate the model above (since nationwide COFI is
currently only available quarterly). While COFI is quite distinct from the one-year Treasury yield,
the partial adjustment model tightly fits the historical COFI.
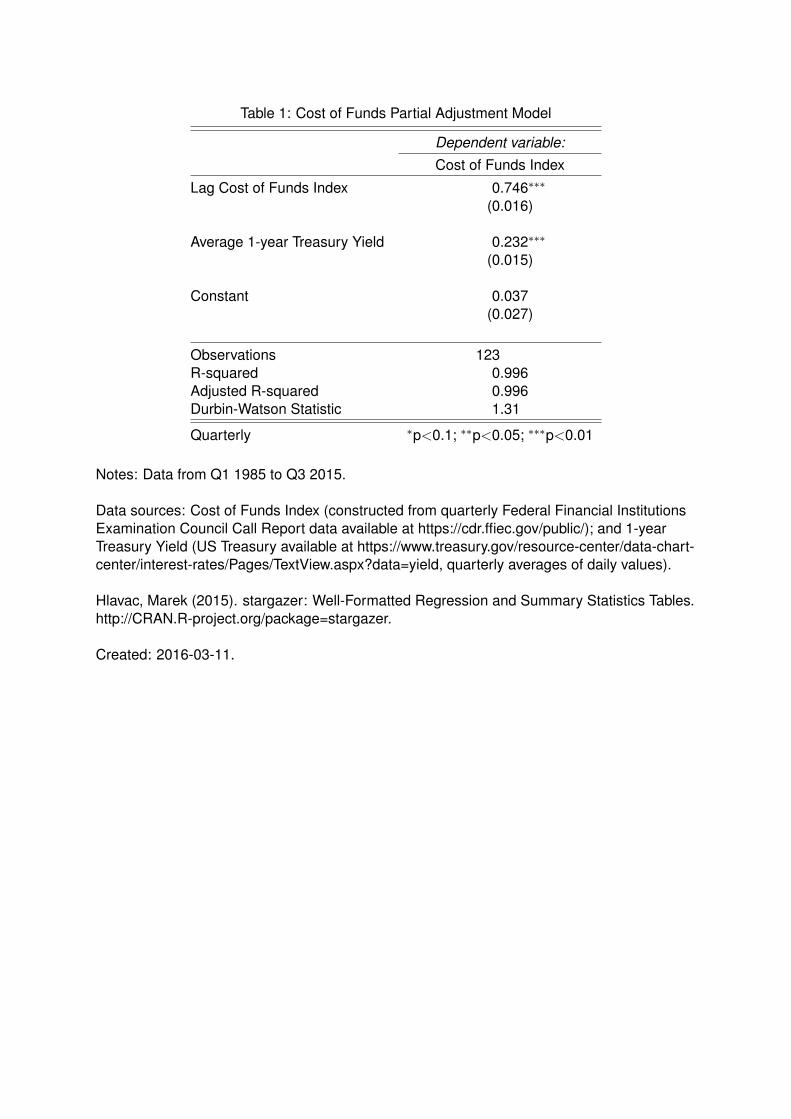
As shown in Table 1, this partial adjustment model suggests that COFI in the current period
is almost a weighted-average of last period’s COFI (roughly 75 percent) and this period’s quarterly
one-year Treasury rate (roughly 23 percent). As we show below, our model suggests that long-
run COFI has an expected value of 91 percent of the initial one-year Treasury rate. The
regression’s summary statistics highlight the close fit of fitted and actual COFI data.
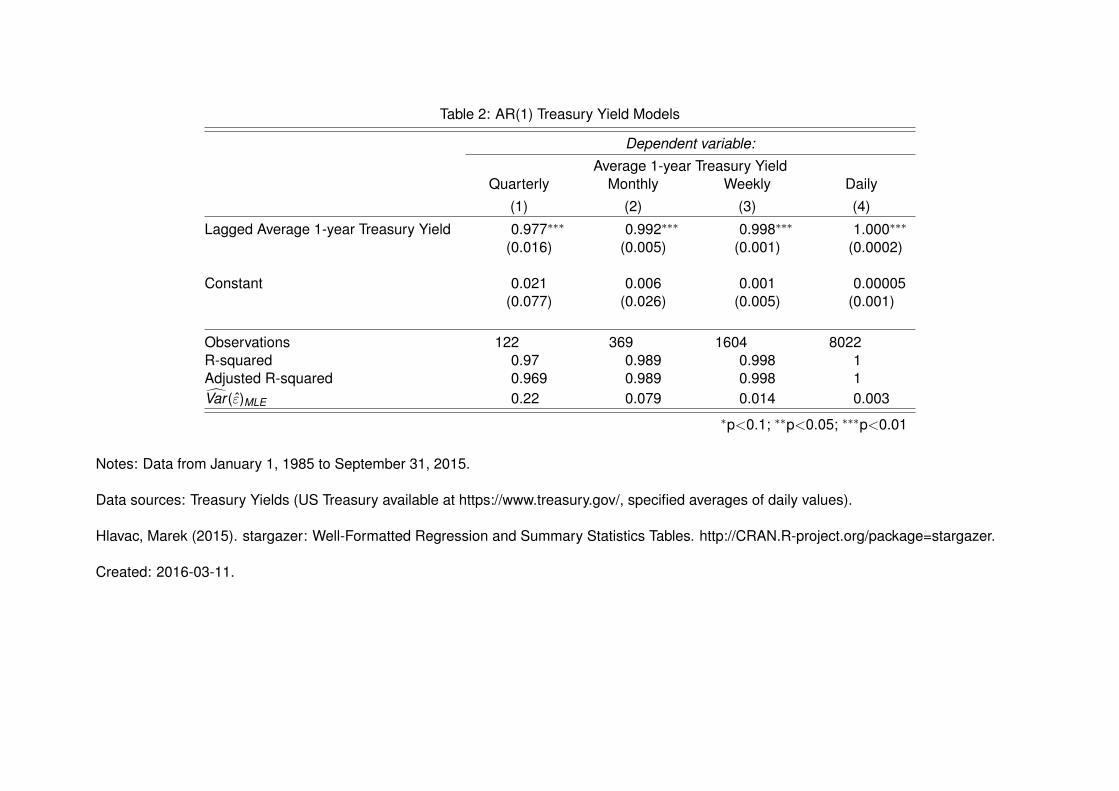
We model the one-year Treasury rates as a random walk.10 Empirically, this assumption
seems well-justified, as the coefficient on the first-lag of Treasury rates is close to one and highly
significant (Table 2). Define εt as the change in Treasury yields in period t:
𝐿𝐿𝑀𝑀 = 𝐿𝐿𝑀𝑀−1 + εt
We find 𝐿𝐿𝑀𝑀 in terms of the Treasury rate at origination, 𝐿𝐿0:
10 The coefficient on the autoregressive AR(1) term is one. However, historical data for one-year Treasury rates from Q1 1985 to Q3 2015 fail to pass many tests for stationarity that are often used when specifying the degree differencing for ARIMA models. However, we use this AR(1) or “random walk” process both for its simplicity in analyzing Fixed-COFI mortgages analytically, and for its features when numerically simulating payment paths for these mortgage. When we estimate an empirically-determined integrated process, it imposes the significant downward trend of interest rates (as observed in our sample) on any simulated series. Since, at this time, interest rates are at their lowest-recorded levels, modeling interest rates using a process that includes this trend disproportionally considers low interest-rate environments. In contrast, employing a random walk process for Treasury rates, our simulations are agnostic to the future trends of interest rates and thus they provide more conservative estimates for the performance of Fixed-COFI mortgages by considering both downward and upward trends symmetrically. In addition, we bound our simulated Treasury rates to fall between zero and the maximum observed Treasury rate in our sample (9.29 percent).
3/25/2016
8
𝐿𝐿𝑀𝑀 = 𝐿𝐿0 + �ε𝑖𝑖
𝑀𝑀
𝑖𝑖=1
and assume εt~ 𝑁𝑁(0,𝜎𝜎𝜀𝜀2),11 or:
𝐿𝐿[𝐿𝐿𝑀𝑀] = 𝐿𝐿0
We can then derive 𝐶𝐶𝐶𝐶𝐶𝐶𝐼𝐼𝑀𝑀 in terms of COFI and the Treasury rate at origination, 𝐶𝐶𝐶𝐶𝐶𝐶𝐼𝐼0
Now, we have characterized the distribution of COFI, we can find a long-run COFI value
based on the conditions at origination by taking the limit as t goes to infinity of the expected
value of 𝐶𝐶𝐶𝐶𝐶𝐶𝐼𝐼𝑀𝑀:
lim𝑀𝑀→∞
𝐿𝐿[𝐶𝐶𝐶𝐶𝐶𝐶𝐼𝐼𝑀𝑀] = lim𝑀𝑀→∞
𝛼𝛼𝑀𝑀𝐶𝐶𝐶𝐶𝐶𝐶𝐼𝐼0 + 𝛽𝛽𝐿𝐿0�𝛼𝛼𝑀𝑀−𝑖𝑖𝑀𝑀
𝑖𝑖=1
= 0 ∗ 𝐶𝐶𝐶𝐶𝐶𝐶𝐼𝐼0 + 𝛽𝛽 𝐿𝐿01
1 − 𝛼𝛼
=𝛽𝛽
1 − 𝛼𝛼 𝐿𝐿0
and define this long-run expected COFI as 𝐶𝐶𝐶𝐶𝐶𝐶𝐼𝐼�������= lim𝑀𝑀→∞
𝐿𝐿[𝐶𝐶𝐶𝐶𝐶𝐶𝐼𝐼𝑀𝑀].
What values of a shock, 𝜀𝜀∗, to Treasury rates push the long-run COFI mortgage rate
pushed larger than the fixed-rate at origination, 𝐶𝐶𝐶𝐶𝐶𝐶𝐼𝐼������� + 𝐺𝐺𝑀𝑀 > 𝐶𝐶𝑅𝑅0?
𝐶𝐶𝐶𝐶𝐶𝐶𝐼𝐼������� + 𝐺𝐺𝑀𝑀 > 𝐶𝐶𝑅𝑅0 𝛽𝛽
1 − 𝛼𝛼 (𝐿𝐿0 + 𝜀𝜀∗) + 𝐺𝐺𝑀𝑀 > 𝐶𝐶𝑅𝑅0
𝜀𝜀∗ >1 − 𝛼𝛼𝛽𝛽
(𝐶𝐶𝑅𝑅0 − 𝐺𝐺𝑀𝑀) − 𝐿𝐿0
The probability that the fixed-rate mortgage rate is lower than the expected long-run COFI
mortgage rate is:
3/25/2016
10
Pr �𝜀𝜀∗ >1 − 𝛼𝛼𝛽𝛽
(𝐶𝐶𝑅𝑅0 − 𝐺𝐺𝑀𝑀) − 𝐿𝐿0� , where 𝜀𝜀∗~𝑁𝑁(0,𝜎𝜎𝜀𝜀2).
Tables 3 and 4 calculates this probability for five historical Treasury rates and associated
fixed-rate mortgage rates. In Table 3, we take the distribution of all quarterly Treasury rates from
1985 to 2014, and calculate the Treasury rates at the 10th, 25th, 50th, 75th and 90th percentiles,
respectively. We also calculate the associated fixed-rate mortgage rates at origination by
averaging the mortgage rates across a ±10 percentile spread around the chosen Treasury rate. For
example, the Treasury rate at the 10th percentile of the distribution is .18 percentage points and
the associated mortgage rate at origination (4.2 percent) is the average of mortgage rates associated
with Treasury rates from the 0th percentile (0.09) to the 20 percentile (0.479) of the Treasury
distribution. The long-run expected COFI is .17 percentage points. The rows of Table 3 repeat
this calculations for the other percentiles of the Treasury rate distribution.
The spreads of fixed-rate mortgage rates to Treasury rates, of fixed-rate mortgage rates to
initial COFI-index rates, and of fixed-rate mortgage rates to long-run COFI are particularly large
when one-year Treasury rates are very small. This may seem odd because prepayment risks are
particularly low for fixed-rate mortgages in low interest rate environments. However, the effect
of offering a mortgage with a very long effective maturity dominates the prepayment compensation
when interest rates are low. Note that these spreads are also high when Treasury rates are high,
here reflecting high prepayment risks. Spreads are smallest for Treasury rates in the middle of the
Treasury-rate distribution.
As shown in Table 4, we calculated the probability that a Treasury shock results in the
COFI mortgage rates (that is, the COFI rate plus a gross margin) exceeding the fixed-rate mortgage
rate. We perform this calculation for four gross margins over COFI—1.75 percent, 2.0 percent,
2.25 percent, and 2.5 percent. As shown in the first row of the table, the long-run expected COFI
rate collected by the depository institution never exceeds the fixed-rate mortgage rate made by the
household for a margin of 1.75 percent. In addition, the fixed-rate payment is always adequate to
cover the depository institution’s costs and profits when the Treasury rate is from the bottom 25
percent of the Treasury rate distribution. In contrast, at the median initial Treasury rate, the fixed-
3/25/2016
11
rate mortgage rate falls short of the COFI rate about 1.3 percent of the time with a 2 percentage
point gross margin and 14.1 percent of the time with a 2.5 percent gross margin. These percentages
fall for higher initial Treasury rates. This pattern reflects the spread between the fixed-rate
mortgage rate and the long-run COFI rate, which is most narrow for the Treasury rate at the 50th
percentile of the distribution.
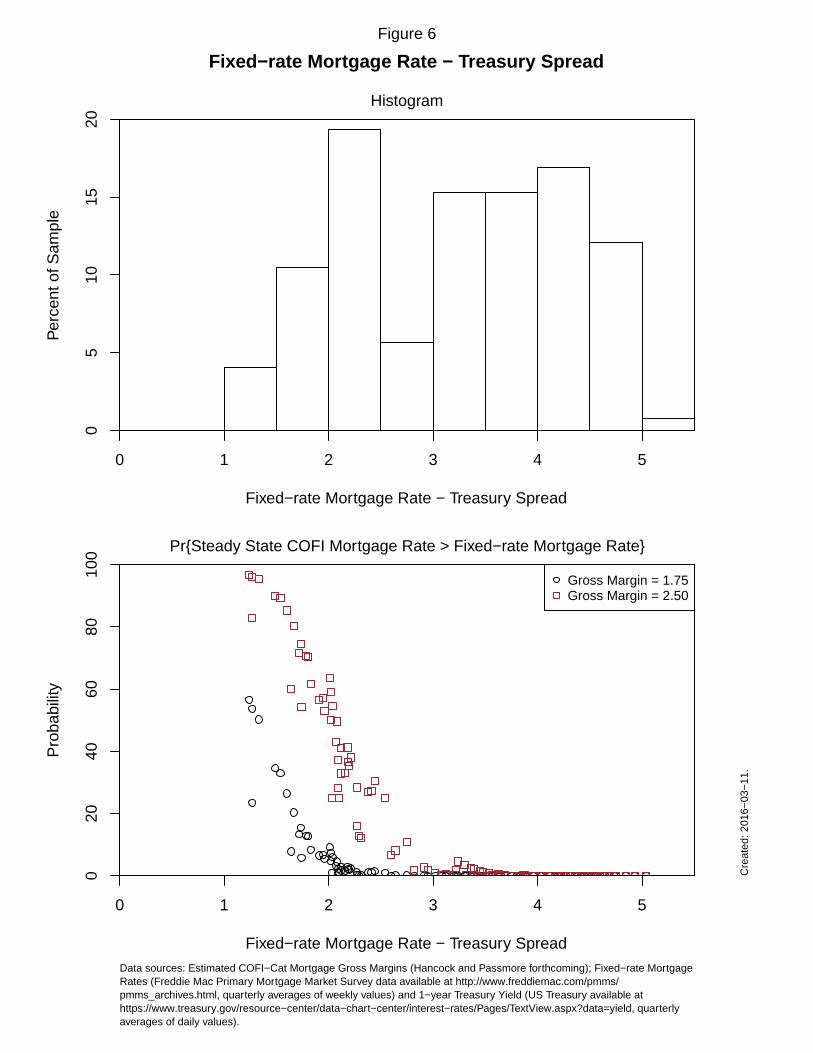
The relation between the fixed-rate-mortgage-rate-to-Treasury spread (or “fixed-rate-to-
Treasury spread”) and the probability of expected long-run COFI exceeding the fixed-rate
mortgage rate is spelled out in Figure 6. There is no instance empirically of the long-run COFI
rate being above the fixed-rate when the spread is greater than three percentage points. But when
the spread is below two, the odds rise rapidly for COFI mortgage rates that have high gross
margins.
The odds that a household making a fixed-rate mortgage cannot cover the payment on a
COFI mortgage are very low. The time path of payments, however, is important because we want
to examine zero or low down payment mortgages. The concept is that renters in high-cost cities
may not be able to save for a down payment, but have adequate incomes to make monthly mortgage
payments.
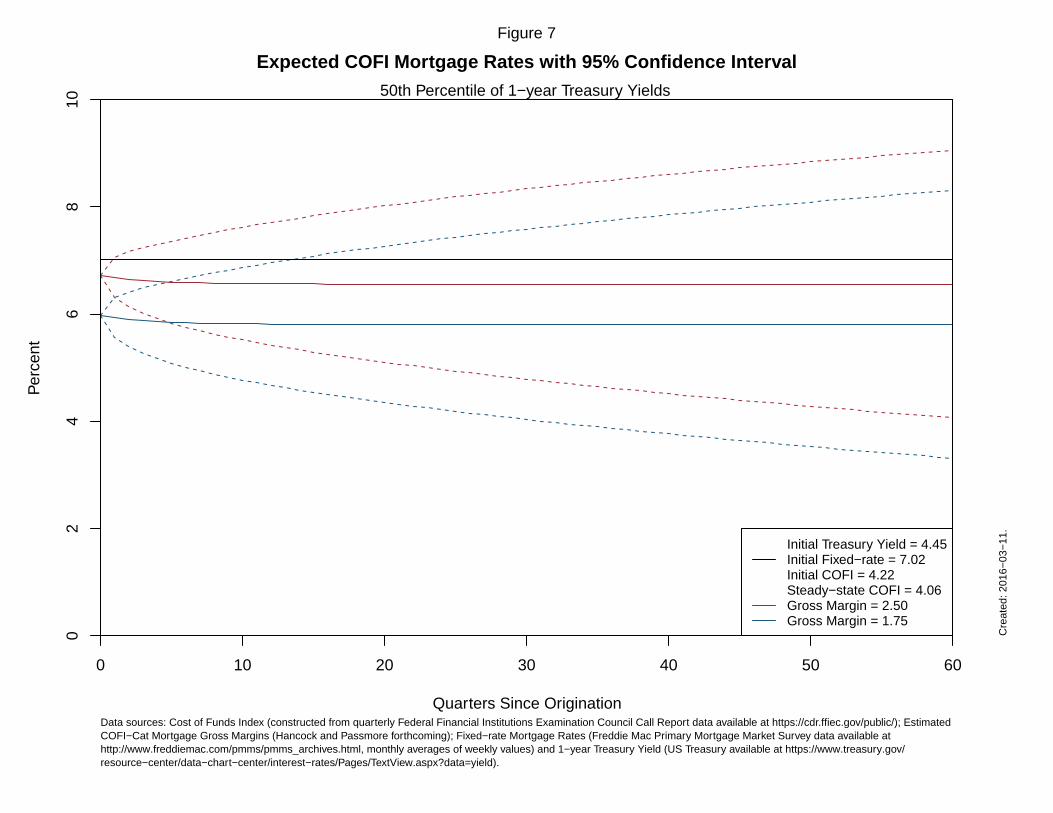
Using the mean and variance for the normally distributed 𝐶𝐶𝐶𝐶𝐶𝐶𝐼𝐼𝑀𝑀 found above, we can
calculate the odds that a sequence of Treasury rate realizations will result in a COFI rate (include
the gross margin) in excess of the fixed-rate mortgage rate. A typical path for COFI mortgage
rates is shown in Figure 7. The expected long-run values of COFI rates are below the initial
fixed-rate mortgage. But, depending on the gross margin, there is soon a positive probability of
a realization of Treasury rates that could drive the COFI mortgage rate above the fixed-rate
mortgage rate. Note that for the lowest gross margin we consider (1.75 percent), this possibility
only becomes significant (greater than 2.5 percent) roughly 4 years after the Fixed-COFI
mortgage is originated, allowing the household to accumulate substantial home equity. At a
gross margin of 2.5 percent, this crossing point is reached after only a couple of quarters.
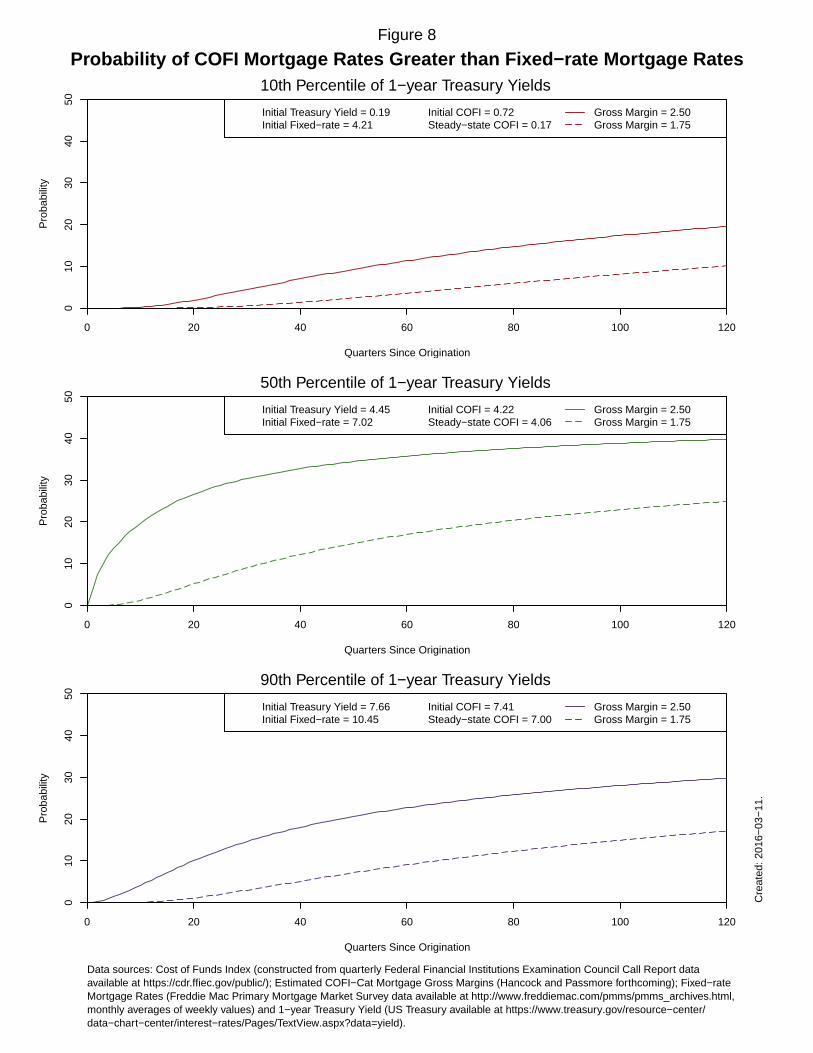
As shown in the top panel of Figure 8, when Treasury rates relatively low, the odds of
COFI plus gross margin rising above the fixed-rate are particularly low (especially for the lower
gross margins). The household is likely to have paid off most of the home before this a
significant concern. But as shown in the middle and bottom panels, for high gross margins, the
3/25/2016
12
odds of the payment on a Fixed-COFI mortgage being inadequate in a given month are high
much early in the life of the mortgage. Thus, we now turn to simulating interest rate paths to
estimate which Fixed-COFI mortgages successfully avoid default.
5. Simulating the Pay-offs of Fixed-COFI Mortgages.
Monthly mortgage payment cost savings for COFI-Cat mortgages relative to 30-year
fixed-rate mortgages can be large, and the probability that COFI rates will exceed an initial
fixed-rate mortgage rate are very small. As suggested at the beginning of our paper, these facts
suggest there is low-risk opportunity to create a mortgage that allows homeowners to move into
a home with little or no savings and allows them to accumulate equity in that home quickly.
We simulate the payment stream for Fixed-COFI mortgages for the historical relationships
between the one-year Treasury rates, the fixed-rate mortgage rates, and COFIs. We undertake these
simulations using all historical combinations of Treasury rates, fixed-rate mortgage rates, and
COFI from Q1 1985 to Q3 2015.
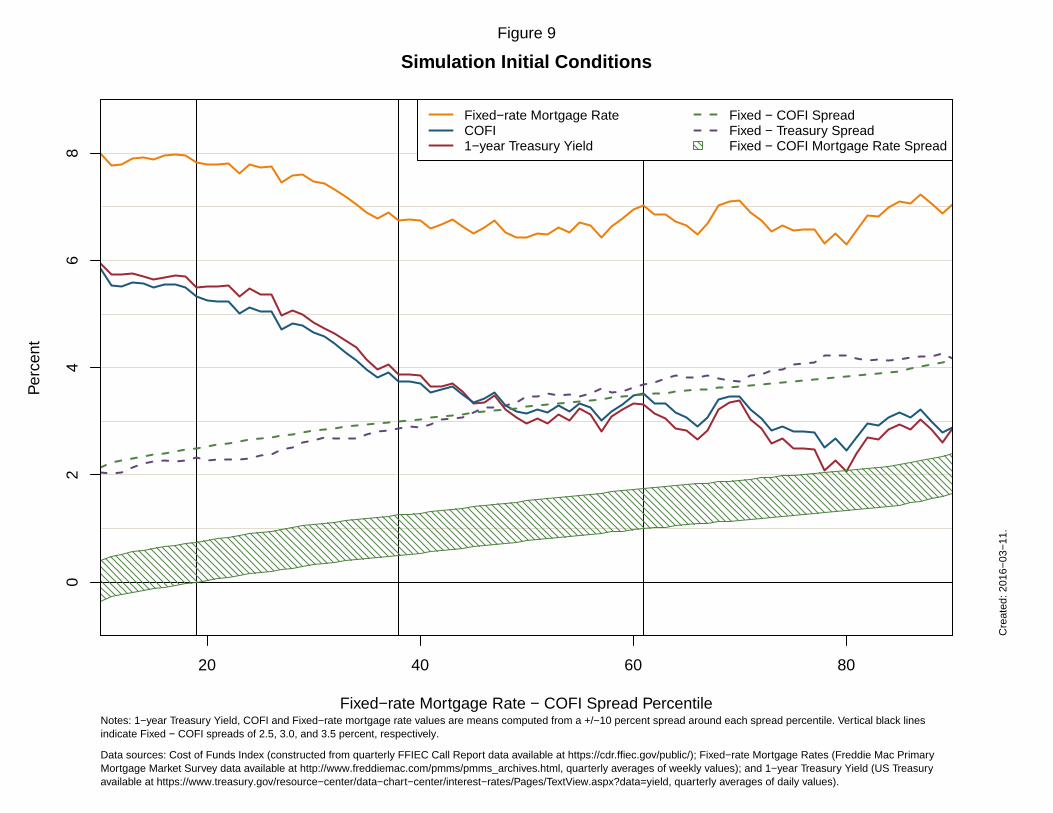
As shown in Figure 9, we order these rates from smallest to largest fixed-rate mortgage
rate and COFI spreads (or “fixed-rate-to-COFI spread”), and show their historical occurrence from
the 10th to 90th percentile. For each spread percentile, we calculate we take a range of one-year
Treasury rates, fixed-rate mortgage rates, and COFI rates that occurred within a range from
negative 10 percentile smaller than the chosen Treasury rate to positive 10 percentile greater than
the chosen Treasury rates. We average these Treasury, mortgage, and COFI values to get the
Treasury rate, fixed-rate mortgage rate and COFI that is associated with the particular spread
percentile.
The green dashed line in Figure 9 is the fixed-rate-to-COFI spread. It ranges from a low of
two percent to a high of four percent. The associated fixed-rate-to-Treasury spread (the purple
dashed line) moves closely with the fixed-rate-to-COFI spread. One-year Treasury rates start off
slightly higher than COFIs and then fall slightly below COFIs based on this ordering. The fixed-
rate mortgage rate starts off close to eight percent and then hovers a little below seven percent.
The hatched “left-slanted” green band is the range of the fixed-rate-to-COFI spreads, where the
gross margin varies from 1.75 percent to 2.5 percent.
3/25/2016
13
We use each of these 81 spread percentiles (the average spread within each one percentile,
inclusive between 10 and 90) as the basis for one set of historical simulations. For each set of
initial conditions, we begin our simulation by drawing a simulated time-series of monthly Treasury
rates using the model discussed above. We follow by building the COFI series generated by this
sequence of Treasury rates, and then add the gross margin. With the COFI mortgage series in
hand, we calculate the Fixed-COFI payment stream, where the household makes a fixed-rate
mortgage payment based on the initial fixed-rate mortgage (set to amortize over 30 years) and the
depository institution receive a payment based on the COFI plus gross margin.
For the Fixed-COFI mortgage, any positive remainder plus the normal amortization of the
mortgage is added to a home equity savings account that is used to pay down the principle of the
mortgage. If the remainder is negative, the homes equity saving account is used to cover the
difference and make the payment to the depository institution. If the household’s home equity
savings account becomes negative, the household defaults on the mortgage. The Fixed-COFI
mortgage has no ultimate payback period (recall, the mortgage by design is almost always
profitable for a bank to hold). We terminate the simulations after 70 years.12
We do 10,000 simulations for each set of initial conditions. With 81 initial sets of
conditions, there are 810,000 total mortgage payment simulations for each combination of COFI
gross margin and down payment. After 70 years, almost all mortgages have either successfully
paid off or have defaulted. For example, if the gross margin is 1.75 percent and the down payment
is 0 percent, then at the end of 70 years, only 331 or 0.04 percent of the mortgage simulations have
not had an outcome of either success or failure.
Using fixed-rate-to-COFI spreads are a good way to order our simulations because the
success of the Fixed-COFI mortgage is hinged to this spread, and the resulting amount of savings,
that the homeowner’s fixed-rate mortgage payment generates for home equity accumulation. As
shown in Figure 10, the larger the spread, the higher the interest savings over the life of the
mortgage. Savings are particularly large for low gross margins and a low down payment.
12 Note that if an end point is imposed on the mortgage, such that the loan must be paid off by a given time period, then additional defaults are created because large “balloon payments” are needed for the final payments under some scenarios. For example, a household that has accumulated 80 percent equity in the home is force to default because the final payment exceed the home equity plus the last monthly payment.
3/25/2016
14
Note that throughout our simulations, we are considering two different levels of the fixed-
rate mortgage payment. The first is using the prevailing fixed-rate mortgage rate for a conforming
mortgage where 100 percent of the house is financed. (This is our zero down payment mortgage.)
This is not strictly comparable because the Freddie Mac mortgage rate is based on rates that reflect
a 20 percent down payment. But it is the fixed-rate mortgage rate that is widely used for many
purposes, and the one I have in mind for the Fixed-COFI mortgage.
The second mortgage payment uses the same fixed-rate mortgage rate, but assumes the
household is only financing 80 percent of the house value. This is the type of fixed-rate mortgage
(with a 20 percent down payment) that is reflected by the rates surveyed by Freddie Mac. The two
types of fixed-rate mortgage payments represent two different types of thought experiments. The
first simulates the performance of the Fixed-COFI mortgage as being proposed in the paper. The
second provides an upper bound13 on the results when the household is given the opportunity to
make a down payment lowering its monthly fixed-rate mortgage payment; that is, lower its level
of forced savings over time. To what extend does the down payment substitute for this type of
forced savings? For example, if the household was given an option to put down a 10 percent down
payment, how does the performance of this Fixed-COFI mortgage compare to a zero down
payment Fixed-COFI mortgage. The results for 10 percent down would be spanned by the zero
down payment and 20 percent down payment mortgage results.
How long does it take for a homeowner with a Fixed-COFI mortgage and a low or no down
payment to accumulated 20 percent equity in the home? As shown in Figure 11, with a 10 percent
down payment and with a 1.75 percent gross margin (the green solid line), and with a 3.5 percent
fixed-rate-to-COFI spread (shown by the right vertical black line), a homeowner typically acquires
20 percent equity at around 46 months. A higher 2.5 percent gross margin (the green dashed line)
results in hitting 20 percent at around 58 months. Holding these conditions constant and lowering
the fixed-rate-to-COFI spread to 3.0 percent (the middle black vertical line) raises the average
number of months to 77 months. Lowering the down payment to zero percent and holding the
gross margin at 2.5 percent (the red dashed line), and keeping the spread at 2.0 percent, increases
the average number of months to 112 months. Depending on the conditions, Fixed-COFI
13 Naturally, if a household can make a down payment in excess of 20 percent, it would opt for a traditional mortgage product.
3/25/2016
15
homeowners can hold at least 20 percent equity in their homes in four to ten years. A traditional
amortizing fixed-rate mortgage with zero down payment takes about 20 years to reach this
proportion of home equity.
How many Fixed-COFI mortgages result in homeowners owning their home? In Figure 12,
we plot the success rate (that is, mortgages where the homeowner paid off the mortgage) for the
range of gross margins and for two possible down payments. The results for the zero down
payment mortgage are shown by the red “right-slanted” hatch marks. As above, for each set of
initial conditions, the solid line is the 1.75 percent gross margin and the dashed line is the 2.5
percent gross margin. A higher gross margin results in a lower success rate. Similar blue “left-
slanted” hatched lines are used to represent the success rates for the 20 percent down payment
mortgage across the various choice of the gross margin. The solid blue line is the 1.75 gross margin
and the dashed blue line is the 2.5 percent gross margin. The overlap for the two types of down
payments is shown with the cross-hatched lines. The vertical black lines represents a fixed-rate-
to-COFI spread of 2.5, 3.0, and 3.5 percent left-to-right.
As shown in the top panel of Figure 12, for the range of gross margins from 1.75 percent
to 2.5 percent, from 60 percent to 100 percent of homeowners with zero down payment mortgages
pay off their mortgage and own their home, depending on the initial financial conditions. As noted
above, regardless of the initial conditions, the lower the gross margin, the higher the success rate.
And, as we described before, more mortgages are successful when the fixed-rate-to-COFI spread
is wide.
Indeed, when the when the fixed-rate-to-COFI spread is above 3.5 percent (right vertical
black line), almost all Fixed-COFI mortgages result in homeownership regardless of other
conditions. But when this spread falls below 3.0 percent (middle vertical black line), the down
payment and gross margin can make a large difference. At a 3.0 percent spread and for zero down
payment mortgages, 80 percent of the borrowers become homeowners at a 2.5 percent gross
margin, whereas 92 percent become homeowners at a 1.75 percent gross margin. At a 2.5 percent
spread (left vertical black line), these numbers drop to 70 and 90 percent, respectively. Note that
if the gross margin is kept relatively small and a modest down payment is made, then the percent
of successful borrowers is above 80 percent regardless of the fixed-rate-to-COFI spread.
3/25/2016
16
The bottom panel in Figure 12 is the mirror image of the top panel. Here, we show the
proportions of defaulted mortgages. With a high gross margin and a zero down payment, the
average proportion of mortgages that default reaches as high as 30 percent when the fixed-rate-to-
COFI spread is 2.5 percent (right vertical black line). But the default rate drops off sharply for
smaller margins and modest down payments. At a 2.5 percent fixed-rate-to-COFI spread, a zero
down payment mortgage with a 1.75 percent gross margin has an average default rate of 11 percent.
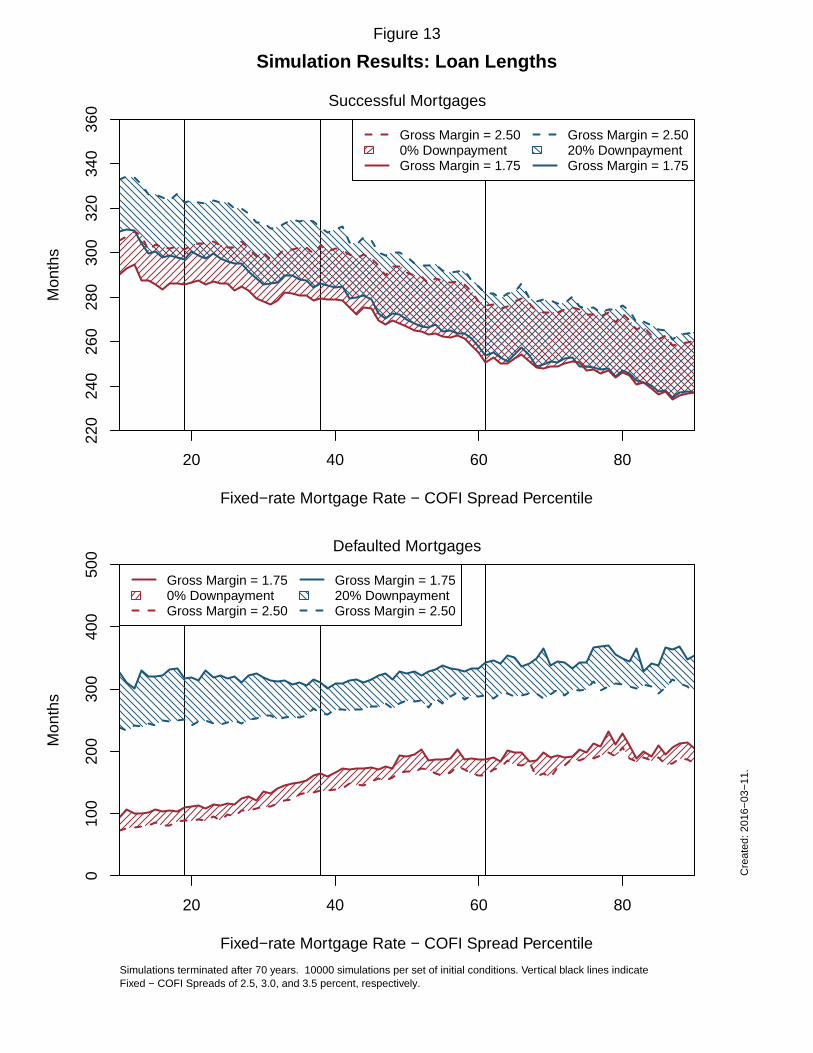
In Figure 13, we examine the length of time it takes for a homeowner to either pay off the
mortgage or default. For successful mortgages (shown in the top panel), on average, mortgages
are paid off in under 300 months if the fixed-rate-to-COFI spread is above 3.5 percent. For
mortgages with smaller gross margins and with more favorable initial conditions, most mortgages
pay off much quicker. The down payment makes little difference in the average length of the loan
pay off. In contrast, a lower gross margin makes the earlier pay off much more likely, although
all Fixed-COFI loans pay off more quickly than at traditional 30-year fixed-rate mortgage.
The down payment does make a significant difference in time to default (as shown in the
bottom panel of Figure 13). Low down payment mortgages default as soon as 10 years or can last
up to 20 years. Mortgages with 20 percent down do not default before 20 years, and many last as
long as 30 years. But even zero down payment mortgages are, on average, lasting more than 10
years. Remember, we assume that the household has no other savings than the accumulated equity
in the home. But over a 30 year horizon, we might hope that the homeowner accumulates other
savings as well!
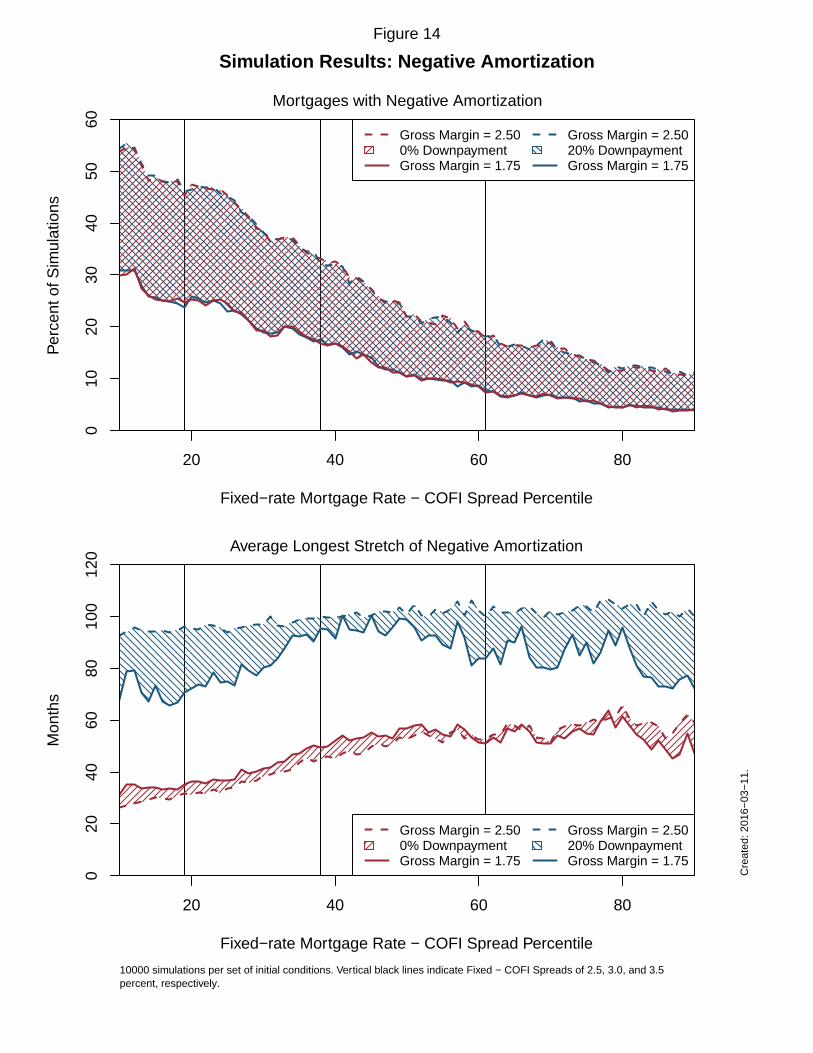
The gross margin makes a significant difference is the proportion of mortgages that
experience a period of negative amortization. As shown in in top panel of Figure 14, fixed-rate-to-
COFI spreads of 3.5 percent and greater (right of the right vertical black line), fewer than 8 percent
of Fixed-COFI mortgages with a gross margin of 1.75 percent have any negative amortization. If
the gross margin is increased to 2.5 percent, then the proportion of mortgages that experience a
period of negative amortization can rise as high as 18 percent. At a 2.5 percent spread (left black
vertical line), these proportions rise to 24 and 46 percent respectively.
The down payment make no difference in the proportion of mortgages with a period of
negative amortization, but make a large difference is the length such periods last. As shown in the
bottom panel, a 20 percent down payment allows the household to cover for period of negative
3/25/2016
17
amortization that can last, on average, between 60 months to 100 months. After that time, the
household either “cures” or defaults. In contrast, for a zero down payment mortgage, the range
for the average period of negative amortization is between 20 months and 60 months. Note that
in all these cases, there is significant time for taking actions that might lessen the probability of
default (and, again, we assume there is no other form of household savings.)
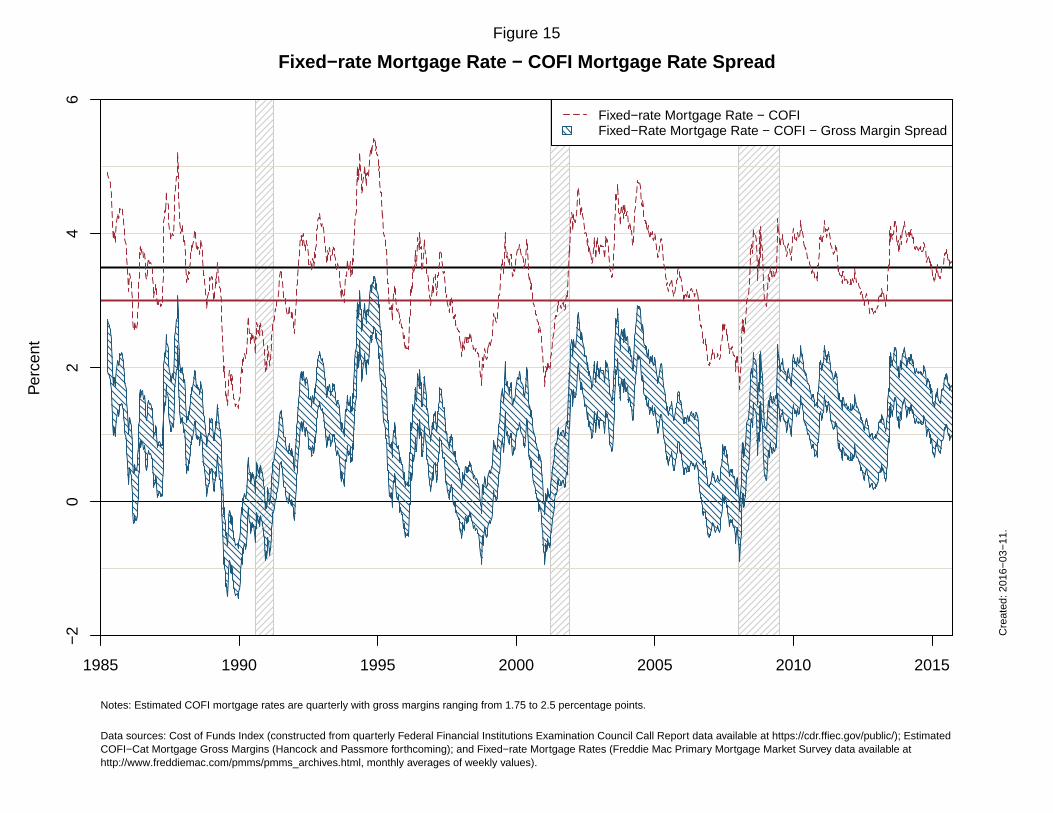
In general, for fixed-rate-to-COFI spreads above 3.5 percent, Fixed-COFI mortgages with
zero down payment mortgages are very successful in creating new homeowners. As shown with
the bold black line on Figure 15, these spreads are common. Even for spreads above 3.0 percent
(the bold red line), homeowners are very likely to successfully acquire their homes with zero down
payment Fixed-COFI mortgage.
However, when fixed-rate-mortgage-rate-to-COFI-mortgage-rate spreads fall below 3.0
percent, the gross margin charged by the bank makes a significant difference. Gross margins at
2.0 percent or lower would likely still be highly profitable for the bank, but there is less cushion
for both profits and homeowner equity accumulation. Modest down payments may also help
ensure homeowner success in this type of environment.
When the fixed-rate-mortgage-rate-to-COFI-mortgage-rate spread is wide, take a Fixed-
COFI mortgage. This advice is similar to the advice provided to households by Campbell and
Cocco (2003) when they compared fixed-rate mortgages to adjustable-rate mortgages from the
perspective of optimal household risk management: “When the yield spread [between fixed-rate
mortgage rate and adjustable-rate mortgage rates] is unusually high, more homeowners should
take out adjustable-rate mortgages; when it is unusually low, more homeowners should take out
fixed-rate mortgages.” Their modelling is more sophisticated than that presented here and allows
a variety of different risks (e.g. income and inflation risks), but the household’s objective is the
same: wealth accumulation. And many homeowners take this advice, as the adjustable-rate
mortgage share of mortgage originations rises when this spread is wide (Nothaft and Wang, 1992)
Unique among adjustable-rate mortgages, the Fixed-COFI mortgage allows the household to
capture the implicit savings “cushion” provided for household wealth provided by a wide spread
between fixed-rate mortgage rates and adjustable-rate mortgage rates, and thus provides a
mechanism of “saving” for a mortgage down payment.
3/25/2016
18
6. Why the Wedge?
Does the Fixed-COFI mortgage provide homeowners with a “free lunch”? Why does a
positive spread between the mortgages rates on traditional fixed-rate mortgages and profitable
COFI mortgage rates persist? There are many possible explanations, including the following
three possibilities.
At first pass, the Fixed-COFI spread represents the prepayment risk for a bank when
holding a fixed-rate mortgage where the homeowner can freely refinance. With a Fixed-COFI
mortgage, the homeowner “gives up” this option in return for being “automatically” refinanced,
with the savings going directly to purchasing the home. The bank, however, retains the credit
risk and servicing costs, and thus bears the costs of mortgage default.
But as shown above, the COFI mortgage payment rarely exceeds the fixed-rate mortgage
payment, and is usually significantly lower. Why is such a large premium built into the fixed-
rate mortgage rate over COFI?
For lenders and MBS investors, the funding risks of 30-year, fixed-rate mortgages can be
broken into four components: interest rate risk, prepayment risk, basis risk, and uncertainty.
Since many lenders are reluctant to bear these risks (Fuster and Vickery, 2014), fixed-rate
mortgages are often securitized. Thus, financing falls to MBS investors, who often try to
purchase hedges against these risks using financial instruments that are poorly suited to the task.
The first risk component is simply that mortgage holder’s cost-of-funds (which for a bank
would be COFI, but for a market-based MBS holder it would likely be either LIBOR or a
function of Treasury rates) rises above the rate on a previously originated 30-year, fixed-rate
mortgage. Many investors used interest rate swaps to mitigate this risk, or try to “match fund” by
setting the duration of their fixed-rate mortgage portfolio equal to the duration of liabilities.
The second component is the risk that interest rates fall, the homeowner refinances, and
the fixed-rate mortgage holder (or MBS holder) is left with a low-yielding asset funded by higher
cost liabilities. This prepayment risk is difficult and costly to hedge because it depends on many
3/25/2016
19
non-economic factors that are difficult to forecast. Combinations of interest rate swaps and
“swaptions” (swaps with options) are often used to hedge against this risk.
The third component risk is basis risk, which is a consequence of using interest rate
swaps. The yields on such swap are often benchmarked to Treasury or Libor rates, which may
be poorly correlated to the investors’ underlying source of funding.
The final component is the uncertainty associated with models of prepayment.
Prepayment model embed both a forecast of future interest rates (including the relative changes
in such rates) and homeowner behavior. Such models are notorious for their poor performance.
In addition, all the prices of these hedging instruments mentioned above represent an aggregation
of many investor’s beliefs over all of these components, which may be difficult to untangle and
predict. Moreover, there may be a significant payment for investor risk aversion built into
model-based, fixed-rate mortgage, prepayment premiums (Chernov, Dunn and Longstaff, 2016).
With the Fixed-COFI mortgage, the homeowner also bears the interest rate risk fixed-rate
mortgage payment because the homeowner can lose some of his or her accumulated home
equity. (Of course, the contract could also be designed so the bank took this risk.) The
homeowner hedges through precautionary savings, including the enforced savings of the Fixed-
COFI contract.
But from the homeowner’s perspective, some of the investors’ fears look like
opportunities. For the mortgage investor, refinancing represents lost income and the possibility
of being stuck in low-yielding assets. In addition, there is significant systemic risk components
to aggregate prepayment, making portfolios of MBS more difficult to hedge (Chernov, Dunn and
Longstaff, 2016).
For the homeowner with a Fixed-COFI mortgage, mortgage refinancing opportunities
and the associated lower interest rates represents additional opportunities for home equity
accumulation. The homeowner’s sacrifice is that their savings is constrained to being used for
home equity accumulation, and not consumption and/or investment more generally. This
asymmetric perspective on the risks of mortgage refinancing, combined with the risk aversion
and uncertainty of faced by market investors, suggests that the prepayment penalty embedded in
3/25/2016
20
fixed-rate mortgage may usually be greater than compensation needed by homeowners to bear
the prepayment risks associated with the Fixed-COFI mortgage.
Moreover, the high level of the investors’ prepayment premiums partly represents these
costs and uncertainties associated with loss income when mortgages refinance, which cause
investors to “front-load” the income from financing mortgages. Thus, it may not be surprising
that actual savings from refinancing, on average, are much larger than the actual losses incurred
COFI rises above the fixed-rate mortgage rate.
A related, and second, explanation for the persistence of the positive spread between the
fixed-rate mortgage rate and COFI mortgage rate is that fixed-rate mortgage investors may
consistently overestimate the ability of homeowners to refinance these mortgages for all possible
occurrences of favorable refinancing conditions. One can think of the Fixed-COFI mortgage as a
fixed-rate mortgage that always refinances, but where the household’s savings from refinancing
are forced to be used for early principle pay-downs of the mortgage. Investors have to price
prepayment options as if households can refinance at any occurrence of a profitable refinancing
opportunity. But many household miss such opportunities and, as a result, the compensation for
prepayment risk is “too large.” Investors are unable to compete by offering lower prepayment
margins because it’s not possible to precisely model which refinancing opportunities are missed
(and which households miss them). In addition, households may themselves be overconfident
about their ability to prepay their mortgages, making them more willing to accept higher
prepayment premiums charged by investors.14
A third explanation of the persistence in the difference between fixed-rate mortgage rates
and COFI mortgage rates is market power. Real estate markets are inherently local and some
localities be characterized by concentration of mortgage originators and/or funders, dominance
of local real estate market by a single firm, search problems in finding appropriate mortgage
products, and other externalities that might lead to higher mark-ups of mortgage rates over local
cost of funds. For example, the search process for mortgage brokers (and thus mortgage
products) may be highly dependent on local real estate agents or on depend on the knowledge of
local neighbors. However, for an externalities to affect a national mortgage rate index, they
14 For the consequences of consumer overconfidence and the persistence of “high prices”, see Grubb (2015).
3/25/2016
21
would have to be commonplace across many communities. Determining the extent of such
market imperfections in mortgage and real estate markets requires more research.
Finally, note that the “wedge” may be far more valuable to the household than to an MBS
investor. What the discount rate should be over long horizons is difficult to determine. Recent
work on long-horizon discount rates for real estate suggests that the typical practice of using an
average discount rate greatly overstates the appropriate discount rate at long horizons for long-
lived physical assets (Giglio, Maggiori, and Stroebel, 2015). The MBS investor and the
household may bear the same interest rate risk and thus demand the same compensation for risk,
but if bearing the risk results in the household owning a home, the return to the household is far
higher than to the MBS investor.
Conclusion
I propose a new type of mortgage, called a Fixed-COFI Mortgage, which is designed to
help renters, who may be paying rents that are as high as comparable mortgage payments but
have little or no savings for a down payment. In essence, this mortgage is a traditional 30-year,
fixed-rate mortgage with little or no down payment. The depository institution forgoes the
traditional down payment and, in return, the household engages in a form of forced savings
based on a cost-of-fund index that allows the mortgage financier to be profitable. When the
fixed-rate-mortgage-rate-to-COFI spread is greater than three percent, this mortgage leads to
rapid home equity accumulation by the household and almost always results in homeownership.
This mortgage may be one method to make homeownership a more realistic possibility for
renters located in high-cost metropolitan areas.
3/25/2016
22
References
Campbell, John Y. and João F. Cocco, 2003, “Household Risk Management and Optimal Mortgage Choice,” The Quarterly Journal of Economics, Vol. 118, No. 4, pp. 1449-1404. November,
Campbell, John Y. and João F. Cocco, 2015, “A Model of Mortgage Default.” Journal of Finance. Vol. 70, No. 4, 1495-1554, August.
Campbell, John Y., 2013, “Mortgage Market Design,” Review of Finance, Vol. 17 No. 1, pp. 1-33.
Chernov, Mikhail, Brett R. Dunn, Francis A. Longstaff, 2016. “Macroeconomic-Driven Prepayment Risk and the Valuation of Mortgage-Backed Securities,” NBER Working paper 22096, March.
Consumer Reports, 2016, “The Real State of Real Estate,” Consumer Reports, March
Cornell, B. 1987. “Forecasting the Eleventh District Cost of Funds,” Housing Finance Review 6: 123-135.
Duncan, D., Orawin Velz, Haimlton Fout, Mark Palin and Frank Shaw, “2016: Affordable Constrains as the Expansion Matures”, Fannie Mae: Economic and Strategic Research, January 11.
Federal Financial Institutions Examination Council. 2016. Call Report [TINY data]. Retrieved March 2016, from https://cdr.ffiec.gov/public/.
Federal Reserve Bank of Richmond, 2015, “5th District Footprint,” December. Retrieved February 29, 2016 from https://www.richmondfed.org/-/media/richmondfedorg/publications/ community_development/5th_district_footprint/2015/footprint_20151221.pdf.
Freeman, Allison and Jeffery Harden, 2015, “Affordable Homeownership: The Incidence and Effect of Down Payment Assistance,” Housing Policy Debate, vol. 25, No. 2, 308-319.
Freddie Mac Primary Mortgage Market Survey. 2016. Weekly 30-Year Fixed-Rate Mortgage Series. Retrieved March 2016, from http://www.freddiemac.com/pmms/pmms_archives.html.
Fuster, Andreas and James Vickery, 2015, “Securitization and the Fixed-Rate Mortgage,” Review of Financial Studies, Vol. 28, No.1, pp. 176-211.
Fuster, Andreas, and Basit Zafar. 2014. "The sensitivity of housing demand to financing conditions: evidence from a survey." Federal Reserve Bank of New York Staff Reports, No. 702.
Gerardi, Kristopher, Kyle F. Herkenhoff, Lee E. Ohanian, and Paul S. Willen. 2015. "Can't Pay or Won't Pay? Unemployment, Negative Equity, and Strategic Default., NBER working paper 21630, October.
Giglio, Stefano, Matteo Maggiori, and Johannes Stroebel. 2015 "Very Long-Run Discount Rates." Quarterly Journal of Economics vol. 130, no. 1:1-53, February
Green, Richard K. and Susan M. Wachter, 2005, “The American Mortgage in Historical and International Context,” Journal of Economic Perspectives, Vol. 19, No. 4, Autumn, pp. 93-114.
Grinstein-Weiss, Michal, Clinton Key, Shenyang Guo, Yeong Hun Yeo, and Krista Holub. 2013. "Homeownership and Wealth among Low- and Moderate-Income Households." Housing Policy Debate 23, no. 2: 259-279
Grubb, Michael D., 2015, "Overconfident Consumers in the Marketplace," Journal of Economic Perspectives 29, no. 4: 9-36.
Hancock, Diana and Wayne Passmore, in press, “Cost of Funds Indexed Mortgage Contracts with Government-Backed Catastrophic Insurance (COFI-Cats): A Realistic Alternative to the 30-Year Fixed-Rate Mortgage?” Journal of Economics and Business (2016), http://dx.doi.org/10.1016/j.jeconbus.2016.02.004.
Hancock, Diana and Wayne Passmore, forthcoming, “Macroprudential Government-Backed Securitization: Can It Work?” in Susan Wachter and Joseph Tracy eds., Housing Finance Reform: Principles of Stability: University of Pennsylvania, Philadelphia.
Mattey, Joe and Nancy Wallace, 2001, “Housing-Price Cycles and Prepayment Rates of U.S. Mortgage Pools,” Journal of Real Estate Finance and Economics, Vol. 23, No. 2, pp. 161-184.
Mayer, Christopher, Karen Pence, and, Shane Sherlund, 2009, “The Rise in Mortgage Defaults,” Journal of Economic Perspectives Vol. 23, pp. 27–50.
Nothaft, Frank E. and, George H K Wang, 1992, “Determinants of the ARM Share of National and Regional Lending,” The Journal of Real Estate Finance and Economics, Vol. 5, Issue 2, pp. 219-234.
Olsen, Skylar, 2016a, “Q4 2015 Breakeven Horizon: Buying A Home Pays Off For Most – But Not All – After Just Two Years,” Zillow. Retrieved February 29, 2016 from: http://www.zillow.com/research/q4-2015-breakeven-horizon-11726/.
Olsen, Skylar, 2016b, “US Housing Insights Barclays Select Series 2016: Housing Symposium,” Zillow Group. Retrieved February 29, 2016 from: http://cdn2.blog-media.zillowstatic.com/3/Barclays_2016-5f6e35.pdf.
Passmore, Wayne, 1993. “Econometric Models of the Eleventh District Cost of Funds Index,” Journal of Real Estate Finance and Economics, Vol. 6, No. 2, pp.175-88.
Schwartz, Eduardo S. and Walter N. Torous, 1989, “Prepayment and the Valuation of Mortgage-Backed Securities,” The Journal of Finance, Vol. 154, No. 2, pp. 375–392.
Stanton, Richard H., and Nancy Wallace, 1995, “ARM Wrestling: Valuing Adjustable Mortgages Indexed to the Eleventh District Cost of Funds,” Real Estate Economics, Vol. 23, Issue 3, pp.311-345.
Zillow Data. 2016. Zillow Home Value Index, Zillow Rent Index, and Median Household Income series. Retrieved March 2016, from http://www.zillow.com/research/data/.
Zillow Rent Index / Zillow Home Value Index
Per
cent
of S
ampl
e
0.000 0.005 0.010 0.015
05
1015
2025
30
Q1 2006US AverageQ3 2015US Average
Changing Affordability of Housing in Metropolitan AreasHistogram of Metropolitan Areas
Figure 1
Zillow Rent Index / Mortgage Payment Based on Zillow Home Value Index
Per
cent
of S
ampl
e
0 1 2 3 4
05
1015
2025
Q1 2006US AverageQ3 2015US Average
Histogram of Metropolitan Areas
0 10 20 30 40 50 60
020
040
060
080
010
00
12 * Zillow Rent Index / Median Income
Zill
ow H
ome
Val
ue In
dex
/ Med
ian
Inco
me
Scatterplot of Metropolitan Areas and US Average
Q1 2006US AverageQ3 2015US Average
Notes: The Zillow Home Value Index and Zillow Rent Index measure median home values and rents in a given metropolitan area. Mortgage payments are calculated for a 30−year fixed−rate mortgage with a 20 percent downpayment. 381 metropolitan areas.
Data source: Fixed−rate Mortgage Rates (Freddie Mac Primary Mortgage Market Survey data available at http://www.freddiemac.com/pmms/pmms_archives.html, quarterly averages of weekly values); and Zillow Home Value Indexes, Zillow Rent Indexes, and Median Incomes (Zillow, available at http://www.zillow.com/research/data/).
1985 1990 1995 2000 2005 2010 2015
02
46
810
1214
Comparison of Actual Fixed−rate Mortgage Rates and Estimated COFI Mortgage Rates
Notes: Estimated COFI mortgage rates are quarterly with gross margins ranging from 1.75 to 2.5 percentage points.
Cre
ated
: 201
6−03
−11
.
Data sources: Cost of Funds Index (constructed from quarterly Federal Financial Institutions Examination Council Call Report data available at https://cdr.ffiec.gov/public/); Estimated COFI−Cat Mortgage Gross Margins (Hancock and Passmore forthcoming); and Fixed−rate Mortgage Rates (Freddie Mac Primary Mortgage Market Survey data available at http://www.freddiemac.com/pmms/pmms_archives.html, monthly averages of weekly values).
Figure 2
1985 1990 1995 2000 2005 2010 2015
0.0
0.2
0.4
0.6
0.8
1.0
1.2
Payment Breakdown for Example Traditional Fixed−rate Mortgage and Fixed−COFI Mortgage
Notes: Mortgages originated in April 1985 with 100 percent LTV and 30−year maturity. COFI mortgage gross margins range from 1.75 to 2.5 percentage points. For both mortgages, household payment is 1.13 percent of house price. Effective length of Fixed−COFI mortgage is between 153 and 144 months.
Cre
ated
: 201
6−03
−11
.
Data sources: Cost of Funds Index (constructed from quarterly Federal Financial Institutions Examination Council Call Report data available at https://cdr.ffiec.gov/public/); Estimated COFI−Cat Mortgage Gross Margins (Hancock and Passmore forthcoming); and Fixed−rate Mortgage Rates (Freddie Mac Primary Mortgage Market Survey data available at http://www.freddiemac.com/pmms/pmms_archives.html, monthly averages of weekly values).
Figure 3
Table 1: Cost of Funds Partial Adjustment Model
Dependent variable:
Cost of Funds Index
Lag Cost of Funds Index 0.746∗∗∗
(0.016)
Average 1-year Treasury Yield 0.232∗∗∗
(0.015)
Constant 0.037
(0.027)
Observations 123
R-squared 0.996
Adjusted R-squared 0.996
Durbin-Watson Statistic 1.31
Quarterly ∗p<0.1; ∗∗p<0.05; ∗∗∗p<0.01
Notes: Data from Q1 1985 to Q3 2015.
Data sources: Cost of Funds Index (constructed from quarterly Federal Financial Institutions
Examination Council Call Report data available at https://cdr.ffiec.gov/public/); and 1-year
Treasury Yield (US Treasury available at https://www.treasury.gov/resource-center/data-chart-
center/interest-rates/Pages/TextView.aspx?data=yield, quarterly averages of daily values).
Hlavac, Marek (2015). stargazer: Well-Formatted Regression and Summary Statistics Tables.
http://CRAN.R-project.org/package=stargazer.
Created: 2016-03-11.
1985 1990 1995 2000 2005 2010 2015
020
4060
8010
0Mortgage Balance and Household Equity for Traditional Fixed−rate Mortgage and Fixed−COFI Mortgage
Per
cent
of H
ouse
Pric
e (M
onth
ly)
Traditional Fixed−rateMortgage BalanceHousehold Equity
Notes: Mortgages originated in April 1985 with 100 percent LTV and 30−year maturity. Estimated COFI mortgage gross margins ranging from 1.75 to 2.5 percentage points. Effective length of Fixed−COFI mortgage is between 153 and 144 months.
Cre
ated
: 201
6−03
−11
.
Data sources: Cost of Funds Index (constructed from quarterly Federal Financial Institutions Examination Council Call Report data available at https://cdr.ffiec.gov/public/); Estimated COFI−Cat Mortgage Gross Margins (Hancock and Passmore forthcoming); and Fixed−rate Mortgage Rates (Freddie Mac Primary Mortgage Market Survey data available at http://www.freddiemac.com/pmms/pmms_archives.html, monthly averages of weekly values).
Figure 4
1985 1990 1995 2000 2005 2010 2015
02
46
810
Cost of Funds Partial Adjustment Model Fitted Values
Per
cent
Daily 1−year Treasury YieldQuarterly Average 1−year Treasury YieldCOFIPredicted COFI
Notes: Predicted COFI based on model from Table 1.
Cre
ated
: 201
6−03
−11
.
Data sources: Cost of Funds Index (constructed from quarterly Federal Financial Institutions Examination Council Call Report data available at https://cdr.ffiec.gov/public/); and 1−year Treasury Yield (US Treasury available at https://www.treasury.gov/resource−center/data−chart−center/interest−rates/Pages/TextView.aspx?data=yield).
Figure 5
Table 2: AR(1) Treasury Yield Models
Dependent variable:
Average 1-year Treasury Yield
Quarterly Monthly Weekly Daily
(1) (2) (3) (4)
Lagged Average 1-year Treasury Yield 0.977∗∗∗ 0.992∗∗∗ 0.998∗∗∗ 1.000∗∗∗
(0.016) (0.005) (0.001) (0.0002)
Constant 0.021 0.006 0.001 0.00005
(0.077) (0.026) (0.005) (0.001)
Observations 122 369 1604 8022
R-squared 0.97 0.989 0.998 1
Adjusted R-squared 0.969 0.989 0.998 1
V̂ar (ε̂)MLE 0.22 0.079 0.014 0.003
∗p<0.1; ∗∗p<0.05; ∗∗∗p<0.01
Notes: Data from January 1, 1985 to September 31, 2015.
Data sources: Treasury Yields (US Treasury available at https://www.treasury.gov/, specified averages of daily values).
Hlavac, Marek (2015). stargazer: Well-Formatted Regression and Summary Statistics Tables. http://CRAN.R-project.org/package=stargazer.
Created: 2016-03-11.
Table 3: Initial Conditional of Treasury Yields, Fixed-rate Mortgage Rates and COFI
Treasury Yield Percentile T0 Mean FR0 Mean COFI0 COFI FR0 T0 Spread FR0 COFI0 Spread FR0 COFI Spread
10 0.19 4.21 0.72 0.17 4.02 3.49 4.04
25 1.27 5.66 1.84 1.16 4.38 3.82 4.49
50 4.45 7.02 4.22 4.06 2.58 2.80 2.96
75 5.96 8.53 5.42 5.45 2.57 3.11 3.09
90 7.66 10.45 7.41 7 2.79 3.04 3.45
Table 4: Treasury Yield Shocks to Steady-state COFI
Treasury Yield Percentile ε∗
1.75 Pr{ε∗1.75} ε∗
2.00 Pr{ε∗2.00} ε∗
2.25 Pr{ε∗2.25} ε∗
2.50 Pr{ε∗2.50}
10 2.51 0 2.23 0 1.96 0 1.68 0
25 3.00 0 2.73 0 2.46 0 2.18 0
50 1.33 0.20 1.06 1.30 0.78 4.90 0.51 14.10
75 1.46 0.10 1.19 0.60 0.92 2.60 0.64 8.70
90 1.86 0 1.59 0 1.32 0.30 1.04 1.40
Notes: Quarterly data from Q1 1985 to Q3 2015. The fixed-rate mortgage rates and COFIs used in deriving mean values are +/-10 percent from
each percentile. Probabilities estimates based on normally distributed quarterly changes in 1-year Treasury yields with mean = 0 and MLE stan-
dard deviation estimator = .473.
Data sources: Cost of Funds Index (constructed from quarterly Federal Financial Institutions Examination Council Call Report data available
at https://cdr.ffiec.gov/public/); Estimated COFI-Cat Mortgage Gross Margins (Hancock and Passmore forthcoming); and Fixed-rate Mortgage
Rates (Freddie Mac Primary Mortgage Market Survey data available at http://www.freddiemac.com/pmms/pmms archives.html, quarterly aver-
ages of weekly values); and 1-year Treasury Yields (US Treasury available at https://www.treasury.gov/resource-center/data-chart-center/interest-
rates/Pages/TextView.aspx?data=yield, quarterly averages of daily values).
Hlavac, Marek (2015). stargazer: Well-Formatted Regression and Summary Statistics Tables. http://CRAN.R-project.org/package=stargazer.
Created: 2016-03-11.
Fixed−rate Mortgage Rate − Treasury Spread
Per
cent
of S
ampl
e
0 1 2 3 4 5
05
1015
20
Fixed−rate Mortgage Rate − Treasury Spread
Histogram
Figure 6
0 1 2 3 4 5
020
4060
8010
0
Fixed−rate Mortgage Rate − Treasury Spread
Pro
babi
lity
Gross Margin = 1.75Gross Margin = 2.50
Pr{Steady State COFI Mortgage Rate > Fixed−rate Mortgage Rate}
Cre
ated
: 201
6−03
−11
.
Data sources: Estimated COFI−Cat Mortgage Gross Margins (Hancock and Passmore forthcoming); Fixed−rate Mortgage Rates (Freddie Mac Primary Mortgage Market Survey data available at http://www.freddiemac.com/pmms/pmms_archives.html, quarterly averages of weekly values) and 1−year Treasury Yield (US Treasury available at https://www.treasury.gov/resource−center/data−chart−center/interest−rates/Pages/TextView.aspx?data=yield, quarterly averages of daily values).
0 10 20 30 40 50 60
02
46
810
Expected COFI Mortgage Rates with 95% Confidence Interval
Data sources: Cost of Funds Index (constructed from quarterly Federal Financial Institutions Examination Council Call Report data available at https://cdr.ffiec.gov/public/); Estimated COFI−Cat Mortgage Gross Margins (Hancock and Passmore forthcoming); Fixed−rate Mortgage Rates (Freddie Mac Primary Mortgage Market Survey data available at http://www.freddiemac.com/pmms/pmms_archives.html, monthly averages of weekly values) and 1−year Treasury Yield (US Treasury available at https://www.treasury.gov/resource−center/data−chart−center/interest−rates/Pages/TextView.aspx?data=yield).
0 20 40 60 80 100 120
010
2030
4050
Quarters Since Origination
Pro
babi
lity
Figure 8
Probability of COFI Mortgage Rates Greater than Fixed−rate Mortgage Rates10th Percentile of 1−year Treasury Yields
Data sources: Cost of Funds Index (constructed from quarterly Federal Financial Institutions Examination Council Call Report data available at https://cdr.ffiec.gov/public/); Estimated COFI−Cat Mortgage Gross Margins (Hancock and Passmore forthcoming); Fixed−rate Mortgage Rates (Freddie Mac Primary Mortgage Market Survey data available at http://www.freddiemac.com/pmms/pmms_archives.html, monthly averages of weekly values) and 1−year Treasury Yield (US Treasury available at https://www.treasury.gov/resource−center/data−chart−center/interest−rates/Pages/TextView.aspx?data=yield).
Notes: 1−year Treasury Yield, COFI and Fixed−rate mortgage rate values are means computed from a +/−10 percent spread around each spread percentile. Vertical black lines indicate Fixed − COFI spreads of 2.5, 3.0, and 3.5 percent, respectively.
Cre
ated
: 201
6−03
−11
.
Data sources: Cost of Funds Index (constructed from quarterly FFIEC Call Report data available at https://cdr.ffiec.gov/public/); Fixed−rate Mortgage Rates (Freddie Mac Primary Mortgage Market Survey data available at http://www.freddiemac.com/pmms/pmms_archives.html, quarterly averages of weekly values); and 1−year Treasury Yield (US Treasury available at https://www.treasury.gov/resource−center/data−chart−center/interest−rates/Pages/TextView.aspx?data=yield, quarterly averages of daily values).
Figure 9
20 40 60 80
020
4060
8010
0Simulation Results: Interest Savings for Successful Mortgages
Notes: Simulations terminated after 70 years. 10000 simulations per set of initial conditions. Vertical black lines indicate Fixed − COFI spreads of 2.5, 3.0, and 3.5 percent, respectively.
20 40 60 80
020
4060
8010
012
014
0Simulation Results: Average Months Until 20% Equity Accrued
Notes: Simulations terminated after 70 years. 10000 simulations per set of initial conditions. Vertical black lines indicate Fixed − COFI spreads of 2.5, 3.0, and 3.5 percent, respectively.
Simulations terminated after 70 years. 10000 simulations per set of initial conditions. Vertical black lines indicate Fixed − COFI Spreads of 2.5, 3.0, and 3.5 percent, respectively.
Notes: Estimated COFI mortgage rates are quarterly with gross margins ranging from 1.75 to 2.5 percentage points.
Cre
ated
: 201
6−03
−11
.
Data sources: Cost of Funds Index (constructed from quarterly Federal Financial Institutions Examination Council Call Report data available at https://cdr.ffiec.gov/public/); Estimated COFI−Cat Mortgage Gross Margins (Hancock and Passmore forthcoming); and Fixed−rate Mortgage Rates (Freddie Mac Primary Mortgage Market Survey data available at http://www.freddiemac.com/pmms/pmms_archives.html, monthly averages of weekly values).