46
Nuno Santos FAO, Investment Centre December 17,2012

Nuno Santos FAO, Investment Centre
December 17,2012

Dynamics of Laos rice sector
Policy analysis
Public expenditure scenarios
Conclusions and recommendations
Observations on analytical tools

Total pop.: 6.2 million (about 70% rural)
Agriculture VA about 35% of GDP
Rice production important for more than 700,000 HHs
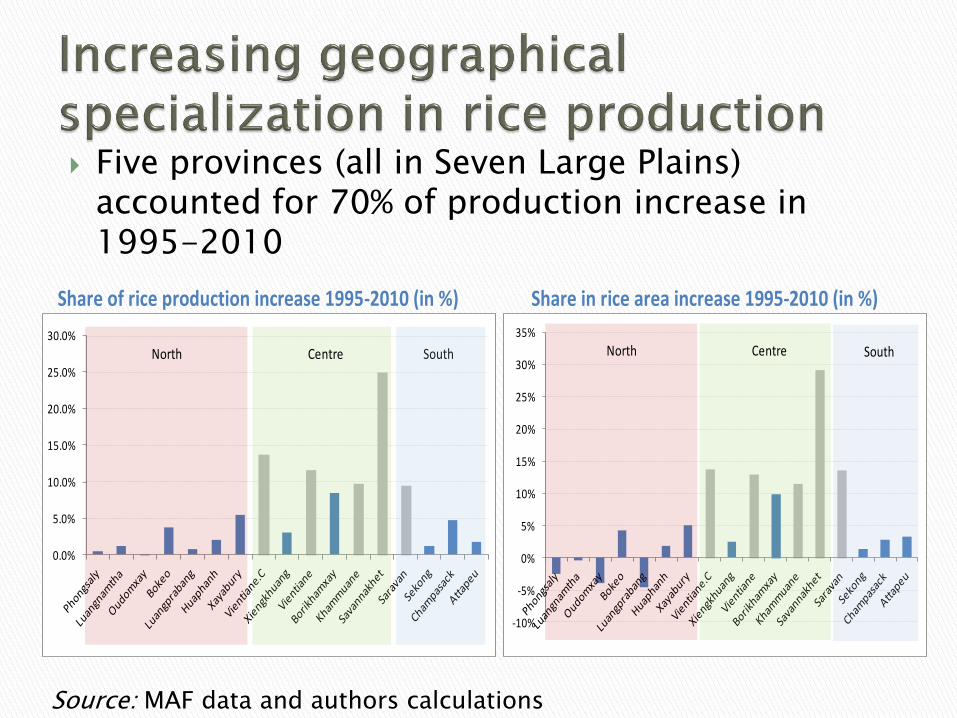
Five provinces (all in Seven Large Plains) accounted for 70% of production increase in 1995-2010
Share of rice production increase 1995-2010 (in %) Share in rice area increase 1995-2010 (in %)
0.0%
5.0%
10.0%
15.0%
20.0%
25.0%
30.0%
North Centre South
-10%
-5%
0%
5%
10%
15%
20%
25%
30%
35%
North Centre South
Source: MAF data and authors calculations
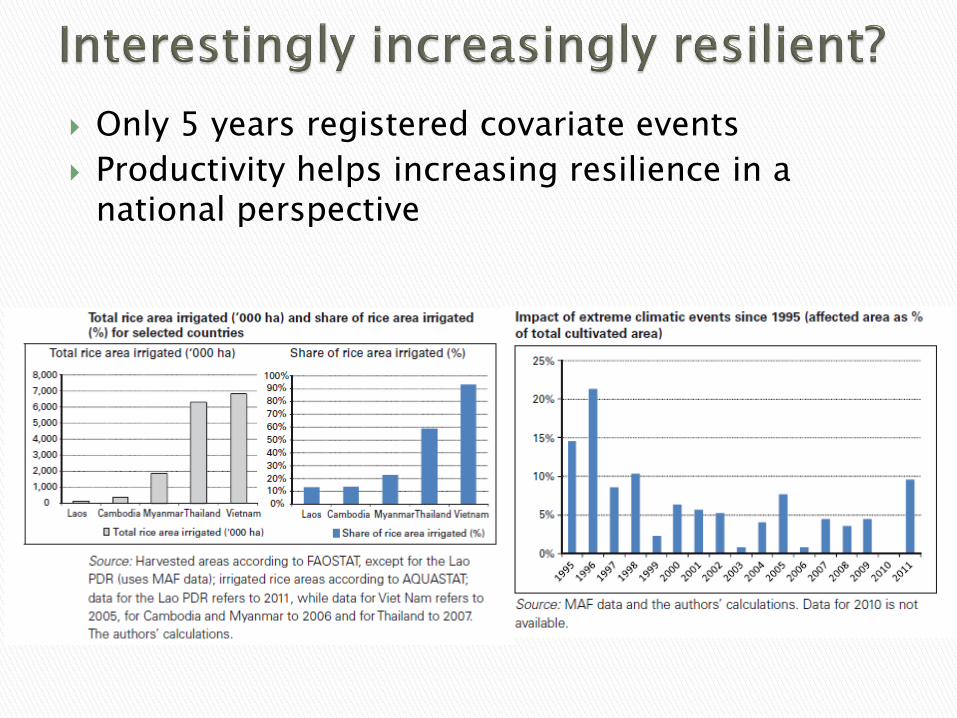
Only 5 years registered covariate events
Productivity helps increasing resilience in a national perspective
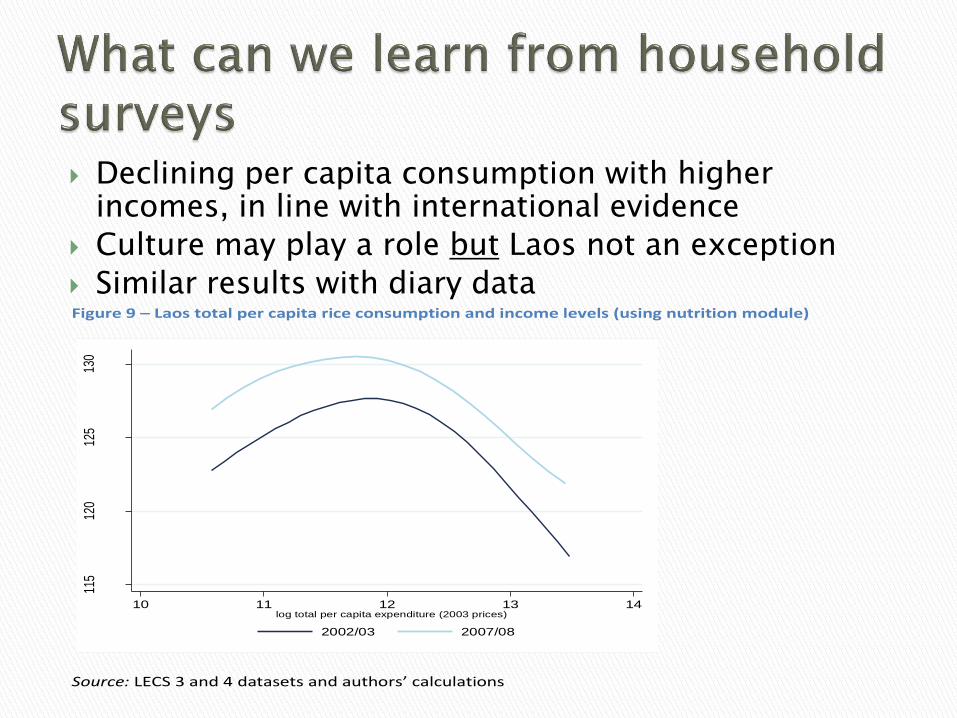
Figure 9 – Laos total per capita rice consumption and income levels (using nutrition module)
Source: LECS 3 and 4 datasets and authors’ calculations
115
120
125
130
Per
cap
ita ri
ce c
onsu
mpt
ion
(kg/
pers
on/y
ear)
10 11 12 13 14log total per capita expenditure (2003 prices)
2002/03 2007/08
Declining per capita consumption with higher incomes, in line with international evidence
Culture may play a role but Laos not an exception
Similar results with diary data
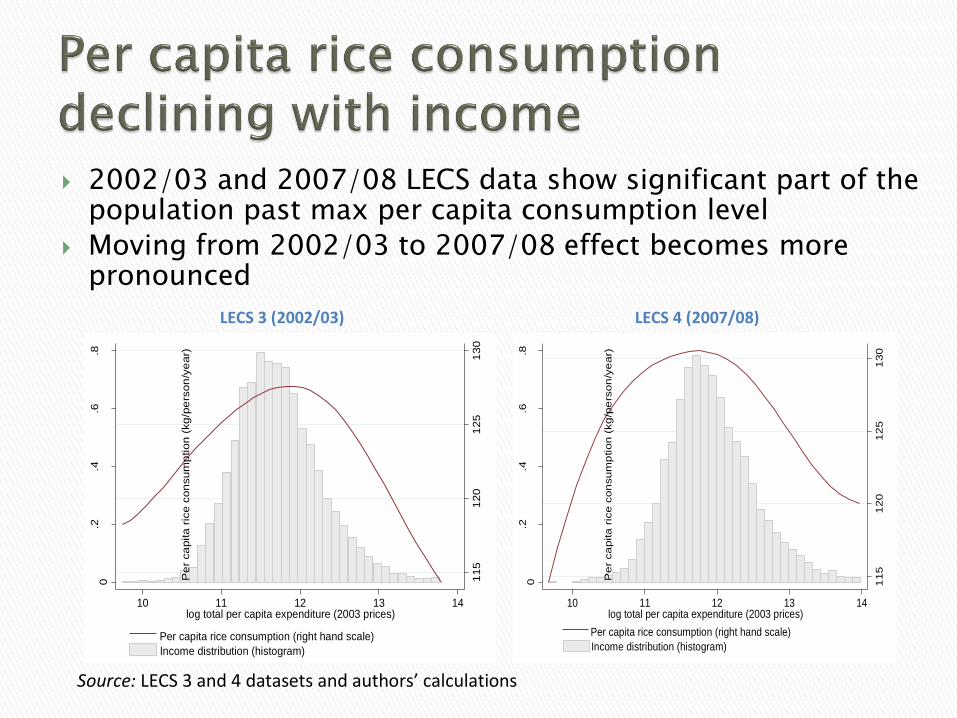
LECS 3 (2002/03) LECS 4 (2007/08)
Source: LECS 3 and 4 datasets and authors’ calculations
115
120
125
130
Pe
r ca
pita
ric
e c
on
sum
ption
(kg
/pe
rson
/ye
ar)
0.2
.4.6
.8
Den
sity
10 11 12 13 14log total per capita expenditure (2003 prices)
Income distribution (histogram)
Per capita rice consumption (right hand scale)
115
120
125
130
Pe
r ca
pita
ric
e c
on
sum
ption
(kg
/pe
rson
/ye
ar)
0.2
.4.6
.8
Den
sity
10 11 12 13 14log total per capita expenditure (2003 prices)
Income distribution (histogram)
Per capita rice consumption (right hand scale)
2002/03 and 2007/08 LECS data show significant part of the population past max per capita consumption level
Moving from 2002/03 to 2007/08 effect becomes more pronounced

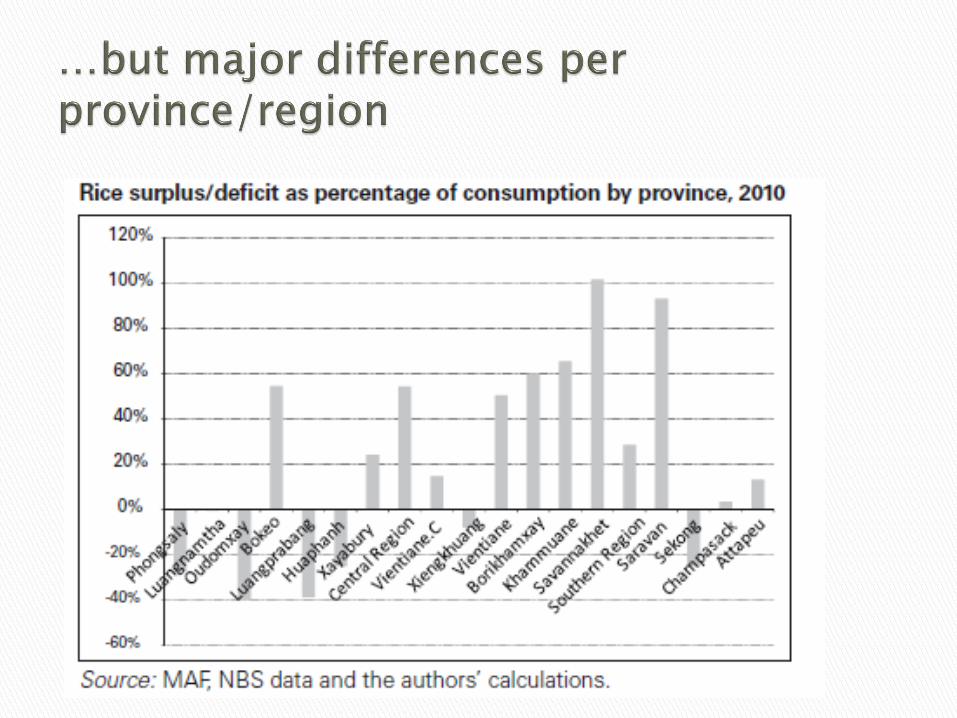

Undernourishment still a big problem in most rice surplus regions in South East Asia
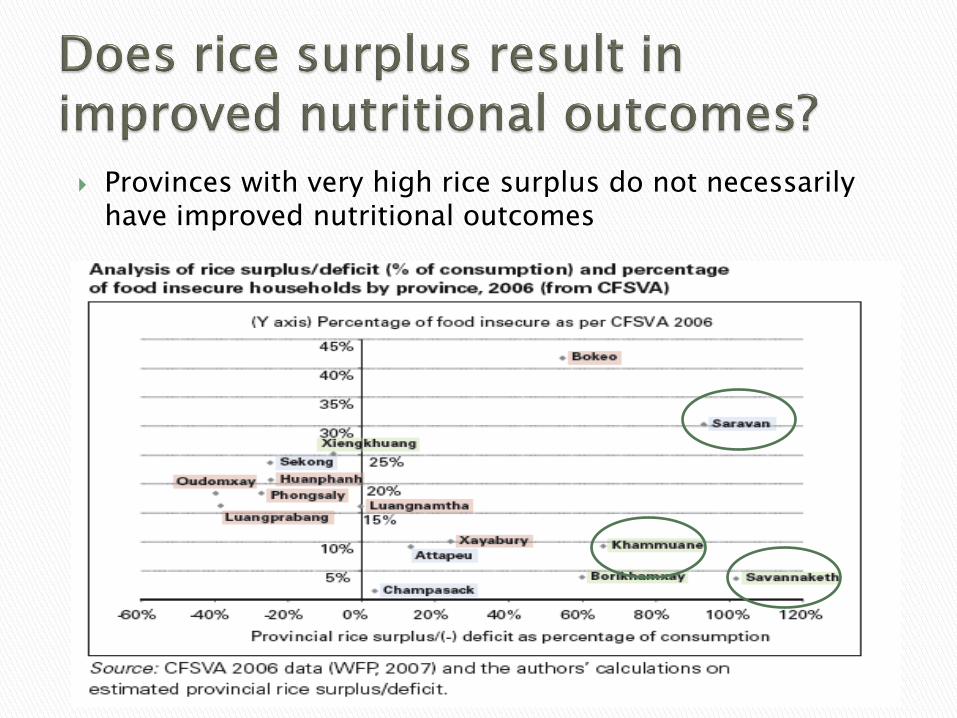
Provinces with very high rice surplus do not necessarily have improved nutritional outcomes

Farmer
typology
Yield
(kg/ha) Land (ha)
Cropping
intensity (%)
Production
(kg)
Price
(US$)
Production
value (US$)
Inputs
costs
(US$)
Gross margin
incl. hired
labour (US$)
Labour
(man-
days)
Return to
labour
(US$/man-
day)
Return to
family labour
(US$/man-day)
Type A 1.3 1.0 2,730 0.23 614 267 347 143 2.4 2.4
WS 2,100 1.3 2,730 0.23 614 267 347 143 2.4 2.4
DS
Type B 1.7 1.0 5,100 0.23 1,148 540 416 158 3.8 3.6
WS 3,000 1.7 5,100 0.23 1,148 540 416 158 3.8 3.6
DS
Type C 2.6 1.4 9,468 0.23 2,201 903 866 232 5.6 6.4
WS 3,500 1.9 6,650 0.23 1,496 567 630 156 6.0 7.1
DS 4,025 0.7 2,818 0.25 704 336 236 76 4.8 5.0
Three indicative farm models developed:
Low input/low output Wet Season only (Type A)
Average input, Wet Season only (Type B)
Commercially oriented (Type C)

Insufficient returns to labor at current prices and productivity levels for Type A and at limit for Type B

About 18,000 rice mills
Mostly small and medium-sized mills with maximum 2-4 ton per day of paddy rice processing capacity
Most with old technology, very few large modern mills but numbers increasing
Processing quality still insufficient in most cases => main impediment for exports of milled rice in near future
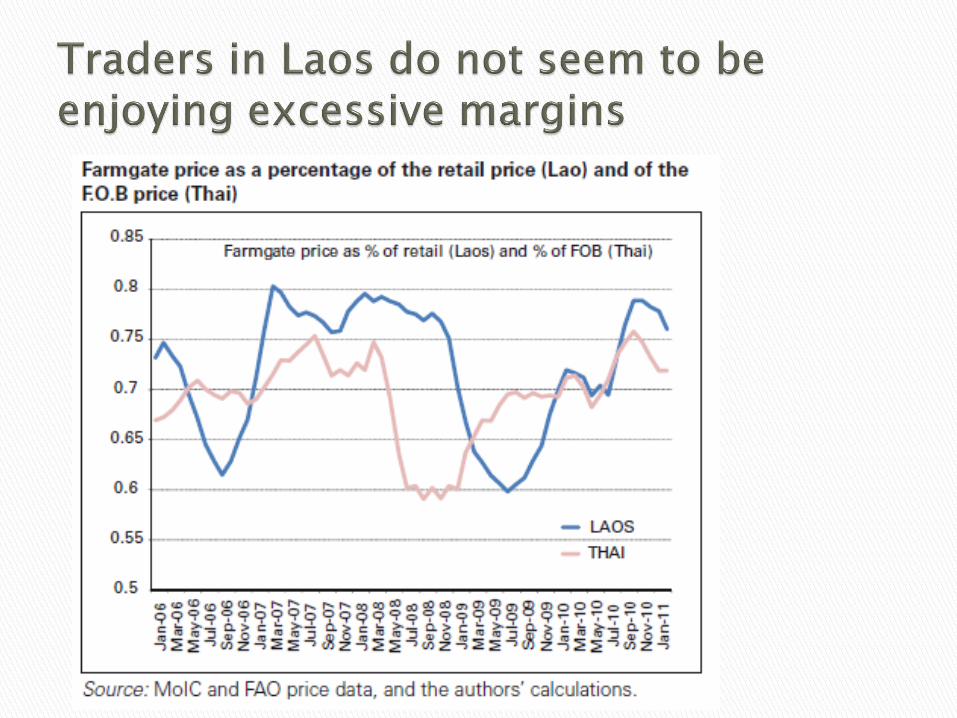
Low milling margins suggest no excessive profits
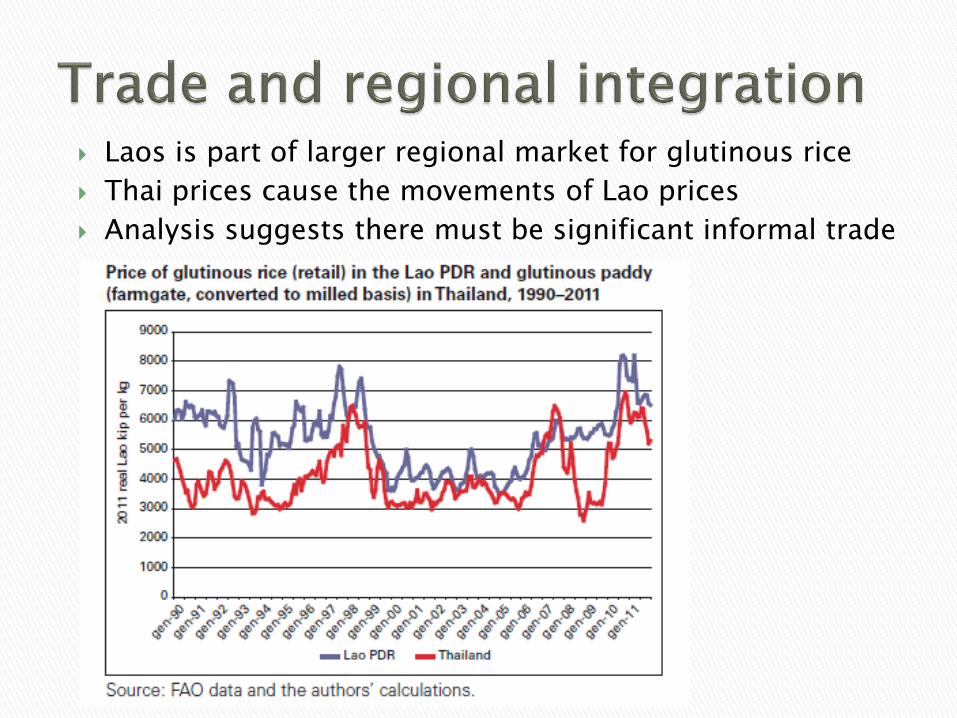
Laos is part of larger regional market for glutinous rice
Thai prices cause the movements of Lao prices
Analysis suggests there must be significant informal trade


Targets for 2015 ◦ Total paddy rice production of 4.2 million tonnes
◦ Average yield of paddy increased significantly
◦ 170,000 ha in plains opened up/intensified
◦ 600,000 mt of high-quality, non-glutinous rice exported
◦ Malnutrition reduced by half
Achieving food security and rice price stability are most important [political economy]
Big confusion on policies, instruments and institutional responsibilities: ◦ Conflicting policy objectives need to be disentangled
◦ Multiple policy instruments may be required
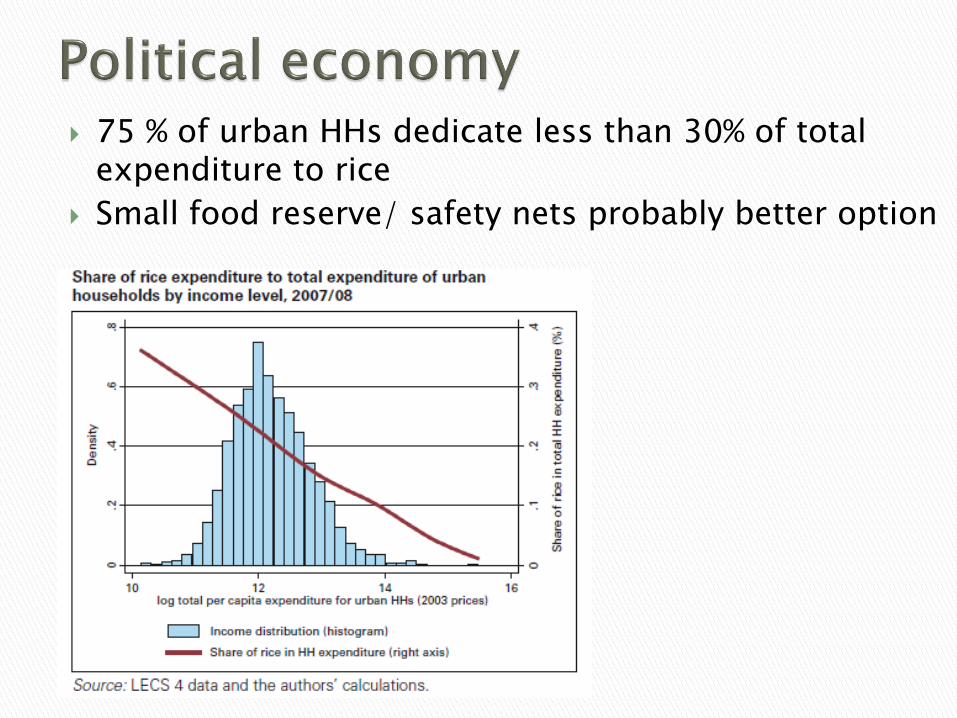
75 % of urban HHs dedicate less than 30% of total expenditure to rice
Small food reserve/ safety nets probably better option
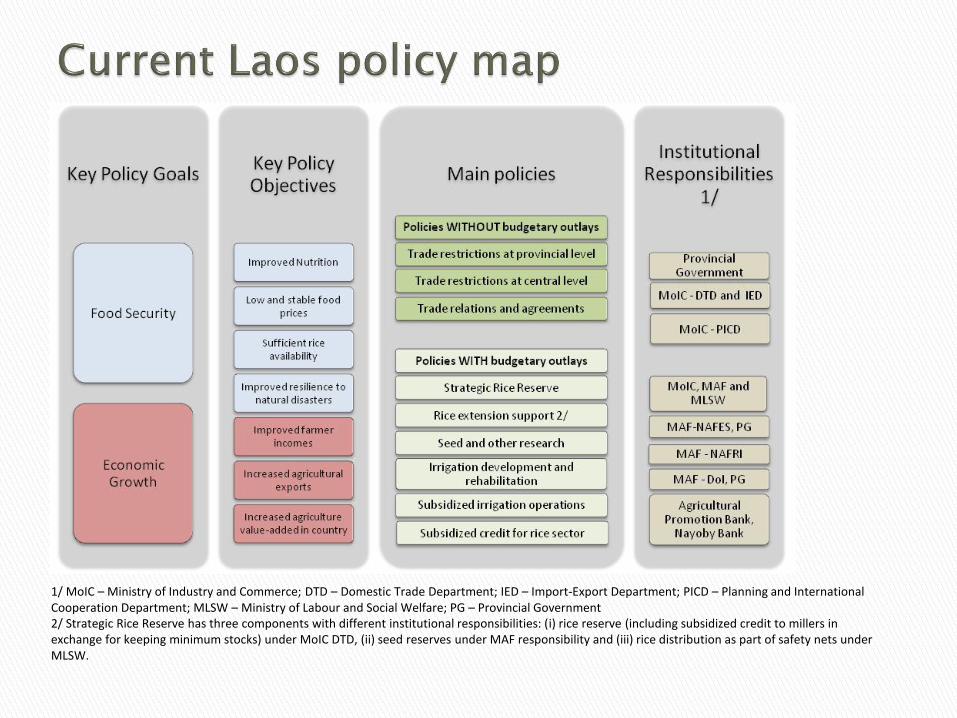
1/ MoIC – Ministry of Industry and Commerce; DTD – Domestic Trade Department; IED – Import-Export Department; PICD – Planning and International Cooperation Department; MLSW – Ministry of Labour and Social Welfare; PG – Provincial Government 2/ Strategic Rice Reserve has three components with different institutional responsibilities: (i) rice reserve (including subsidized credit to millers in exchange for keeping minimum stocks) under MoIC DTD, (ii) seed reserves under MAF responsibility and (iii) rice distribution as part of safety nets under MLSW.

Total around US$ 9 million in 2010/11

Budget transfers insignificant
PSE analysis suggests implicit ‘taxation’ of Laos rice producers in five out of six years
Trade restrictions and unpredictability imposing extra risks and costs which reflect in producer prices
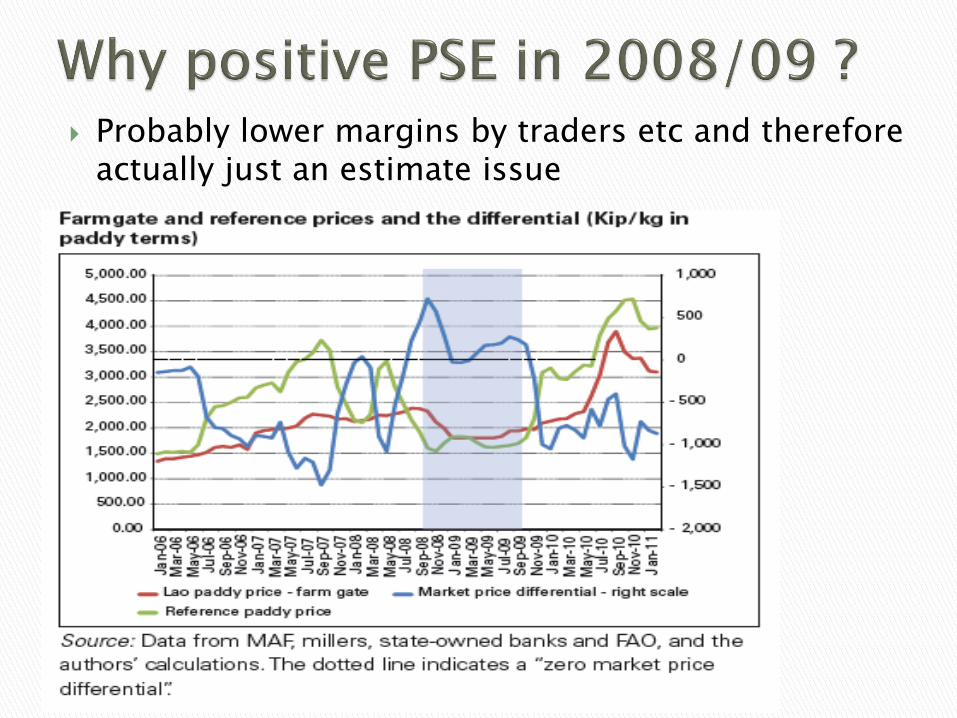
Probably lower margins by traders etc and therefore actually just an estimate issue

3 scenarios for production and demographic trends for 2013 to 2015 (base case, low case and high case) – 9 simulation runs
3 types of farmers (A, B, C)
5 investment options for each farmer type
Helps to analyze trade-offs between different public investment options and Government targets

Baseline demographic trends assume declining pop growth rates, slow growth in urbanization and marginal decline in per capita rice consumption
Paddy production will increase at annual rate of 3% even under base case, but is expected to fall short of 4.2 mill. ton target
Yet, exportable surpluses are expected to increase to respectable levels

Five public investment options have been considered to create investment scenarios (3 extension and 2 irrigation) ◦ Option 1 - Adoption of R3 seed
◦ Option 2 - Introduction of improved fertilizer use
◦ Option 3 – Introduction of best practice package (improved seed + fertilizer + extension)
◦ Option 4 - Rehabilitation of existing irrigation infrastructure in dry season paddy areas along with extension support
◦ Option 5 - Development of new irrigation infrastructure in wet season paddy areas along with extension support.

Best Practice extension package has highest efficiency of public spending
New irrigation infrastructure provides highest volume of paddy per hectare but has lowest incremental paddy production per dollar spent
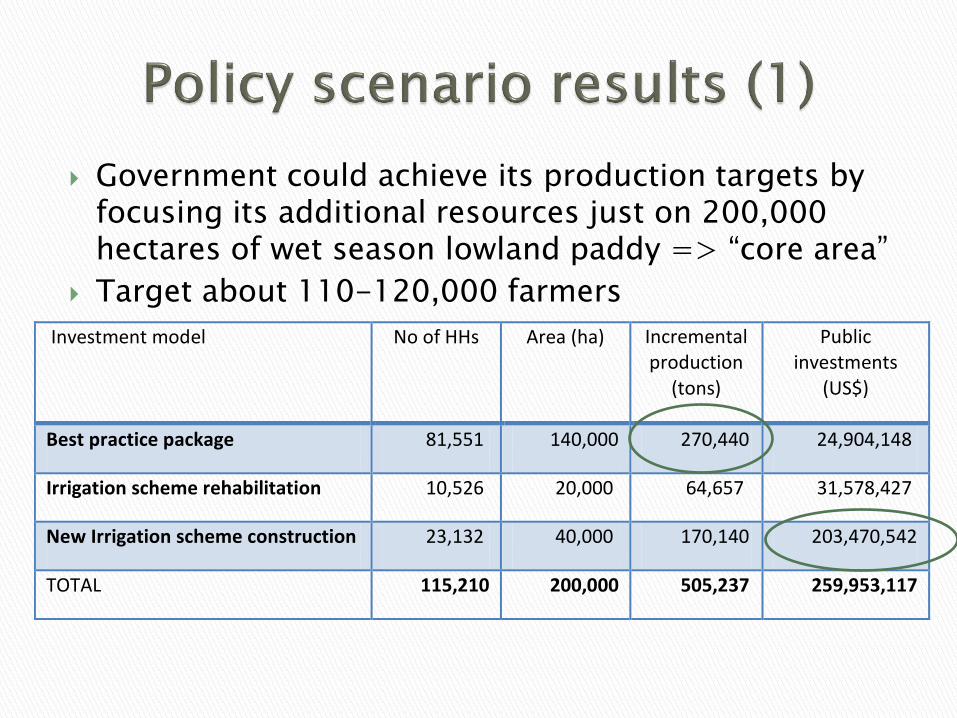
Government could achieve its production targets by focusing its additional resources just on 200,000 hectares of wet season lowland paddy => “core area”
Target about 110-120,000 farmers
Investment model No of HHs Area (ha) Incremental production
(tons)
Public investments
(US$)
Best practice package 81,551 140,000 270,440 24,904,148
Irrigation scheme rehabilitation 10,526 20,000 64,657 31,578,427
New Irrigation scheme construction 23,132 40,000 170,140 203,470,542
TOTAL 115,210 200,000 505,237 259,953,117
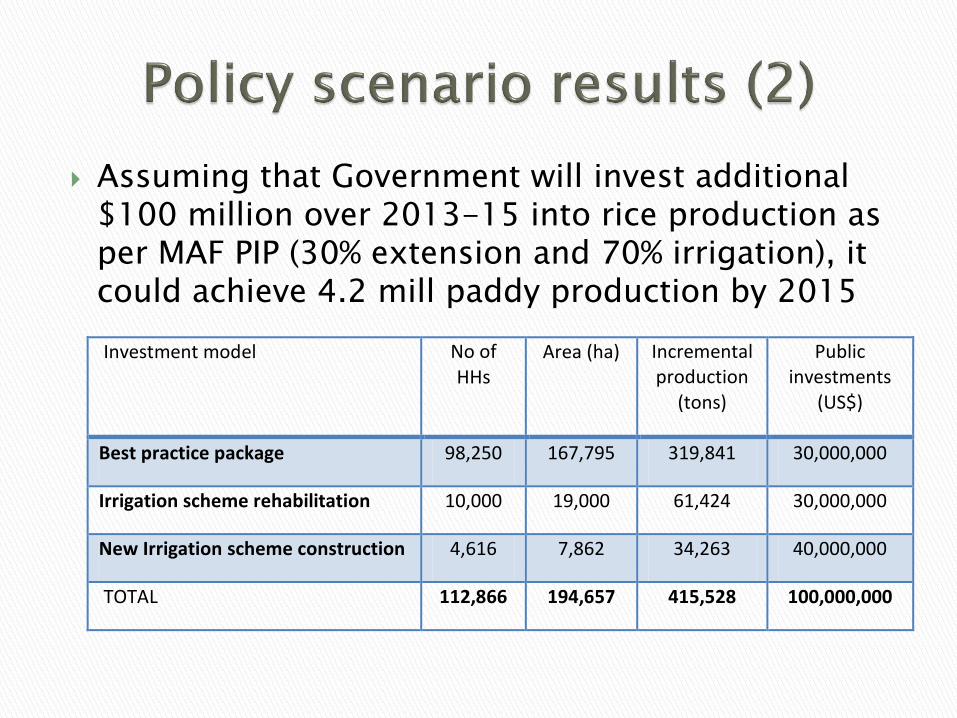
Assuming that Government will invest additional $100 million over 2013-15 into rice production as per MAF PIP (30% extension and 70% irrigation), it could achieve 4.2 mill paddy production by 2015
Investment model No of
HHs Area (ha) Incremental
production (tons)
Public investments
(US$)
Best practice package 98,250 167,795 319,841 30,000,000
Irrigation scheme rehabilitation 10,000 19,000 61,424 30,000,000
New Irrigation scheme construction 4,616 7,862 34,263 40,000,000
TOTAL 112,866 194,657 415,528 100,000,000

Geographical focus on development of 7 Plains
Largest incremental gains could be achieved by focusing on Type B farmers in lowland WS areas => largest concentration of such farmers is in 7 Plains
Developing viable seed sector is a key for achieving paddy production targets => introduction of R3 seed counts for 60-80 % of incremental paddy production
Need to consider farmers’ incentives => farmers respond to Government investments only if prices are at levels which provide attractive return
Trade policies, if not changed, could undermine effectiveness of public investments in rice sector.


Increasing per capita incomes, urbanization and lower population growth
Rice availability no longer problem at national level
Food security improvements require addressing malnutrition and specific locations/ target groups => remote areas and urban poor (affordability)
Returns to labor of rice farmers with growing competition from non-ag sectors and alternative crops

Apparent conflict between Government food security goals and farmer incentives
Trade may be single most important factor for achieving Government production goals
Current trade policies may undermine effectiveness of public investments
Need for more balanced public investments between extension/technology transfer and irrigation
Other public investment support for seed production, post-harvest losses, credit, development of national rice standards
Transparent and predictable export policy ◦ Abolish export bans for milled rice
◦ Allow informal exports of paddy
◦ Establish prudent coordination mechanisms between MoIC and MAF
Additional policy options what could be considered: ◦ Variable export tariff for price stabilization
◦ Index insurance could help stabilize against quantity fluctuations
Establish better information base on production, consumption, and trade flows
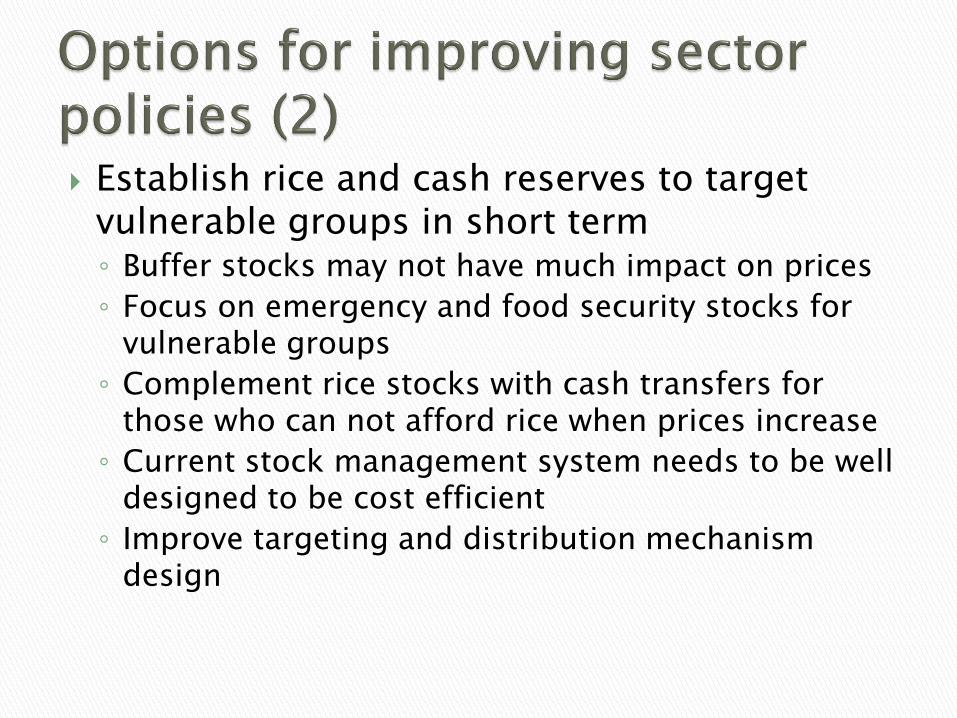
Establish rice and cash reserves to target vulnerable groups in short term ◦ Buffer stocks may not have much impact on prices
◦ Focus on emergency and food security stocks for vulnerable groups
◦ Complement rice stocks with cash transfers for those who can not afford rice when prices increase
◦ Current stock management system needs to be well designed to be cost efficient
◦ Improve targeting and distribution mechanism design

The simulation analysis demonstrates that there are options for improved efficiency of public spending ◦ Balance investments between extension and
irrigation infrastructure
Establish foundation for sustainable development of seed sector ◦ Seed sector key for productivity growth

Need for improved data ◦ Consumption data, nutrition
◦ Farm level (prices, wages)
Much can be done with HH surveys ◦ Demand trends
◦ Political economy considerations
Rice food balances
Combining PSE and value chain analysis
Policy analysis should go beyond PER

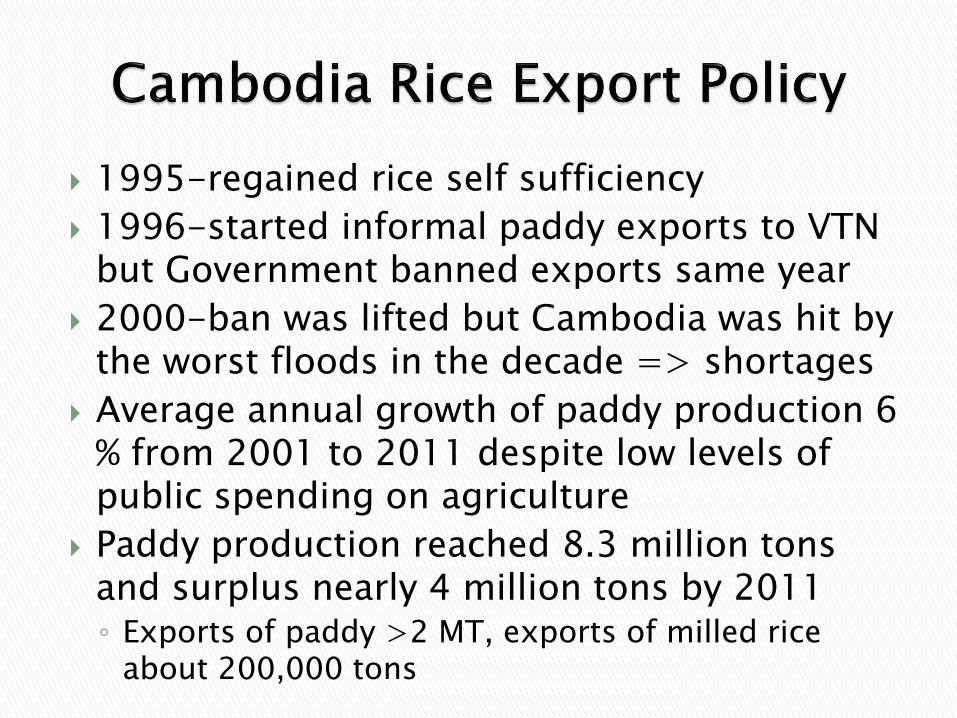
1995-regained rice self sufficiency
1996-started informal paddy exports to VTN but Government banned exports same year
2000-ban was lifted but Cambodia was hit by the worst floods in the decade => shortages
Average annual growth of paddy production 6 % from 2001 to 2011 despite low levels of public spending on agriculture
Paddy production reached 8.3 million tons and surplus nearly 4 million tons by 2011 ◦ Exports of paddy >2 MT, exports of milled rice
about 200,000 tons
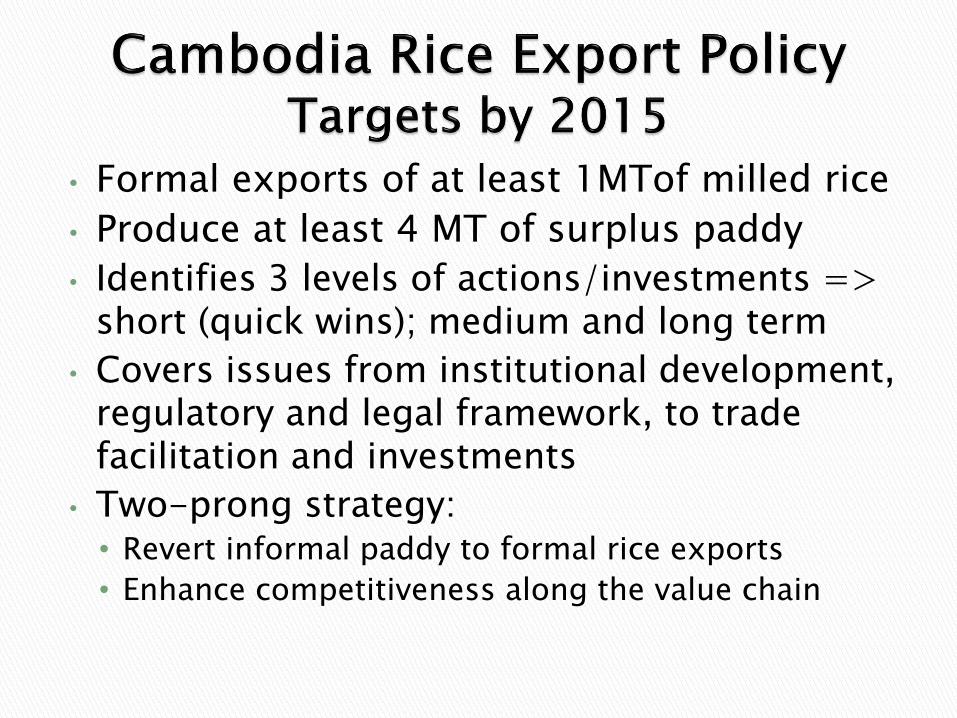
• Formal exports of at least 1MTof milled rice
• Produce at least 4 MT of surplus paddy
• Identifies 3 levels of actions/investments => short (quick wins); medium and long term
• Covers issues from institutional development, regulatory and legal framework, to trade facilitation and investments
• Two-prong strategy: • Revert informal paddy to formal rice exports
• Enhance competitiveness along the value chain
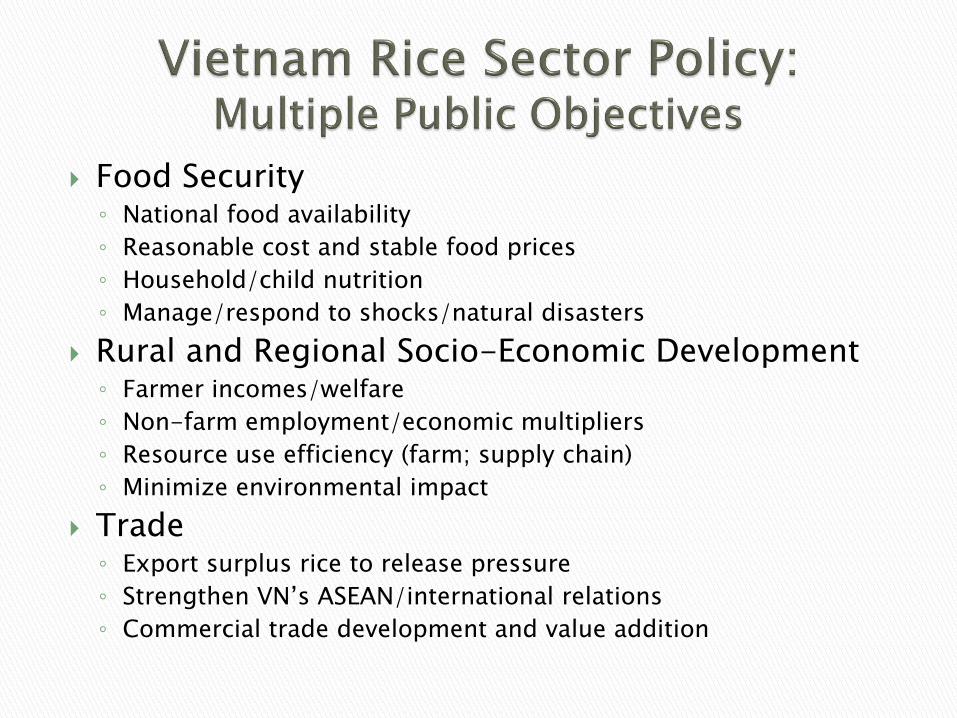
Food Security ◦ National food availability
◦ Reasonable cost and stable food prices
◦ Household/child nutrition
◦ Manage/respond to shocks/natural disasters
Rural and Regional Socio-Economic Development ◦ Farmer incomes/welfare
◦ Non-farm employment/economic multipliers
◦ Resource use efficiency (farm; supply chain)
◦ Minimize environmental impact
Trade ◦ Export surplus rice to release pressure
◦ Strengthen VN’s ASEAN/international relations
◦ Commercial trade development and value addition
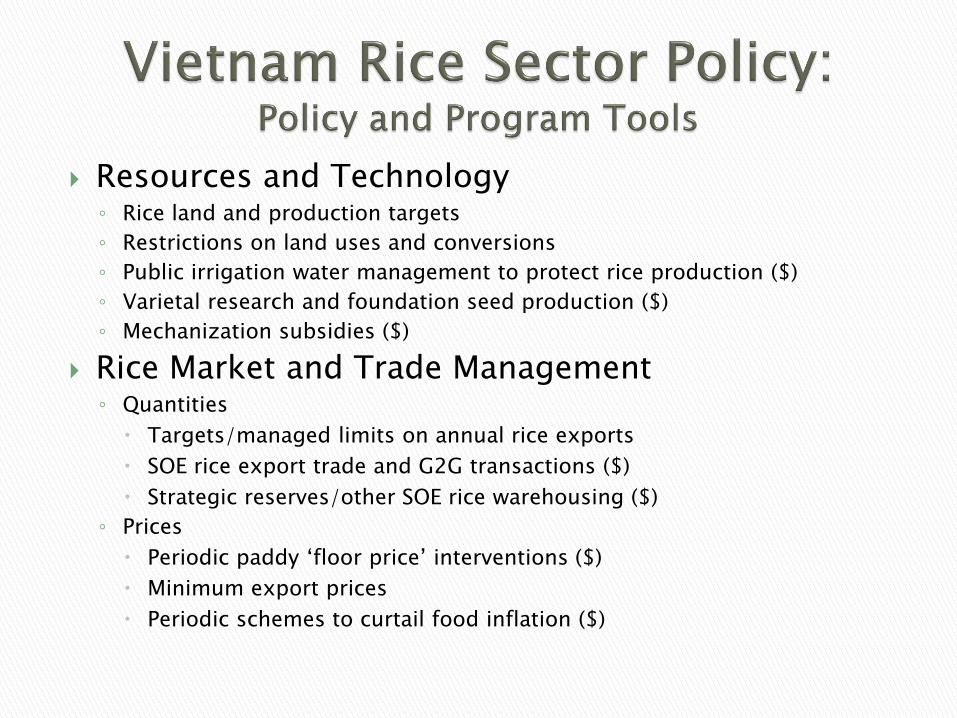
Resources and Technology ◦ Rice land and production targets
◦ Restrictions on land uses and conversions
◦ Public irrigation water management to protect rice production ($)
◦ Varietal research and foundation seed production ($)
◦ Mechanization subsidies ($)
Rice Market and Trade Management ◦ Quantities
Targets/managed limits on annual rice exports
SOE rice export trade and G2G transactions ($)
Strategic reserves/other SOE rice warehousing ($)
◦ Prices
Periodic paddy ‘floor price’ interventions ($)
Minimum export prices
Periodic schemes to curtail food inflation ($)

Original goal to allow farmers to better time rice sales and thus increase their income ◦ Farmers take low-interest loans from BAAC which is
used as collateral valued at market prices
◦ Farmers store paddy with participating rice millers and use receipts to obtain loans from BAAC
Over time program was transformed into price support scheme ◦ Since 2001 Government increased pledging prices
above market prices => increasing loan defaults
New Government increased pledging price ◦ THB15,000/t for white rice and THB20,000/ton for
Jasmine rice => 50-60% above market prices

12.5 MT of rice in government storage facilities -well over amount that Thailand exports normally ◦ Per ton purchase price of Thai rice is almost $200
above equivalent Indian or Vietnamese rice.
Potential budgetary loss close to 5% of GDP ◦ Government talks about imposing production quotas to
minimize fiscal losses
Less than a fifth of the subsidy is estimated to reach poor farmers ◦ Most goes to millers and large farmers
Thai exporters losing reputation for reliability ◦ Decline in Thailand’s share in global rice market


