90


BRITISH GEOLOGICAL SURVEY
TECHNICAL REPORT WC/92/69
Overseas Geology Series
TECHNICAL REPORT WC/92/69
STUDIES OF SOIL, SOIL GAS AM) VEGETATION GEOCHEMISTRY IN EXPLORATION FOR BURIED
ORE DEPOSITS, BOTSWANA
BY
J FUDGWAY AND T K BALL
Cover Photograph: Top - general view of project area; Bottom left - vegebtion sampling; Bottom right - using the ORSAT gas analyser to determine CO,
This report was prepared for the Overseas Development Administration
Bibliographic Reference
Author, J Ridgway & T K Ball Studies of Soil, Soil Gas and Vegetation Geochemistry in Exploration for Buried Ore Deposits, Botswana British Geological Survey Technical Reporf WC/92/69
NERC Copyright 1992
Keyworth, Nottingham - British Geological Survey

CONTENTS
INTRODUCTION . . . . . . . . . . . . . . . . . . . . . . . . . . . . . 1 Project Objectives . . . . . . . . . . . . . . . . . . . . 1
S T U D Y M A . . . . . . . . . . . . . . . . . . . . . . . . . . . . . . 1
GEOLOGY AND MINERALISATION . . 0 . . 2
THESAMPLINGPROCRAMME . . . 0 s . . 2 The May.June. 1988 Sampling . . . . . . . . . . . . . . . . . . . . 3 The 0ctober.November. 1989 Sampling . . . . . . . . . . . . . . . 3
LABORATORY ANALYSIS . . . . . . . . . . . . . . . . . . . . . . . . . . 4
SUMMARYOFRESULTS . . e . e . . . 5 The 1988Programme . . . . . . . . . . . . . . . . . . . . . . . 5 The 1989 Programme . . . . . . . . . . . . . . . . . . . . . . . 8
SUMMARY AND DISCUSSION . . . . . . . . . . . . . . . . . . . . . . . . 11 Soils . . . . . . . . . . . . . . . . . . . . . . . . . . . . . . 11 Vegetation . . . . . . . . . . . . . . . . . . . . . . . . . . . 11 Gases . . . . . . . . . . . . . . . . . . . . . . . . . . . . . . 12 Microbial methods . . . . . . . . . . . . . . . . . . . . . . . . 13
CONCLUSIONS . . . . . . . . . . . . . . . . . . . . . . . . . . . . . . 13 REFERENCES . . . . . . . . . . . . . . . . . . . . . . . . . . . . . . 14
PIGUIiES . . . . . . . . . . . . . . . . . . . . . . . . . . . . . . . . . 16 APPENDIX 1
Bacillus cereuw and Soil Geochemical Results from Soil Traverses. Botswana. Africa. by Dr Nancy L . Pardhun
APPENDIX 2
ANALYTICAL DATA

INTRODUCTION
This document is the final technical report on Project 8 9 / 7 "Cas and vegetation geochemistry in the search for buried ore deposits", carried out on behalf of the Britiah Government's Overseas Development Administration (ODA) under the ODA/BCS Programme of Research and Development in Developing Countries. It describes a study, sumarised in Ridgway (1991), of the efficiency of soil, soil gas, vegetation and microbial methods in detecting a buried ore deposit in the semi-arid terrain of northwestern Botswana.
Project Objectives
Ore deposits which are hidden beneath a thick blanket of overburden are extremely difficult to detect using the standard exploration techniques of soil and stream sediment geochemistry. Soil gaa and vegetation geochemietry offer possible solutions to this problem, particularly in arid and semi-arid climatic regions where gas release i8 not hampered by saturated soil and plant roots penetrate deeply to reach the water-table. The potential usefulnees of biogeochemistry and microbial techniques in arid region mineral exploration h a s been indicated by Col8 and Le Roex (1978) and Parduhn et a l . (1985) respectively. The project objective6 were to compare the efficiency of gas, vegetation and microbial methods with normal soil geochemistry exploration techniques over a known buried ore body.
STUDY AREA
In the mid-1970's a atratabound copper deposit near Lake N g a m i in northweetern Botswana was investigated by Essex Minerals, a subsidiary company of U . S . Steel. Numerous diamond drill holes were put down in the area where the ore body dieappeared under a varying thickness of overburden, thus providing detailed records of the depth to mineralisation beneath the cover. A visit to t h e region in 1984 by W.C.G. Clarke and D.T. Aldise (Clarke, 1984) Confirmed that access to, and identification of, the drill sites was relatively easy and the vicinity of Tale Pan was therefore considered to provide an ideal atudy site (Pig. 1).
Sparse thorn scrub vegetation is typical of this part of the Kalahari Desert which lacks permanent surface water and has a semi-arid climate. The average annual rainfall, falling mainly between November and April, is approximately 460 mm at Maun, the administrative centre of t h e region. Prom O c t o b e r t o March the mean daily maximum temperature is 30-33°C and the minimum 15-18"C. In midwinter (June and July) the mean daily maxhum fall8 to 23°C and the minimum to 3OC. Frost@ occur about ten times per year (Clarke, 1984). Apart from
1

cattle tearing there is little agricultural activity in the region and there are no settlements within the project area.
GEOLOGY AND MINERALISATION
The area lies within the late Proterozoic, ENE-WSW trending Ghanzi-Chobe Mobile Belt. This belt consist6 of a thick (5-10 km) sequence of claetic sediment8 and acid volcanics which have been affected by greenachiat faciee metamorphism and are tightly folded, often along eub-horizontal axes. A
calcareous argillite, several metres thick and carrying baee metal mineralisation with associated silver, is the main ore horizon. In the study area this horizon forms part of the steeply-dipping northwestern limb of an anticline, which plunges gently to the northeast beneath a variable, but generally increasing, thickness of overburden. The mineralisation within the argillite typically takes the form of stringers and blebs of chalcocite, bornite and chalcopyrite grading approximately 1% Cu over a thickness of about 4 m. The hanging wall is an argillite with disseminated secondary Cu minerals and the footwall is a barren sandstone (Clarke, 1984).
Over most of the proven strike length the mineralisation has only a relatively thin soil cover but in the area studied it is largely overlain by varying thicknesses of unconsolidated sands, locally with calcrete and fossil dunes. These sands, of presumed aeolian origin, form part of the Late Tertiary- Quaternary Kalahari group.
The mineralisation is extensively oxidised to at least 30 m below the present and sub-sand surface, although sulphides are still recorded at this depth (Essex Minerals Open File Report6 1974-1976).
THE SAMPLING PROGRAMME
A cut line, cleared for the original drilling and sampling programme, runs parallel and very close to the surface or sub-surface outcrop of the ore horizon and provided an easy means of access to the area of interest. Using information from company reports and map6 it was possible to locate, precisely or approximately, the sites of six diamond drill holes. Sampling was carried out along traverses at right-angles to the cut line t o include these drill sites. Six traverses, spaced over 13.5 kms of strike length of the mineralised horizon and varying in length from 30 to 250 m, were sampled (Fig. 2). On the basis of the size of geochemical soil anomaly found during t h e initial company investigation, sample spacing6 along the traversee were set at 20 or 25 m except in the case of the shortest traverse, adjacent to near eurface
2

mineralieation, where a 10 rn interval w a 8 used.
TWO separate sampling exercises were carried out, chiefly to examine the poe6ibLe seasonal effect8 of variable Soil moisture on the amount6 of evolved soil gas (Ball et al., 1983; 1990). The firet, in Hay-June, 1980, was
conducted at the beginning of the winter dry period after a wetter than normal rainy season. The second, in October-NOvember, 1989, took place at the end of the dry season just before the onset of the rains.
The May-June, 1900 Sampling
A t each sample site a hole, 30-40 cm deep, was dug and t w o Kraft paper bags and one emall securitainer of soil collected, the former for normal geochemical studies and the latter for degasaing and soil gas analyeis.
The gae spike was driven into the ground from the bottom of each hole to give a total penetration at the tip of approximately 1 m. On the spot analyees of the radon, thoron and carbon dioxide contents of the soil gases were then carried out (Ball et 1983; 1985; 1990)* On the shorteet traverse (No. 6, 30 m ) this was the only form of sampling and analysis performed.
A survey of the vegetation on the five longest traverses showed that no single specie6 of tree or shrub was present near every sample site. The moat coaraonly present family was that of t h e acacias, with small bushee of straight-thorned varieties being found close to almoet every location. Mature trees were abundant only on Traverse 1. Composite samples of twigs and leaves from several straight-thorned acacia trees or shrubs around the a m p l e site were therefore collected and enough material to fill a 25 x 35 cm, 125 micron thick, polythene bag taken.
The soil was slightly damp at the time of sampling and both the vegetation and the Kraft baga of soil were dried in the sun after collection. The vegetation samples were separated into leaves and twigs and repacked i n t o Kraft paper bags after drying.
The Octobor-November, 1989 Sarpling
The 1989 sampling w a s carried out using eitee as close to the 1988 locations as compaes and tape measurement would allow, although the original holes could not be recognised. In response to the results from the 1988 programme, the sampling methodology was changed in detail and in addition, damage in traneit to the Orsat gas apparatus meant that carbon dioxide could not be meaaured using this technique.
Soil samples were collected in the same manner a6 i n 1988 but some traverse lines were extended and additional eamplea were taken for microbial analyaia
3

to see if this innovative methodology (Watteraon, 1985) could be used in the Botswanan environment.
Gae earnplea were extracted from the soils using a gas spike in a similar manner to that employed in 1988, but although radon and thoron were meaaured as in the earlier exercise other gasee were sampled differently. Arsine (ASH,), carbon dioxide (CO,), carbon disulphide (CS,) , chlorine (Cl), dimethyl sulphide ((H,C);S) and mercaptan (CH,SH) were all measured in s i t u using Draeger tubes. Mercury w a s collected on silver coile; and molecular eievee ( S A
and 1 3 X ) were employed to collect sulphur speciee. In the latter two caaes 2 litres of soil gas were passed over the coils or through the sieves, which were contained in glass tubes plugged at each end by glass wool. Both before and after sampling the tubes were kept in airtight securitainere to avoid absorbtion of gases during traneit and were also packed in self-sealing polythene bags for transport to the laboratory. A breakdown in the gas pump, probably because of the amount of sand and dust suspended in the soil gases, meant that not all the traverses were covered by Hg and molecular sieve sampling and may also have affectea the Draeger tube measurements. Subsequent comparison of Draeger tube and Orsat measurements of CO, over the Coed y Brenin Cu deposit in North Wales yielded very similar results.
Few leaves were present on the acacia bushes and trees and sampling was confined to twigs from mature trees on traverse 1 to see if a more uniform sample type would be more effective than the compoeite samples collected in 1988. It was not feasible to sample in exactly the same locations ae in 1988 and the traverse line was also extended further into the foot-wall region.
LABORATORY ANALYSIS
All soil samples were air-dried, sieved and the <125 micron fraction retained for analyeie. Soil samples from the 1988 collections were analysed using X-ray fluorescence (XRF) methods for As, Br, Cl, F, I, S, Sb, Se, Th, and U, and by atomic absorption/inductively coupled plasma emission apectroscopy (AAS/ICPES) after a nitric acid attack for Ag, Bi, Ca, Cd, CO, Cu, Fe, Xn, Ho, Nf, Pb, and Zn. Because of the low levels found for many of these elements the soil samples collected in 1989 were analysed using the AAS/ICPES method for a much reduced element suite, consisting of Ca, Cu, Fe, Mn, Pb and Zn,
Vegetation samples were dry-ashed before analyeie. The weight of ashed material from the 1988 sampling was too emall to permit analyeFe by JCRF and was therefore analysed only by AASIICPES for the same element suite ae determined on the soils. The 1989 samples yielded a greater weight of ash and were analyaed by XRF for Ag, A s , B i , Ca, Cu, Fe, Mn, MO, Ni, Pb, S, Sb, Sr, Th, U and Zn; a range of elements which included all of those ahowing
4

significant variation in the 1988 data plus aome additional ones.
Soil samples from the 1988 collection and molecular eievee from the 1989 programme were degassed by heating and the evolved gases analysed for eulphur specie8 using a gaa chromatograph equipped with a flame photometric detector configured for the specific detection of sulphur compounds. The laboratory techniques employed in these measurements are described in more detail in Ball et a l . (1985). For mercury determinations the eilver coils were waehed in distilled water and dried using acetone followed by a stream of compreeed air. Each coil was then heated to 22OOC in a small resistance furnace and the mercury determined by flamelees AAS after fluehing with argon. No sulphur species were detected in any of the 1988 smplee.
SUMMARY OF RESULTS
Using data from diamond drilling and surface geology/geochemistry, gathered by Essex Minerals in the course of detailed exploration work, croes sections predicting the depth and sub-outcrop position of the ore body were constructed for each of the 6 traverse lines sampled during this study. Depths to the ore body varied from 1-2 m through 12, 40 and 4 5 m to 90 m ( P i g . 2 ) .
The 1988 Programme
Traverse 1
Two drill holes originated on this traverae line, one of which intereected the ore horizon. The surface location of the mineralisation, as revealed by trenching (Essex Minerals), lies between 160 and 165 m from the start of the traverse beneath approximately 1 m of sand and rubble. Figure 3 shows the geological situation and dlB0 the analytical data for Boils, leaves and twigs from the 1988 collection exercise.
Soils There is a well-defined Cu anomaly above the mineralised zone, with an apparently sharp cut-off in the foot-wall and a more gradual decline in the hanging-wall. An anomaly is also present in the Mn data but other elernenta do not show patterns which can be related easily to the position of the ore body.
Vegeta t i o n Leaves: Only Cu shows a pronounced peak over the sub-outcrop of t h e mineralised horizon. There are p e a k s in the traces for other elements but they do not seem to be directly associated with the mineralisation. w i g s : There is a broad Zn p e a k over the hanging-wall and Cu values decrease
5

into the hanging-wall region away from the ore horizon. The Cu values, however, reach a maximum over the foot-wall sandstone. Other elements exhibit .IO obv~ous association with the mineralieation.
The patterns of variation in leaves and twigs are Often similar (e.g. Si, Ca, Fe and Mn) but do not seem to bear any simple relationship to soil chemistry (e.g. Bi, Fe and Hn).
Gases
Gas measurements for the 1988 eampling programme are ehown in Figure 4. There is a well-defined peak in COz values over the poeition of the ore body and a less pronounced peak in Tn. Radon and 0, do not have p e a k s related to the mineralisation.
Traverse 2
The sub-outcrop of the ore here is buried under approximately 45 m of sand and calcrete (Pig. 5) and the exact position of the mineralisation is thus more difficult to predict than in the case of Traverse 1.
Soils Copper shows a subdued anomaly above the predicted subsurface position of the ore zone but possibly slightly displaced into the hanging-wall. The actual values are much less than those found on Traverse 1. Of the other elements only Pb, with a broad hanging-wall zone of relatively high values, shows any obvious relationship to the mineralisation (Fig. 5).
Vegetation L e a v e s : Broad zones of relatively high, although variable, values of both CU and Pb are found over the hanging-wall region but patterns for other elements are less easily discernable (Fig. 5 ) .
Tuigs: There is a rapid rise in Cu level6 on passing from the foot-wall into t h e hanging-wall which is matched to some extent in the patterns for MO, Ni, Zn and possibly Pb. Three Bi values (out of 10) of 5 ppm also occur in the hanging-wall zone (Pig. 5).
Gases Radon, Tn and CO2 values show no direct association with the position of the ore horizon although the highest levels of both Rn and Tn were measured over the hanging-wall ( P i g 6).
6

Traverra 3
The overburden here is approximately 40 m of sand and calcrete (Fig. 7).
Soils
Copper, Fe, Pb and Zn are all generally higher above the hanging-wall region than above the foot-wall, but valuee are lower than those encountered in Traverse 1 and similar to Traverse 2 levels. Small peaks in en and posBibly Cu indicate the position of the sub-outcrop Of the ore horizon. Lead reaches a peak some 75 m into the hanging-wall region and Fe at approximately 25 m (Fig. 7).
Vegetation Leaves: Although there is a peak in Cu values over the sub-outcrop of the mineralisation the highest value occurs over 100 m into the hanging-wall. No particularly obvious patterns are found in the data for other elements (Fig, 7). The highest Ni values are found over the foot-wall zone. Twigs: As with leaves patterns which can be unequivocally related to the position of the buried ore body are difficult to discern (Fig. 7).
Gases There are peaks in t h e CO2 and Tn patterns Over the position of the main mineralisation but the highest value of the former occurs further into the hanging-wall region. A p e a k in Rn values is displaced into the hanging-wall (Fig. 8).
Traverse 4
Traverse 4 was over the thickest overburden encountered in the study. Drilling data indicate about 12 m of sand and calcrete underlain by an 80 rn thick sequence of coarse sands, thought to repreeent a fossil dune (Fig. 9).
Soils There are broad, although subdued, peake in Cu, Fe, Mn, Ni, Pb and 2n over the estimated sub-surface position of the ore horizon For Fe, Mn, Ni and Zn the highest values occur on the hanging wall side of the mineralisation, whereas with Pb there are high valuee in both hanging and foot-walla (Fig. 9).
Vegetation L e a v e s : The data are variable and no obvious associations with the sub-outcrop position of the ore body can be seen (Fig. 9). Twigs: The highest Cu value corresponde with the estimated position of the ore horizon but the significance of this ie unclear because high values also occur in the foot-wall region. Other elemente show no clear relationship to the sub- outcrop of the mineralisation (Fig. 9).
7

Gases profiles for Rn, Tn and CO; are shown in Figure 10. Radon shows a broad hump, but not the highest values, over the site of the sub-outcrop of the ore. The response of the other two gasee does not appear to be influenced by the ore body.
only 12-15 m of sand and minor calcrete overlie the ore horizon on Traverse 5 (Fig. 11).
Soils The highest Cu, Fe, Ni, Pb and Zn values all occur over the hanging-wall but, despite the relatively thin overburden, do not seem to be directly associated with the mineralisation (Fig. 11).
Vegetation Leaves: The highest Cu, Ni and Zn values are found in the hanging-wall regton, within 50 m of the estimated sub-outcrop position of the ore horizon. A single high Pb value over the hanging-wall is over 75 m away (Pig. 11). T w i g s : Pattern8 of variation in Cu, NF and Zn are similar to those in leaves b u t with Pb, there is a peak over the sub-surface location of the ore body (Fig. 11).
Gases
There is a pronounced peak above the main mineralised zone in the CO, profile and a more subdued high for an. Thoron shows a marked low over the ore body but a broad high over the hanging-wall reg ion (Fig. 12).
Traveree 6
The mineralised horizon reaches the surface on Traverse 6 and is covered by only a thin layer of sandy soil. Soil gas measurements, over a short traverse of 30 m, were the only form of sampling carried out here ( P i g . 13).
Gases Carbon dioxide and Tn both give peak measurements at 15 m into the hanging- wall region but radon shows no discernable relationship to the position of the mineralisation (Fig. 14).
The 1989 Programme
soils The chief purpose of the 1989 sampling was to examine the passibility of there being seasonal variations in soil gas levels but chemical analyse6 of the soils were also carried out. Replicate splits of a selection of the 1988

samples were analysed with the 1989 material. Figure 1s compares the 1988 results with the replicate data f rom 1989. The Ca, CU and Mn plots ehow close agreement between the two data sets but Fe, Pb and Zn display some
discrepancies. In the cage of Pb the differences are systematic and may be due to a calibration error in one set of results. F o r Fe, the eituation appear8 to be more complicated, although most of the 1988 values are lower than those from the 1989 analyses. It i a possible that the crystalline form of Fe in the samples changing during storage, giving riee to a different response to the nitric acid dissolution procedure. There is no obvioue explanation for the variations in Zn data, but the discrepanciee are not as great as those for pb
and Fe. A T-test rejected the hypothesis that the 1988 and 1989 data for pb
and Fe came from the same population, but accepted the hypothesis for Zn.
Figures 16-20 show comparisons of result8 from the 1988 and 1989 sampling exercises. The data for Ca, Cu, Mn and to a lesser extent Zn can be compared with some confidence. If the f o r m of the Fe in the 1988 samples did change during storage, then the 88/89 comparisons for Fe may still be valid. With Pb, the 1988 data can be regarded as beina an underestimate.
only CU shows any sign of a systematic relationship between the two sets of data. With the exception of Traverse 1, Cu is generally lower in the 1989 samples but the patterns of variation along traverse lines remain similar. It ie difficult to discern any systematic changes in the patterns of variation for o t h e r elements but the differences between t h e 1988 and 1989 data are sufficient to suggest that there are significant seasonal variations in soil geochemistry. In Cu this leads to a diminution of the anomaly over the hanging-wall region in every transect except Traverse 1.
Vegetation Figure 21 shows comparative data on Ca, Cu, Fe, MO, Ni, Pb and Zn in twigs for the 1988 and 1989 collecting programmes. Unfortunately, because of a scarcity of aehed material from the 1988 sampling it w d 8 not possible to carry out replicate analyses to monitor the quality of the data. The patterns of variation in Cu, Ni, Pb and Zn show 80me similarities, despite the fact that it was not feasible to collect samples from exactly the same locations both years. A more pronounced hanging-wall Cu peak can be seen in the 1989 data than in that from 1988, but the position is reversed for Zn.
Data for the elements not determined on the 1988 samples, As, S and Sr, are shown in Figure 2 2 . There is a peak in the As pattern over the ore body but even higher values occur further in to the hanging-wall region near the cut line. Sulphur values are generally higher over the hanging-wall and Sr reaches a maximum over the minerali~ation.
9

Gases only Rn, Tn and CO: were determined on all 6 traversee. Comparative data for 1988 and 1989 are shown in Figure8 4, 6, 8, 10, 12 and 14. The moat obvious feature6 of the diagrams are the generally much higher valuee of Rn and Tn in the 1989 sampling and the correspondingly lower values of CO,. The pattern8 in the 1988 data have already been discussed. In the 1989 results CO, is uniformly low and gives no indication of the position of the eub-surface mineralisation. Radon and Tn both diaplay peaks in their traces but neither shows a very clear cut relationship to the ore body.
Mercury data are available only for Traverses 1 and 2 (F ige . 4 and 6) and in neither case is the position of the ore body unequivocally indicated. In Traverse 1, with an overburden thickness of 1-2 m, mecury showed a peak over the sub-outcropping poBition of the ore horizon, but gave even higher valuee at the western end of the traverse where only minor hanging wall mineralisation is thought to be present. In Traverse 2, where the overburden is approximately 45 m thick, the highest mercury value occurred above the ore body, but the general pattern Was erratic and values rose again at the western, unmineralized end of the traverse.
Mercaptan (CH,SH) was detected only on Traverse 6 where the overburden is very thin. A broad peak over the mineralisation is present in 1 3 X , but not in SA,
molecular sieve material.
Carbonyl sulphide ( C O S ) and carbon disulphide (CS?) data for Traverses 1, 3, 5 and 6 (overburden depths of 1, 40, 15 and 0.5 m respectively) are shown in Figures 4, 8, 12 and 14 and give very similar traces. The 1 3 X molecular sieve data show peaks which although generally associated with the location of the buried mineralisation are not consistent in relative position and do not correspond with the main Cu soil anomalies. The performance of the 5A sieve material is inferior to that of the 1 3 X for both gases, giving no indication of the ore body in Traverses 5 and 6. No systematic relationship between depth of burial of the ore and gas values is apparent.
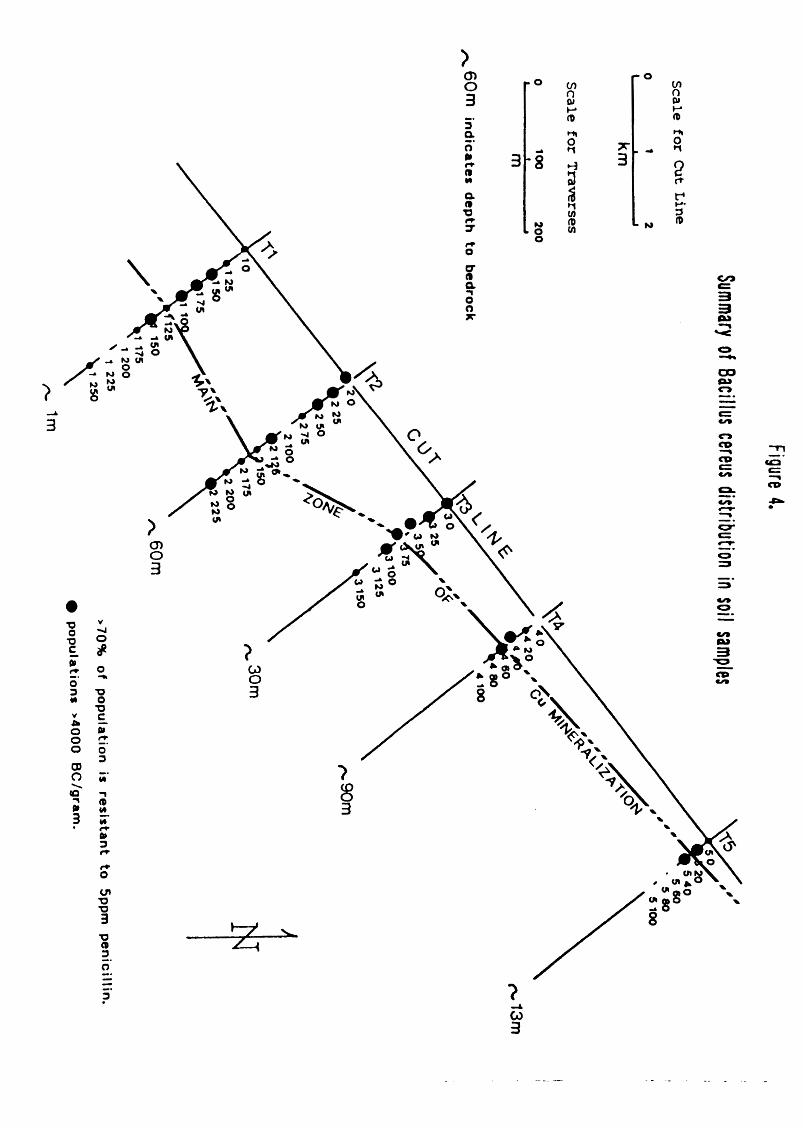
Xicrobial methods In arid zones of the western U.S.A. measurement of Bacillus cereus population concentrations in soils has proved useful in exploration for metalliferous mineralization (Parduhn et a l . , 1985; Watterson, 1985). Splits of soi l samples from the study area were therefore sent for bacteriological analyeis to Cereus Exploration Technologiea Inc. of Nevada. Appendix 1 is a report of their findings. With the exception of Traverse 2 (overburden thickness 45 m), where the pattern of B . cereus distribution was rather erratic, the results show that microbial methods are effective in indicating the position of buried mineralization. High population counts for 8 . cereus occurred over the hanging wall zone with a rapid decrease in the footwall. The thin ore horizon was not well delineated but a broad high over ita position in Traverse 4, where the
10

cover is 90 m thick, and a better delineation than that given by soil chemistry in Traverse 5 (15 m of overburden), indicates the potential of the method.
SUMMARY AND DISCUSSION
soils
Only cu showed any consistent relationehip to the position of the mineralized horizon. A well defined anomaly of almost 330 ppm Cu marked the position of the ore body where the cover was only 1-2 m thick. The maximum Cu concentration in the traverses where the cover ranged from 15-90 m was 60 ppm with a minimum value of 7 ppm. There were, however, broad highs in the Cu profiles over the position of the mineralization except where the cover was only 12 m thick. In this latter case the highest Cu values were displaced approximately 25 m into the hanging wall. The presence of weak soil anomalies over mineralisation buried beneath tens of metres of overburden has been attributed to hydromorphic tranaport or biological activity dependent upon high groundwater levels (Essex Minerals Open File Reporta, 197401976). The seasonal variations seen in the data from the samples collected at the beginning (1988) and end (1989) of the dry season support this view, the lower groundwater levels in 1989 leading to lower trace element concentrations in the soils.
Vegetation
Where the overburden was thinnest a clear Cu peak, coincident in position with the peak in soil Cu values, could be seen in the data for leaves, but in twiga collected in 1988 the highest Cu concentration occurred over the unmineralized sandetones in the foot-wall to the ore body. With the exception of Zn in twigs none of the other elements ehowed a direct relationship to the location of the mineralisation.
In the traverses where the ore horizon wae more deeply buried patterns of variation were generally inconsistent and direct relationships to the position of the mineralization difficult to discern. Element Concentrations in twigs and leaves often, but not always, varied fn a similar manner butthe patterns often bore no resemblance to patterns of variation in the SOFl8. Copper maintained the closest relationship, in both twigs and leaves, to the position of the mineralized unit.
The 1989 sampling, in which only the traverse with the thinnest overburden was etudied and an attempt was made to collect twig6 of consistant thickness, in general confirmed the previous findings. Copper showed a clear peak over the
11

hanging wall immediately above the ore bearing horizon and fell eharply over
the footwall region. Broad hanging wall haloes of high values were also found in As, Ni, s , Sr and 2n. The higheet levels of A s , Ni, S and Zn, however, occurred further into the hanging wall near the start of the traveree where they were accompanied by high MO and Pb concentrations. The significance of this i8 not clear but the high trace element levels may be related to a minor accumulation of the scattered sulphide mineralization known to occur above the ore horizon.
In the 1988 sampling the in s i t u measurement of radon (Rn), thoron (Tn) and CO, showed that CO2 and, to a lesser extent, Tn were effective in delineating the position of the ore horizon through depths of 1 m and 12 m of overburden and also gave some indication of its position when the thickneea was 40 m (Ball et a l . , 1990). In the 1989 sampling, at the end of the dry seaaon, CO, values were uniformly low and no patterns which could be related to the position of the buried mineralization could be discerned. Emissions of both Rn and Tn had increased, at least twofold and in most cases considerably more, but there were no obvious relationehipe to the position of the ore horizon. The differences in gas emissions between the t w o sampling exercises are most probably related to the degree of soil moisture. Hoist soils promote sulphide decomposition reactions which provide substantial inputs of CO2 to the soil atmosphere whilst at the same time inhibiting the flow of Rn and Tn. Conversely, dry conditions favour gas flow but inhibit decomposition.
Interpretation of the Tn distribution patterns presents a problem because of the very short half life (54.7 e ) of the gas. The maximum diffusion of the much longer-lived Rn in dry gravel has been shown by Tanner (1964) to be of the order of 10 m. It is therefore unlikely that anomalous levels of Tn in areas of thick overburden are derived directly from the mineralisation. Ball et a l . (1990) discuss this problem in more detail without reaching any firm conclusions. From a pragmatic viewpoint, however, the spatial association of Tn with the sub-outcrop of the ore horizon and the ease of determination in the field confirm the usefulness of this gas as a pathfinder.
Degassing of soil samples collected in 1988 and f i e l d measurements with Draeger t u b e s in 1989 gave no positive reeults for any of the sulphur species measured. Better results were obtained from the molecular sieve materials used in the 1989 sampling. Carbonyl sulphide (COS) and carbon disulphide (CS,) were the only gases positively identified but showed good correlation with the location of the orebody where the cover was thin (1-2 m ) , 12 m and 40 m thick. Above this thickness of overburden the gases were not be detected. The 1 3 X
molecular sieve material gave more coneietent results than the SA type, the latter sometimes showing peaks unrelated to mineralization. Although the results of the molecular sieve trials are encouraging their use for soil gas
12

measurements ha8 known probleme. In moist conditions the eieve material absorbs water vapour which reduces its efficiency in detecting other soil gases. At the end of the dry season in Botwana, however, soil gae moisture levels are likely to be vey low and the use of molecular sieves is appropriate. Molecular eieves can also exhibit catalytic properties because of their very high epecific eurface activities and this may result in changes in the nature of soil gas components after absorption. The high Concentrations of Cs2 in Borne samples in comparison with the relatively low values for other gas components may simply reflect the conversion of a wide spectrum of sulphur compounds to CS:.
Mercury was identified only in Traveree 1, with an overburden thickness of approximately 1 m, and Traverse 2, where the thickness is 45 m. The general pattern was erratic and gave no clear indication of the position of the buried ore horizon.
Microbial methods
Traverse 2 (overburden thickness 45 m) excepted, the results show that microbial methods can be effective in indicating the general position of buried mineralization. The thin ore body was not picked out very clearly and further work, with more samples taken over barren terrain would help establish the usefulnese of this technique.
CONCLUSIONS
of the four exploration techniques tested, soil geochemietry proved the most effective in consistently outlining the location of the buried ore body and in being easiest to collect and interpret, despite the presence of seasonal variations in some trace element concentrations.
Vegetation geochemistry yielded some useful data but the results were more difficult to interpret than those from conventional soil geochemistry and produced occasional high values which could not be related to known mineralization. These could be misleading in an exploration programae. Moreover, the vegetation samples were more difficult to collect and process than soil samples and were also influenced by seasonal factors.
Gas geochemiotry, too, was influenced by Sea8Onal factors, notably the moisture content of the soils, and was more difficult to interpret than the soil data. The chief advantage of using gas geochemistry lies in the ability to make in situ measurements and given the right conditions the method can provide useful data which will allow immediate decisions on the progrese of an exploration project to be made. Molecular sieves require degassing in the
13

laboratory thereby loeFng On@ of the advantages of gat3 meaeuremente but further work in more extreme desert conditions than those of NW Botewana might prove useful, particularly for regions with low water table8 and little biological activity to aid in the development of soil anomalies over buried mineralisation.
Draeger tubes have 80me advantages of the Orsat apparatus for CO2 measuremente in being more robust. They are, however, more expensive to u8e and the breakdown in efficiency of the Draeger gas pump mean8 that a method of monitoring the amount of gas pumped through the tubes, in addition to the simple counting of pump etrokee, as recommended by the manufacturers, is desirable.
Microbial methods depend on the metal content of the soils and may be effective in indicating the position of buried mineralisation. They have an advantage over soil geochemietry in being relatively cheap to carry Out, requiring only simple apparatus and conditione.
The Conclusion8 outlined above show that that the project objectives were largely achieved. The investigation of vegetation geochemietry was, of necessity, confined to a single tree species and it is poseible that in other areas different plants may yield more consietent and reliable data. Gas geochemistry and microbial methode have considerable potential as exploration tools in developing countries: both are relatively cheap in operation and can provide results quickly without the need for sophisticated laboratory facilities. This study focuesed on the detection of a narrow ore body within a wider zone of low-grade mineralisation and both techniques may be more suitable for the delineation of wider zone8 of low-grade mineralisation within generally barren hoet rocke. Not one of the techniques investigated was an unqualified success and the problem of detecting buried ore deposits remains unresolved.
REFERENCES
BALL T.K., NICHOLSON R . A . and PEACHEY D. 1983. Bffecte of meteorological variables on certian soil gases ueed to detect buried ore deposits. Trans. I n s t n W i n . Wetall.(Sect. 8: Appl. e a r t h sci.), 92, Bl83-190. BALL T.K., NICHOLSON R , A . and PEACHEY D. 1985. Gas geochemistry ae an aid to detection of buried mineral depoeite. T r a n s . Instn N h . Hetall . (Sect. B: A p p l . e a r t h sci.), 94, 8181-188. BALL T.K., CROW H . J . , LAFFOLEY N., PIPER D. and RIDCWAY J. 1990. Application of soil-gas geochemistry to mineral exploration in Africa. J. Geochem. E x p l o r . , 38, 103-115. CLARKE M.C.G. 1904. Feasibility study on possible U.K. involvement in mineral
1 4

exploration in the Kalahari, Botswana. Inst. Geol. Sci., Overseas D i v . R p t . , 04/4. COLE M.H. and LE ROEX H.D. 1978. The role of geobotany, biogeochemistry and geochemistry in mineral exploration in South West Africa and Botswana - a case history. Trans. geol. Soc. S . Afr., 81, 277-317. ESSEX MINERALS 1974-1976. open file report. lodged at the Geological Survey, Lobatse, Botswana. PARDUHN N.L., WATTERSON J . R . and SILBERXAN M . L . 1985. Distribution of Bacillus cereus spores in soil over four subsurface gold deposits: a Progress Report. Proc. Denver Region Explore Geol Soc. Symposium. April 1985, Denver, Colorado, p. 115-118. RIDCWAY 3. 1991. Gas and vegetation geochemietry in the search for buried ore deposits: Final report to the Overseas Development Administration. B r . Geol. S u r v . Tech. R e p t . WC/91/39, 7p. TANNER A . B . 1964. Radon migration in the ground: a review. In: The Natural Radiation Environment. University of Chicago, 161-190. WATTERSON J.R. 1985. A procedure for estimating Bacillus cereus spores in soil and stream sediment samples - 6 WtentFaA exploration technique. J. Geochem. E x p l o r . I 23, 243-252.
15

FIGURES
Figure 1: Location of the study area
Figure 2: Sketch map showing the position of Traverses 1-5 along t h e cut line, the area of sand cover and the location of the anticlinal axis in the bedrock to the southwest. Approximate depth8 of overburden are given in metree. Traverse lengths are not to ecale.
Figure 3: Geological cross section and 1988 geochemical profiles for twigs, leaves and soils on Traveree 1. Element concentrations are in ppm, except for Ca which is in b , and distances along the traverse in metres. Approximate position of t h e sub-outcrop of the ore body, shaded in t h e cross section, ie shown by the arrow.
Figure 4: Gas data for Traverse 1. Unit8 Of measurement are % for CO,,
arbitrary measurement units (e.g. peak area counts) for COS and CS2, nanograms ( I O - ~ 9 ) for Hg and Becquerels per litre for Rn and Tn. Distance6 along the traverse are in metres. Both 1988 and 1989 data are shown where appropriate. Molecular sieve and Hg (where shown) data are from 1989. Approximate position of the sub-outcrop of the ore body is shown by the arrow.
Figure 5 : Geological cross section and 1988 geochemical profiles for twigs, leaves and soils on Traverse 2. Other information as for Figure 3.
Figure 6: Gas data for Traverse 2. Other information as for Figure 4 .
Figure 7: Geological cross section and 1988 geochemical profiles for twigs, leaves and soils on Traverse 3. Other information ae for Figure 3.
Figure 8: Gas data for Traverse 3. Other information as for Figure 4.
Figure 9: Geological cross section and 1988 geochernical profiles for twigs, l e a v e s and soils on Traverse 4. Other information as for Figure 3.
Figure 10: Gas data for Traverse 4. Other information as for Figure 4 .
Figure 11: Geological cross section and 1988 geochemical profiles for twigs, leaves and soils on Traveree 5. Other information as for Figure 3.
Figure 12: Gas data for Traverse 5. Other information as for Figure 4 .
Figure 13: Geological cross-section for Traver8e 6. Ore horizon is shaded.
Figure 14: Ga8 data for Traverse 6. Other information a8 for Figure 4 .
16

Figure 15: Analytical data from 1988 compared with results on the same 20 samples analysed in 1989.
Figure 16: Comparison of 1988 and 1989 geochemical data for Traverse 1 soi.18. Distances along the traverse are in metree. The arrow marke the approximate position of the sub-outcrop of the ore body.
Figure 17: Comparison of 1988 and 1989 geochemical data for Traverse 2 soii8. Distances along the traverse are in metree. The arrow marke the approximate position of the sub-outcrop of the ore body.
Figure 18: Comparison of 1988 and 1989 geochemical data for Traverse 3 soile. Distances along the traverse are in metres. The arrow marks t h e approximate position of the sub-outcrop of the ore body.
Figure 19: Comparison of 1988 and 1989 geochemical data for Traverse 4 soils. Distances along the traverse are in metres. The arrow marks the approximate position of the sub-outcrop of the ore body.
Figure 20: Comparison of 1988 and 1989 geochemical data fo r Traverse 5 s o i l e . Distances along the traverse are in metres. The arrow mark8 the approximate position of the sub-outcrop of the ore body.
Figure 21: Comparison of data for twigs coLlected on Traverse 1 in 1988 and 1989. A r o w as in earlier diagrams.
Figure 2 2 : Data for As, S and Sr in twigs collected on Traverse 1 in 1989, Arrow as in earlier diagrams.
17


I
; NAMIBIA 20"s 1
I
* CHANZI AREA
BOTSWANA
ZIMBABWE
I QO"S 4
I
I
FRANC I S T M
-
I I
1 cp"
I
25"s

N + I
F i g u r e 2

0 0 0 0 0 0 0 0
3 ! X 6 1 f f Q i ; E i i
iiiiiii i
3
I
I
I
8 :
n a
Figure 3

, i f '. 2
? I
- : I
I
'lb /
/ /. U
F i g u r e 4

Travorar 1: Radon
A ,/
cr' 1 i
2 0 0 2 S O so 10 0 0
2 5 . 0 0
2 0 . 0 0
1s. 0 0
Distanca
Trarorse 1 thoron
R
. '. U/
\ .. a- ._I_-
10.00 p s.00 i 0 . 0 0 k
0
, t., 10.00 '.
s.00 i 0 . 0 0
0 so 100 110 i 2 0 0
0 i a I rnaa
t.,
2 0 0
0 Thoron89
- 2 S O
Figure 4

f
r-
,/ ' ,,' *g I
f ' P .
t - I I 1 I
I
Dl I I
1
i.. - - . . . . .
4 .
'1 i 5
(i t
5" t ;8
Figure 5

P I
a
m /‘
I - - ‘ -
0
d m
d 0
0
*
0
0
l i L
s a
I I
. /’ U \
, IJ
,/’ / a
m
/‘
[ I , , i I
\ _. L
I --- I
0 -
I
.1: 0
I -
8
‘, a
/
8 /
I
/*
. /’ \ I ‘.
/ ,’./
I 4 - - e a . . 0 0
* o 0 i
Figure 6

\ ! ir\ I
CO E -
/ ; i I
O d
I
1 I \
I A "
I
c N
I L I ,
i i
I
I t
1 b
/ '
-7 '---- if r------ -
t '
5 t
is
Figure 7

: 3 i i
8 2
e - 0 1
I ?. d
'1 f 8 ,
/ /'
/ /
8
I ,/' L f
1 - (b f s
8 1 ; ' I
I 1 : \
i \
\ Q L
'\
\ '\\ ~
\
b i
8 a
\
'\
a
8
I \
/ 8
f
1
8
\
8
a n
A /
8 /
Figure 8

1 4
L2 1 r-. r 'I\\/ '1 0
Figure 8

j
a1
I
! I
I
L I
(3
ii I !
----------I: . . <--
L
0 0 0 0 0 0 0 0 0 0 0 o ~ y o q q + l y o 2 8 8 ; ; k k 2 A 10 c; 3 c r r 0 0 0 0 0
I II 1i I*
I I
ii 1
\
I
i I
\I--- I t ; /
F i g u r e 9

0. 1
0 . 4 1
0 . 4
0.3s
0 . 3
a 0 . ) )
0 . a
e.1s
0 .
0 . 0 8
0 4
i a o
s
4 . s
4
3.S
1
a . s
a
1.1
A
0 . s
0
t
T
ao 4 0 I 6 0 8 0 100 l a 0
Figure 10

Li
s ii
F i g u r e 11

?raver80 S Radon
' = O O 1
( * 0 ° 1 /
h I-------- 1 . Radon08
Figure 12

res
Conjectured \ Fault
Traverse 6
F i g u r e 13

ia I a a
' a 2
8 - : I I
m T g ,/ 1
I I
P- O
/' =\ \
/
/ a QI / I ' ..
//
I ! I '
i ; j i
\
\
\
e b ' " a -
: : : : : : : - e d d
w ' 0 : z
' i ii 8 3 1 i
3 I
I /
I 9 I I
!I : I
I
a a \
\
\
Figure 14

4
0 s 10 15 2 0 i 2; 3 0
Trarmrro 6 Tboron
3 0 ” I 2 5
Bqu’L 2 0 1 4
0 s 10 is 2 0 2s 30
Di#t8DO@
Figure 14

1- 10 r4
I) rl
* 4
r? 4
: a 4
n 4
4 4
2 OI
- . c5
10
I)
*
t-------+----+ '.A- n
rl t-------+----+ _t__t_-
U
0 -4 -1
4 0 L
Figure 1 5

Pb Replicates
18 -i- I
16 t I
Ppm
4 0
35
30
2 5
P P 20
1s
10
5
0
Zn Replicates
T
I -c
!$ I I I
1 2 3 4 5 6 7 8 9 10 11 12 13 14 15 16 17 18 19 20
Figure 15

t 4
i 4
/' di '1
3 : : : : : : : : . . . . . . - # . I d e o * * *
8
3
,_ I i /'
.J'
I
8 7 \
m ? \
/-
/ /
3
I 9
'. \
F i g u r e 16

1 4
12
10
a
eem I
4
0
0
,A. \ '\ ,/'
Travorro a loll81 Pb
w / .- 0
A 1
______(
so 100 2 0 0
Di I taaeo
3 0 T
0 4 1 4
0 so 100 200 2 SO
D i 8 b B a @
2 SO
Figure 16

e : a
F I e .) L.
f 0
1 :
0
a
t. ,.' /' , / ,'
* /
Z ' R
i ; i i
I i : 1 I
1 + .
I
e T :
8 8
i ( ' b J-"m
I
F i g u r e 17

1 4 I
1 2 1 I I
,P "
\
\
2 s
2 0
I
2 .
Trav.rro 2 8oils: Za
c i '\
.
Figure 17

d I / I
5 i
e- : '. 3
I * : J a
I
I
t : 3
+ : I \ '
0
I ' 1 :
1 3 j
Figure 18


Pb 88
0 Ob 09
12
10
8
PPI 4
4
2
0
b 1 4
0 1 0 4 0 60 8 0 100 120 1 4 0 1 4 0
F i g u r e 18

8 s d
7
* ’ f
’ - : i
8 - I
i I
,.8 T
--- a :
1 4 I :. 2 ,
8 \
r m
‘ i ,,* :
, I
/ ‘, I
*. r T
a
e ‘a t=
d
Figure 19

2 i I I
l T
4 0 8 0 100 1 2 0 0 2 0
12
10
8
PP' ' I
4
a
0
Iravorro 4 80il.r t o
/ I
/
/
\
'\,
\ El
-____If- 4 i
0 2 0 6 0 8 0 100 12 0
Diatanoo
Figure 19

0
0
r n ? * f
i I \ ’ ‘ I
I I
G 0 d
s 8 ” /”
n
\ \
\ I ,
i‘ \ 0 a
‘\ I 0
a I S .
0 - 0
I * I I ,
t :
+2 I
1 :
\ I I
8C!l
f 8
a n
g 8 ’ \ I
t : t :
Figure 20

trarrrra S #oi lr t Pb
PP.
10
0
6
4
2
0 A , - 7---~--t- : i
10 2 0 3 0 40 so 6 0 7 0 100 SO 100 0
\
‘ \ 12 1
I \ I
‘, l0 1 \
I ’ ‘ 3
\ \
i * I
T --+------I A T 0 1
0 10 2 0 3 0 40 so S O 7 0 100 90 100
D i 8 t & n O O
Figure 20

* L o *
I 1 I 4
c * . * . 8 8 : - *
0
c : 4
4
! o - 0 I /
- /
'\ /' I +- I !
I : * 3 '., I! -t ,
G
2 , -
I -
0
-3 .) I
e 0
I 4 0 0 0 e - e
€
7 . ) ' . I
I
4
4
I I
i -
i /
I
I
" 4
c
4
c e 0
c
. f
I f /
r, \ \ 4 ,d'
-*
I I 1 :
4
- - - * -
h / - .I
Figure 21

w i in tvigrr 1 9 8 8 f 1 9 8 9
I
/ \
\ \ i3 8i:OO + M i 09
4 ' I
I
,/+ ' I 4
2
0 _ . .
0
/
4 3 0 1
I I , I .
7 \
\, 4 0 0 i
I
I
3 5 0 1 3 0 0
; ,' \, /
i
+ + \
\ \ \
2 5 0
P P I 2 0 0 I
\ \ \ \ \ ' I
1 5 0 7
100 1 so '
I 0 '
0
300 I
1 i
2 5 0 i I
2 0 0 i ' ,
PP' I 1 5 0 1
' I
I * 100 1
I
so I I

l2 I
7 0 0 0
6 5 0 0
6 0 0 0 ..
\
'-
- - . - 1
2 5 0
0 ! + -- 0 5 0 100 1 5 0 2 00
I in twig.: 1909
2 0 0 0 0
18000
16 000
1 4 0 0 0
R P I 1 2 0 0 0
10000
a 0 0 0
b o o 0 1 - -
0
/ \ / \
rn 'i
5 0 100 1 5 0 I 2 00
\
2 5 0
m \ /" '\
5 0 0 0 t
4 5 0 0 1 4000 1 \ ,"
a ' rn \
m 3 5 0 0 c . - 1
2 00 2 5 0 0 5 0 100
Figure 2 2

APPENDXX 1
Bacillus cereus and Soil Geochemical Results from Soil Traverses, Botswana, Africa
Dr Nancy L. Pardhun Cereus Exploration Technologies Inc.


EREUSEXPLDRATIONTECHNOLOGIESIK. 36 Glen Carran Circle 0 Sparks, Nevada 89431 0 (702) 331-3013
FAX (702) 33 1-2673
Bacillus cereus and Soil Geochemical Results From Soil Traverses, Botswana, Africa
January 15, 1991
Prepared For:
BRITISH GEOLOGICAL SURVEY John Ridgway
Prepared By:
CEREUS EXPLORATION TECHNOLOGIES INC. Dr. Nancy L. Parduhn


PURFOSE
A total of 36 soil samples were collected and assayed f o r
G a c i I l u s cereusand metals IAg, As, B i t B r , Ca, Cd, C 1 , CO, Cu,
F, Fe, I , Mn, MO, Nit Pb, S , Se, Th, U, Zn) from the ENE-WSW
trending Ghanzi-Chobe Mobile Belt, Botswana, Africa (Figure 1 ) .
Results are presented in this report for the purpose of
determining whether Bac i l lus cereus populations can be used to
locate subsurface Cu/Ag mineralization.
METHODS
Samples were collected 15-20 cms deep in poorly developed
soil profiles. They were then a ir dried, sieved t o -80 mesh, and
split. All soil geochemical analyses were performed by the
British Geological Survey using AAS-KP after nitric acid attack
and XRF on pressed powder pellets. Bacillus cereus population
cQncentrations were performed by Cereus Exploration using two
methods: nutrient agars without penicillin, and agars containing
5 , 7 , and 9 ppm peniciilin. Penicillin amended agars provide
substantiating evidence that population highs are related t o
metalliferous soil conditions (Watterson, 1986; Parduhn, 1987).
Summary statistics, data, and plots for Gacillus cereus
counts are provided in Appendix A . Univariant statistics are
generated from raw data. Correlation analysis with soil
geochemistry was performed on log transformed data.
1

GEOLOGIC SE'ITXNC
The survey area is located within late Proterozoic rocks of
the Ghanzi-Chobe Mobile Belt, which consist of thick sequences of
clastic and acid volcanics of greenschist grade metamorphism
(Ridgway, personal communication). The Cu/Ag ore horizon is
hosted within calcareous argillites and occurs within a steeply
dipping Nw limb of an anticline, which plunges gent ly t o the NE
beneath Tertiary sands and fossil dunes of the Kalahari Group. A
sketch map of where soils were col lected relative t o the main
Cu/Ag ore horizon is shown below. cut Ilne
sample slto h OVERBUROEN
The main ore horizon contains chalcocite, boronite, and
chalcopyrite within a zone several metres thick. Minor Pb and Zn
sulphides are found in the upper parts of the ore zone.
Secondary malachite staining is seen in trenches where shallow
overburden occurs.
The area is flat and is covered with thin thorn scrub, in
which various species of acacia predominate, Figure 2 shows the
location of soil sample traverses intersecting mineralized
bedrock a t right angles. A cut line was cleared in the mid-
1970's for drilling and sampling access and runs parallel t o the
main ore horizon,
2

SURVEY RESULTS
Correlation analysis indicates significant associations (95%
confidence level with 35 degrees of freedom) between four suites
of metals; BC, Cu, Pb, and Zn; Ca, Fe, Mn, Zn, As, and Sb; Cl, F,
S , and Th; and S , Mn, and Cu. In general, each suite represents
a microbial, calcareous, halide, and sulfide association,
respectively. The association of base metals with Bacillus
cereus occur only in agars containing no penicillin reflecting
the fact that populations were sensitive to the addition of
penicillin and decreased steadily with an increase in penicillin
concentration.
Data plots for BC are provided in Appendix A for both
unamended and 5 ppm amended plates. 5 ppm plots are represented
as a percentage of the poylation remaining after penicillin
addition (5pprn pops/oppm POPS x 100) e This indicates more
clearly which samples have populations resistent to increases in
penicillin.
Figures 3 and 4 are summary p l o t s of the Cu and BC data,
respectively. Copper distributions were used to outline a
"rough" indication as to where the copper mineralization was
reflected in the soils above the ore horizon. This "zone" was
then used in figure 4 to compare BC distributions relative to the
known occurrence of Cu in soils.
In general, the geochemical data shows that only Cu (and to
a small extent Pb, Zn, S, and C1) outline the location of the ore
horizon . Note that traverse 1 has the least amount of
3

overburden, the higtlest soil Cu concentrations, and the broadest
soil cu ''allomaly". Although all other traverses contain CU
concentrations below 60 ppm, an arbitrary cut-off value
indicates that all traverses contain at least 2 samples in the
middle of the liile that can be presumably attributed to the
presence of the ore horizon.
Bacillus cereus distributions (figure 4 ) show two distinct
patterns. Samples with greater than 70 0 of the population
resistant t o 5 ppm penicillin occur almost exclusively, with the
exception of the deepest lines ( 2 and 4 1 , within the ore horizon
or footwall area. Populations without penicillin, containing
concentrations above 4000 BC/gram, on the other hand, define a
zone, either sharply (lines 4 and 5 ) or broadly (lines 1 and 3 )
within the main zone of Cu mineralization. Note that lines 1 and
3 also contain the broadest pattern of "elevated" Cu values,
CONCLUSIONS/RECOMMENDATIONS
B a c i l l u s cereus populations correlate significantly with
soil base metal concentrations. This statistic correlation is
substantiated by the population distributions observed in the
data plots. In general, the unamended populations, with the
exception of line 2 , correspond to the known location of
elevated soil Cu values (projected ore horizon). I t is unclear
why samples from line 4 (approximately 90 m of overburden)
contain BC populations that target the ore horizon, whereas
samples from line 2 (only 60 n of overburden) contain BC
4

populations scattered throughout the traverse.
Although BC populations delineate the known location of
Cu/Ag mineralization, longer traverses into known "background"
terrain would have produced a more clear indication that the
microbial highs were indeed ore horizon related. Future sampling
programs should include at least 2-3 times the number of samples
collected within the mineralized zone.
REFERENCES
Watterson, J.R., Nagy, L.A . , and Updegraff, D . M . , 1986, Penicillin resistance in soil bacteria is an index of soil metal content near a porphyry copper deposit and near a concealed massive sulfide deposit, pp. 338-350, In: D. Carlise, W.L. Berry, I.R. Kaplan, and J . R . Watterson '(Eds), Mineral Exploration: Biological Systems and Organic Matter: Prentice-Hall. N . J . , 465 pp.
Parduhn, N.L., 1987, The ecology and distribution of Bacil lus cereus and other microorganisms in soils associated with gold deposits, Colorado School of Mines, Golden CO, Ph.D dissertation, unpublished, 193 p.
5

-. 43
(P 5
?i b r‘ b
VI CI
Y PI
a 9
i

al c
k 0 yc
al cl fd U m
rn QI v1
c
U C .... E 0 (D <

t a, 0 3 -.
c* 0 n
e 0
x
ul r) PJ P (0
2 ct
?
m 0 3
* 0
U d
C O
3 - i
e3
'8
v)
3
- L
e
E -
U (P
2. 3.
? 8 3
?
- -

APPENDIX A - Data and Plots

Traverse 1
UNIVARIATE STATISTICS
VAR COLUMN MINIHUM W I M U N MEAN DEVIATION VALID B L N G OTHER 1 OPPfi 1.32OEt03 2.120EtOI S.SOSEt03 6.1205Et03 11 0 0 0 0 0 2 5PPm 4.8006*02 6.700Et03 2.270Et03 1.9798EtO3 11 0 0 0 0 0 3 7PPm 7.900Et02 3.800Et03 2.019St03 1.1462Et03 11 0 0 0 0 0 4 9PPn 3.800Et02 3.70OEt03 1.592Et03 1.1634Et03 11 0 0 0 0 0
Traverse 2
UNIVARIATE STATISTICS
VAR COLUMN MINIMUM MAXIMUH HEAN DWIATION VALID B L N G OTHER 1 OPPm 1.060E+03 7.500EtO4 1.109&+04 2.2648Et04 10 0 0 0 0 0 2 SPPm S.3OOEtO2 5.100E+04 7.100Et03 l.SS24EtOl 10 0 0 0 0 0 3 7PPm 5.500E+02 1.45OEtO4 2.504Et03 4.2662Et03 10 0 0 0 0 0 4 9PPm 2.20OEt02 6.800Et03 1.611Et03 2.0334Et03 10 0 0 0 0 0
Traverse 3
UNIVARIATE STATISTICS
VAR COLUMN MINIMUM WIMUH MEAN DEVIATION VALID B L N G OTHER 1 OPPm 1.080Et03 7.000Et03 4.754Et03 2.5451Et03 7 0 0 0 0 0 2 5PPm 8.000E+02 6.300Et03 3.606Et03 2.3002Et03 7 0 0 0 0 0 3 7PW 7.000Et02 2.900Et03 1.826Bt03 7.9548EtO2 7 0 0 0 0 0 4 9PPm 4.500Et02 1.6006+03 1.083&+03 4.7440Et02 7 0 0 0 0 0
Traverse 4
UNIVARIATE STATISTICS
VAR COLUMN MINIMUH MAXIMUH WAN DEVIATION VALID B L N G OTHER 1 OPPm 1.930&+03 4.400Et03 3.138Et03 9.4022E+02 6 0 0 0 0 0 2 5PPm 1.220E+03 4.10OEt03 2.572Et03 1.2988Et03 6 0 0 0 0 o 3 7PPm 7.700Et02 1.790Et03 1.267Et03 3.6697E+02 6 0 0 0 0 0 4 9PPm 4.400Et02 1.290Et03 8.917E+02 3.0374E+02 6 0 0 0 0 o
Traverse 5
UNIVARIATE STATISTICS
VAR COLUMN MINIMUN MAXIMUM HEAN DEVIATION VALID B L N C OTHER 1 OPPa 7.000E+02 4.900Et03 2.862EtO3 1.7968Et03 6 0 0 0 o 0 2 5PPm 9.100Et02 3.400E+03 2.010Et03 8.4017Et02 6 0 0 0 0 o 3 7PPm 6.700Et02 4.700Et03 1.908EtO3 1.4209E+03 6 0 0 0 0 0 4 9PPm 2.700&+02 3.400Et03 1.517Et03 1.1752Et03 6 0 0 0 o 0

UN L V A R IA 1E ST A T I S r I C S
V A R COLUMN MINIMUM MAXIMIJM MEAN D E V I A T I O N V A L I D 8 1 Oppm 7 . 0 0 0 € + 0 2 2 . 1 2 0 € + 6 4 4.353€+03 3 . 9 4 2 4 € + 0 3 2 SPPm 4 . 8 0 0 € + 0 2 6.7006+03 2.S81€+03 1 . 8 3 3 7 € + 0 3 3 7ppm 5 . 5 0 0 € + 0 2 4 . 7 0 0 6 + 0 3 1 .648€+03 9.9719€+02 4 9PPm 2.200€+02 3.7006+03 1.287€+03 9 . 5 2 4 3 6 + 0 2 5 Ca% 3 . 0 0 0 E - 0 2 9.300E-01 1 .389E-01 1.85686-01 4 F e % Ca L S O O E - 0 1 1.660€+02 4 . 9 5 2 € + 0 0 2.76096+01 7 Hn ppm 2.600€+01 2.890€+02 8.37SE+01 5 .708SE+01 8 Cu ppm 4 . 0 0 0 E + 0 0 3.230€+02 4.2926+01 5 .45736+01 (? P b ppm 1.000E+00 3.400€+01 6 . 4 4 4 € + 0 0 5 . 7 5 9 2 € + 0 0
10 Ln ppm 3.000€+00 2.600€+01 9.7506+00 4.7797000 A I A s ppm 5.000€+00 1.400€+01 6.861€+00 2.0S8S€+00 12 Sb ppm 4 . S 0 0 E - 0 1 1.1776+03 3.400€+01 1 . 9 S 9 S E + O 2 15 S ppm 3.000€+00 1.071€+03 3 . 4 7 7 € + 0 2 2 . 0 1 9 4 6 + 0 2 14 Se ppm 4 . S r j O E - O l 2.000€+00 7 . 4 4 4 6 - 0 1 S . 0 4 5 2 E - 0 1 15 T h ppm 4 . S O O E - 0 1 1.300€+01 6.429€+00 2 . 7 3 1 7 € + 0 0 16 IJ pptn 4 .500E-01 7 . 0 0 0 € + 0 0 2.565€+00 1 . 3 5 9 7 € + 0 0 1 7 8r- ppm 9 . S O O E - 0 1 7 . 0 0 0 E + U 0 3.S43€+00 2.0647E+OO 1F3 C1 ppm 8.000E+OU 6.500€+01 4 . 1 1 1 € + 0 1 9.1676€+00 1 9 F p p m 6.600€+01 8.830€+02 4 . 5 1 1 € + 0 2 1 . 7 8 4 1 € + 0 2 2 0 1 ppm 4 . 5 0 0 E - 0 1 5 . 9 1 0 € + 0 2 1 . 7 9 4 € + 0 1 9 . 8 2 4 8 € + 0 1
36 36 36 36 36 36 36 36 36 36 36 56 36 36 36 36 36 36 36 36
0 0 0 0 0 0 0 0 0 0 0 0 0 0 0 0 0 0 0 0
C O R f i E L A l I M - COIPUTED USING ORIGINAL DATA

BOTSWANA a t H I S T R Y
R O Y I0 OOOI 3991 7w 9poI Fv
1 1.0 2 1.23 J 1.w 4 1.75 5 1.100 0 1.125 7 1.150 9 1 . m 3 2.0
.o 2.2s
480.0000 1370.0000 16tO.W 6700.oooO sr00.0000 710.oooO 1940.0000 1970.0000 4m.m 26oo.oooO
790.oooo 13oo.oooO 36oo.oooo 3 8 o o . m 3 3 o o . m 86o.oooo 1700.oooO 2140.oooO 1010.oooo 970.oooO
.3900
. le00 a 1900 . 9 m I1600 ,1900 . l4OO . om .MOO
,7300 143.0000 26.oooO 166.oooO 154.ooOO 164.oooO 172.oooO 289 .oooo 216.oooO 61 .oooO 54.0000
24 .oooO 4 .oooo 53.oooO 62 .oooO 98.m 128.oooO 323 .oooO 62.oooO 17 .oooO 13.oooO
5.oooO M.oo00 5.m 6.oooO 8.W 3 .oooo 4-* ocloo 3 . m 7 .oooo 8.oooO
2900.oooo 53o.oooO 970. oo00
1 4 3 o . m 118o.oooo 8LO.ooOO 7OO.oocIo 2 0 1 0 . m 1990.ooo13 29oo.oooo
.o300
.o800
.O600
. O f 0 0
.060
.0100 -06oO .woo .o300 .07W
.3600 ,4600 .m .no0 .3100 .3m .3100 .m .3m .31#
34.m 79.am 3s.oooo '58.oooo M.Oo(r0 77 .ouoo 6?.oooO SI .oooo 4 9 . m 58.oooo
:I 2 3 . z 2.73 . j 2.100 4 2.125 . i 2.150 .? 2.113 . I 2.200 . 3 3.0 . 3 3.2s 3 3.30
10700.oooO 1370.0000 1 s w . m 4100.0000 32OO.oooO 1400.oooO 106O.oo01) 66oo.oooo 6300.a)oo 7000.oooo
6100.oooO 060.oooo 119o.oooo 1610.oooO 1910.oooO 6oQ.oooo 'jjo.oooO 4800.am 4000.0000 63oo.oooo
14 .m 26.oooO 16 .WO 24 .oooo 56.6oOo 28.oooo 8.oooO
2 3 . m 38.IKK)o 31 .oC100
6.oooO 12 .m 12.oooo
7 .m 8 . W 4.oooo 2.m I .m
1 1 .w 10.OOW
2400.oooO 1940.oooO 84O.oooO 700.m 1OSO.oooO 158O.oooO 1790.oooO 12oo.oooO 770. oo00 1 2 1 0 . 0
101o.m 99o.oooo 31o.am 4 w . m 66o.oooo 129O.oooO 1 6 n . m 1060.oooO 440.oooO 86o.m
.m
. O f 0 0
.0700 ,0700 .0700 . l 4 0 0 .ll# . loo0 . os@ .o600
.3900
.2600
.m
.1m
.m
.m ,2900 .3m .m .2700
69.001)0 52.oooO 62.oooO 52.oooO 57 .m 114 .oooO 7 3 . m 68.m 38.m 66.oooo
:I 3.75 :2 3.100 :; 3.123 :4 3.150 15 4.0 :5 4 . 2 0 :7 4 . 4 0 :0 4.60 :3 4 .80 :Q 4.100
6100.oooO 2300.oooo 94o.ooOo 8al.m 1690.oooO 122o.oooO 41OO.oooO 2 6 0 0 . m 1520.oooo 4100.0000
40.oooO 46.oooO 23.0600 1o.oooo 1 6 . W 48.oooO 42.0000 6Q.oooo 27 .oooO ls.m
4 .ouo 2 . m 3 . m 1 .ouuo 3.oooo 7 .oooo 3.ocIcIo 7 .oooo 1 .oooo 2 .m
270.oooO 670. W 34oo.m 136O.oa30 98o.oooo 2400.0000
. loo0
.O800
. loo0
.oyoo
. om
.0700
.m
.1100
.m
.1700
.1100
. 1 m
58.oooo 52.oooo M.0000 52.oooO 41.001x) 4 9 . m
:i 5.0 !i 5.20 3 S.40 'A 5.60 ;3 5.80 x s.100
670. oo00 129O.oooO 4 7 0 0 . m 166O.oooO 1330.oooO 1760.oooO
27 .oooO 48.oooO 54.m 22.oow 6 .oooO 7 .m
1o.oooo 1 o . m l o . m 2.oooo ?.ooo1) 1 .oooo

ROY ID
1 1.0 7 1.25 3 1.50 1 1.75 5 1.100 6 1.125 7 1.1% 8 1.200 9 2.0
10 2.2s
11 2 . 9 12 2.1) 1s 3.100 A4 2 . 1 8 1s 2.130 !6 2.115 17 2.200 18 3.0 A9 3.25 20 3.9
21 3.75 n 3.100 23 3.125 24 3.150 25 4.0 26 4 .20 27 4.40 28 4 .60 29 4 . 0 0 'A 4.100
31 5.0 32 5.20 13 5.40 3 s.60 3 5.m 3 5.100
As PP
9.oooo 14 .oooO 1 o . m ;.oooo 9.oooo 9 . a m 7 .oooo 1.oooO 6.oooO 7 .oooo 6.oooO 6.oooO 8 .oooO 4 .oooo 7.oooo 1.W 3 . m l.W 6.oooO l.oo00
6.oooO l.oo00 8 .oooO 8.oooO 6.oooO S.oo00 6.oooO 6.oooO 5.oooO 1O.oooO
6.oooO 7.oooO 1.000r) S.oo00 6.oooO
SPQI
3.oooO 1 1 7 7 . m
2 .m 1 .m Loo00 2 .oooo 1 .oooo 4 . m .4m
3 . m . 4 m
5.oooO 3.oooo .4m
2.oooo 3 .m .4m .4m
. I s m
.(so0
,4300 .4m
, 4 5 0 0 .4m .4m -4500
5.oooO .4m .4m . 45al . 4xK)
.4m
.4m
.4m
.4m
S.oooO .4m
sw 841 .oooo
Joooo 4 m . m 444 .m 862 .am 370.oooO
298.m 210.oooo 241.oooO
219.oooO 271 .oooO 240. oo00 243. oo00 267.0000 296.oooo 271 .oooO 218 .oooO 259 .oooO 302.oooo
242 .oooO 217.oooO 231 .oooO 241.0001> 224 .m 29o.oooo 354.ooOo 291 .m 281 .oooo 278. oo00
361 .am 318.oooO 363.m 346.oooO 366.oooo I01 1 .oooo
m.cmo
Q w .4m
.4m 1 .oooo 1 .oooo .4m 4500
,4300
. 4 5 0 0
1 .m 2.oooo 1 .oooo .rm 2.m
. r X K ,
.4m ,4500
1 .oooo 1 .oooo 2.oooo
.4500
.1300 2.m .4m
1 .m 1 .oooo .4m
.4m
.4m
,4500
.rm
.rm
. wo
.4m
.m
.4m
,4300
fh PPQ
6 .oooO .4m
9.oooo 3.oooO 1.oooO 8.oooO 13.oooo 11 .oooo 6.oooO 5 .am 3.oooo 7.oooO 8.oooO 9.oooo 7 .oooo 7 .oooo 1o.oooo 6.oooO 9 . m 7.oooO
1 .m S.oo00 1.m 1.oooO 2.oooo 3.6000 7 .oooo l.oo00 l.oo00 3 . m
6.oooO 6.oooO 4.oooo 3 . m 9.oooo 7.oooO
U P
2.oooo Loo00 4 .oooo 2 .m 2 . a m
2.oouo 3 . m 3.oooo 3 .oooo 4 .oooo 3.oooo zoo00 3.oooO 2.m 3.oooo 4 .oo 2.oooo 2.oooo
,4500
.4m
3.oooo 3.oooo 1 .oooo 4 .oooo 1 .oooo 3.oooo 2.am 4 .oooo 2.oooo
3.oooo 3.oooo 5.oooO 1 .oooo 1 .oooo 2 .m
.4m
kpoI
7 .oooo 7 .oooo S.oo00 5.oooO 7.m 4 .m 5 .oooo 3.m
Loo00
4.m .9m .9m
2 . m .m
2 . m 2.oooo
.9300 ,9300
S.oo00
2 .m 5.oooO
6 .oooO 6.oooO 6.oooO 3.m 3.m 5.oooO S.oo00
6.oooO 3.oooO 3.m 3.oooo
.9m
.9m
.9m
. 9 m
c1 PQI
6S.oooO O.oo00
48.001x) 48.0000 52.oooO u.am 47 .oooo 47 .oooo 37 .o 33.am
3 9 . a m 41 .oooo 3s.oooo 34.oooo 4 1 .oooO 40.oooO 40.0000 38.oooo 38.oooo 44 .oooo 36.oooo 40.oooO so.o() 5o.oooo 33.oooo 43.oooo 43.ooOo 46.oooO 40.0000 46.oooO
46.ooOO 48.m 47.ooOO 5o.m 31 .OOOO 34.oooo
F p p r
470.oooO 66.oooo
6 8 3 . m 6 1 0 . W 751 .oooO 7 4 3 . m w6.m 715.oooo 617.oooO 391 .m
32u.m 236.ooOo #?.am 403. oo00 0 1 .oooo 310.oooO 263.m 212.oooo 410.0000 x)9.oooo
399.oooo 494.0000 319.oooO 408.oooo 1oo.m 163.oooO 347.oooo 482.0000 SI1 .oooo 362.oooo
588.ooOo 164.m 601.m 394.oooO 338.m 39s.oooo

BOTSWANA BACILLUS CEREUS D A T A
ROW ID 7 PPm 9PPm
1 1.0 2 1 . 2 s 3 1 . S O 4 1 - 7 5 s 1.100 6 1.125 7 1.1150 8 1 . 1 7 5 9 1.200
10 1.22s
14Zi0.0000 2600.0000 4200.0000 12900.0000 21200.0000 1320.0000 S400.0000 2900.0000 2500.0000 2200.0000
480.0000 1370.0000 1620.0000 6700.0000 S40C. 0000 710.0000 1940.0000 920.0000 1970.0000 2500.0000
790.0000 1500.0000 3600.0000 3800.0000 3300.0000 860.0000 1700.0000 910.0000 2 140.0000 2600.0000
380.0000 1 130.0000 2000.0000 3700.0000 3700 .OOOO 730.0000 1630.0000 720.0000 1720.0000 1300.0000
33.5664 5 2 . 6 9 2 3 58.5714 S 1 . 9 3 8 0 25.471 7 53.7879 3 5 , 9 2 5 9 31.7241 78 . F3000
113.6364
1 1 1.250 12 2.0 15 2.2s 14 2 . 5 0 15 2 . 7 5 16 2.100 17 2.125 18 2.150 19 2.175 20 2.200
390O.0000 5300.0000 S200. 0600 10700.0000 1370.0000 1550.0000 4100.0000 52O0.0000 1400.0000 lO60.0000
1360.0000 43O0.0000 2600.0000 6 LOO. 0000 960.0000 1190.0000 1610.0000 1910.0000 800.0000 530.0000
1010 .oooo 1010. oouo 9 70.0000 2900.0000 550.0000 970.0000 1450.0000 1180.0000 810.0000 700.0000
500.0000 910.0000 490.0000 3400.0000 220.0c)00 540 (. 0000
1220. U000 12 10.0000 920.0000 4OO.0000
3 4 . 8 7 1 8 01 .1321 so. 0000 57.0095 70.0720 76.7 7 4 2 39.2605 56.7308 57.1429 so. 0000
2 1 2 .22s 22 3.0 23 3-25 24 3.50 2 s 3.75 26 3.100 27 3.125 29 3.150 29 4 . 0 30 4 . 2 0
75000.0000 6800.0000 6SOO.0000 7cJ00.0000 6100.0000 4 7U0.0000 1080.0000 l 300.0000 1930.0000 3300.0000
51000.00(50 4800.0000 40O0.0000 6300.0000 6 100.0000 2300.0000 940.0000 800.0000 1690.0060 1220.0000
6800.0000 1540.0000 1600.0000 1450.0000 1040.0000 990.0000 s1o.ooou 4S0.0000 660.0000 1290.0000
14 500.0000 2010.0000 1990.0000 2900.0000 2400.0000 1940.0000 840.0000 700.0(500 1050.0000 1S80.0000
68 . c)O(iO 70 .5802 63.4321 9v .0000 100. OOfJo 48.9362 07 . (3370 6 1 . S . 3 8 5 87.5648 36.96'37
4 4 O 0 . 0 0 0 0 4000.0000 25O0.0000 2700.0000 3300. oil00 4900.0000 4900.0000 700.0000 1370.0000 2000.0000
4 100.0000 2800.0000 1520.0000 4100.0000 910.0000 2270.0000 5400.0000 1960.0000 1450.0000 2070.0000
1790.0000 1200.0000 770.0000
12 ~0.0000 670.0000 1290.0000 4700.0000 1600.0000 1350.0000 1760.0000
1020. oouo 1060.0000
4 4 0 . 0 0 0 0 880.0000 2 7 0 . UOOU 670 . 0000 3400.6000 1380.0000 9O0.0000 2400.0000
31 4 . 4 0 32 4.60 33 4 . 8 0 5 4 4 . 1 0 0 5s 5 . 0 S6 5.20 37 5 - 4 0 38 5 . 6 0 39 5 . 0 0 40 5.100
93.1818 70.0000 60.8000
151.8519 2 7 . 5 ? 5 8 46.3265 69.3878 280.0000 105.8394 103. S O 0 0

BACILLUS CEREUS/GRAM SOIL
5000 10000 15000 20000 A A
/ \
\ \ \ \
/ 4 c
/ * / '1 V 1 1 1 20 4 0 60 80 100 5 PPM PENICILLIN RESISTANT
e,
I td 0 c-3 cn

BACILLUS CEREUS/GRAM SOIL
0 5000 10000 15000 20000
\ \
I I k t::
li I” I
I s
\ \
‘ I I
I
td 0
20 40 60 80 160
5 PPM PENICILLIN RESISTANT

BACILLUS CEREUS/GRAM SOIL
0 5000 10000 15000 20000 1 A I A J
0 cl' \
0
\ b
\ 9
\ \ \ \
/ O 0
0 0 4
: A J
I I
/ I b
1 l e 1 I \
20 40 60 80 100 5 PPM PENICILLIN RESISTANT
r 2
I

BACILLUS CEREUS / GRAM SOIL 0 5000 10000 15000 20000
\ i \ I
\ i ' I L
b \ I
I 1 I
1 20 40 60 80 100
5 PPM PENICILLIN RESISTANT
E= Z R
I
W 0 t3 cn
E +

CI
Z
BACILLUS CEREUS/GRAM SOIL 0 5000 10000 15000 20000
I D
h b I !\ \ b
\ I
b
I ! I \ I
a- 0
-
Qb, 0
c z
I W 0 4 Y 5 *
\ ?
I
b I I
I I I I
I
I
5 PPM PENICILLIN RESISTANT


t t L c
EL 8
9 € 6 L S S
S'O E t z
t t * c
9 c 9 U t 6t P c c S
8 sz EL CL LL SL C t cz LL tz ct
6Bvz
t E * 9 L L
S t c 6 8
t t S
S 9
OL 8 6 6 S
S 9 6 S 8
C t 8 L 8
91
Ez EL t Z 92 sz 92 tt
88 uz
L L
t z
8 8 Lt
L ot
S
6 01 L b ot
I t
9
P
8c EE 62 L t L t
'de,
t
S 8 S t i Z t
E t 9 P S c
c t P t 8
ot 8
t t * 9 L LL t.1 8 8 8
E L 9 9 9 L
o t CL L 6 L
68 Qd
t
2 2
o t 01 OL
1, t t L c L c
1
c t t
ot Lt L
2 v 8 L
ZL 2 9 8 L
c
t S 8 9 S S E
88 Qd
E
L
S 9 6
8 8
P
9 9
LL L t
C t tL
6
I t 01 t t Z l OL
hJ Qd
c S
ZL t t Ob L
S C t 02 s t SL I t
c 6 tc Lt U U cz
E 6 a U 9L LL U ZL e t t t
P 8
ps; 86 m KL 901 Es OP ct LZ
68 n3
El SI SI SI SI SI
PI Pl tl PI tl PI PI
El El Cl Cl Cl €1 Cl
tl Zl Zl tl Zl 21 tl 21 Zl 21
I1 I1 Ll 11 t l 11 t l Ll Ll t 1 tl

PO0 PO0 LO 0 SO0 L L 0 900
WO PO0 fX0 ZQO PO0 COO
PO0 WO LO 0 PO0 SO0 900 SO0
600 P I 0 t o 900 SO0 600 800 WO ZOO COO
L L O 1 L'O
L L LC 0 91 0 SL 0 to P S I 890 LI 0 I t
69 e3
LO 0 50'0 6QO OL 0 900 OL'O
900 800 SO0 OL 0 L L O P t 0 LO 0
LO 0 LO 0 LO 0 800 LO 0 600 WO
900 LO 0 900 LO 0 900 800 COO WO Eo0
tL 0
61'0 8) 0 W O 61 0 et 0 zt L S O
88 e3
900
21'0
600 600 L L 0
600 LO 0
LO 0
i o 0 800 210 110
600 LO 0
COO
2 0 SZO SZL *z 0 81 0
*J p3
os
69
€3 69 9L
08 09
8s
LP s9 C6 CL
26 ZL
8s
I82 SVZ P6L S 9 L PCL
SI SI SI SI SI SI
tl PI t r l PI Pl PI 91
Cl Cl Cl €1 Cl €1 €1
21 Zl 21 21 21 21 21 21 21 21
I1 L l L l Ll L l L l 11 Ll I1 I1 I1

z L L S
c
s-0 z P z c
S'O L
P
L c c
S'O z z
t c z c t c 0
c c
c
z s o z z t t z
n
L 6 c P 8 8
L c L L L c z
L L S L L 6 9
or L L 6 8 L c S 9
L L
CL 8 L S 6 L 9
U
S'O S'O S'O S'O S'O S'O
S'O S'O
L L
S'O z
s.0
S'O S'O z L L
s-0 s o
S'O t s-0 S'O
1 z L
s o S'O
S'O
S'O s o S'O
L S'O S'O S'O
w
s-0 S'O S'O S'O S'O c
S'O S'O S'O S'O S'O s.0 S'O
S'O S'O S'O S'O C.0 S'O c
z S'O c S
S'O S'O c s.0 t
L
z c L
S'O t L
S
QS
s o c
S'O s o S'O S'O
c t z z L t
s o
P
c S'O z L z 1
s o S'O S'O S'O
L L
s o c
s o
z
z t S c
s o c
s o
I
1
L c c c 9
L S S c c 9 9
9 1
S z S t t
Z z L 2 L L
0
S t
c
E t L S S 8 L
J8
S 9 S L L 9
9 or S 9 9 S 9
8 8 L 9 L 9 L
c L L t 8 8 9 L 9
L
L 6 6 E
OL t t 6
SV
SI SI SI SI SI SI
PI P I PI 01 tl P I tl
€1 Cl €1 Cl Cl Cl Cl
21 Zl 21 Zl 21 21 Zl 21 21 Zl
I1 11 I1 I1 Ll I1 Ll t l 11 11 L l

OL'M
Z O O Z O O ZOO
Z O O SO0
PO'O €00 PO0 PO0
900 LO 0 SQO 900 LO 0 So0
800 PO0 900 PO0 900 SO0 WO
900 COO SO0 SO0 SO0 900 LO 0 LO 0 COO C O O
8L'O OL 0 010
01 0 SO0 800 900 600 800 800 COO
81 0 010 ZP 0 6L 0
6 Z O 9 0 090 Bp0 020 8CO E O
BE0 zt 0 WO OS0 S O E O LP 0
S O LS 0 O P O 8 C O 9CO 090 980
890 OS0 890 SCO WO S O S O Z90 8L 0 c90
010
020 090 ot0 OL 0 020 o t 0 000 OL 0
t L oc zs OP 69s StpP
CS8 6L'tL
€2 I t S66 tt't L 68 OL
9L 6 SZ6 9c L L €U9 999 LZ 8
LL 6 a 01 9001 LC 01 09 CI PBS I S 6
C9PL WO1 1L L L SZ6
LLSL 82 L L a S I LPOL
6L t t 828
8L 91 PC 8L W I t
8SPL SO02 sc LL tt s 6 9 L
CL L L 9L 8 98 L L
UC 209 LO 6 CS9
C92 c t c StL 9L c 8P'P 9Pc L8 t
6L L CL2 992 12 t E t 2 LSZ Z9Z
tt c SL t SSZ SL 00c at 6 8 2
LS L € 6 1 92, El 8 8 C O t t CL L 8 P t 0 0 2 28 Z
IL Z
6 t S Ut SL z t6t %Z 980 ar 01 t
C O € 0 6 2 Q S P as
LE c 9L 0
892 W P
P t s %P
9oc tt t WL t s c 6 6 P 88c
at 092 2s t 19 L P 9 t 18 P LP 2
E t PCZ 8PL 8L P W O ZL c OS2 t C c % L CL t
6€P o t c SOS
0 8 L 9S9 LC t LL s SOS 6 9 W 9 LV t
ZOL t t L
6 0 WL
000 000 690 LL 0 tt 0 990 000
920 000 PO0 9 0 620 000 to I
000 6 C O 950 880 9 Z O t L 0 900
S Z O 000 000 €00 000 LP L U t 8L 0 EL m0
D O
LO 0 290 WO 000 000 8 0 1 LC 0 000
91 91 91 91
SI SI SI SI El SI SI
Pl PI PI PI PI PI PI
Cl Cl Cl Cl Cl Cl Cl
Zl 2 1 2 1 21 21 2 1 21 21 21 21
L l I1 I1 L l L l 11 I1 L l L 1 L l L l
L l
@ S J 3 A O l l

W'C9 00-96
00'St 0006 00s9 00 t L 00 LC 000s 00x
000 OO'LZ 00'6s
00'6 00'oc OOSL 00'9
O O ' L L OO' t L
000
00'22 006 00s 000 0 0 0 , OOU 000 0002
000 000
000 00oe 00m
00'82 L
00 tt 00s 0088 00 2s 00 61 00 1s
0 0 C L L
ooQ6 008V 00 9L
00tLL 00 SL 00s 00s 00'82 00 L t 00%
00SlL
00s 009 W L 009
00'0 00'0
00'0 00 LC W'P6 00'cz L
00tc 0089 00 LS 00s 0062 00 t P 0099
vs so3
00oc 0002 000) 000
0 0 0 0 L 0009 00 OL 0009 00oP 0002 000
00NL 0000L 0008 0009 00oP 0002 000
00OSL 00SZL 0000L 00 SL 000s 00Et 000
Oom moot 00SLL 000s1 00stL 00001 00 SL 000s oosc 000
00w 00sa 00cx>t 00081 00 SLL 00OSL 00Et1 0000L 00 EL 000s 00St 000
m e w 0
91 91 91 91
SI SI SI SI SI SI SI
tl VI tl tl PI tl tl
61 E l E l Cl Cl Cl €1
21 tl 21 tl 21 t l 21 21 2 1 Zl
L l Ll L l L l Ll L l L l L l 11 I1 L l 11
-a1

DL WL 06€ LPL
081
9Pt
L LP
066 OL8 98) L t L
t o t
at O l C L
S9L 86 09L L
PZ 1
00s 28 95 c LZ WO t CLL
0% m 92
Ee 09 I L
ss oc)
LtZ SL
CE 9ZL 6€ L9 OL
06s
COL Ut 88 LS 86
L LP LS t 6 9 L SCL LOC
01s cm
oep 10 L
028 89c 0 19 W t
OS01
LO I P9
8 t L 89 t l L
# L
zc t e 081
OCL SOL oot L9z
t t L
LL L
28 t C l2 CL 2L t L9 t
t 9 t
c8t SL t
tz 1 OLL
6 0 1
P tt
c16 8sL OOL %t
L8 L
9 0 1
261 Lt 1
tl t
9ct 9) L
6Et sa PL Q6
001
O O L
08 09 OP 02 0
Et 001
08 09 0
OSt
Szt OOL
SL os sz 0
oa SL L
Ost
SZL 0 0 1
SL
os Et 0
os1
SZL
001 SL os sz 0
SI SI SI SI SI SI
PI PI PI PI tl
E l Cl E l
Cl Cl Cl Cl
21 tl 21 I1 Zl Zl Zl Zl 21
t l L l
I1
11 I1
I1
I1
a s H A r r U l

L L
L
L L L
1
L
L
L
L
L
L
9
S 9 L L
9 1
L
L
S
b
L
L L
L 1 S 9 L 9 9
L
L
L
L L
L
b
L
1
L
L
L
L
L
9 L
L 1
L L
L
1
L
L
L L
1
L I
1
L
9
L L L
SI SI SI SI SI SI
*I PI P I
P I
Pl
Cl Cl Cl CL Cl Cl Cl
21 21 21 21 21 21 21 21 21
L l L 1 L 1
I1 I1
L 1 Ll
GmaAeJl

CL 9L 01
L P1 bL
61
6c 1L
E S
L 9 L
1
l t
PI I1
cz 8 S S 9 8 L L
L
I t
8t 01 LZ CL
01 61
1
L
1
L 1
1
L
1
L
I
L
l
1
L
L
1
1
L
L 1
1
1
1
1
L
L
L
S S 1
L
I 1
I
8L st
s SL 81
61
91
92 6 92 92
a oc L 1
91
8L L L
02
U tt vz 62 Sl PI v t L t PL
t l
VL
C l
81
LL 21
91
a LI
olr 61
S l
L t
61
6c
S a: 91
6p
ZP
61
21
SL C l
OE
92 W L t 82 02
S l
8€
tt ot
E c S S V
1 1
LC
SI SI SI SI SI SI
VI 01 tl P 1
V I
Cl Cl Cl Cl Cl Cl Cl
21 Zl 21 Zl Zl 21 21 21 21
11 11 11 11 11 11 11
?SJaAeJl
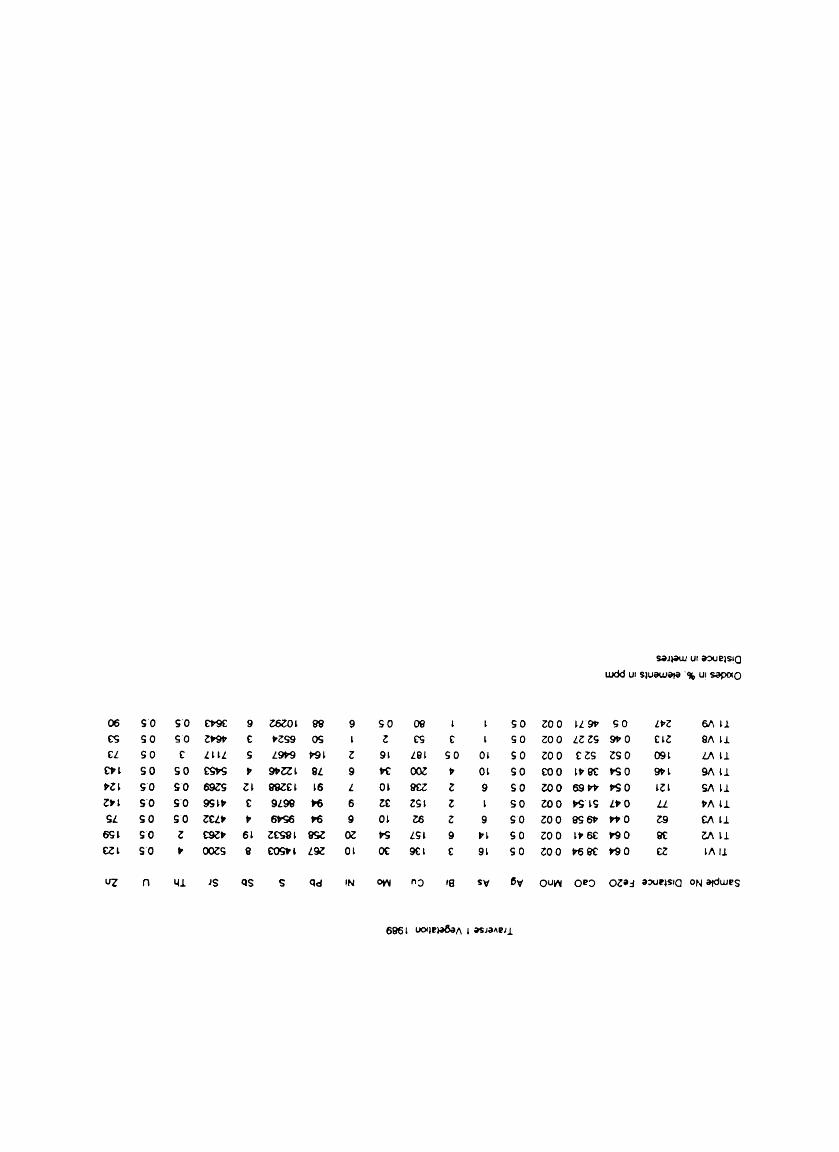
a3 s o s o cs s o s o CL s o C
Dt s o s o PZL s o s o ZtL S'O s o SL s o s o
6 1 s o t czl s o t
9 c S P tt c P 61 8
88 9 s o O S L t
P91 2 91 8L 9 Pc I6 L 01 W 6 ZC P6 9 01 8StatrS L 9 t 01 oc
L 1 s o ZOO LLW s o LPZ M I1 C 1 S O Z O O LtZS WO C l t 8A 11
s o 01 s o ZOO E t S ZSO 091 LA Ll t 01 s o coo LPBC so 9 P l S A L 1 2 9 s o t o o 69w so LZL SA11 z 1 s o t o o S L S L V O U t h I1 2 9 s o zoo 8sw W O 2-9 cn 11 9 PL s o ZOO 1P6c WO Bc ZA Ll c 91 s o ZOO P6Gt WO cz LA I1


