65


We are a different kind of distributor.
As a value-added distributor, ScanSource, Inc. has always maintained a laser-like focus on providing world-class logistics
for our technology reseller customers. Getting products in and shipping them out on time is our core mission, and it’s what
we’ve built our company upon. We’ve made a promise to our customers that we’ll always get them what they need, when
they need it. And we’ve made a promise to our manufacturer partners to help grow the markets they serve by recruiting,
educating and offering business-building services to resellers.
But unlike some distributors, we are fully invested in the products we deliver. The technology solutions in our distribution
center aren’t just boxes waiting to be shipped – they help tell the story of who we are and where we’re going.
Since 1992, ScanSource, Inc. has been transformed from a start-up company with a handful of employees to an
international leader in the distribution of specialty technology. In those 15 years, the company has maintained a steady
rate of growth, in part because of strategic decisions to enter new technology markets.
From our beginnings as bar code and point-of-sale specialists through the addition of voice/data, convergence, security
and videoconferencing solutions to our product line, ScanSource, Inc. has built a foundation of growth by consistently
embracing new technologies and bringing our model of efficient delivery and expert logistics to customers in new
markets.
At ScanSource, Inc., we’re proud to say that we are a different kind of distributor. And proud that technology has helped
build the foundation of growth that will carry us into the future.

Automatic Identification and Data Capture/Point-of-Sale
ScanSource, Inc. began in 1992 with what seemed at the time like a radical idea: To bring efficient, expert logistics
and distribution services to the bar coding and automatic identification and data capture (AIDC) marketplace. The
technology was growing rapidly, particularly in manufacturing and retail environments, and soon after, ScanSource
added point-of-sale (POS) solutions and peripherals as a natural fit to its product line.
Today, these products are being used in an ever-expanding number of business settings in a variety of markets. A
strong surge in the usage of mobile AIDC devices continues to create new applications for the technology in diverse
markets as healthcare, manufacturing, education, field services, government, finance and many others, setting the
stage for powerful growth into the future.
p a g e 1
“The mobilization of the workforce through AIDC and POS technologies is creating so many new opportunities for businesses of all types and these opportunitiesare growing by the day. At ScanSource, it,s part of our mission to educate our reseller customers on all of the new ways they can profit from the strengthened productivity and efficiency these products can provide to businesses.”
Cynthia Hardwick Sales RepresentativeScanSource

Convergence
ScanSource, Inc. helped transform the converged communications marketplace in 1997 by introducing Catalyst
Telecom as the first two-tier distributor in the telecommunications market to focus exclusively on resellers. In 2002,
the Paracon sales unit was formed to specialize in products that provide the building blocks for convergence
solutions, giving the company’s customers access to a complete lineup of communications products.
The emergence of Voice over IP (VoIP) in the convergence space is opening up powerful opportunities for dealers to
help end users save money and improve their communications processes by allowing them to manage just one
network instead of two. With VoIP, voice and data can be consolidated onto a single network, making network
management costs lower and reducing a user’s total number of suppliers.
p a g e 2
“We,ve reached a defining moment for convergence and have arrived at the point where it is no longer an emerging technology. With more and more end usersmoving away from traditional voice systems to converged solutions that save money and increase the productivity of their employees, there is now no turning back. Convergence is the future.”
David Watson Product ManagerCatalyst Telecom
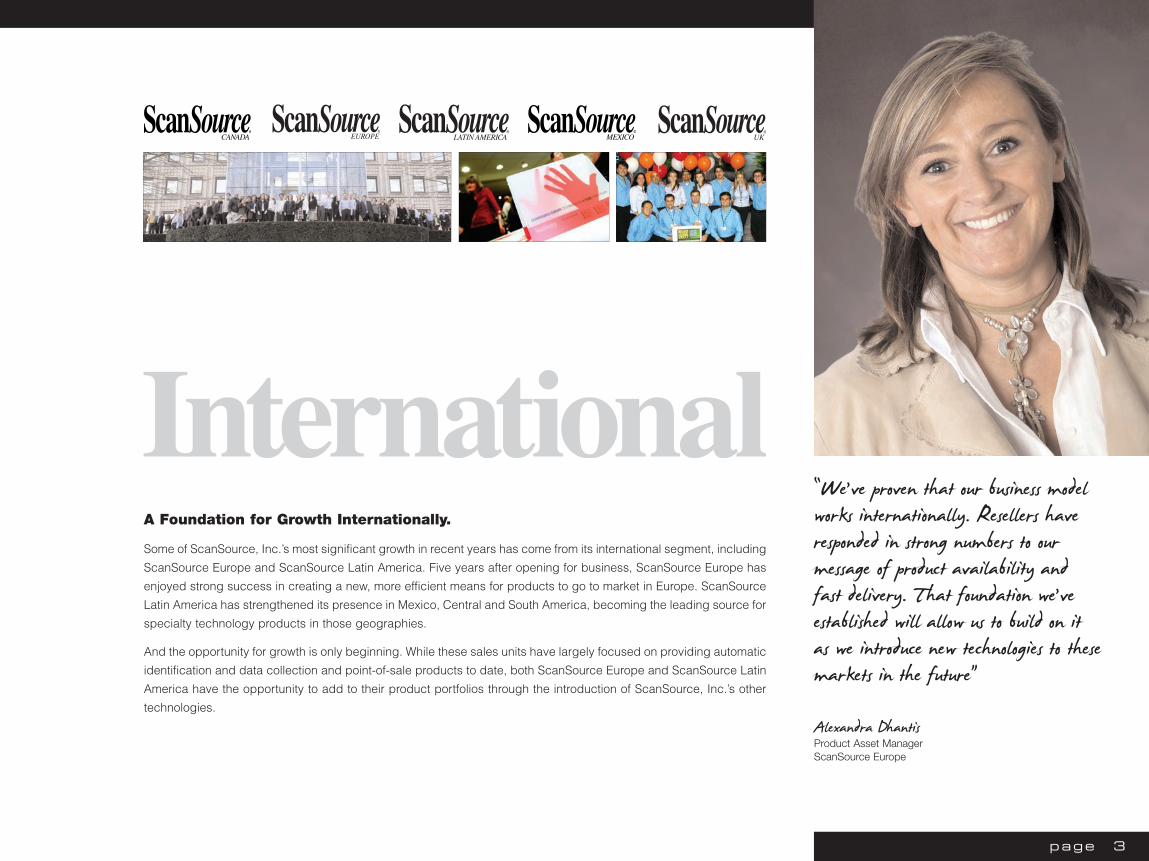
A Foundation for Growth Internationally.
Some of ScanSource, Inc.’s most significant growth in recent years has come from its international segment, including
ScanSource Europe and ScanSource Latin America. Five years after opening for business, ScanSource Europe has
enjoyed strong success in creating a new, more efficient means for products to go to market in Europe. ScanSource
Latin America has strengthened its presence in Mexico, Central and South America, becoming the leading source for
specialty technology products in those geographies.
And the opportunity for growth is only beginning. While these sales units have largely focused on providing automatic
identification and data collection and point-of-sale products to date, both ScanSource Europe and ScanSource Latin
America have the opportunity to add to their product portfolios through the introduction of ScanSource, Inc.’s other
technologies.
p a g e 3
“We,ve proven that our business model works internationally. Resellers have responded in strong numbers to our message of product availability and fast delivery. That foundation we,ve established will allow us to build on it as we introduce new technologies to thesemarkets in the future”
Alexandra Dhantis Product Asset ManagerScanSource Europe

Security
With the creation of ScanSource Security in 2004, ScanSource, Inc. embarked on a mission to bring the same level
of efficient logistics and fast product delivery to the security marketplace. Demand for security solutions like
surveillance, intrusion detection and access control has surged in recent years as business owners look for new ways
to protect their employees and company assets.
The growth in Internet Protocol (IP) surveillance solutions is transforming the security industry, providing end users
with strong return on investment and more reliable protection. New applications are emerging that combine video,
communications and information technology to deliver customized security solutions for specific types of businesses.
p a g e 4
“There,s never been a better time to be a part of the security marketplace.Digital technology is making it easier than ever for businesses and individuals to protect themselves. IP surveillance facilitates remote monitoring from almost any location, and video enhancement techniques are making it possible to actually prevent crime rather than merely react to it.”
Dean Ross Product ManagerScanSource Security

Videoconferencing
The acquisition of T2 Supply in 2006 gave ScanSource, Inc. a strong foothold in one of the fastest growing technology
segments – videoconferencing. With new security concerns and the increasing challenges in air travel, many
companies are opting to keep their employees at home rather than dealing with the hassles and expense of traveling.
But meetings still must be held, even if employees can’t travel to hold them. That’s where videoconferencing comes
in, and it’s why the usage of this unique technology will only continue to grow well into the future. Like the other
technologies represented by ScanSource, Inc., videoconferencing has been enhanced by the emergence of IP as
the pervasive network technology, as it offers standard connectivity, easier set-up and cost-savings.
p a g e 5
“More people in the United States now meet electronically than in person.Videoconferencing brings business people face-to-face without the hassles of travel, and provides a new level of data sharing that makes it easier for partners to collaborate.”
Amy Krueger Sales RepresentativeT2 Supply

the market and providing them with comprehensivetraining, technical support, integration capabilities,marketing assistance and other value-added services tohelp them succeed.
This is the foundation that has served our company sowell for 15 years and that we believe will continue to offernew opportunities to ScanSource as we look to apply ourmodel to new technologies in the future and expand ourcurrent technologies into new geographies. On behalf ofall of the employees of ScanSource, Inc., I’m pleased toreport that our company’s “Foundation for Growth” helpedus once again deliver strong results in Fiscal Year 2007.
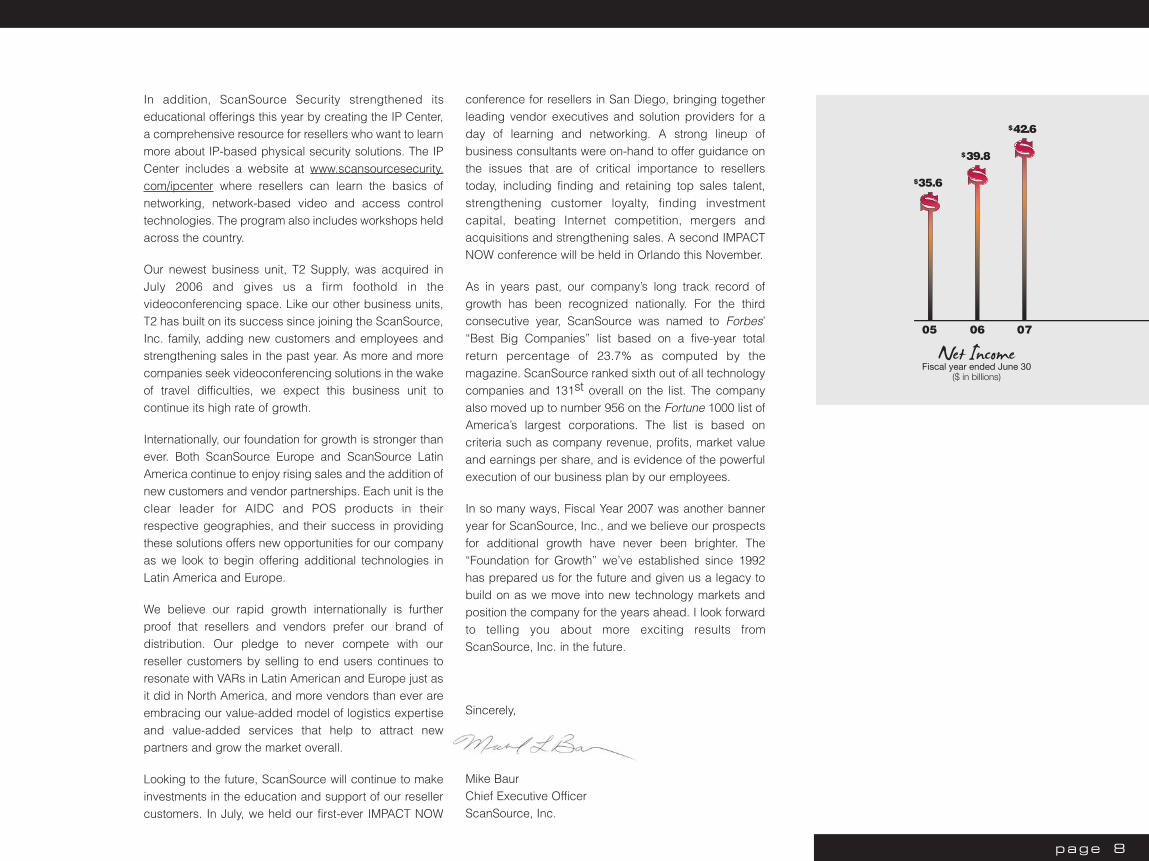
ScanSource posted record net sales revenues of $1.99billion this year, up 19% from $1.67 billion for the yearended June 30, 2006. In addition, net income rose to$42.6 million compared to $39.8 million for the previousyear. And diluted earnings per share increased to $1.63,moving up from $1.53 per share in Fiscal Year 2006.
p a g e 6
SOMEONE FROMSCANSOURCE SALES OR
MERCHANDISING
“Each time we bring our brand of distribution into a new technology market, we focus on the same core principles-offering fast, hassle-free delivery and maintaining a large inventory of the best-of-breed products in the industry so that our customers can always get what they want, when they want it.”
Mike BaurChief Executive OfficerScanSource, Inc.
In the 15 years since our founding in 1992, theemployees of ScanSource, Inc. have built a stronglegacy that continues to guide our company into thefuture. In the beginning, our mission was clear andprecise: to help our manufacturer partners grow bybringing an unprecedented level of efficiency, logisticsexpertise and value-added services to an area of thetechnology marketplace that wasn’t currently served byour two-tier distribution model.
And in the years since, that idea has served asScanSource’s “Foundation for Growth” as we havemoved from serving the Automatic Identification andData Capture (AIDC) and Point-of-Sale (POS) marketsinto new technology segments such as Convergence,Security and Videoconferencing. Each time we bring ourbrand of distribution into a new technology market, wefocus on the same core principles – offering fast, hassle-free delivery, maintaining a large inventory of the best-of-breed products in the industry, recruiting new resellers to

The past year was one of significant progress for ourcompany in a number of areas.
We’re excited about two well-deserved promotions onour executive team that will have a significant impact onour future success. In June 2007, Scott Benbenek wasnamed President of Worldwide Operations after servingas Executive Vice President, Corporate Operations, since2002. Scott will oversee operations for all business unitsin all geographies under my direction and will beresponsible for managing the company’s continued profitin all of its technology segments. In addition, AndreaMeade was promoted to Executive Vice President ofOperations and Corporate Development after serving asExecutive Vice President, Corporate Operations, since 2002.
Both Scott and Andrea possess a wealth of distributionexperience and are strategic leaders who will be criticalto our growth in the future. Having them in these keypositions gives our executive management teamincreased capacity and leadership.
Additionally, our company is building on its “Foundationfor Growth” in other ways that will prepare us for futuresuccess. In April 2007, we announced the plannedrelocation of our Memphis distribution center to a facilityin Southaven, Mississippi, that will accommodate nearly600,000 square feet with an optional additional 147,000square feet of available expansion space – aconsiderable increase from the 367,000 square feetavailable in our current distribution center. The newlocation will be even closer to the Memphis airport andthe major freight carrier hubs in the region and ensuresthat we will continue to have a large inventory that isready to ship as our company grows.
Also in April, we increased our multi-currency creditfacility to $200 million under the same terms andconditions as our previous facility. This agreement givesus the flexibility to continue to grow our operations andmake strategic investments for the future.
Our Automatic Identification and Data Capture and Point-of-Sale business unit continues to take advantage of the
many opportunities for growth through the increasedadoption of new mobility solutions and other factors.Vendors are continuing to shift more business to theindirect channel, and we look for continued growth inthese markets. We strengthened our line card in thissegment in 2007, adding wireless solutions from Cisco toour product lineup. This new relationship gives ourcustomers access to leading wireless network products,helping them stay on the leading edge and remaincompetitive in their offerings.
The Catalyst Telecom and Paracon business unitscontinue to deliver solid results, with new opportunitiesavailable through the emergence of Voice over IP (VoIP)in the convergence space. Catalyst introduced acomprehensive convergence education program,CommEdge, to help dealers take advantage of thisgrowing technology. CommEdge includes training atsites throughout the country, plus an online web portalwith a wide variety of resources for getting started.Paracon will benefit from the renewed focus of one of itsleading vendors, which occurred when Eicon purchasedthe media and signaling business from Intel in October2006 and re-branded the company as Dialogic. Dialogicis focused exclusively on creating world-classconvergence products, and Paracon’s strong partnershipwith the company bodes well for the future.
ScanSource Security continued its rapid growth rate thisyear, adding a host of new vendors to its line card,including Sony Electronics, Axis Communications, DSCand DVTel, among many others. The company istransforming the way security products are purchasedand delivered. When ScanSource Security was foundedin late 2004, the bulk of its sales were of card printersolutions, which had previously been part of theScanSource line card. In the years since, ScanSourceSecurity has experienced tremendous growth in the salesof traditional security products such as surveillance,intrusion and access control solutions, providingpowerful evidence that our two-tier model is re-shapingthe security marketplace and giving security dealers aviable option for faster delivery and expert logistics.
p a g e 7
05
$1.47
Net SalesFiscal year ended June 30($ in billions)
06
$1.67
07
$1.99
In addition, ScanSource Security strengthened itseducational offerings this year by creating the IP Center,a comprehensive resource for resellers who want to learnmore about IP-based physical security solutions. The IPCenter includes a website at www.scansourcesecurity.com/ipcenter where resellers can learn the basics ofnetworking, network-based video and access controltechnologies. The program also includes workshops heldacross the country.
Our newest business unit, T2 Supply, was acquired inJuly 2006 and gives us a firm foothold in thevideoconferencing space. Like our other business units,T2 has built on its success since joining the ScanSource,Inc. family, adding new customers and employees andstrengthening sales in the past year. As more and morecompanies seek videoconferencing solutions in the wakeof travel difficulties, we expect this business unit tocontinue its high rate of growth.
Internationally, our foundation for growth is stronger thanever. Both ScanSource Europe and ScanSource LatinAmerica continue to enjoy rising sales and the addition ofnew customers and vendor partnerships. Each unit is theclear leader for AIDC and POS products in theirrespective geographies, and their success in providingthese solutions offers new opportunities for our companyas we look to begin offering additional technologies inLatin America and Europe.
We believe our rapid growth internationally is furtherproof that resellers and vendors prefer our brand ofdistribution. Our pledge to never compete with ourreseller customers by selling to end users continues toresonate with VARs in Latin American and Europe just asit did in North America, and more vendors than ever areembracing our value-added model of logistics expertiseand value-added services that help to attract newpartners and grow the market overall.
Looking to the future, ScanSource will continue to makeinvestments in the education and support of our resellercustomers. In July, we held our first-ever IMPACT NOW
conference for resellers in San Diego, bringing togetherleading vendor executives and solution providers for aday of learning and networking. A strong lineup ofbusiness consultants were on-hand to offer guidance onthe issues that are of critical importance to resellerstoday, including finding and retaining top sales talent,strengthening customer loyalty, finding investmentcapital, beating Internet competition, mergers andacquisitions and strengthening sales. A second IMPACTNOW conference will be held in Orlando this November.
As in years past, our company’s long track record ofgrowth has been recognized nationally. For the thirdconsecutive year, ScanSource was named to Forbes’“Best Big Companies” list based on a five-year totalreturn percentage of 23.7% as computed by themagazine. ScanSource ranked sixth out of all technologycompanies and 131st overall on the list. The companyalso moved up to number 956 on the Fortune 1000 list ofAmerica’s largest corporations. The list is based oncriteria such as company revenue, profits, market valueand earnings per share, and is evidence of the powerfulexecution of our business plan by our employees.
In so many ways, Fiscal Year 2007 was another banneryear for ScanSource, Inc., and we believe our prospectsfor additional growth have never been brighter. The“Foundation for Growth” we’ve established since 1992has prepared us for the future and given us a legacy tobuild on as we move into new technology markets andposition the company for the years ahead. I look forwardto telling you about more exciting results fromScanSource, Inc. in the future.
Sincerely,
Mike BaurChief Executive OfficerScanSource, Inc.
p a g e 8
05
$35.6
Net IncomeFiscal year ended June 30($ in billions)
06
$39.8
07
$42.6

Selected Financial Data
The selected financial data below should be read in conjunction with “Management’s Discussion and Analysis” and ScanSource, Inc.’s (the “Company”) consolidatedfinancial statements and related notes thereto included elsewhere in this annual report.
The following statement of income data and balance sheet data were derived from the Company’s consolidated financial statements.
Fiscal Year Ended June 30,
2007 2006 2005 2004 2003
(In thousands, except per share data)
Statement of income data:Net sales $1,986,927 $1,665,600 $1,469,094 $1,192,090 $991,194Cost of goods sold 1,776,255 1,497,248 1,319,368 1,060,310 879,311
Gross profit 210,672 168,352 149,726 131,780 111,883Selling, general and administrative expenses 135,339 105,042 90,970 83,601 72,970
Operating income 75,333 63,310 58,756 48,179 38,913Interest expense (income), net 6,804 1,620 1,264 601 869Other expense (income), net (144) 57 (413) (169) 501
Total other expense 6,660 1,677 851 432 1,370
Income before income taxes, minority interest and extraordinary gain 68,673 61,633 57,905 47,747 37,543Provision for income taxes 25,987 21,592 22,010 18,489 15,690Minority interest in income of consolidated subsidiaries, net of taxes 60 225 291 137 530
Net income $ 42,626 $ 39,816 $ 35,604 $ 29,121 $ 21,323
Net income per common share, basic $ 1.65 $ 1.56 $ 1.41 $ 1.17 $ 0.89
Weighted-average shares outstanding, basic 25,773 25,491 25,254 24,970 24,026
Net income per share, assuming dilution $ 1.63 $ 1.53 $ 1.37 $ 1.13 $ 0.87
Weighted-average shares outstanding, assuming dilution 26,213 26,034 25,927 25,775 24,575
As of June 30,
2007 2006 2005 2004 2003
Balance sheet data:Working capital $ 352,955 $ 262,171 $ 219,851 $ 184,626 $113,711Total assets 738,448 617,497 469,604 414,764 345,716Total long-term obligations (including current portion) 107,730 32,185 37,878 40,007 8,299Total shareholders’ equity 324,744 273,409 225,212 184,752 149,108
9

Management’s Discussion and Analysis
Certain statements within this annual report to shareholders and the documents incorporated by reference herein that are not historical facts are “forward-lookingstatements” as described in the “safe harbor” provision of the Private Securities Litigation Reform Act of 1995. These statements involve a number of risks anduncertainties and actual results could differ materially from those projected. Factors that could cause actual results to differ materially include the following: the mattersrelated to the investigation by the Special Committee, and related activities, as described in more detail Note 1A to the Notes to Consolidated Financial Statementsincluded Part II, Item 8 of the Company’s amended Annual Report on Form 10-K/A for the year ended June 30, 2006, the Company’s dependence on vendors, productsupply and availability, senior management, centralized functions and third-party shippers; the Company’s ability to compete successfully in a highly competitive marketand to manage significant additions in personnel and increases in working capital; the Company’s ability to collect outstanding accounts receivable; the Company’s entryinto new product markets in which it has no prior experience; the Company’s susceptibility to quarterly fluctuations in net sales and results of operations; the Company’sability to manage successfully pricing or stock rotation opportunities associated with inventory value decreases; narrow profit margins; inventory risks due to shifts inmarket demand; dependence on information systems; credit exposure due to the deterioration in the financial condition of our customers; a downturn in the generaleconomy; the inability to obtain required capital; potential adverse effects of acquisitions; fluctuations in interest rates, foreign currency exchange rates and exposure toforeign markets (the imposition of governmental controls, currency devaluations, export license requirements, restrictions on the export of certain technology, dependenceon third party freight forwarders and the third party warehouse in Europe, political instability, trade restrictions, tariff changes, difficulties in staffing and managinginternational operations, changes in the interpretation and enforcement of laws (in particular related to items such as duty and taxation), difficulties in collecting accountsreceivable, longer collection periods and the impact of local economic conditions and practices); the impact of changes in income tax legislation; acts of war or terrorism;exposure to natural disasters; potential impact of labor strikes; volatility of common stock; the accuracy of forecast data and changes in accounting standards. Additionaldiscussion of these and other factors affecting our business and prospects is contained in our periodic filings with the SEC, copies of which can be obtained at ourInvestor Relations website at www.scansource.com. Please refer to the cautionary statements and important factors discussed in Item 1A “Risk Factors” of the Company’sAnnual Report on Form 10-K for the year ended June 30, 2007 for further information. This discussion and analysis should be read in conjunction with “SelectedFinancial Data” and the Financial Statements and the Notes thereto included elsewhere in this Annual Report.
Overview
ScanSource, Inc. is a leading distributor of specialty technology products, providing value-added distribution sales to resellers in the specialty technology markets.The Company distributes more than 40,000 products worldwide. The Company has two geographic distribution segments: one serving North America from the Memphis,Tennessee distribution center, and an international segment currently serving Latin America (including Mexico) and Europe. The North American distribution segmentmarkets automatic identification and data capture (“AIDC”) and point-of-sale (“POS”) products through the ScanSource sales unit; voice, data and convergedcommunications equipment through its Catalyst Telecom sales unit; voice, data and converged communications products through its Paracon sales unit; videoconferencing and telephony products through its T2 Supply unit; electronic security products and wireless infrastructure products through its ScanSource SecurityDistribution unit. The international distribution segment markets AIDC and POS products through its ScanSource sales unit.
The Company was incorporated in December 1992 and is headquartered in Greenville, South Carolina. The Company serves North America from a single, centrallylocated distribution center located near the FedEx hub in Memphis, Tennessee (expected to be relocated to Southaven, Mississippi in October 2007). The singlewarehouse and strong management information system form the cornerstone of the Company’s cost-driven operational strategy that, along with our growth throughacquisitions and organic market share increases, has caused operating income to grow at an average annual growth rate of 20.0% over the past five years, while saleshave grown at an average annual rate of 18.8% to approximately $2.0 billion over the same period. This strategy has been expanded to Latin America and Europe, withdistribution centers located in Florida and Mexico, and in Belgium, respectively.
10

North American Distribution Segment
The Company’s North American distribution segment sells products exclusively to resellers and integrators in large and growing technology markets. Key AIDCvendors include Cisco, Datalogic, Handheld Products, Intermec, Metrologic, Motorola and Zebra, and some leading POS lines include APG, Cherry Elo, Epson, IBM,Microsoft, NCR, and Posiflex. Key communications vendors include Avaya, Extreme Networks, Juniper Networks, Plantronics and Polycom, while Dialogic supplies keycomponents for the converged communications market. Key electronic security vendors include Alvarion, Axis, Datacard, DSC, Fargo, HID, Keyscan, Panasonic, Sony,Tropos and Zebra Card. In July 2006, the Company purchased the assets of T2 Supply, LLC (“T2”) allowing the Company to enhance its long-term convergence strategyby adding video conferencing products and expertise, and to provide cross-selling opportunities to T2’s customer base of voice and video conferencing resellers. Growth innet sales has been principally driven by the acquisition of T2, intensive marketing efforts to recruit new reseller customers, selective expansion of the Company’s productlines, and the addition of new vendors. During fiscal 2008, the North American distribution center located in Memphis, Tennessee will be replaced when the Companyrelocates to a 600,000 square foot facility in Southaven, Mississippi in order to meet the current and near-term growth requirements of the North American business.
International Distribution Segment
The Company’s international distribution segment sells AIDC and POS products exclusively to resellers and integrators in the Latin American (including Mexican) andEuropean markets principally from the same product manufacturers as those sold by the North American distribution segment. Marketing efforts to recruit new resellercustomers, competitive product pricing, the addition of new vendors, and strategic acquisitions have driven growth in net sales.
The international distribution segment commenced operations in November 2001, when the Company acquired 52% of the common stock of Netpoint International,Inc. (“Netpoint”), a Miami-based distributor of AIDC and POS equipment to the Latin American market. In January 2002, the Company launched its pan-Europeanstrategy with the establishment of a distribution center and sales office in Belgium. In May 2002, the Company purchased ABC Technology Distribution (“ABC”), adistributor of AIDC and POS products based in the United Kingdom, allowing the Company to expand its European operations and make additional sales to former ABCcustomers in the United Kingdom. In March 2003, the Company completed its consolidation of the UK distribution center into the Belgium facility. In April 2005, theCompany purchased Europdata Connect UK Ltd. (“EDC”), expanding its presence in the UK and the Netherlands. The Company has centralized its accounting,merchandising, information technology and sales management in the Belgium headquarters location.
Cost Control/Profitability
The Company’s operating income growth has been driven by increasing gross profit and disciplined control of operating expenses. The Company’s operations featurea scalable information system, streamlined management, and centralized distribution, enabling it to achieve the economies of scale necessary for cost-effective orderfulfillment. From its inception, the Company has managed its general and administrative expenses by maintaining strong cost controls. However, in order to continue togrow its markets, the Company has invested in new initiatives including investments in new geographic markets of Europe and Latin America, increased marketing effortsto recruit resellers, enhancements of employee benefit plans to retain employees, and in the strategic acquisition of T2 by the North American distribution segment.
11

Results of Operations
The following table sets forth for the periods indicated certain income and expense items as a percentage of net sales:
Fiscal Year Ended June 30,
2007 2006 2005
Statement of income data:Net sales 100.0% 100.0% 100.0%Cost of goods sold 89.4 89.9 89.8
Gross profit 10.6 10.1 10.2Selling, general and administrative expenses 6.8 6.3 6.2
Operating income 3.8 3.8 4.0Interest expense (income), net 0.3 0.1 0.1Other expense (income), net — — —
Total other expense 0.3 0.1 0.1
Income before income taxes and minority interest 3.5 3.7 3.9Provision for income taxes 1.3 1.3 1.5Minority interest in income of consolidated subsidiaries, net of income taxes — — —
Net income 2.2% 2.4% 2.4%
12

Comparison of Fiscal Years Ended June 30, 2007 and 2006
Net Sales
The following tables summarize the Company’s net sales results (net of inter-segment sales):
Product Category
2007 2006 DifferencePercentage
Change
(In thousands)AIDC, POS and security products $1,200,497 $ 988,338 $212,159 21.5%Communications products 786,430 677,262 109,168 16.1%
Net Sales $1,986,927 $1,665,600 $321,327 19.3%
Geographic Segments
2007 2006 DifferencePercentage
Change
(In thousands)North American distribution $1,669,648 $1,441,791 $227,857 15.8%International distribution 317,279 223,809 93,470 41.8%
Net Sales $1,986,927 $1,665,600 $321,327 19.3%
North American Distribution
North American distribution sales include sales to technology resellers in the United States and Canada from the Company’s Memphis, Tennessee distribution center.Sales to technology resellers in Canada account for less than 5% of total net sales for the fiscal years ended June 30, 2007 and 2006. The 15.8% increase in NorthAmerican distribution sales for the year ended June 30, 2007, as compared to the same period in the prior year, was due to strong AIDC and communication sales.
Sales of the AIDC, POS and security product categories for the North America distribution segment increased 15.5% as compared to the prior year. The ScanSourceselling unit benefited from the AIDC business’s gain in market share. Training, education and marketing investments for the ScanSource Security Distribution sales unitalso contributed to the gain in market share.
Sales of communications products increased 16.1% as compared to the prior year. The communications business included increased market share for T2 Supply, asales unit acquired on July 3, 2006. The majority of the increase in the communications products business was due to the inclusion of T2 Supply in this year’s results.Both Catalyst Telecom and Paracon, which distribute communication products, experienced sales growth due to increased market share in certain lines and the additionof new vendors.
International Distribution
The international distribution segment includes sales to Latin America (including Mexico) and Europe from the ScanSource selling unit. Sales for the overallinternational segment increased approximately 41.8% or $93.5 million as compared to the prior year. The increase in sales was primarily attributable to gain in marketshare in Europe and Latin America. Strong sales growth for the year ended June 30, 2007 was experienced in the United Kingdom, France, Germany, Mexico, Argentinaand Chile compared to the prior year.
13
Sales during the year ended June 30, 2007 were favorably impacted by foreign exchange fluctuations of $16.9 million. Without the foreign exchange fluctuations, theincrease for the year would have been 34.2% or $76.6 million. Although management cannot forecast the future direction of foreign exchange rate movements, ifsignificant unfavorable changes in exchange rates occur, net sales of the segment could be adversely affected.
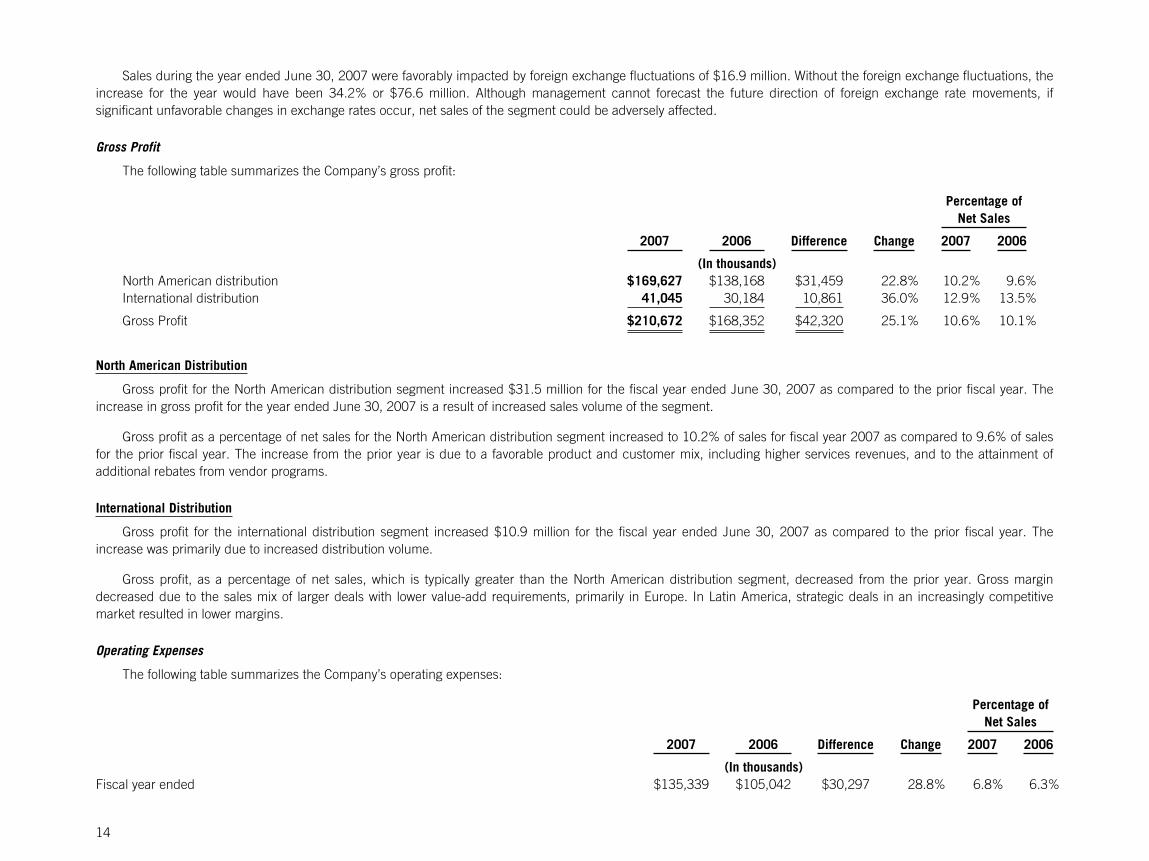
Gross Profit
The following table summarizes the Company’s gross profit:
Percentage ofNet Sales
2007 2006 Difference Change 2007 2006
(In thousands)North American distribution $169,627 $138,168 $31,459 22.8% 10.2% 9.6%International distribution 41,045 30,184 10,861 36.0% 12.9% 13.5%
Gross Profit $210,672 $168,352 $42,320 25.1% 10.6% 10.1%
North American Distribution
Gross profit for the North American distribution segment increased $31.5 million for the fiscal year ended June 30, 2007 as compared to the prior fiscal year. Theincrease in gross profit for the year ended June 30, 2007 is a result of increased sales volume of the segment.
Gross profit as a percentage of net sales for the North American distribution segment increased to 10.2% of sales for fiscal year 2007 as compared to 9.6% of salesfor the prior fiscal year. The increase from the prior year is due to a favorable product and customer mix, including higher services revenues, and to the attainment ofadditional rebates from vendor programs.
International Distribution
Gross profit for the international distribution segment increased $10.9 million for the fiscal year ended June 30, 2007 as compared to the prior fiscal year. Theincrease was primarily due to increased distribution volume.
Gross profit, as a percentage of net sales, which is typically greater than the North American distribution segment, decreased from the prior year. Gross margindecreased due to the sales mix of larger deals with lower value-add requirements, primarily in Europe. In Latin America, strategic deals in an increasingly competitivemarket resulted in lower margins.
Operating Expenses
The following table summarizes the Company’s operating expenses:
Percentage ofNet Sales
2007 2006 Difference Change 2007 2006
(In thousands)Fiscal year ended $135,339 $105,042 $30,297 28.8% 6.8% 6.3%
14
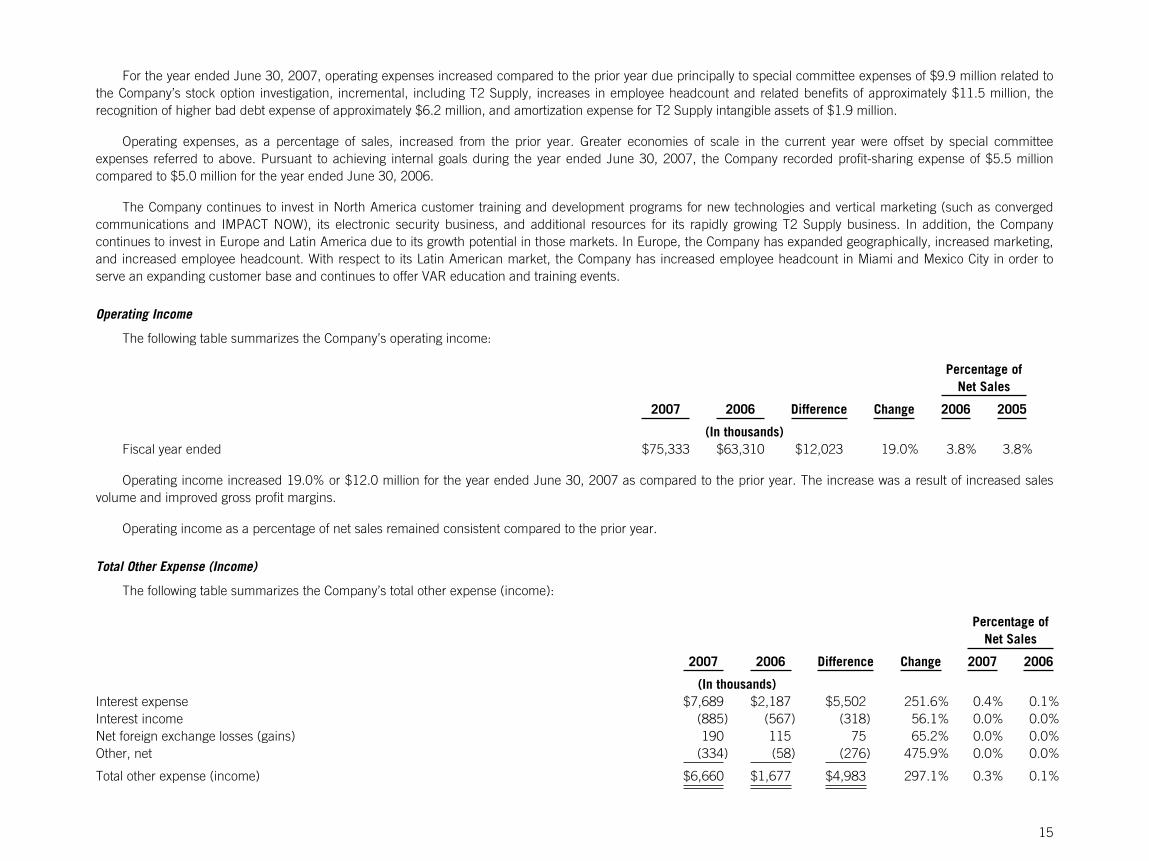
For the year ended June 30, 2007, operating expenses increased compared to the prior year due principally to special committee expenses of $9.9 million related tothe Company’s stock option investigation, incremental, including T2 Supply, increases in employee headcount and related benefits of approximately $11.5 million, therecognition of higher bad debt expense of approximately $6.2 million, and amortization expense for T2 Supply intangible assets of $1.9 million.
Operating expenses, as a percentage of sales, increased from the prior year. Greater economies of scale in the current year were offset by special committeeexpenses referred to above. Pursuant to achieving internal goals during the year ended June 30, 2007, the Company recorded profit-sharing expense of $5.5 millioncompared to $5.0 million for the year ended June 30, 2006.
The Company continues to invest in North America customer training and development programs for new technologies and vertical marketing (such as convergedcommunications and IMPACT NOW), its electronic security business, and additional resources for its rapidly growing T2 Supply business. In addition, the Companycontinues to invest in Europe and Latin America due to its growth potential in those markets. In Europe, the Company has expanded geographically, increased marketing,and increased employee headcount. With respect to its Latin American market, the Company has increased employee headcount in Miami and Mexico City in order toserve an expanding customer base and continues to offer VAR education and training events.
Operating Income
The following table summarizes the Company’s operating income:
Percentage ofNet Sales
2007 2006 Difference Change 2006 2005
(In thousands)Fiscal year ended $75,333 $63,310 $12,023 19.0% 3.8% 3.8%
Operating income increased 19.0% or $12.0 million for the year ended June 30, 2007 as compared to the prior year. The increase was a result of increased salesvolume and improved gross profit margins.
Operating income as a percentage of net sales remained consistent compared to the prior year.
Total Other Expense (Income)
The following table summarizes the Company’s total other expense (income):
Percentage ofNet Sales
2007 2006 Difference Change 2007 2006
(In thousands)Interest expense $7,689 $2,187 $5,502 251.6% 0.4% 0.1%Interest income (885) (567) (318) 56.1% 0.0% 0.0%Net foreign exchange losses (gains) 190 115 75 65.2% 0.0% 0.0%Other, net (334) (58) (276) 475.9% 0.0% 0.0%
Total other expense (income) $6,660 $1,677 $4,983 297.1% 0.3% 0.1%
15
Interest expense for the years ended June 30, 2007 and 2006 was $7.7 million and $2.2 million, respectively, reflecting interest paid on borrowings on theCompany’s line of credit and long-term debt. Interest expense for the current year increased primarily due to higher average debt balances as a result of the acquisition ofT2 Supply at the beginning of the fiscal year and to additional working capital requirements financed through an increase in the revolving credit facility.
Interest income for the year ended June 30, 2007 increased by approximately $318,000 over the prior year, principally as a result of higher interest-bearingreceivables.
Foreign exchange gains and losses consist of foreign currency transactional and functional currency re-measurements, offset by net foreign currency exchangecontract gains and losses. Net foreign exchange losses were $190,000 and $115,000 for the years ended June 30, 2007 and 2006, respectively. The change in foreignexchange gains and losses for the year ended June 30, 2007 as compared to the prior year are primarily the result of fluctuations in the value of the Euro versus theBritish Pound, and to a lesser extent, the U.S. Dollar versus other currencies. The Company utilizes foreign exchange contracts and debt in non-functional currencies tohedge foreign currency exposure. The Company’s foreign exchange policy prohibits entering into speculative transactions.
Provision For Income Taxes
Income tax expense was $26.0 million and $21.6 million for the years ended June 30, 2007 and 2006, respectively, reflecting an effective income tax rate of 37.8%and 35.0%, respectively. The increase in the tax rate is attributable to the prior year utilization of foreign net operating loss carryforwards.
Minority Interest in Income of Consolidated Subsidiaries
The Company recorded $60,000 and $225,000, respectively, of minority interest income in fiscal 2007 and 2006 for Netpoint’s minority shareholders. The decreasein minority interest income relates to the Company’s purchase of additional equity in Netpoint.
Net Income
The following table summarizes the Company’s net income:
Percentage ofNet Sales
2007 2006 Difference Change 2007 2006
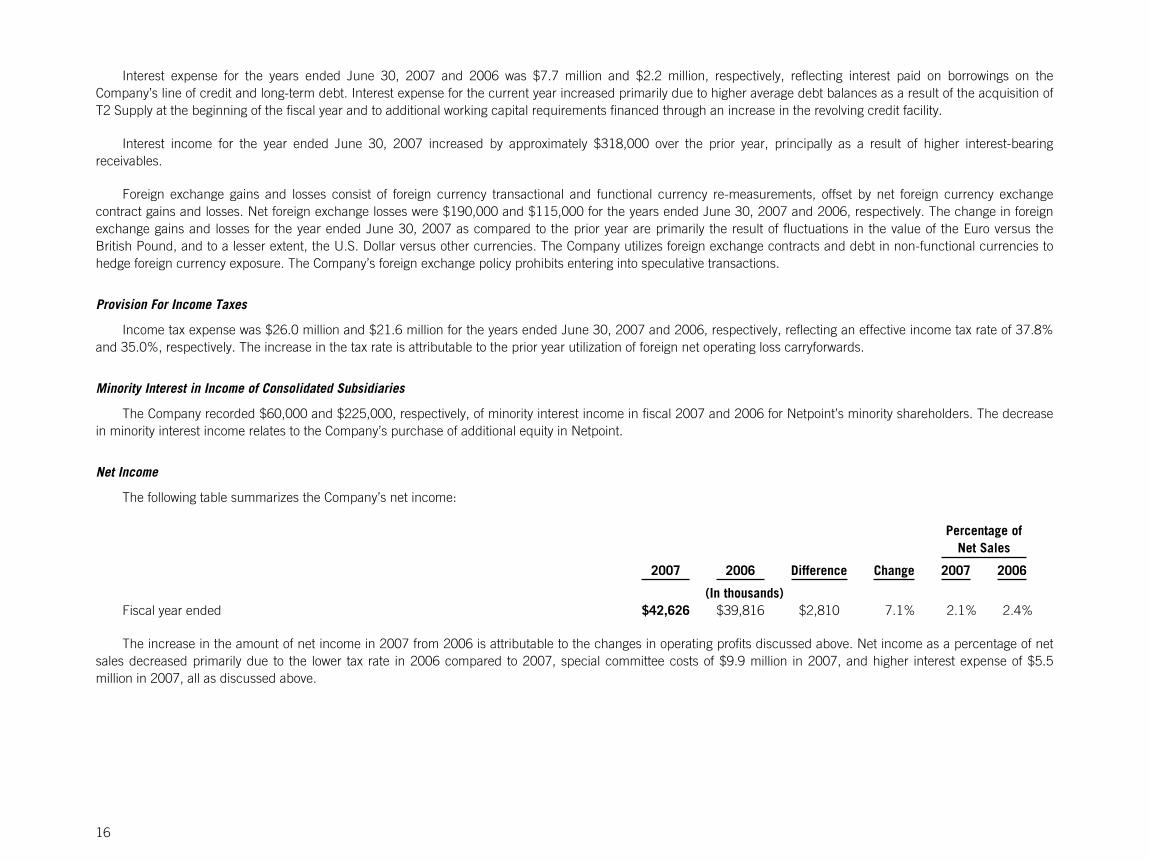
(In thousands)Fiscal year ended $42,626 $39,816 $2,810 7.1% 2.1% 2.4%
The increase in the amount of net income in 2007 from 2006 is attributable to the changes in operating profits discussed above. Net income as a percentage of netsales decreased primarily due to the lower tax rate in 2006 compared to 2007, special committee costs of $9.9 million in 2007, and higher interest expense of $5.5million in 2007, all as discussed above.
16

Comparison of Fiscal Years Ended June 30, 2006 and 2005
Net Sales
The following tables summarize the Company’s net sales results (net of inter-segment sales):
Product Category
2006 2005 DifferencePercentage
Change
(In thousands)AIDC and POS products $ 988,338 $ 876,069 $112,269 12.8%Converged communications products 677,262 593,025 84,237 14.2%
Net Sales $1,665,600 $1,469,094 $196,506 13.4%
Geographic Segments
2006 2005 DifferencePercentage
Change
(In thousands)North American distribution $1,441,791 $1,296,211 $145,580 11.2%International distribution 223,809 172,883 50,926 29.5%
Net Sales $1,665,600 $1,469,094 $196,506 13.4%
North American Distribution
North American distribution sales include sales to technology resellers in the United States and Canada from the Company’s Memphis, Tennessee distribution center.Sales to technology resellers in Canada account for less than 5% of total net sales for the fiscal years ended June 30, 2006 and 2005. The 11.2% increase in NorthAmerican distribution sales for the year ended June 30, 2006, as compared to the same period in the prior year, was due to gain in market share and new product lines.
Sales of the AIDC and POS product categories for the North America distribution segment increased 8.7% as compared to the prior year. Sales for the ScanSourceSecurity Distribution sales unit, created during the quarter ended December 31, 2004, were immaterial for the year ended June 30, 2006 and have been included in theAIDC and POS product category for both periods. The ScanSource selling unit benefited from market share gain in AIDC and POS products, and from an increase in thenumber of large resellers who had previously purchased direct from manufacturers.
Sales of converged communications products increased 14.2% as compared to the prior year. Both Catalyst Telecom, which distributes small and medium business(SMBS) and enterprise (ECG) products, and Paracon, which distributes communication products, experienced sales growth due to new product lines and increaseddemand.
International Distribution
The international distribution segment includes sales to Latin America (including Mexico) and Europe from the ScanSource selling unit. Sales for the overallinternational segment increased approximately 29.5% or $50.9 million as compared to the prior year. The increase in sales was primarily attributable to obtainingadditional AIDC market share in Europe and Latin America. Strong sales growth for the year ended June 30, 2006 was experienced in Mexico, the United Kingdom,France, Germany, Belgium and the Netherlands compared to the prior year.
17

Sales during the year ended June 30, 2006 were negatively impacted by foreign exchange fluctuations of $7.4 million. Without the foreign exchange fluctuations, theincrease for the year would have been 33.7% or $58.3 million. Although management cannot forecast the future direction of foreign exchange rate movements, ifsignificant unfavorable changes in exchange rates occur, net sales of the segment could be adversely affected.
Gross Profit
The following table summarizes the Company’s gross profit:
2006 2005 Difference Change
Percentage of Net Sales
2006 2005
(In thousands)North American distribution $138,168 $130,411 $ 7,757 5.9% 9.6% 10.1%International distribution 30,184 19,315 10,869 56.3% 13.5% 11.2%
Gross Profit $168,352 $149,726 $18,626 12.4% 10.1% 10.2%
North American Distribution
Gross profit for the North American distribution segment increased $7.8 million for the fiscal year ended June 30, 2006 as compared to the prior fiscal year. Theincrease in gross profit for the year ended June 30, 2006 is a result of increased sales volume of the segment.
Gross profit as a percentage of net sales for the North American distribution segment decreased to 9.6% of sales for fiscal year 2006 as compared to 10.1% of salesfor the prior fiscal year. The decrease from the prior year is due to a greater percentage of orders to larger resellers who have a lower value-add requirement, and tochanges in vendor purchasing programs, which had the effect of increasing unit costs. The change in vendor purchasing programs is a combination of decreasedprogram benefits and higher year on year sales volume with fixed dollar incentives on certain programs.
International Distribution
Gross profit for the international distribution segment increased $10.9 million for the fiscal year ended June 30, 2006 as compared to the prior fiscal year. Theincrease was primarily due to increased volume, and increased volume related benefits of vendor programs in the current year.
Gross profit, as a percentage of net sales, which is typically greater than the North American distribution segment, increased over the prior year. Gross marginincreased due to the mix of sales to large resellers with lower value-add requirements, which was higher in the prior year, primarily in Europe, and to the volume relatedbenefits of vendor programs in the current year.
Operating Expenses
The following table summarizes the Company’s operating expenses:
2006 2005 Difference Change
Percentage of Net Sales
2006 2005
(In thousands)Fiscal year ended $105,042 $90,970 $14,072 15.5% 6.3% 6.2%
18

For the year ended June 30, 2006, operating expenses as a percentage of sales increased slightly compared to the prior year. The increase is due principally to therecognition of $3.2 million in compensation expense related to the Company’s adoption of Financial Accounting Standards Board (“FASB”) Statement No. 123(R).
The year ended June 30, 2006 benefited from greater economies of scale, especially internationally, partially offset by expenses associated with the Company’sworldwide expansion of capacity and employee headcount. Further, the Company continued investment in its security business, and investment in value added servicesand marketing programs for customers. Pursuant to achieving internal goals during the year ended June 30, 2006, the Company recorded profit-sharing expense of $5.0million compared to $4.3 million for the year ended June 30, 2005.
Operating Income
The following table summarizes the Company’s operating income:
2006 2005 Difference Change
Percentage of Net Sales
2006 2005
(In thousands)Fiscal year ended $63,310 $58,756 $4,554 7.8% 3.8% 4.0%
Operating income increased 7.8% or $4.5 million for the year ended June 30, 2006 as compared to the prior year. The increase was a result of increased salesvolume and improved international gross profit margin percentages.
Operating income as a percentage of net sales decreased compared to the prior year. The decrease is primarily due to additional compensation expense related tothe Company’s adoption of FASB Statement No. 123(R).
Total Other Expense (Income)
The following table summarizes the Company’s total other expense (income):
2006 2005 Difference Change
Percentage of Net Sales
2006 2005
(In thousands)Interest expense $2,187 $2,127 $ 60 2.8% 0.1% 0.1%Interest income (567) (863) 296 -34.3% 0.0% -0.1%Net foreign exchange losses (gains) 115 (355) 470 -132.4% 0.0% 0.0%Other, net (58) (58) — 0.0% 0.0% 0.0%
Total other expense (income) $1,677 $ 851 $826 97.1% 0.1% 0.1%
Interest expense for the years ended June 30, 2006 and 2005 was $2.2 million and $2.1 million, respectively, reflecting interest paid on borrowings on theCompany’s line of credit and long-term debt. Interest expense for the year remained comparable to the prior year due to higher interest rates on lower average borrowingson the Company’s line of credit over the past year.
19

Interest income for the year ended June 30, 2006 decreased by approximately $0.3 million over the prior year, principally as a result of lower interest-bearingreceivables.
Foreign exchange gains and losses consist of foreign currency transactional and functional currency re-measurements, offset by net foreign currency exchangecontract gains and losses. A net foreign exchange gain of $0.1 million occurred for the year ended June 30, 2006 and a net foreign exchange loss of $0.4 millionoccurred for the year ended June 30, 2005. The Company utilizes foreign exchange contracts and debt in non-functional currencies to hedge foreign currency exposure.The Company’s foreign exchange policy prohibits entering into speculative transactions.
Provision For Income Taxes
Income tax expense was $21.6 million and $22.0 million for the years ended June 30, 2006 and 2005, respectively, reflecting an effective income tax rate of 35.0%and 38.0%, respectively. The decrease in the tax rate is attributable to the current year utilization of foreign net operating loss carryforwards and the reversal of valuationallowances previously established on a portion of the Belgian deferred tax assets.
Minority Interest in Income of Consolidated Subsidiaries
The Company recorded $225,000 of minority interest income in fiscal 2006 for Netpoint’s minority shareholders. In fiscal year 2005, the Company recorded$291,000 of minority interest income for two majority-owned subsidiaries. The decrease in minority interest income relates to the Company’s purchase of additional equityin its subsidiaries. As of fiscal 2006, only Netpoint had a minority ownership.
Net Income
The following table summarizes the Company’s net income:
2006 2005 Difference Change
Percentage of Net Sales
2006 2005
(In thousands)Fiscal year ended $39,816 $35,604 $4,212 11.8% 2.4% 2.4%
The increase in the amount of net income in 2006 from 2005 is attributable to the changes in operating profits and provision for income taxes discussed above. Netincome as a percentage of net sales in 2006 remained comparable to 2005.
20

Quarterly Results
The following tables set forth certain unaudited quarterly financial data. The information has been derived from unaudited financial statements that, in the opinion ofmanagement, reflect all adjustments (consisting only of normal recurring adjustments) necessary for a fair presentation of such quarterly information. The operatingresults for any quarter are not necessarily indicative of the results to be expected for any future period.
All shares and per share amounts have been retroactively adjusted to reflect the two-for-one stock split effective June 5, 2006.
Three Months Ended
Fiscal 2007 Fiscal 2006
June 302007
Mar. 312007
Dec. 312006
Sept. 302006
June 302006
Mar. 312006
Dec. 312005
Sept. 302005
(In thousands, except per share data)Net sales $524,285 $492,678 $473,734 $496,230 $461,144 $405,592 $408,468 $390,396Cost of goods sold 469,265 441,641 420,957 444,392 416,216 364,332 366,633 350,067
Gross profit $ 55,020 $ 51,037 $ 52,777 $ 51,838 $ 44,928 $ 41,260 $ 41,835 $ 40,329
Net income $ 11,303 $ 10,071 $ 8,791 $ 12,461 $ 12,856 $ 9,006 $ 8,942 $ 9,013
Weighted-average shares outstanding, basic 25,843 25,770 25,749 25,729 25,680 25,555 25,402 25,333
Weighted-average shares outstanding, assumingdilution 26,258 26,194 26,236 26,213 26,163 26,101 25,994 25,883
Net income per common share, basic $ 0.44 $ 0.39 $ 0.34 $ 0.48 $ 0.50 $ 0.35 $ 0.35 $ 0.36
Net income per common share, assuming dilution $ 0.43 $ 0.38 $ 0.34 $ 0.48 $ 0.49 $ 0.35 $ 0.34 $ 0.35
In the quarter ended June 30, 2006 the effective tax rate was 28.6% versus 39.0% for the quarter ended June 30, 2007. The June 2006 quarterly rate reflects theintegration of foreign net operating loss carryforwards and the reversal of valuation allowances previously established on a portion of the Belgian deferred tax assets. Thishad the impact of $1.457 million or $.06 per share benefit to the quarter.
21

Critical Accounting Policies and Estimates
Management’s discussion and analysis of financial condition and results of operations are based upon the Company’s consolidated financial statements, which havebeen prepared in conformity with accounting principles generally accepted in the United States of America. The preparation of financial statements requires managementto make estimates and assumptions that affect the reported amounts of assets and liabilities and disclosure of contingent assets and liabilities at the date of the financialstatements and the reported amounts of revenues and expenses during the reporting period. On an ongoing basis management evaluates its estimates, including thoserelated to the allowance for uncollectible accounts receivable, inventory reserves to reduce inventories to the lower of cost or market, vendor incentives, goodwill andidentifiable intangible assets, deferred taxes and contingencies. Management bases its estimates on historical experience and on various other assumptions thatmanagement believes to be reasonable under the circumstances, the results of which form a basis for making judgments about the carrying value of assets and liabilitiesthat are not readily available from other sources. Actual results may differ materially from these estimates under different assumptions or conditions, however,management believes that its estimates, including those for the above-described items are reasonable and that the actual results will not vary significantly from theestimated amounts. For further discussion of our significant accounting policies, refer to Note 2 of Notes to Consolidated Financial Statements.
Stock-Based Compensation
A revised standard, Statement of Financial Accounting Standards (“SFAS”) No. 123 (revised 2004), Share Based Payment (“SFAS 123(R)”), which requires allcompanies to measure compensation cost for all share-based payments (including stock options) at fair value, was effective beginning with a company’s first interim orannual reporting period of the first fiscal year beginning on or after June 15, 2005. This means SFAS 123(R) was effective for the Company beginning with the first quarterof fiscal year 2006, which began on July 1, 2005. The adoption of SFAS 123(R) requires the Company to apply a valuation model, which includes estimates andassumptions on the rate of forfeiture and expected life of options and stock price volatility. Actual results may differ from estimates. See Note 2 to the ConsolidatedFinancial Statements for additional information regarding the adoption of SFAS 123(R).
Revenue Recognition
Revenue is recognized once four criteria are met: (1) the Company must have persuasive evidence that an arrangement exists; (2) delivery must occur, whichhappens at the point of shipment (this includes the transfer of both title and risk of loss, provided that no significant obligations remain); (3) the price must be fixed anddeterminable; and (4) collectibility must be reasonably assured. A provision for estimated losses on returns is recorded at the time of sale based on historical experience.
The Company has service revenue associated with configuration and marketing, which is recognized when the work is complete and all obligations are substantiallymet. The Company also sells third-party services, such as maintenance contracts. Since the company is acting as an agent for these services, revenue is recognized net ofcost at the time of sale. Revenue from multiple element arrangements is allocated to the various elements based on the relative fair value of the elements, and eachrevenue cycle is considered a separate accounting unit with recognition of revenue based on the criteria met for the individual element of the multiple deliverables.
Allowances for Trade and Notes Receivable
The Company maintains an allowance for uncollectible accounts receivable for estimated losses resulting from customers’ failure to make payments on accountsreceivable due to the Company. Management determines the estimate of the allowance for uncollectible accounts receivable by considering a number of factors,including: (1) historical experience, (2) aging of the accounts receivable and (3) specific information obtained by the Company on the financial condition and the currentcreditworthiness of its customers. If the financial condition of the Company’s customers were to deteriorate and reduce the ability of the Company’s customers to makepayments on their accounts, the Company may be required to increase its allowance by recording additional bad debt expense. Likewise, should the financial condition ofthe Company’s customers improve and result in payments or settlements of previously reserved amounts, the Company may be required to record a reduction in bad debtexpense to reverse the recorded allowance. A provision for estimated losses on returns and allowances is recorded at the time of sale based on historical experience.
22

Inventory Reserves
Management determines the inventory reserves required to reduce inventories to the lower of cost or market based principally on the effects of technologicalchanges, quantities of goods on hand, and other factors. An estimate is made of the market value, less cost to dispose, of products whose value is determined to beimpaired. If these products are ultimately sold at less than estimated amounts, additional reserves may be required. Likewise, if these products are sold for more than theestimated amounts, reserves may be reduced.
Vendor Programs
The Company receives incentives from vendors related to cooperative advertising allowances, volume rebates and other incentive agreements. These incentives aregenerally under quarterly, semi-annual or annual agreements with the vendors. Some of these incentives are negotiated on an ad hoc basis to support specific programsmutually developed between the Company and the vendor. Vendors generally require that we use their cooperative advertising allowances exclusively for advertising orother marketing programs. Incentives received from vendors for specifically identified incremental cooperative advertising programs are recorded as adjustments toselling, general and administrative expenses. EITF Issue No. 02-16, Accounting by a Customer (Including a Reseller) for Certain Consideration Received from a Vendor(“EITF 02-16”) requires that a portion of these vendor funds in excess of our costs be reflected as a reduction of inventory. Such funds are recognized as a reduction ofthe cost of goods sold when the related inventory is sold.
The Company records unrestricted, volume rebates received as a reduction of inventory and as a reduction of the cost of goods sold when the related inventory issold. Amounts received or receivable from vendors that are not yet earned are deferred in the consolidated balance sheet. In addition, the Company may receive earlypayment discounts from certain vendors. The Company records early payment discounts received as a reduction of inventory and recognizes the discount as a reductionof cost of goods sold when the related inventory is sold. EITF 02-16 requires management to make certain estimates of the amounts of vendor incentives that will bereceived. Actual recognition of the vendor consideration may vary from management estimates based on actual results.
Property and Equipment
Property and equipment are recorded at cost. Depreciation is computed using the straight-line method over estimated useful lives of 3 to 5 years for furniture,equipment and computer software, 40 years for buildings and 15 years for building improvements. Leasehold improvements are amortized over the shorter of the leaseterm or the estimated useful life. Maintenance, repairs and minor renewals are charged to expense as incurred. Additions, major renewals and betterments to propertyand equipment are capitalized.
Goodwill
The Company accounts for recorded goodwill and other intangible assets in accordance with SFAS No. 142, Goodwill and Other Intangible Assets, which revised thestandards of accounting for goodwill, by replacing the amortization of these assets with the requirement that they are reviewed annually for impairment, or more frequentlyif impairment indicators exist. See Note 11, “Goodwill and Intangible Assets” to the Consolidated Financial Statements of the Company, for a discussion of the annualgoodwill impairment test.
Intangible Assets
Intangible assets consist of customer lists, debt issue costs, trade names, and non-compete agreements. Customer lists are amortized using the straight-line methodover their estimated useful lives, which range from 5 to 15 years. Debt issue costs are amortized over the term of the credit facility. Trade names are amortized over 10years. Non-compete agreements are amortized over their contract life. These assets are included in other assets and are shown in detail in Note 11, “Goodwill andIntangible Assets” to the Consolidated Financial Statements of the Company.
23

Impairment of Long-Lived Assets
The Company reviews its long-lived assets for impairment whenever events or changes in circumstances indicate that the carrying amount of the asset or asset groupmay not be recoverable. Tests for recoverability of a long-lived asset to be held and used are measured by comparing the carrying amount of the long-lived asset to thesum of the estimated future undiscounted cash flows expected to be generated by the asset. In estimating the future undiscounted cash flows we use projections of cashflows directly associated with, and which are expected to arise as a direct result of, the use and eventual disposition of the assets. If it is determined that a long-lived assetis not recoverable, an impairment loss would be calculated equal to the excess of the carrying amount of the long-lived asset over its fair value.
Deferred Income Taxes
Deferred income taxes are determined in accordance with SFAS No. 109, Accounting for Income Taxes. Deferred tax assets and liabilities are recognized for theexpected future tax consequences attributable to differences between the financial statement carrying amounts of existing assets and liabilities and their respective taxbases, and operating loss and tax credit carryforwards. The Company evaluates the tax assets and liabilities on a periodic basis and adjusts the balances as appropriate.
The Company records valuation allowances to reduce its deferred tax assets to the amount expected to be realized. In assessing the adequacy of recorded valuationallowances, the Company considers a variety of factors including, the scheduled reversal of deferred tax liabilities, future taxable income, and prudent and feasible taxplanning strategies. In the event the Company determines it would be able to use a deferred tax asset in the future in excess of its net carrying value, an adjustment to thedeferred tax asset would reduce income tax expense, thereby increasing net income in the period such determination was made. Likewise, should the Companydetermine that it was unable to use all or part of its net deferred tax asset in the future, an adjustment to the deferred tax asset would be charged to income tax expense,thereby reducing net income in the period such determination was made.
Contingencies
The Company accrues for contingent obligations, including estimated legal costs, when it is probable that a liability is incurred and the amount is reasonablyestimable. As facts concerning contingencies become known, management reassesses its position and makes appropriate adjustments to the financial statements.Estimates that are particularly sensitive to future changes include tax, legal, and other regulatory matters, which are subject to change as events evolve and as additionalinformation becomes available during the administrative and litigation process.
The Company received an assessment for a sales and use tax matter for the five calendar years ended 2003 and the first quarter ended March 31, 2004. Based onthis assessment, the Company has determined a probable range for the disposition of that assessment and for subsequent periods. Although the Company is disputingthe assessment, it accrued a liability of $1.3 million at June 30, 2005. As of June 30, 2007, the Company has paid approximately $1.0 million. The Company is disputingthe entire $1.3 million assessment including payments made on the liability. Although there can be no assurance of the ultimate outcome at this time, the Companyintends to vigorously defend its position.
Liquidity and Capital Resources
The Company’s primary sources of liquidity are cash flow from operations, borrowings under the revolving credit facility, and, to a lesser extent, borrowings under thesubsidiary’s line of credit, and proceeds from the exercise of stock options.
The Company’s cash and cash equivalent balance totaled $1.9 million at June 30, 2007 compared to $3.8 million at June 30, 2006. Domestic cash is generallyswept on a nightly basis to pay down the line of credit. The Company’s working capital increased from $262.2 million at June 30, 2006 to $353.0 million at June 30,2007. The increase in working capital resulted primarily from a $49.7 million increase in trade and notes receivable, a $28.0 million increase in inventory, and a $14.6million decrease in trade accounts payable. The increases support the worldwide growth of the Company, including the T2 Supply acquisition, and allow for greatercustomer financing as allowed by our return on invested capital (ROIC) model.
24

The increase in the amount of trade accounts receivable is attributable to an increase in sales during the year. The number of days sales outstanding (DSO) in endingtrade receivables increased to 60 days at June 30, 2007 compared to 59 days at June 30, 2006. The increase in DSO is a result of longer negotiated terms on larger,strategic deals reflecting the Company’s decision to manage receivables to attain return on invested capital targets. Inventory turnover decreased to 6.7 times in fiscal2007 from 7.2 times in fiscal 2006 due to higher inventory levels created worldwide by the transition to RoHS compliant products (RoHS is an environmental directivewhich bans new electrical and electronic equipment containing more than agreed levels of lead, cadmium, mercury, hexavalent chromium, polybrominated biphenyl(PBB) and polybrominated diphenyl ether (PBDE) flame retardants).
Cash used in operating activities was $25.9 million for the year ended June 30, 2007 compared to cash provided by operating activities of $13.2 million for the yearended June 30, 2006. The increase in cash used in operating activities was primarily attributable to the timing of periodic vendor payments (in accordance with suchterms).
Cash used in investing activities for the year ended June 30, 2007 was $55.1 million. Cash used for business acquisitions totaled $50.6 million, primarily for thepurchase of the assets of T2, and for an additional ownership interest in the Company’s majority-owned subsidiary, Netpoint. The Company’s capital expenditures of $4.5million were primarily for purchases of equipment, software, and furniture.
Cash used in investing activities for the year ended June 30, 2006 was $10.8 million. Cash used for business acquisitions totaled $1.3 million, primarily for additionalownership interests in two of the Company’s majority-owned subsidiaries (Netpoint and Outsourcing Unlimited, Inc. “OUI”). OUI is now 100% owned by the Company.Cash used for capital expenditures for the year totaled $9.4 million including $5.0 million for the purchase of property adjacent to the Company’s headquarters inGreenville, South Carolina. Other expenditures were incurred for software, furniture, equipment and building improvements, including the expansion of sales offices inPhoenix, Arizona and Atlanta, Georgia.
At June 30, 2007 and 2006, the Company had a multi-currency revolving credit facility with its bank group of $180 million and $100 million, respectively, whichmatures on July 31, 2008. This facility was entered into on July 16, 2004 and was increased on April 20, 2007 to $180 million, with an accordion feature that allows theCompany to unilaterally increase the availability to $200 million. The facility bears interest at either the 30-day LIBOR rate of interest on U.S. dollar borrowings or the 30,60, 90 or 180-day LIBOR rate of interest on other currency borrowings. The interest rate is the appropriate LIBOR rate plus a rate varying from 0.75% to 1.75% tied to theCompany’s funded debt to EBITDA ratio ranging from 0.00:1.00 to 2.50:1.00 and a fixed charge coverage ratio of not less than 1.50:1. The effective weighted averageinterest rate at June 30, 2007 and 2006 was 6.41% and 4.38%, respectively. The outstanding borrowings at June 30, 2007 were $90.3 million on a total commitment of$200 million, leaving $109.7 million available for additional borrowings. The outstanding borrowings at June 30, 2006 were $27.6 million on a total commitment of $130million, leaving $102.4 million available for additional borrowings. The facility is collateralized by domestic assets, primarily accounts receivable and inventory. The agree-ment contains other restrictive financial covenants, including among other things, total liabilities to tangible net worth ratio, capital expenditure limits, and a prohibition onthe payment of dividends. The Company was in compliance with its loan covenants at June 30, 2007 and 2006, respectively.
On July 25, 2006, ScanSource Properties, LLC, a wholly owned subsidiary of the Company, entered into an agreement with Wachovia Bank, National Association fora $13 million unsecured note payable. Such note requires the Company not to encumber it’s headquarter property except as permitted by the lender. Monthly paymentsconsist of interest only, accrued at the rate of one-month LIBOR plus 0.65%. The note matures on July 31, 2008 and is guaranteed by the Company and its subsidiary,Logue Court Properties, LLC.
At June 30, 2007 and 2006, Netpoint, doing business as ScanSource Latin America, had an asset-based line of credit with a bank that was due on demand and hada borrowing limit of $1 million. The facility was renewed in January 2007, and is scheduled to mature on January 31, 2008. The facility is collateralized by accountsreceivable and eligible inventory, and contains a restrictive covenant which requires an average deposit of $50,000 with the bank. The Company has guaranteed 92% and84% of the balance on the line as of June 30, 2007 and 2006, respectively, while the remaining balance was guaranteed by Netpoint’s minority shareholder. The facilitybears interest at the bank’s prime rate minus one percent. At June 30, 2007 and 2006, the effective interest rate was 7.25%. At June 30, 2007 and 2006 there were nooutstanding balances and outstanding standby letters of credit totaled $40,000, leaving $960,000 available for borrowings.
25

Cash provided by financing activities for the year ended June 30, 2007 totaled $79.0 million, including advances of $59.8 million under the Company’s credit facility,$12.8 million in additional long-term debt, a $3.3 million increase in short-term borrowings, $2.0 million in excess tax benefits from share-based payment arrangements,and $1.1 million in proceeds from stock option exercises. Cash used in financing activities for the year ended June 30, 2006 totaled $7.1 million, including $6.5 million inpayments on short-term and long-term debt and $4.3 million in repayments under the Company’s credit facility, offset in part by $2.7 million in proceeds from stockoption exercises and $1 million of excess tax benefits from share-based payment arrangements.
Payments due by period for the Company’s contractual obligations at June 30, 2007 are as follows:
Payments Due by Period
TotalFiscal Year
2008Fiscal Years2009 – 2011
Fiscal Years2012 –2013 Thereafter
( in thousands)Long-term debt obligations $17,416 $ 200 $17,216 $ — $ —Operating lease obligations 23,620 2,962 8,750 4,215 7,693Purchase obligations 3,717 3,717 — — —
Total obligations $44,515 $6,874 $25,968 $4,215 $7,693
On April 27, 2007, the Company entered into an agreement to lease approximately 600,000 square feet for distribution, warehousing and storage purposes in abuilding located in Southaven, Mississippi. The lease also provides for a right of first refusal on an additional 147,000 square feet of expansion space. The lease providesfor market rental rates and commences upon substantial completion of construction, which is expected to be October 1, 2007, with a term of 120 months, and 2consecutive 5-year extension options.
The Company anticipates capital expenditures of approximately $5.4 million in fiscal year 2008 for facility renovations, the purchase of software and equipment, andfor various other improvements and purchases. Contractual obligations, primarily related to the warehouse relocation project, amounted to approximately $3.7 million atJune 30, 2007.
On October 22, 2004, The American Jobs Creation Act of 2004 was enacted. This legislation provides a tax deduction of 85% of certain foreign dividends that arerepatriated by the Company. The Company did not distribute earnings from its foreign subsidiaries under this legislation.
At June 30, 2007, the Company has: (i) gross net operating loss carryforwards of approximately $278,000 for U.S. Federal income tax purposes that begin expiring in2020; (ii) state income tax credit carryforwards of approximately $263,000 that begin expiring in 2019; (iii) net foreign operating loss carryforwards of approximately$155,000 that begin expiring in 2008.
The Company believes that it has sufficient liquidity to meet its forecasted cash requirements for at least the next year.
Backlog
The Company does not consider backlogs to be material to its business. Nearly all orders are filled within 24 hours of receipt.
Accounting Standards Recently Issued
In May 2005, the FASB issued SFAS No. 154, Accounting Changes and Corrections, which replaces APB Opinion No. 20, Accounting Changes and SFAS No. 3,Reporting Accounting Changes in Interim Financial Statements, and changes the requirements for the accounting for and reporting of a change in accounting principle.SFAS No. 154 also provides guidance on the accounting for and reporting of error corrections. This statement is applicable for accounting changes and corrections oferrors made in fiscal years beginning after December 15, 2005 and was adopted by the Company in the first quarter of fiscal year 2007. Such adoption did not have amaterial impact on the Company’s consolidated financial position, results of operations or cash flows.
26

In July 2006, the FASB issued Interpretation No. 48 (“FIN 48”), Accounting for Uncertainty in Income Taxes—an Interpretation of FASB Statement No. 109. FIN 48clarifies the accounting for uncertainty in income taxes recognized in a company’s financial statements by prescribing a recognition threshold and measurement attributefor financial statement recognition and measurement of a tax position taken or expected to be taken on a tax return. Additionally, FIN 48 provides guidance onde-recognition of tax benefits previously recognized and additional disclosures for unrecognized tax benefits, interest and penalties. FIN 48 is effective for fiscal yearsbeginning after December 15, 2006, and is required to be adopted by the Company in the first quarter of fiscal year 2008. The Company is currently evaluating whetherthe adoption of FIN 48 will have a material effect on its consolidated financial position, results of operations or cash flows.
In May 2007, the FASB issued FASB Staff Position (“FSP”) FIN No. 48-1 (“FSP FIN 48-1”), Definition of Settlement in FASB Interpretation No. 48. FSP FIN 48-1provides guidance on how a company should determine whether a tax position is effectively settled for the purpose of recognizing previously unrecognized tax benefits.FSP FIN 48-1 is effective upon initial adoption of FIN 48, which the Company will adopt in the first quarter of fiscal 2008, as indicated above.
In February 2007, FASB issued SFAS No. 159, The Fair Value Option for Financial Assets and Financial Liabilities, which requires companies to provide additionalinformation regarding the effect of a company’s choice to use fair value on its earnings and to display the fair value of those assets and liabilities which the company haschosen to use on the face of the balance sheet. SFAS No. 159 is effective for the Company as of the year ending June 30, 2009. The Company is currently evaluating thepotential impact, if any, that the adoption of SFAS No. 159 will have on its consolidated financial statements.
In September 2006, the Securities and Exchange Commission issued Staff Accounting Bulletin (“SAB”) No. 108, Considering the Effects of Prior Year Misstatementswhen Quantifying Current Year Misstatements, which provides interpretative guidance on the consideration of the effects of prior year misstatements in quantifying currentyear misstatements for the purpose of a materiality assessment. SAB 108 requires the Company to quantify misstatements using both the balance sheet and incomestatement approaches and to evaluate whether either approach results in quantifying an error that is material based on relevant quantitative and qualitative factors. SABNo. 108 was effective for the Company’s fiscal year 2007 annual financial statements and was adopted by the Company during the fiscal year ending June 30, 2007.Such adoption did not have a material impact on the Company’s consolidated financial position, results of operations or cash flows.
In September 2006, the FASB issued SFAS No. 157, Fair Value Measurements, which defines fair value, establishes a framework for measuring fair value in generallyaccepted accounting principles, and expands disclosures about fair value measurements. SFAS No. 157 does not require any new fair value measurements, but providesguidance on how to measure fair value by providing a fair value hierarchy used to classify the source of the information. This statement is effective for the Companybeginning July 1, 2008. The Company is currently evaluating the potential impact, if any, that the adoption of SFAS No. 157 will have on its consolidated financialstatements.
Impact of Inflation
The Company has not been adversely affected by inflation as technological advances and competition within specialty technology markets have generally causedprices of the products sold by the Company to decline. Management believes that any price increases could be passed on to its customers, as prices charged by theCompany are not set by long-term contracts.
27

Quantitative and Qualitative Disclosures About Market Risks
The Company’s principal exposure to changes in financial market conditions in the normal course of its business is a result of its selective use of bank debt andtransacting business in foreign currencies in connection with its foreign operations. The Company has chosen to present this information below in a sensitivity analysis format.
The Company is exposed to changes in interest rates primarily as a result of its borrowing activities, which include revolving credit facilities with a group of banks usedto maintain liquidity and fund the Company’s business operations. The nature and amount of the Company’s debt may vary as a result of future business requirements,market conditions and other factors. The definitive extent of the Company’s interest rate risk is not quantifiable or predictable because of the variability of future interestrates and business financing requirements, but the Company does not believe such risk is material. A hypothetical 100 basis point increase or decrease in interest rateson borrowings on the Company’s revolving line of credit, variable rate long term debt and subsidiary line of credit for the years ended June 30, 2007 and 2006 would haveresulted in an approximately $1.3 million and $441,000 increase or decrease, respectively, in pre-tax income. The Company does not currently use derivative instrumentsor take other actions to adjust the Company’s interest rate risk profile.
The Company is exposed to foreign currency risks that arise from its foreign operations in Canada, Mexico and Europe. These risks include the translation of localcurrency balances of foreign subsidiaries, inter-company loans with foreign subsidiaries and transactions denominated in non-functional currencies. Foreign exchangerisk is managed by using foreign currency forward and option contracts to hedge these exposures, as well as balance sheet netting of exposures. The Company’s Board ofDirectors has approved a foreign exchange hedging policy to minimize foreign currency exposure. The Company’s policy is to utilize financial instruments to reduce riskswhere internal netting cannot be effectively employed and not to enter into foreign currency derivative instruments for speculative or trading purposes. The Companymonitors its risk associated with the volatility of certain foreign currencies against its functional currencies and enters into foreign exchange derivative contracts tominimize short-term currency risks on cash flows. The Company continually evaluates foreign exchange risk and may enter into foreign exchange transactions inaccordance with its policy. Foreign currency gains and losses are included in other expense (income).
The Company has elected not to designate its foreign currency contracts as hedging instruments, and therefore, the instruments are marked to market with changesin their values recorded in the Consolidated Income Statement each period. The underlying exposures are denominated primarily in British Pounds, Euros, and CanadianDollars. At June 30, 2007, the Company had currency forward contracts outstanding with a net receivable under these contracts of $1,000. At June 30, 2006, theCompany had currency forward contracts outstanding with a net liability under these contracts of $25,000.
The Company does not utilize financial instruments for trading or other speculative purposes, nor does it utilize leveraged financial instruments. On the basis of thefair value of the Company’s market sensitive instruments at June 30, 2007, the Company does not consider the potential near-term losses in future earnings, fair valuesand cash flows from reasonably possible near-term changes in interest rates and exchange rates to be material.
28

Management’s Statement of Responsibility
The management of ScanSource is responsible for the information contained in the consolidated financial statements and other parts of this report. Theaccompanying consolidated financial statements of ScanSource, Inc. and subsidiaries have been prepared in accordance with accounting principles generally accepted inthe United States of America, applying certain estimates and judgments based upon available information. In management’s opinion, the consolidated financialstatements present fairly the Company’s financial position, results of operations, and cash flows.
The Audit Committee of the Board of Directors meets regularly with the Company’s independent auditors and management to review accounting, internal control, andfinancial reporting matters. The Audit Committee also has meetings with the independent auditors without management present. The independent auditors have full andfree access to the Audit Committee.
Management’s Report on Internal Control Over Financial Reporting
Management is also responsible for establishing and maintaining adequate internal control over financial reporting for the Company (as such term is defined in Rule13a-15(f) under the Securities Exchange Act of 1934, as amended).
Under the supervision and with the participation of management, including the chief executive officer and chief financial officer, management assessed theeffectiveness of the Company’s system of internal control over financial reporting as of June 30, 2007 based on the framework set forth in “Internal Control – IntegratedFramework” issued by the Committee of Sponsoring Organizations of the Treadway Commission. Based on its evaluation, management concluded that, as of June 30,2007, the Company’s internal control over financial reporting is effective based on the specified criteria.
29

Report of Independent Registered Public Accounting Firm
The Board of Directors and ShareholdersScanSource, Inc.
We have audited ScanSource Inc.’s internal control over financial reporting as of June 30, 2007, based on criteria established in Internal Control—IntegratedFramework issued by the Committee of Sponsoring Organizations of the Treadway Commission (the COSO criteria). ScanSource Inc.’s management is responsible formaintaining effective internal control over financial reporting, and for its assessment of the effectiveness of internal control over financial reporting included in theaccompanying Management’s Report on Internal Control Over Financial Reporting. Our responsibility is to express an opinion on the company’s internal control overfinancial reporting based on our audit.
We conducted our audit in accordance with the standards of the Public Company Accounting Oversight Board (United States). Those standards require that we planand perform the audit to obtain reasonable assurance about whether effective internal control over financial reporting was maintained in all material respects. Our auditincluded obtaining an understanding of internal control over financial reporting, assessing the risk that a material weakness exists, testing and evaluating the design andoperating effectiveness of internal control based on the assessed risk, and performing such other procedures as we considered necessary in the circumstances. Webelieve that our audit provides a reasonable basis for our opinion.
A company’s internal control over financial reporting is a process designed to provide reasonable assurance regarding the reliability of financial reporting and thepreparation of financial statements for external purposes in accordance with generally accepted accounting principles. A company’s internal control over financialreporting includes those policies and procedures that (1) pertain to the maintenance of records that, in reasonable detail, accurately and fairly reflect the transactions anddispositions of the assets of the company; (2) provide reasonable assurance that transactions are recorded as necessary to permit preparation of financial statements inaccordance with generally accepted accounting principles, and that receipts and expenditures of the company are being made only in accordance with authorizations ofmanagement and directors of the company; and (3) provide reasonable assurance regarding prevention or timely detection of unauthorized acquisition, use, or dispositionof the company’s assets that could have a material effect on the financial statements.
Because of its inherent limitations, internal control over financial reporting may not prevent or detect misstatements. Also, projections of any evaluation ofeffectiveness to future periods are subject to the risk that controls may become inadequate because of changes in conditions, or that the degree of compliance with thepolicies or procedures may deteriorate.
In our opinion, ScanSource, Inc. maintained, in all material respects, effective internal control over financial reporting as of June 30, 2007, based on the COSOcriteria.
We also have audited, in accordance with the standards of the Public Company Accounting Oversight Board (United States), the consolidated balance sheets ofScanSource, Inc. as of June 30, 2007 and 2006, and the related consolidated statements of income, shareholders’ equity, and cash flows for each of the three years inthe period ended June 30, 2007 of ScanSource, Inc. and our report dated August 27, 2007 expressed an unqualified opinion thereon.
/s/ Ernst & Young LLP
Greenville, South CarolinaAugust 27, 2007
30

Report of Independent Registered Public Accounting Firm
The Board of Directors and ShareholdersScanSource, Inc.
We have audited the accompanying consolidated balance sheets of ScanSource, Inc. as of June 30, 2007 and 2006 and the related consolidated statements ofincome, shareholders’ equity, and cash flows for each of the three years in the period ended June 30, 2007. These financial statements are the responsibility of theCompany’s management. Our responsibility is to express an opinion on these financial statements based on our audits.
We conducted our audits in accordance with the standards of the Public Company Accounting Oversight Board (United States). Those standards require that we planand perform the audit to obtain reasonable assurance about whether the financial statements are free of material misstatement. An audit includes examining, on a testbasis, evidence supporting the amounts and disclosures in the financial statements. An audit also includes assessing the accounting principles used and significantestimates made by management, as well as evaluating the overall financial statement presentation. We believe that our audits provide a reasonable basis for our opinion.
In our opinion, the financial statements referred to above present fairly, in all material respects, the consolidated financial position of ScanSource, Inc. at June 30,2007 and 2006, and the consolidated results of its operations and its cash flows for each of the three years in the period ended June 30, 2007, in conformity with U.S.generally accepted accounting principles.
We also have audited, in accordance with the standards of the Public Company Accounting Oversight Board (United States), the effectiveness of ScanSource, Inc.’sinternal control over financial reporting as of June 30, 2007, based on criteria established in Internal Control-Integrated Framework issued by the Committee ofSponsoring Organizations of the Treadway Commission and our report dated August 27, 2007 expressed an unqualified opinion thereon.
/s/ Ernst & Young LLP
Greenville, South CarolinaAugust 27, 2007
31

SCANSOURCE, INC. AND SUBSIDIARIESCONSOLIDATED BALANCE SHEETS
June 30, 2007 and 2006(In thousands)
2007 2006
AssetsCurrent assets:
Cash and cash equivalents $ 1,864 $ 3,831Trade and notes receivable:
Trade, less allowance of $13,342 and $11,508 at June 30, 2007 and 2006, respectively 349,961 300,240Other 6,755 4,558
356,716 304,798Inventories 272,012 244,005Prepaid expenses and other assets 10,444 2,293Deferred income taxes 12,102 15,709
Total current assets 653,138 570,636
Property and equipment, net: 26,781 27,098Goodwill 29,361 14,404Other assets, including identifiable intangible assets 29,168 5,359
Total assets $738,448 $617,497
See accompanying notes to consolidated financial statements.
32
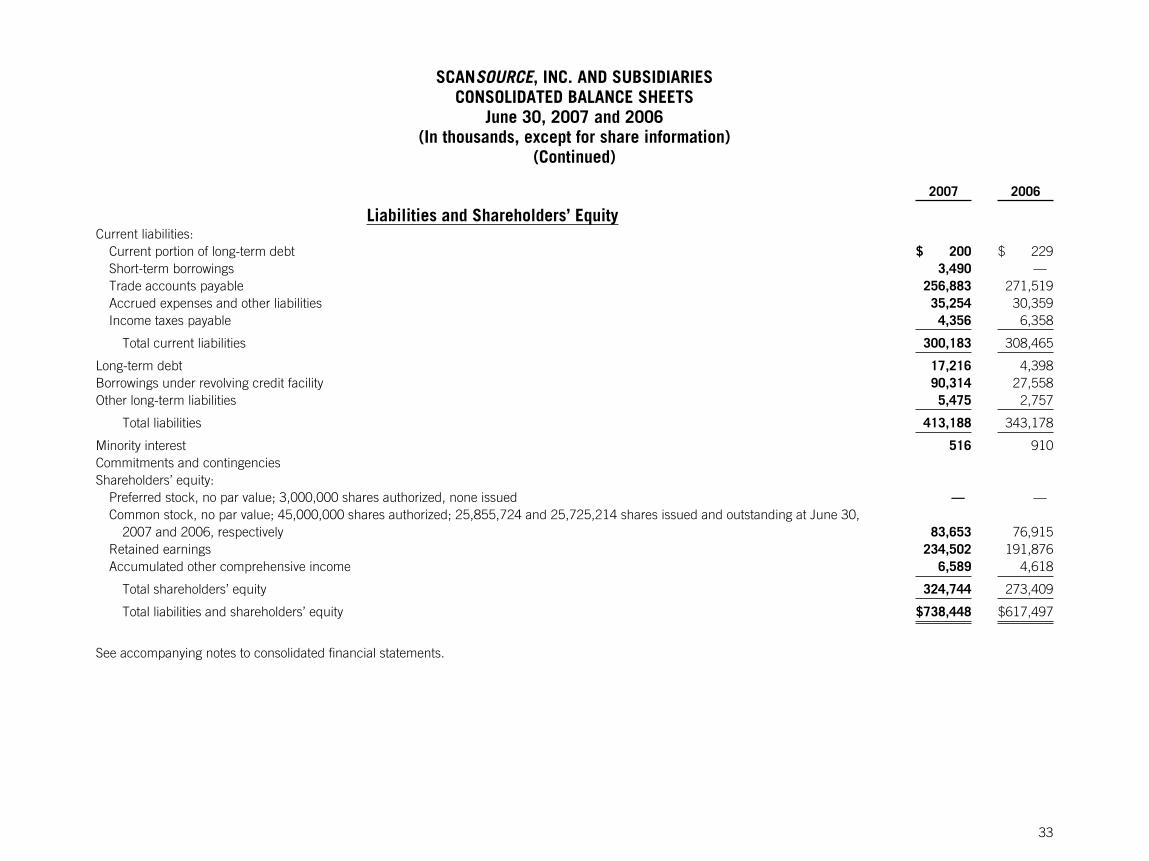
SCANSOURCE, INC. AND SUBSIDIARIESCONSOLIDATED BALANCE SHEETS
June 30, 2007 and 2006(In thousands, except for share information)
(Continued)
2007 2006
Liabilities and Shareholders’ EquityCurrent liabilities:
Current portion of long-term debt $ 200 $ 229Short-term borrowings 3,490 —Trade accounts payable 256,883 271,519Accrued expenses and other liabilities 35,254 30,359Income taxes payable 4,356 6,358
Total current liabilities 300,183 308,465
Long-term debt 17,216 4,398Borrowings under revolving credit facility 90,314 27,558Other long-term liabilities 5,475 2,757
Total liabilities 413,188 343,178
Minority interest 516 910Commitments and contingenciesShareholders’ equity:
Preferred stock, no par value; 3,000,000 shares authorized, none issued — —Common stock, no par value; 45,000,000 shares authorized; 25,855,724 and 25,725,214 shares issued and outstanding at June 30,
2007 and 2006, respectively 83,653 76,915Retained earnings 234,502 191,876Accumulated other comprehensive income 6,589 4,618
Total shareholders’ equity 324,744 273,409
Total liabilities and shareholders’ equity $738,448 $617,497
See accompanying notes to consolidated financial statements.
33

SCANSOURCE, INC. AND SUBSIDIARIESCONSOLIDATED INCOME STATEMENTS
Years Ended June 30, 2007, 2006 and 2005(In thousands, except per share data)
2007 2006 2005
Net sales $1,986,927 $1,665,600 $1,469,094Cost of goods sold 1,776,255 1,497,248 1,319,368
Gross profit 210,672 168,352 149,726
Operating expenses:Selling, general and administrative expenses 135,339 105,042 90,970
Operating income 75,333 63,310 58,756Other expense (income):
Interest expense 7,689 2,187 2,127Interest income (885) (567) (863)Other, net (144) 57 (413)
Total other expense 6,660 1,677 851
Income before income taxes and minority interest 68,673 61,633 57,905Provision for income taxes 25,987 21,592 22,010
Income before minority interest 42,686 40,041 35,895Minority interest in income of consolidated subsidiaries, net of income taxes of $36, $101 and $170, at June 30, 2007,
2006, and 2005, respectively 60 225 291
Net income $ 42,626 $ 39,816 $ 35,604
Per share data:Net income per common share, basic $ 1.65 $ 1.56 $ 1.41
Weighted-average shares outstanding, basic 25,773 25,491 25,254
Net income per common share, assuming dilution $ 1.63 $ 1.53 $ 1.37
Weighted-average shares outstanding, assuming dilution 26,213 26,034 25,927
See accompanying notes to consolidated financial statements.
34

SCANSOURCE, INC. AND SUBSIDIARIESCONSOLIDATED STATEMENTS OF SHAREHOLDERS’ EQUITY
Years Ended June 30, 2007, 2006 and 2005(In thousands, except share data)
CommonStock
(Shares)
CommonStock
(Amount)RetainedEarnings
AccumulatedOther
ComprehensiveIncome Total
Balance at June 30, 2004 25,119,378 $64,788 $116,457 $3,500 $184,745
Comprehensive income:Net income — — 35,604 — 35,604Foreign currency translation adjustment — — — (16) (16)
Total comprehensive income 35,588
Exercise of stock options 210,774 2,836 — — 2,836Tax benefit of deductible compensation arising from exercise of stock options — 1,785 — — 1,785Other — 259 — — 259
Balance at June 30, 2005 25,330,152 69,668 152,061 3,484 225,213
Comprehensive income:Net income — — 39,816 — 39,816Foreign currency translation adjustment — — — 1,133 1,133
Total comprehensive income 40,949
Exercise of stock options 395,062 2,673 — — 2,673Stock-based compensation — 3,593 — — 3,593Tax benefit of deductible compensation arising from exercise of stock options — 981 — — 981Other — — — —
Balance at June 30, 2006 25,725,214 76,915 191,876 4,618 273,409
Comprehensive income:Net income — — 42,626 — 42,626Foreign currency translation adjustment — — — 1,971 1,971
Total comprehensive income 44,597
Exercise of stock options 130,510 1,125 — — 1,125Stock-based compensation — 3,642 — — 3,642Tax benefit of deductible compensation arising from exercise of stock options — 1,971 — — 1,971
Balance at June 30, 2007 25,855,724 $83,653 $234,502 $6,589 $324,744
See accompanying notes to consolidated financial statements.
35
—

SCANSOURCE, INC. AND SUBSIDIARIESCONSOLIDATED STATEMENTS OF CASH FLOWSYears Ended June 30, 2007, 2006 and 2005
(In thousands)
2007 2006 2005
Cash flows from operating activities:Net income $ 42,626 $ 39,816 $ 35,604Adjustments to reconcile net income to net cash (used in) provided by operating activities:
Depreciation 4,851 5,566 5,141Amortization of intangible assets 2,079 200 364Allowance for accounts and notes receivable 8,858 2,702 1,556Share-based compensation and restricted stock 3,642 3,716 702Impairment of capitalized assets 148 102 30Deferred income tax expense (benefit) 992 (5,802) (1,992)Excess tax benefits from share-based payment arrangements (1,971) (982) —Minority interest in income of subsidiaries 60 225 291Changes in operating assets and liabilities, net of acquisitions:
Trade and notes receivables (45,172) (85,005) (41,622)Other receivables (1,158) 942 (1,286)Inventories (21,138) (63,604) 5,962Prepaid expenses and other assets (8,126) 1,316 (869)Other noncurrent assets (2,471) 4,320 (2,265)Trade accounts payable (16,088) 97,125 3,714Accrued expenses and other liabilities 7,044 9,747 5,960Income taxes payable (123) 2,823 2,558
Net cash (used in) provided by operating activities (25,947) 13,207 13,848
Cash flows from investing activities:Capital expenditures (4,542) (9,431) (4,093)Cash paid for business acquisitions, net of cash acquired (50,585) (1,348) (5,300)
Net cash used in investing activities (55,127) (10,779) (9,393)
Cash flows from financing activities:Increases (decreases) in short-term borrowings, net 3,309 (4,478) 2,445Advances (payments) on revolving credit, net 59,800 (4,343) (736)Exercise of stock options 1,125 2,673 2,135Excess tax benefits from share-based payment arrangements 1,971 982 —Increases (repayments) of long-term debt borrowings 12,789 (1,982) (829)
Net cash provided by (used in) financing activities 78,994 (7,148) 3,015
Effect of exchange rate changes on cash and cash equivalents 113 (58) 92
(Decrease) increase in cash and cash equivalents (1,967) (4,778) 7,562Cash and cash equivalents at beginning of year 3,831 8,609 1,047
Cash and cash equivalents at end of year $ 1,864 $ 3,831 $ 8,609
Supplemental disclosure of cash flow information:Interest paid during the year $ 6,229 $ 2,159 $ 2,126
Income taxes paid during the year $ 30,228 $ 22,614 $ 21,550
See accompanying notes to consolidated financial statements.
36

SCANSOURCE, INC. AND SUBSIDIARIES
Notes to Consolidated Financial Statements
June 30, 2007
(1) Business Description
ScanSource, Inc. (the “Company”) is a leading distributor of specialty technology products, providing value-added distribution sales to resellers in the specialtytechnology markets. The Company has two geographic distribution segments: one serving North America from the Memphis, Tennessee distribution center, and aninternational segment currently serving Latin America (including Mexico) and Europe from distribution centers located in Florida and Mexico, and in Belgium, respectively.The North American distribution segment markets automatic identification and data capture (“AIDC”) and point-of-sale (“POS”) products through its ScanSource salesunit; voice, data and converged communications equipment through its Catalyst Telecom sales unit; voice, data and converged communications products through itsParacon sales unit; video conferencing and telephony products through its T2 Supply unit; and electronic security products through its ScanSource Security Distributionunit. The international distribution segment markets AIDC and POS products through its ScanSource sales unit.
(2) Summary of Significant Accounting Policies and Accounting Standards Recently Issued
Restatement of previously issued financial statements
On June 18, 2007, the Company filed an amended Annual Report on Form 10-K/A for the fiscal year ended June 30, 2006, and restated its consolidated balancesheets of June 30, 2006 and June 30, 2005 and the related consolidated statements of income, stockholders’ equity and cash flows for the years ended June 30,2006, June 30, 2005 and June 30, 2004.
Consolidation Policy
The consolidated financial statements include the accounts of the Company and its subsidiaries. All significant inter-company accounts and transactions have beeneliminated.
Minority Interest
Minority interest represents that portion of the net equity of majority-owned subsidiaries of the Company held by minority shareholders. The minority shareholders’share of the subsidiaries’ income or loss is listed separately in the Consolidated Income Statements. The Company acquired an additional 12% ownership of OutsourcingUnlimited, Inc. (“OUI”) in both of the years ended 2006 and 2005, now owning 100%. The Company acquired an additional 8% ownership of Netpoint International, Inc.(“Netpoint”) in each of the years ended 2007, 2006, and 2005, now owning 92%.
Use of Estimates
The preparation of consolidated financial statements in conformity with accounting principles generally accepted in the United States of America requiresmanagement to make estimates and assumptions that affect the reported amounts of assets and liabilities and disclosure of contingent assets and liabilities at the date ofthe consolidated financial statements and the reported amounts of revenues and expenses during the reporting period. On an ongoing basis, management evaluates itsestimates, including those related to the allowance for uncollectible accounts receivable and inventory reserves. Management bases its estimates on assumptions thatmanagement believes to be reasonable under the circumstances, the results of which form a basis for making judgments about the carrying value of assets and liabilitiesthat are not readily available from other sources. Actual results may differ from these estimates under different assumptions or conditions; however, management believesthat its estimates, including those for the above described items, are reasonable and that the actual results will not vary significantly from the estimated amounts.
37

SCANSOURCE, INC. AND SUBSIDIARIES
Notes to Consolidated Financial Statements
June 30, 2007
The following significant accounting policies relate to the more significant judgments and estimates used in the preparation of the consolidated financial statements:
(a) Allowances for Trade and Notes Receivable
The Company maintains an allowance for uncollectible accounts receivable for estimated losses resulting from customers’ failure to make payments on accountsreceivable due to the Company. Management determines the estimate of the allowance for uncollectible accounts receivable by considering a number of factors,including: (1) historical experience, (2) aging of the accounts receivable and (3) specific information obtained by the Company on the financial condition and the currentcreditworthiness of its customers. If the financial condition of the Company’s customers were to deteriorate and reduce the ability of the Company’s customers to makepayments on their accounts, the Company may be required to increase its allowance by recording additional bad debt expense. Likewise, should the financial condition ofthe Company’s customers improve and result in payments or settlements of previously reserved amounts, the Company may be required to record a reduction in bad debtexpense to reverse the recorded allowance. A provision for estimated losses on returns and allowances is recorded at the time of sale based on historical experience.
(b) Inventory Reserves
Management determines the inventory reserves required to reduce inventories to the lower of cost or market based principally on the effects of technologicalchanges, quantities of goods on hand, and other factors. An estimate is made of the market value, less cost to dispose, of products whose value is determined to beimpaired. If these products are ultimately sold at less than estimated amounts, additional reserves may be required. Likewise, if these products are sold for more than theestimated amounts, reserves may be reduced.
Reclassifications
Certain prior year amounts have been reclassified to conform to the current year presentation in the accompanying consolidated financial statements.
Stock Split
Effective June 5, 2006, the Board of Directors of the Company approved a two-for-one stock split of the common stock effected in the form of a 100% common stockdividend. All shares and per share amounts have been retroactively adjusted to reflect the stock split.
Cash and Cash Equivalents
The Company considers all highly liquid investments with original maturities of three months or less to be cash equivalents. Book overdrafts of $45.7 million and$43.4 million as of June 30, 2007 and 2006, respectively, are included in accounts payable.
Concentration of Credit Risk
The Company sells its products to a large base of value-added resellers throughout North America, Latin America (including Mexico) and Europe. The Companyperforms ongoing credit evaluations of its customers’ financial condition. In certain cases, the Company will accept tangible assets as collateral to increase the trade creditof its customers. No single customer accounted for more than 6% of the Company’s net sales for fiscal 2007, 2006, or 2005.
38

SCANSOURCE, INC. AND SUBSIDIARIES
Notes to Consolidated Financial Statements
June 30, 2007
The Company has established arrangements with certain customers for longer term financing. The Company accounts for these arrangements by recording them attheir historical cost less specific allowances at balance sheet dates. Interest income is recognized in the period earned and is recorded as interest income in theConsolidated Income Statements.
Derivative Financial Instruments
The Company’s foreign currency exposure results from purchasing and selling internationally in several foreign currencies. In addition, the Company has foreigncurrency risk related to debt that is denominated in currencies other than the U.S. Dollar. The Company may reduce its exposure to fluctuations in foreign exchange ratesby creating offsetting positions through the use of derivative financial instruments or multi-currency borrowings. The market risk related to the foreign exchangeagreements is offset by changes in the valuation of the underlying items. The Company currently does not use derivative financial instruments for trading or speculativepurposes, nor is the Company a party to leveraged derivatives.
Derivative financial instruments are accounted for on an accrual basis with gains and losses on these contracts recorded in income in the period in which their valuechanges, with the offsetting entry for unsettled positions being booked to either other assets or other liabilities. These contracts are generally for a duration of 90 days orless. The Company has elected not to designate its foreign currency contracts as hedging instruments. They are, therefore, marked to market with changes in their valuerecorded in the Consolidated Income Statements each period. The underlying exposures are denominated primarily in British Pounds, Euros, and Canadian Dollars. Todate, the activity and outstanding contracts related to these instruments has not been material.
Investments
The Company has investments that are held in a grantor trust formed by the Company related to the ScanSource, Inc. Nonqualified Deferred Compensation Plan.The Company has classified these investments as trading securities and they are recorded at fair market value with unrealized gains and losses included in theaccompanying consolidated income statements. The Company’s obligations under this deferred compensation plan change in concert with the performance of theinvestments. The fair value of these investments and the corresponding deferred compensation obligation was $4.3 million and $2.7 million as of June 30, 2007 andJune 30, 2006, respectively. These investments are classified within other non-current assets in the Consolidated Balance Sheets. The deferred compensation obligationis classified within other long-term liabilities.
Inventories
Inventories (consisting entirely of finished goods) are stated at the lower of cost (first-in, first-out method) or market.
Vendor Programs
The Company receives incentives from vendors related to cooperative advertising allowances, volume rebates and other incentive agreements. These incentives aregenerally under quarterly, semi-annual or annual agreements with the vendors. Some of these incentives are negotiated on an ad hoc basis to support specific programsmutually developed between the Company and the vendor. Vendors generally require that we use their cooperative advertising allowances exclusively for advertising orother marketing programs. Incentives received from vendors for specifically identified incremental cooperative advertising programs are recorded as adjustments toselling, general and administrative expenses. EITF Issue No. 02-16, Accounting by a Customer (Including a Reseller) for Certain Consideration Received from a Vendor(“EITF 02-16”) requires that a portion of these vendor funds in excess of our costs be reflected as a reduction of inventory. Such funds are recognized as a reduction ofthe cost of goods sold when the related inventory is sold.
39

SCANSOURCE, INC. AND SUBSIDIARIES
Notes to Consolidated Financial Statements
June 30, 2007
The Company records unrestricted, volume rebates received as a reduction of inventory and as a reduction of the cost of goods sold when the related inventory issold. Amounts received or receivable from vendors that are not yet earned are deferred in the consolidated balance sheet. In addition, the Company may receive earlypayment discounts from certain vendors. The Company records early payment discounts received as a reduction of inventory and recognizes the discount as a reductionof cost of goods sold when the related inventory is sold. EITF 02-16 requires management to make certain estimates of the amounts of vendor incentives that will bereceived. Actual recognition of the vendor consideration may vary from management estimates based on actual results.
Product Warranty
The Company’s vendors generally warrant the products distributed by the Company and allow the Company to return defective products, including those that havebeen returned to the Company by its customers. The Company does not independently warrant the products it distributes; however, to maintain customer relations, theCompany facilitates vendor warranty policies by accepting for exchange, with the Company’s prior approval, most defective products within 30 days of invoicing. TheCompany offers certain warranty service programs and records a provision for estimated service warranty costs at the time of sale, adjusting periodically to reflect actualexperience. To date neither warranty expense, nor the accrual for warranty costs has been material to the Company’s consolidated financial statements.
Property and Equipment
Property and equipment are recorded at cost. Depreciation is computed using the straight-line method over estimated useful lives of 3 to 5 years for furniture,equipment and computer software, 40 years for buildings and 15 years for building improvements. Leasehold improvements are amortized over the shorter of the leaseterm or the estimated useful life. Maintenance, repairs and minor renewals are charged to expense as incurred. Additions, major renewals and betterments to propertyand equipment are capitalized.
Goodwill
The Company accounts for recorded goodwill and other intangible assets in accordance with Statement of Financial Accounting Standards (“SFAS”) No. 142,Goodwill and Other Intangible Assets, which revised the standards of accounting for goodwill, by replacing the amortization of these assets with the requirement that theyare reviewed annually for impairment, or more frequently if impairment indicators exist. See Note 11, “Goodwill and Intangible Assets” for a discussion of the annualgoodwill impairment test.
Intangible Assets
Intangible assets consist of customer lists, debt issue costs, trade names, and non-compete agreements. Customer lists are amortized using the straight-line methodover their estimated useful lives, which range from 5 to 15 years. Debt issue costs are amortized over the term of the credit facility using the effective interest method.Trade names are amortized over 10 years. Non-compete agreements are amortized over their contract life. These assets are included in other assets and are shown indetail in Note 11, “Goodwill and Intangible Assets”.
Impairment of Long-Lived Assets
The Company reviews its long-lived assets for impairment whenever events or changes in circumstances indicate that the carrying amount of the asset or asset groupmay not be recoverable. Tests for recoverability of a long-lived asset to be held and used are measured by comparing the carrying amount of the long-lived asset to the
40
SCANSOURCE, INC. AND SUBSIDIARIES
Notes to Consolidated Financial Statements
June 30, 2007
sum of the estimated future undiscounted cash flows expected to be generated by the asset. In estimating the future undiscounted cash flows we use projections of cashflows directly associated with, and which are expected to arise as a direct result of, the use and eventual disposition of the assets. If it is determined that a long-lived assetis not recoverable, an impairment loss would be calculated equal to the excess of the carrying amount of the long-lived asset over its fair value.
Fair Value of Financial Instruments
The fair value of financial instruments is the amount at which the instrument could be exchanged in a current transaction between willing parties. The carrying valuesof financial instruments such as accounts receivable, accounts payable, accrued liabilities, borrowings under the revolving credit facility and subsidiary lines of creditapproximate fair value based upon either short maturities or variable interest rates of these instruments.
Contingencies
The Company accrues for contingent obligations, including estimated legal costs, when it is probable that a liability is incurred and the amount is reasonablyestimable. As facts concerning contingencies become known, management reassesses its position and makes appropriate adjustments to the financial statements.Estimates that are particularly sensitive to future changes include tax, legal, and other regulatory matters, which are subject to change as events evolve and as additionalinformation becomes available during the administrative and litigation process.
Revenue Recognition
Revenue is recognized once four criteria are met: (1) the Company must have persuasive evidence that an arrangement exists; (2) delivery must occur, whichhappens at the point of shipment (this includes the transfer of both title and risk of loss, provided that no significant obligations remain); (3) the price must be fixed anddeterminable; and (4) collectibility must be reasonably assured. A provision for estimated losses on returns is recorded at the time of sale based on historical experience.
The Company has service revenue associated with configuration and marketing, which is recognized when the work is complete and all obligations are substantiallymet. The Company also sells third-party services, such as maintenance contracts. Since the company is acting as an agent for these services, revenue is recognized net ofcost at the time of sale. Revenue from multiple element arrangements is allocated to the various elements based on the relative fair value of the elements, and eachrevenue cycle is considered a separate accounting unit with recognition of revenue based on the criteria met for the individual element of the multiple deliverables.
Shipping Revenue and Costs
Shipping revenue is included in net sales and related costs are included in cost of goods sold. Shipping revenue for the years ended June 30, 2007, 2006 and 2005was approximately $11.1 million, $8.6 million, and $7.2 million, respectively.
Advertising Costs
The Company defers advertising related costs until the advertising is first run in trade or other publications, or in the case of brochures, until the brochures areprinted and available for distribution. Advertising costs, included in marketing costs, after vendor reimbursement, were not significant in any of the three years endedJune 30, 2007. Deferred advertising costs at June 30, 2007 and 2006 were not significant.
41

SCANSOURCE, INC. AND SUBSIDIARIES
Notes to Consolidated Financial Statements
June 30, 2007
Foreign Currency
The currency effects of translating the financial statements of the Company’s foreign entities that operate in their local currency are included in the cumulativecurrency translation adjustment component of accumulated other comprehensive income. The assets, including goodwill, and liabilities of these foreign entities aretranslated into U.S. Dollars using the exchange rate at the end of the respective period. Sales, costs and expenses are translated at average exchange rates effectiveduring the respective period. Translation adjustments resulting from the translation of these entities are included in accumulated other comprehensive income in theConsolidated Balance Sheets. Foreign currency transactional and re-measurement gains and losses are included in other expense (income) in the Consolidated IncomeStatements. Such amounts are not significant to any of the periods presented.
Income Taxes
Income taxes are accounted for under the liability method. Deferred income taxes reflect tax consequences on future years of differences between the tax bases ofassets and liabilities and their financial reporting amounts. Valuation allowances are provided against deferred tax assets in accordance with SFAS No. 109, Accounting forIncome Taxes. Federal income taxes are not provided on the undistributed earnings of foreign subsidiaries because it has been the practice of the Company to reinvestthose earnings in the business outside the United States.
Deferred Income Taxes
Deferred income taxes are determined in accordance with SFAS No.109, Accounting for Income Taxes. Deferred tax assets and liabilities are recognized for theexpected future tax consequences attributable to differences between the consolidated financial statement carrying amounts of existing assets and liabilities and theirrespective tax bases, and operating loss and tax credit carryforwards. The Company evaluates the tax assets and liabilities on a periodic basis and adjusts the balances asappropriate.
The Company records valuation allowances to reduce its deferred tax assets to the amount expected to be realized. In assessing the adequacy of recorded valuationallowances, the Company considers a variety of factors including, the scheduled reversal of deferred tax liabilities, future taxable income, and prudent and feasible taxplanning strategies. In the event the Company determines it would be able to use a deferred tax asset in the future in excess of its net carrying value, an adjustment to thedeferred tax asset would reduce income tax expense, thereby increasing net income in the period such determination was made. Likewise, should the Companydetermine that it was unable to use all or part of its net deferred tax asset in the future, an adjustment to the deferred tax asset would be charged to income tax expense,thereby reducing net income in the period such determination was made.
Share-Based Payment
Effective July 1, 2005, the Company adopted the fair value recognition provisions of SFAS 123 (R), Share-Based Payments. SFAS 123 (R) requires all shared-basedpayment awards to employees and non-employees to be recognized in the Company’s Consolidated Income Statement based on their fair values. Under the fair valuerecognition provisions of SFAS 123 (R), share based compensation is estimated at the grant date based on the fair value of the awards expected to vest and recognized asexpense ratably over the requisite service period of the award. The Company has used the Black-Scholes valuation model to estimate fair value of share-based awards,which requires various assumptions including estimating stock price volatility, forfeiture rates, and estimated life.
42

SCANSOURCE, INC. AND SUBSIDIARIES
Notes to Consolidated Financial Statements
June 30, 2007
The following table illustrates the effect on net income and earnings per share for the year ended June 30, 2005 if the Company had applied the fair value recognitionprovisions to stock-based employee compensation for that period.
Year EndedJune 30, 2005
(in thousands, exceptper share data)
Net income, as reported $35,604Add: Total stock-based employee compensation expense determined under intrinsic value method, net of related income taxes 435Deduct: Total stock-based employee compensation expense determined under fair value based method for all awards, net of
related tax effects (2,143)
Pro-forma net income $33,896
Earnings per share:Income per common share, basic, as reported $ 1.41Income per common share, basic, pro forma $ 1.34Income per common share, assuming dilution, as reported $ 1.37Income per common share, assuming dilution, pro forma $ 1.31
Prior to the adoption of SFAS No. 123(R), the Company presented all tax benefits of deductions resulting from the exercise of stock options as operating cash flows inthe Consolidated Statement of Cash Flows. SFAS No. 123(R) requires the cash flows from the tax benefits resulting from tax deductions in excess of the compensationcost recognized for those options (excess tax benefits) to be classified as financing cash flows. The $1.0 million excess tax benefit classified as a financing cash inflowwould have been classified as an operating cash inflow if the Company had not adopted SFAS No. 123(R).
Comprehensive Income
Comprehensive income is comprised of net income and foreign currency translation. The foreign currency translation gains or losses are not tax-effected because theearnings of foreign subsidiaries are considered by Company management to be permanently reinvested.
Accounting Standards Recently Issued
In May 2005, the FASB issued SFAS No. 154, Accounting Changes and Corrections, which replaces APB Opinion No. 20, Accounting Changes and SFAS No. 3,Reporting Accounting Changes in Interim Financial Statements, and changes the requirements for the accounting for and reporting of a change in accounting principle.SFAS No. 154 also provides guidance on the accounting for and reporting of error corrections. This statement is applicable for accounting changes and corrections oferrors made in fiscal years beginning after December 15, 2005 and was adopted by the Company in the first quarter of fiscal year 2007. Such adoption did not have amaterial impact on the Company’s consolidated financial position, results of operations or cash flows.
43

SCANSOURCE, INC. AND SUBSIDIARIES
Notes to Consolidated Financial Statements
June 30, 2007
In July 2006, the FASB issued Interpretation No. 48 (“FIN 48”), Accounting for Uncertainty in Income Taxes—an Interpretation of FASB Statement No. 109. FIN 48clarifies the accounting for uncertainty in income taxes recognized in a company’s financial statements by prescribing a recognition threshold and measurement attributefor financial statement recognition and measurement of a tax position taken or expected to be taken on a tax return. Additionally, FIN 48 provides guidance onde-recognition of tax benefits previously recognized and additional disclosures for unrecognized tax benefits, interest and penalties. FIN 48 is effective for fiscal yearsbeginning after December 15, 2006, and is required to be adopted by the Company in the first quarter of fiscal year 2008. The Company is currently evaluating whetherthe adoption of FIN 48 will have a material effect on its consolidated financial position, results of operations or cash flows.
In May 2007, the FASB issued FASB Staff Position (“FSP”) FIN No. 48-1 (“FSP FIN 48-1”), Definition of Settlement in FASB Interpretation No. 48. FSP FIN 48-1provides guidance on how a company should determine whether a tax position is effectively settled for the purpose of recognizing previously unrecognized tax benefits.FSP FIN 48-1 is effective upon initial adoption of FIN 48, which the Company will adopt in the first quarter of fiscal 2008, as indicated above.
In February 2007, FASB issued SFAS No. 159, The Fair Value Option for Financial Assets and Financial Liabilities, which requires companies to provide additionalinformation regarding the effect of a company’s choice to use fair value on its earnings and to display the fair value of those assets and liabilities which the company haschosen to use on the face of the balance sheet. SFAS No. 159 is effective for the Company as of the year ending June 30, 2009. The Company is currently evaluating thepotential impact, if any, that the adoption of SFAS No. 159 will have on its consolidated financial statements.
In September 2006, the Securities and Exchange Commission issued Staff Accounting Bulletin (“SAB”) No. 108, Considering the Effects of Prior Year Misstatementswhen Quantifying Current Year Misstatements, which provides interpretative guidance on the consideration of the effects of prior year misstatements in quantifying currentyear misstatements for the purpose of a materiality assessment. SAB 108 requires the Company to quantify misstatements using both the balance sheet and incomestatement approaches and to evaluate whether either approach results in quantifying an error that is material based on relevant quantitative and qualitative factors. SABNo. 108 was effective for the Company’s fiscal year 2007 annual financial statements and was adopted by the Company during the fiscal year ending June 30, 2007.Such adoption did not have a material impact on the Company’s consolidated financial position, results of operations or cash flows.
In September 2006, the FASB issued SFAS No. 157, Fair Value Measurements, which defines fair value, establishes a framework for measuring fair value in generallyaccepted accounting principles, and expands disclosures about fair value measurements. SFAS No. 157 does not require any new fair value measurements, but providesguidance on how to measure fair value by providing a fair value hierarchy used to classify the source of the information. This statement is effective for the Companybeginning July 1, 2008. The Company is currently evaluating the potential impact, if any, that the adoption of SFAS No. 157 will have on its consolidated financialstatements.
44

SCANSOURCE, INC. AND SUBSIDIARIES
Notes to Consolidated Financial Statements
June 30, 2007
(3) Earnings per Share
Basic earnings per share are computed by dividing net income by the weighted-average number of common shares outstanding. Diluted earnings per share arecomputed by dividing net income by the weighted-average number of common and potential common shares outstanding.
NetIncome Shares
Per ShareAmount
(in thousands, exceptper share data)
2007:Income per common share, basic $42,626 25,773 $1.65
Effect of dilutive stock options — 440
Income per common share, assuming dilution $42,626 26,213 $1.63
2006:Income per common share, basic $39,816 25,491 $1.56
Effect of dilutive stock options — 543
Income per common share, assuming dilution $39,816 26,034 $1.53
2005:Income per common share, basic $35,604 25,254 $1.41
Effect of dilutive stock options — 673
Income per common share, assuming dilution $35,604 25,927 $1.37
For the years ended June 30, 2007, 2006 and 2005 there were 581,000, 424,000 and 119,000 weighted average shares, respectively, excluded from thecomputation of diluted earnings per share because their effect would have been antidilutive.
45

SCANSOURCE, INC. AND SUBSIDIARIES
Notes to Consolidated Financial Statements
June 30, 2007
(4) Revolving Credit Facility and Subsidiary Lines of Credit
At June 30, 2007 and 2006, the Company had a multi-currency revolving credit facility with its bank group of $180 million and $100 million, respectively, whichmatures on July 31, 2008. This facility was entered into on July 16, 2004 and was increased on April 20, 2007 to $180 million, with an accordion feature that allows theCompany to unilaterally increase the availability to $200 million. The facility bears interest at either the 30-day LIBOR rate of interest on U.S. dollar borrowings or the 30,60, 90 or 180-day LIBOR rate of interest on other currency borrowings. The interest rate is the appropriate LIBOR rate plus a rate varying from 0.75% to 1.75% tied to theCompany’s funded debt to EBITDA ratio ranging from 0.00:1.00 to 2.50:1.00 and a fixed charge coverage ratio of not less than 1.50:1. The effective weighted averageinterest rate at June 30, 2007 and 2006 was 6.41% and 4.38%, respectively. The outstanding borrowings at June 30, 2007 were $90.3 million on a total commitment of$200 million, leaving $109.7 million available for additional borrowings. The outstanding borrowings at June 30, 2006 were $27.6 million on a total commitment of $130million, leaving $102.4 million available for additional borrowings. The facility is collateralized by domestic assets, primarily accounts receivable and inventory. Theagreement contains other restrictive financial covenants, including among other things, total liabilities to tangible net worth ratio, capital expenditure limits, and aprohibition on the payment of dividends. As of June 30, 2007 the Company was in compliance with all covenants under the credit facility.
On February 14, 2007, the Company’s revolving credit facility was amended to permit the Company to redeem shares of its capital stock so long as the amount paidin connection with the redemptions does not exceed $2 million during any fiscal year.
At June 30, 2007 and 2006, Netpoint, doing business as ScanSource Latin America, had an asset-based line of credit with a bank that was due on demand and hada borrowing limit of $1 million. The facility was renewed in January 2007, and is scheduled to mature on January 31, 2008. The facility is collateralized by accountsreceivable and eligible inventory, and contains a restrictive covenant which requires an average deposit of $50,000 with the bank. The Company has guaranteed 92% and84% of the balance on the line as of June 30, 2007 and 2006, respectively, while the remaining balance was guaranteed by Netpoint’s minority shareholder. The facilitybears interest at the bank’s prime rate minus one percent. At June 30, 2007 and 2006, the effective interest rate was 7.25%. At June 30, 2007 and 2006 there were nooutstanding balances and outstanding standby letters of credit totaled $40,000, leaving $960,000 available for borrowings.
Short-term borrowings at June 30, 2007 consist of a €3.0 million secured revolving credit facility obtained on August 17, 2006. This facility bears interest at the 30day EURIBOR rate of interest plus a spread of .75 per annum. The effective weighted average interest rate at June 30, 2007 was 4.86%. This facility is secured by theassets of our European operations and is guaranteed by ScanSource, Inc. At June 30, 2007, €2.6 million or $3.5 million was outstanding under this facility. The Companyhad no short-term borrowings at June 30, 2006.
46

SCANSOURCE, INC. AND SUBSIDIARIES
Notes to Consolidated Financial Statements
June 30, 2007
(5) Long-term Debt
Long-term debt consists of the following at June 30, 2007 and 2006:
2007 2006
(in thousands)Unsecured note payable to a bank, monthly payments of interest only; 5.97% variable interest rate at June 30, 2007; maturing in fiscal
year 2009. $13,000 $ —Note payable to a bank, secured by distribution center land and building; monthly payments of principal and interest of $41,000;
variable interest rates of 6.82% and 5.88%, respectively, at June 30, 2007 and 2006; maturing in fiscal 2009 with a balloon paymentof approximately $4.2 million 4,416 4,627
$17,416 $4,627
Less current portion 200 229
Long-term portion $17,216 $4,398
The $13.0 million unsecured long-term note payable was entered into on July 25, 2006, and includes a requirement that the Company not encumber itsheadquarters property except as permitted by the lender. The note payable secured by the distribution center contains certain financial covenants, including minimumnet worth, capital expenditure limits, a maximum debt to tangible net worth ratio, and prohibits the payment of dividends. As of June 30, 2007, the Company was incompliance with all covenants under this note payable.
Scheduled debt maturities at June 30, 2007 are as follows:
Long-TermDebt
(in thousands)Fiscal year:2008 $ 2002009 17,216Thereafter —
Total principal payments $17,416
47

SCANSOURCE, INC. AND SUBSIDIARIES
Notes to Consolidated Financial Statements
June 30, 2007
(6) Stock Options
At June 30, 2007, the Company has three stock-based compensation plans and a plan for its non-employee directors that are described below. The compensationcost charged to expense (included in selling, general and administrative) was $3.6 million and $3.7 million for the years ended June 30, 2007 and 2006, respectively. Thetotal income tax benefit recognized in the consolidated income statements for stock based compensation expense for the years ended June 30, 2007 and 2006 was$885,000 and $1.2 million, respectively. No compensation cost was capitalized as part of inventory and fixed assets for the years ended June 30, 2007 and 2006.
The Company’s stock option plans, which are shareholder approved, permit the grant of stock options and shares to its employees and directors. The Companybelieves that such awards better align the interests of its employees and directors with those of its shareholders and have been granted with an exercise price equal to themarket value of the Company’s stock at the date of grant. Such stock option plans are described below.
• The 1993 Incentive Stock Option Plan reserved 1,120,000 shares of common stock for issuance to key employees. The plan provides for three-year vesting of theoptions at a rate of 33% annually. The options are exercisable over 10 years, and options are not to be granted at less than the fair market value of the underlyingshares at the date of grant. No change of control provisions exist for options outstanding under this plan.
• The amended 1997 Stock Incentive Plan reserved 2,400,000 shares of common stock for issuance to officers, directors, employees, consultants or advisors tothe Company. This plan provides for incentive stock options, nonqualified options, stock appreciation rights and restricted stock awards to be granted at exerciseprices to be determined by the Compensation Committee of the Board of Directors. The plan provides for three-year vesting of the options at a rate of 33%annually. The term of each option is 10 years from the grant date. As of June 30, 2007, there were 16,000 shares available for grant under this plan. All ofparticipant’s options become fully exercisable if the participant’s employment is terminated without cause or the participant resigns with good reason within twelvemonths after a change of control of the Company. The Compensation Committee of the Board of Directors may also accelerate a participant’s options upon theoccurrence of a change of control.
• The 2002 Long-Term Incentive Plan (as amended at the 2005 Annual Meeting of Shareholders) reserved 1,600,000 shares of common stock for issuance toofficers, employees, consultants or advisors to the Company. This plan provides for incentive stock options, nonqualified options, stock appreciation rights andrestricted stock awards to be granted at exercise prices to be determined by the Compensation Committee of the Board of Directors. The plan generally providesfor three-year vesting of the options at a rate of 33% annually, and provides a term of 10 years from the grant date. As of June 30, 2007, there were 223,140shares available for grant under this plan. No change of control provisions exist for options under this plan.
• Since 1993, the Company has compensated its non-employee directors with a grant of stock options issued at fair market value on the date following the annualmeeting of shareholders. The stock option grants have had a term of 10 years and vesting period of six months after the date of grant. The 1993 Director Planhad 60,000 reserved shares remaining but not issued when it was replaced by the 1999 Director Plan. The 1999 Director Plan had 248,000 reserved sharesremaining but not issued when it was replaced by the 2003 Directors Equity Compensation Plan (the “2003 Director Plan”), which reserved 250,000 shares ofcommon stock. Under the 2003 Director Plan, the number of shares granted (rounded up to the nearest 100 shares) was calculated by dividing $200,000 by theaverage per share stock price of the common stock for the 30-day period immediately preceding the grant date. The 2003 Directors Plan was amended at the2006 Annual Meeting of Shareholders to provide that (i) non-employee directors will receive annual awards of restricted stock, as opposed to stock options, and(ii) the Board of Directors may, in its discretion, grant new non-employee directors an option to acquire shares of common stock or an additional restricted stockaward. The number of shares of restricted stock to be granted will be established from time to time by the Board. Until changed by the Board, the number ofshares of restricted stock so awarded to each non-employee director will be determined by dividing $80,000 by the fair market value of the common stock on thedate of grant. Such restricted stock granted will vest in full on the day that is six months after the date of grant, or upon the earlier occurrence of (i) the
48

SCANSOURCE, INC. AND SUBSIDIARIES
Notes to Consolidated Financial Statements
June 30, 2007
non-employee director’s termination of service as a director by reason of death, disability or retirement, or (ii) a change in control of the Company. If a non-employee director terminates service for any other reason, he or she will forfeit all of his or her right, title and interest in and to the restricted stock as of the dateof termination. The amended plan also provides that all options granted under the plan, if any, will vest and become exercisable on the day that is six monthsafter the date of grant, or upon the earlier occurrence of (i) the non-employee director’s termination of service as a director by reason of his or her death, disabilityor retirement, or (ii) a change in control of the Company. As of June 30, 2007, there were 157,600 shares available for grant under this plan. No change ofcontrol provisions exist for options outstanding under this plan.
The fair value of each option is estimated on the date of grant using the Black-Scholes-Merton option-pricing formula that uses assumptions determined at the dateof grant. Grants of 396,860 options, 290,400 options, and 311,800 options occurred during the years ended June 30, 2007, 2006 and 2005, respectively. The fair valueof options granted during the year ended June 30, 2007 is estimated using weighted-average assumptions as follows: expected volatility of 35.9%, expected dividends of0%, expected term of 4.7 years, and risk-free interest rate of 5.04%. Expected volatilities are based on implied volatilities from the Company’s stock prices. The Companyuses historical data to estimate option exercises and terminations within the valuation model. The expected term of options is based on historical data and represents theperiod of time that options granted are expected to be outstanding. The risk-free rate for periods within the contractual life of the option is based on the U.S. Treasury yieldcurve in effect at the time of grant. Compensation costs related to the outstanding grants are amortized on the straight-line method over the vesting period of the optionfrom the grant date to final vesting date using the fair value of the options.
The fair value of options granted during the year ended June 30, 2006 is estimated using weighted-average assumptions as follows: expected volatility of 40%,expected dividend of 0%, expected term of 5 years, and risk-free interest rate of 4.3%. The fair value of options granted during the year ended June 30, 2005 is estimatedusing weighted-average assumptions as follows: expected volatility of 38.1%, expected dividend of 0%, expected term of 6.5 years, and risk-free interest rate of 3.8%.
A summary of option activity under the plans as of June 30, 2007 and changes during the year then ended is presented below:
Shares
Weighted-Average
Exercise Price
Weighted-AverageRemainingContractual
Term (Years)
AggregateIntrinsic Value
($ in thousands)
Outstanding at June 30, 2006 1,827,492 $17.34Granted 396,860 31.18Exercised (142,312) 9.12Forfeited (30,734) 22.77
Outstanding at June 30, 2007 2,051,306 $20.52 6.22 $23,623
Vested or anticipated to vest in future, at June 30, 2007(net of expected forfeitures of 51,189 shares) 2,000,117 $20.27 6.14 $23,545
Exercisable at June 30, 2007 1,413,949 $16.00 4.85 $22,657
The total intrinsic value of options exercised during the years ended June 30, 2007, 2006 and 2005 was $2.9 million, $8.8 million and $4.4 million, respectively.
49

SCANSOURCE, INC. AND SUBSIDIARIES
Notes to Consolidated Financial Statements
June 30, 2007
A summary of the status of the Company’s nonvested shares as of June 30, 2007, and changes during the year then ended, is presented below:
SharesWeighted-Average Grant
Date Fair-Value
Nonvested at June 30, 2006 521,230 $13.89Granted 396,860 12.60Vested (268,404) 14.47Forfeited (12,329) 13.73
Nonvested at June 30, 2007 637,357 $12.85
The weighted-average-grant-date fair value of 290,400 and 311,800 options granted during the years ended June 30, 2006 and 2005 was $12.51 and $17.26,respectively.
At June 30, 2007, there was approximately $6.6 million of total unrecognized compensation cost related to nonvested share-based compensation arrangementsgranted under the plans. The cost is expected to be recognized over a weighted-average period of 2.4 years. The total fair value of shares vested during the years endedJune 30, 2007, 2006 and 2005 is $3.9 million, $3.9 million and $3.0 million, respectively.
For the years ended June 30, 2007, 2006 and 2005, the number of options exercised for shares of common stock was 142,312, 408,673 and 213,642, respectively.Cash received from option exercise under all share-based payment arrangements for the years ended June 30, 2007, 2006 and 2005 was $1.1 million, $2.7 million and$2.8 million, respectively. The actual tax benefit realized for tax deductions from option exercise of the share-based payment arrangements totaled $2.0 million, $1.0million and $1.8 million for the years ended June 30, 2007, 2006 and 2005, respectively.
The Company issues shares to satisfy the exercise of options.
50

SCANSOURCE, INC. AND SUBSIDIARIES
Notes to Consolidated Financial Statements
June 30, 2007
(7) Income Taxes
Income tax expense (benefit) consists of:
Year ended June 30,
2007 2006 2005
(in thousands)Current:
Federal $20,213 $22,495 $20,969State 2,338 2,392 2,731Foreign 2,531 2,531 302
Total current 25,082 27,418 24,002
Deferred:Federal 423 (4,649) (2,104)State 8 71 (231)Foreign 474 (1,248) 343
Total deferred 905 (5,826) (1,992)
Total $25,987 $21,592 $22,010
A reconciliation of the U.S. Federal income tax expense at a statutory rate of 35% to actual income tax expense, is as follows:
Year ended June 30,
2007 2006 2005
(in thousands)U.S. Federal income tax at statutory rate $24,036 $21,572 $20,267Increase (decrease) in income taxes due to:
State and local income taxes, net of U.S. Federal income tax benefit 1,525 1,528 1,788Tax credits (108) (848) (419)Valuation allowance (34) (1,457) (116)Effect of foreign operations, net (359) 166 509Stock compensation 291 620 92Other 636 11 (111)
$25,987 $21,592 $22,010
51

SCANSOURCE, INC. AND SUBSIDIARIES
Notes to Consolidated Financial Statements
June 30, 2007
The tax effects of temporary differences that give rise to significant portions of the deferred tax assets and liabilities at June 30, 2007 and 2006 are presented below:
2007 2006
(in thousands)Deferred tax assets derived from:
Allowance for accounts receivable $ 5,194 $ 3,611Inventories 5,682 6,737Nondeductible accrued expenses 1,754 5,026Net operating loss carryforwards 176 279Tax credits 171 199Deferred compensation 1,627 979Stock compensation 2,606 1,386
Total deferred tax assets 17,210 18,217Valuation allowance (47) (81)
Total deferred tax assets $17,163 $18,136
Deferred tax liabilities derived from:Timing of amortization deduction from intangible assets $ (1,020) $ (720)Timing of depreciation and other deductions for building and equipment (277) (645)
Total deferred tax liabilities $ (1,297) $ (1,365)
Net deferred tax assets $15,866 $16,771
The net deferred tax asset is reported in the consolidated balance sheets as deferred income taxes and other non-current assets.
The components of pretax earnings are as follows:
Year ended June 30,
2007 2006 2005
(in thousands)Domestic $58,901 $53,451 $57,693Foreign 9,772 8,183 212
$68,673 $61,634 $57,905
At June 30, 2007, the Company has: (i) gross net operating loss carryforwards of approximately $278,000 for U.S. Federal income tax purposes that begin expiring in2020; (ii) state income tax credit carryforwards of approximately $263,000 that begin expiring in 2019; (iii) net foreign operating loss carryforwards of approximately$155,000 that begin expiring in 2008. At June 30, 2007, a valuation allowance of $47,000 has been provided for a portion of the foreign operating loss carryforward, as itis more likely than not that some portion or all of the amounts will not be realized. The valuation allowance decreased by $34,000 and $1,457,000 during the years ended
52
SCANSOURCE, INC. AND SUBSIDIARIES
Notes to Consolidated Financial Statements
June 30, 2007
June 30, 2007 and June 30, 2006, respectively.
The Company has not provided U.S. income taxes for undistributed earnings of foreign subsidiaries that are considered to be retained indefinitely for reinvestment.The distribution of these earnings would result in additional foreign withholding taxes and additional U.S. federal income taxes to the extent they are not offset by foreigntax credits, but it is not practicable to estimate the total liability that would be incurred upon such a distribution.
(8) Commitments and Contingencies
The Company leases office and warehouse space under noncancelable operating leases that expire through September 2017. Future minimum lease paymentsunder operating leases are as follows:
Payments
(in thousands)Fiscal year ended June 30:
2008 $ 2,9622009 3,1162010 2,9952011 2,6392012 2,205Thereafter 9,703
$23,620
Lease expense was approximately $2.2 million, $1.7 million and $1.5 million for the years ended June 30, 2007, 2006 and 2005, respectively.
On April 27, 2007, the Company entered into an agreement to lease approximately 600,000 square feet for distribution, warehousing and storage purposes in abuilding located in Southaven, Mississippi. The lease also provides for a right of first refusal on an additional 147,000 square feet of expansion space. The lease providesfor market rental rates and commences upon substantial completion of construction, which is expected to be October 1, 2007, with a term of 120 months, and 2consecutive 5-year extension options.
The Company has contractual obligations of approximately $3.7 million for the warehouse relocation project and various other purchases at June 30, 2007.
A majority of the Company’s net revenues in 2007, 2006 and 2005 were received from the sale of products purchased from the Company’s ten largest vendors. TheCompany has entered into written distribution agreements with substantially all of its major vendors. While the Company’s agreements with most of its vendors containstandard provisions for periodic renewals, these agreements generally permit termination by either party without cause upon 30 to 120 days notice.
53

SCANSOURCE, INC. AND SUBSIDIARIES
Notes to Consolidated Financial Statements
June 30, 2007
On November 21, 2006, a purported stockholder filed a derivative lawsuit in the United States District Court for the District of South Carolina in Greenville, SouthCarolina against certain current and former officers and directors of the Company and against the Company, as a nominal defendant, asserting causes of action based onalleged violations of securities laws (including alleged violations of Section 10(b), 14(a) and 20(a) of the Securities Exchange Act of 1934 and Rule 10b-5 of the SEC) andother common law claims including, breach of fiduciary duty, aiding and abetting and unjust enrichment relating to allegations concerning certain of the Company’s priorstock option grants. The lawsuit seeks relief in the form of an accounting, rescission, unspecified money damages, disgorgement, attorneys’ fees, fees and expenses andother relief. On April 2, 2007, the Court appointed the plaintiff as lead plaintiff and ordered that any later actions filed in the same court and that relate to the same factsshall be consolidated. Our response, including a motion to dismiss the lawsuit, is currently due on September 10, 2007.
On April 11, 2007, another purported stockholder filed a substantially similar derivative lawsuit also related to the Company’s prior grants of stock options. This actionwas also filed in the United States District Court for the District of South Carolina in Greenville, South Carolina against certain current and former officers and directors ofthe Company and against the Company, as a nominal defendant, and asserts substantially similar causes of action and claims for relief. The plaintiff in this second actionhas filed a motion to consolidate the two actions and appoint the plaintiff as a co-lead plaintiff. Our response, including a motion to dismiss the lawsuit, is currently due onSeptember 10, 2007. The derivative lawsuits are in a preliminary stage and the Company believes that it is taking appropriate actions regarding both derivative lawsuits.
The Company is also continuing voluntarily to provide information to the SEC and the Department of Justice in connection with the Special Committee’s review.
On March 12, 2007 the Company’s insurance carrier, subject to a reservation of rights, provided a preliminary position on coverage for the first derivative claim inwhich the carrier indicated that the lawsuit allegations appear to constitute a claim within coverage of the Company’s insurance policy. The carrier continues to assesscoverage of this matter.
On April 13, 2007, the Company provided notice to the insurance carrier of the second action. The insurance carrier is reviewing the second action and assessingcoverage for the matter. The carrier has indicated, however, that its coverage position with regard to the second action will be consistent with the first; i.e., that theallegations of the second derivative lawsuit appear to constitute a claim within the coverage of the Company’s insurance policy. The carrier has not recognized as withincoverage the costs, fees and expenses incurred for the work related to the Special Committee at this stage. The Company is evaluating its alternatives to address itscoverage claim position.
The Company or its subsidiaries are, from time to time, parties to lawsuits arising out of operations. Although there can be no assurance, based upon informationknown to the Company, the Company believes that any liability resulting from an adverse determination of such lawsuits would not have a material adverse effect on theCompany’s financial condition or results of operations.
The Company received an assessment for a sales and use tax matter for the five calendar years ended 2003 and the first quarter ended March 31, 2004. Based onthis assessment, the Company has determined a probable range for the disposition of that assessment and for subsequent periods. Although the Company is disputingthe assessment, it accrued a liability of $1.3 million at June 30, 2005. As of June 30, 2007, the Company has paid approximately $1.0 million. The Company is disputingthe entire $1.3 million assessment including payments made on the liability. Although there can be no assurance of the ultimate outcome at this time, the Companyintends to vigorously defend its position.
The Company, subsequent to June 30, 2007 has purchased the remaining 8% minority interest in Netpoint.
54

SCANSOURCE, INC. AND SUBSIDIARIES
Notes to Consolidated Financial Statements
June 30, 2007
(9) Employee Benefit Plan
The Company has a defined contribution plan under Section 401(k) of the Internal Revenue Code that covers all employees meeting certain eligibility requirements.For the years ended June 30, 2007, 2006 and 2005 the Company provided a matching contribution of $407,000, $372,000 and $336,000, respectively, which was equalto one-half of each participant’s contribution, up to a maximum matching contribution per participant of $800 for 2007, 2006 and 2005. The Company determines itsmatching contributions annually and can make discretionary contributions in addition to matching contributions. In fiscal 2007, 2006 and 2005, the Company madediscretionary profit-sharing contributions of approximately $4.6 million, $4.2 million and $3.6 million, respectively. Employer contributions are vested over a five-yearperiod.
The Company also maintains a non-qualified, unfunded, deferred compensation plan that allows eligible executives to defer a portion of their compensation inaddition to receiving discretionary matching contributions from the Company. Employer contributions are vested over a five-year period.
(10) Property and Equipment
Property and equipment is comprised of the following:
June 30,
2007 2006
(in thousands)Land $ 3,133 $ 2,225Buildings and leasehold improvements 22,278 21,691Computer software and equipment 12,009 12,306Furniture, fixtures and equipment 26,201 24,061
63,621 60,283Less accumulated depreciation (36,840) (33,185)
$ 26,781 $ 27,098
(11) Goodwill and Other Identifiable Intangible Assets
In accordance with SFAS No. 142, Goodwill and Other Intangible Assets, the Company performs its annual test of goodwill at the end of each fiscal year to determine ifimpairment has occurred. In addition, the Company performs an impairment analysis for goodwill whenever indicators of impairment are present. This testing includes thedetermination of each reporting unit’s fair value using market multiples and discounted cash flows modeling. During fiscal years 2007, 2006 and 2005, no impairment chargerelated to goodwill was recorded. During fiscal year 2007, the Company acquired additional goodwill of $13.8 million, primarily through the acquisitions of T2 Supply, LLC andadditional interest in Netpoint. During fiscal year 2006, the Company acquired additional goodwill of $967,000 from the purchase of additional interests in OUI and Netpoint.
55

SCANSOURCE, INC. AND SUBSIDIARIES
Notes to Consolidated Financial Statements
June 30, 2007
Changes in the carrying amount of goodwill and other intangibles assets for the years ended June 30, 2006 and 2007, by operating segment, are as follows:
NorthAmerican
DistributionSegment
InternationalDistribution
Segment Total
(in thousands)Balance as of June 30, 2005 $ 5,746 $7,169 $12,915
Goodwill acquired during 2006 513 454 967Fluctuations in foreign currencies — 522 522
Balance as of June 30, 2006 $ 6,259 $8,145 $14,404Goodwill acquired during 2007 13,822 679 14,501Fluctuations in foreign currencies — 456 456
Balance as of June 30, 2007 $20,081 $9,280 $29,361
Included within other assets are identifiable intangible assets as follows:
June 30, 2007 June 30, 2006
GrossCarryingAmount
AccumulatedAmortization
NetBookValue
GrossCarryingAmount
AccumulatedAmortization
NetBookValue
(in thousands)Amortized intangible assets:
Customer lists $18,338 $1,538 $16,800 $338 $302 $ 36Debt issue costs 606 420 186 532 254 278Trade names 818 82 736 —Non-compete agreements 1,785 595 1,190 — — —
Total $21,547 $2,635 $18,912 $870 $556 $314
56
— —

SCANSOURCE, INC. AND SUBSIDIARIES
Notes to Consolidated Financial Statements
June 30, 2007
The weighted average amortization period for all intangible assets was approximately thirteen, four and three years for the years ended June 30, 2007, 2006 and2005, respectively. Amortization expense for the years ended June 30, 2007, 2006 and 2005 was $2.1 million, $200,000 and $364,000, respectively. Estimated futureamortization expense is as follows:
Year endedJune 30,
AmortizationExpense
2008 $ 2,0492009 1,8912010 1,2822011 1,2822012 1,282Thereafter 11,126
$18,912
(12) Segment Information
The Company is a leading distributor of specialty technology products, providing value-added distribution sales to resellers in the specialty technology markets. TheCompany has two reporting segments, which are based on geographic location. The measure of segment profit is operating income, and the accounting policies of thesegments are the same as those described in Note 2.
North American Distribution
North American Distribution offers products for sale in five primary categories: (i) AIDC and POS equipment sold by the ScanSource sales unit, (ii) voice, data andconverged communications equipment sold by the Catalyst Telecom sales unit, (iii) voice, data and converged communications products sold by the Paracon sales unit,(iv) video conferencing and telephony products sold by the T2 Supply sales unit, (v) electronic security products and wireless infrastructure products through itsScanSource Security Distribution sales unit. These products are sold to more than 13,000 resellers and integrators of technology products that are geographicallydisbursed over the United States and Canada in a pattern that mirrors population concentration. No single account represented more than 6% of the Company’sconsolidated net sales for the fiscal years ended June 30, 2007, 2006 or 2005, respectively.
International Distribution
The international distribution segment sells to two geographic areas, Latin America (including Mexico) and Europe, and offers AIDC and POS equipment to more than6,000 resellers and integrators of technology products. This segment began during fiscal 2002 with the Company’s purchase of a majority interest in Netpoint and thestart-up of the Company’s European operations. Of this segment’s customers, no single account represented more than 1% of the Company’s consolidated net salesduring the fiscal years ended June 30, 2007, 2006 and 2005, respectively.
Inter-segment sales consist of sales by the North American distribution segment to the international distribution segment. All inter-segment revenues and profits havebeen eliminated in the accompanying consolidated financial statements.
57

SCANSOURCE, INC. AND SUBSIDIARIES
Notes to Consolidated Financial Statements
June 30, 2007
Selected financial information for each business segment are presented below:
Year ended June 30,
2007 2006 2005
(in thousands)Sales:
North American distribution $1,697,832 $1,461,048 $1,310,789International distribution 317,279 223,809 172,883Less intersegment sales (28,184) (19,257) (14,578)
$1,986,927 $1,665,600 $1,469,094
Depreciation and amortization:North American distribution $ 6,243 $ 5,186 $ 4,958International distribution 687 580 547
$ 6,930 $ 5,766 $ 5,505
Operating Income:North American distribution $ 61,972 $ 53,776 $ 56,999International distribution 13,361 9,534 1,757
$ 75,333 $ 63,310 $ 58,756
Assets:North American distribution $ 636,553 $ 508,591 $ 395,381International distribution 101,895 108,906 74,223
$ 738,448 $ 617,497 $ 469,604
Capital expenditures:North American distribution $ 3,929 $ 8,441 $ 3,687International distribution 612 990 406
$ 4,541 $ 9,431 $ 4,093
(13) Acquisitions
On July 3, 2006, the Company entered into an agreement with SKC Communications Products, Inc. to purchase the assets of T2 Supply LLC (“T2”) for a cashpayment of approximately $50 million. T2 is a distributor of video conferencing and telephony products with 37 employees based in Lenexa, Kansas. T2 provides itsreseller customers technical support for the configuration of video conferencing and sound solutions, an extended warranty program, training, marketing, a customerresource website, and bridging services. As a result of the acquisition, the Company expects to enhance its long-term convergence strategy by adding video conferencingproducts and expertise, and to provide cross-selling opportunities to T2’s customer base of voice and video conferencing resellers.
58

SCANSOURCE, INC. AND SUBSIDIARIES
Notes to Consolidated Financial Statements
June 30, 2007
In June 2007, the Company made an adjustment to the purchase price allocation associated with this acquisition to increase the value of the amortizable intangibleassets by $8.6 million to reflect the final fair value assessment, resulting in a reduction of goodwill for that same amount. The final purchase price was recorded with$13.8 million of goodwill and $20.6 million of amortizable intangible assets related primarily to customer lists and non-compete agreements. The valuation of theidentifiable intangible assets acquired was based on management’s estimates using a valuation report prepared by a third party. All of the assets acquired relate to theNorth American distribution segment.
This acquisition did not meet the conditions of a material business combination as defined by the Securities and Exchange Commission. As such, it is not subject tothe disclosure requirements of SFAS 141.
The Company acquired an additional 8% ownership of Netpoint in the year ended June 30, 2007 for approximately $1.1 million. The Company acquired anadditional 12% ownership of OUI and 8% ownership of Netpoint in each of the years ended 2006 and 2005 for approximately $1.3 million and $550,000, respectively.
The following supplemental noncash investing and financing activities are presented for the July 3, 2006 acquisition of T2 and the April 15, 2005 acquisition ofEuropdata Connect UK Ltd.:
Year ended June 30,
2007 2006 2005
(In thousands)
Fair value of assets acquired $15,249 $ — $ 7,358Fair value of liabilities assumed (298) — (5,023)
Net assets acquired $14,951 $ — $ 2,335
(14) Related Party Transactions
During fiscal year 2007, 2006 and 2005, the Company had sales of $5.6 million, $5.1 million and $3.7 million, respectively, and interest income of $62,000,$21,000 and $0, respectively, to companies affiliated with the minority shareholder of Netpoint. At June 30, 2007, 2006 and 2005, accounts receivable from thesecompanies totaled $678,000, $1.1 million and $153,000, respectively.
During fiscal year 2007, the Company had sales of $6.8 million and purchases of $1.2 million to companies affiliated with members of management. At June 30,2007, net accounts receivable balance from these companies totaled $1.2 million.
The minority shareholders of OUI originally owed the Company approximately $206,000, in the form of a note, in connection with an adjustment to the purchaseprice. The note was payable in thirty-six monthly installments and matured on October 31, 2005. Interest on the note was 2.01% per annum. The holders of the note wereallowed to prepay the note in whole or part, without premium or penalty. The balance of this note was $26,000 at June 30, 2005 and was settled in July 2005.
********
59

Market for the Registrant’s Common Stock and Related Shareholder Matters
The Company’s common stock is quoted on The NASDAQ Global Select Market under the symbol “SCSC.” The Company has never paid or declared a cash dividendsince inception and the Board of Directors does not intend to institute a cash dividend policy in the foreseeable future. Under the terms of the Company’s revolving creditfacility, the payment of cash dividends is prohibited. Effective June 5, 2006, the Board of Directors of the Company approved a two-for-one stock split of the commonstock effected in the form of a 100% common stock dividend. The effect of the stock split has been recognized retroactively in all share and per share data. OnAugust 22, 2007, there were approximately 18,500 recorded and known beneficial holders of the Company’s common stock. The following table sets forth, for the periodsindicated, the high and low sales prices of the Company’s common stock on the NASDAQ Global Select Market.
High Low
Fiscal Year 2007First quarter $32.25 $27.59Second quarter 32.39 28.18Third quarter 30.78 25.22Fourth quarter 33.98 26.41
Fiscal Year 2006First quarter $26.05 $21.16Second quarter 30.80 23.88Third quarter 30.48 26.65Fourth quarter 31.62 26.33
60

Stock Price Performance Graph
The following stock performance graph compares cumulative total shareholder return on the Company’s common stock over a five year period with the Nasdaq StockMarket (US) Index and with the Standard Industrial Classification (“SIC”) Code Index (SIC Code 5045 – Wholesale – Computers and Peripheral Equipment and Software)for the same period. Total shareholder return represents stock price changes and assumes the reinvestment of dividends. The graph assumes the investment of $100 onJuly 1, 2002.
COMPARE 5-YEAR CUMULATIVE TOTAL RETURN AMONG SCANSOURCE INC.,NASDAQ MARKET INDEX AND SIC CODE INDEX
0255075
100125150175200225250
2002 2003 2004 2005 2006 2007
Do
llars
SCANSOURCE INC. NASDAQ MARKET INDEX SIC CODE INDEX
Assumes $100 invested on July 1, 2002Assumes Dividend Reinvested
Fiscal year ending June 30, 2007
2002 2003 2004 2005 2006 2007
SCANSOURCE INC. 100.00 87.12 193.52 139.85 190.98 208.37NASDAQ MARKET INDEX 100.00 111.20 141.42 141.27 150.56 180.25SIC CODE INDEX 100.00 86.17 124.62 110.84 118.52 135.98
61

Board of DirectorsJames G. Foody Chairman (non-executive)
Michael L. Baur Chief Executive Officer, ScanSource, Inc.
Steven R. Fischer President, North Fork Business Capital Corporation
Michael J. Grainger Former President and Chief Operating Officer, Ingram Micro, Inc.
John P. Reilly Managing Partner, Keltic Financial Services LLC
OfficersMichael L. Baur Chief Executive Officer
R. Scott Benbenek President of Worldwide Operations
Richard P. Cleys Vice President and Chief Financial Officer
Andrea D. Meade Executive Vice President of Operations and Corporate Development
John J. Ellsworth General Counsel and Corporate Secretary
John K. Black President – Catalyst Telecom
Elias Botbol President – ScanSource Latin America
Xavier Cartiaux Managing Director – ScanSource Europe
John R. Gaillard President – ScanSource Security Distribution
Jill R. Phillips President – T2 Supply
Clayton D. Sorensen President – Paracon
Paul J. Constantine Vice President – Solutions and Services
Linda B. Davis Vice President and Treasurer
Gregory B. Dixon Vice President and Chief Technology Officer
P. Christopher Elrod Vice President – Information Systems
Gerald Lyons Vice President and Corporate Controller
Marsha M. Madore Vice President – Human Resources
Shelby L. McCloud Vice President – Warehouse Operations
Robert S. McLain, Jr. Vice President – Marketing
Timothy M. Ramsey Vice President – Reseller Financial Services
Stock ListingThe Company’s Stock is traded on The Nasdaq Global Select Market under thesymbol SCSC.
Securities CounselAlston & Bird LLP • Charlotte, North Carolina
Transfer AgentAmerican Stock Transfer and Trust Company • New York, New York
Independent AccountantsErnst & Young LLP • Greenville, South Carolina
Shareholder InquiriesScanSource, Inc., welcomes inquiries from its shareholders and other interestedinvestors. For further information or a copy of SEC form 10K, contact ourInvestor Relations Department at 800.944.2439, ext. 4375, or by e-mail [email protected].
Annual MeetingThe annual meeting of shareholders of the Company will be held at 10:00 a.m.on December 6, 2007, at the Marriott Hotel, 1 Parkway East, Greenville, South Carolina.
Corporate HeadquartersGreenville, South Carolina • 864.288.2432
LocationsTempe, Arizona Miami, FloridaNorcross, Georgia Lenexa, KansasEagan, Minnesota Buffalo, New YorkMemphis, Tennessee Bellingham, WashingtonRichmond, BC, Canada Toronto, ON, CanadaMexico City, Mexico Brussels, BelgiumLiege, Belgium Olivet, FranceBad Homburg, Germany Eindhoven, NetherlandsCrawley, United Kingdom Hull, United Kingdom
41624 9/14/07 3:20 PM Page 19


