35
We can change the world as we know it…. Jayne Belnap Jill Baron USGS
| Date post: | 20-Dec-2015 |
| Category: |
Documents |
| View: | 218 times |
| Download: | 2 times |

We can change the world as we know it….
Jayne BelnapJill BaronUSGS
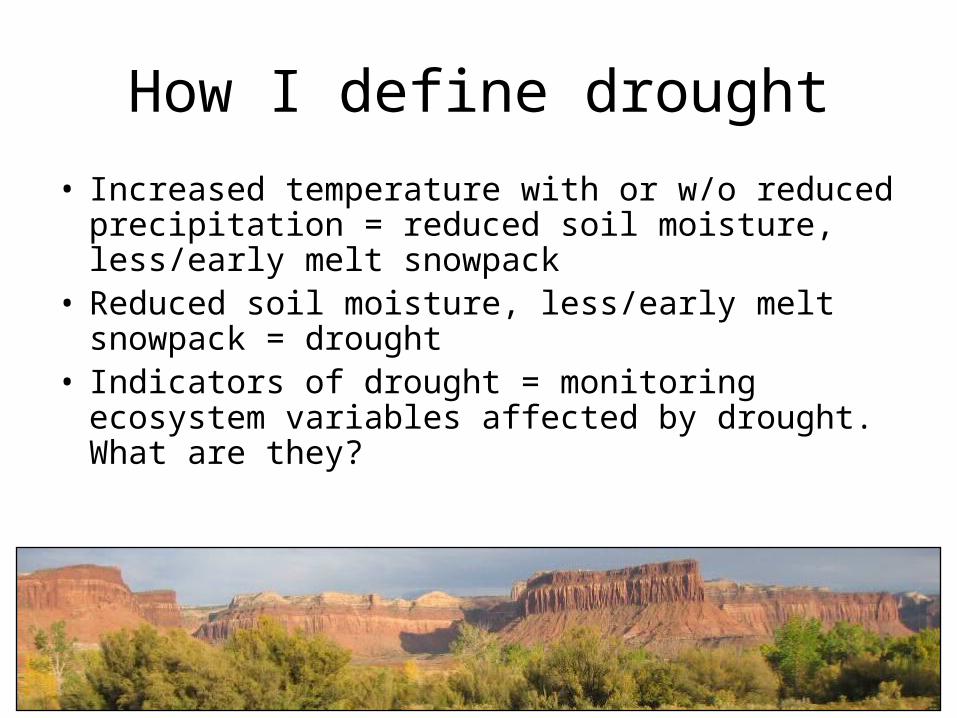
How I define drought
• Increased temperature with or w/o reduced precipitation = reduced soil moisture, less/early melt snowpack
• Reduced soil moisture, less/early melt snowpack = drought
• Indicators of drought = monitoring ecosystem variables affected by drought. What are they?

Climate monitoring

GCM
PDO (CP)
Climatemonitoring
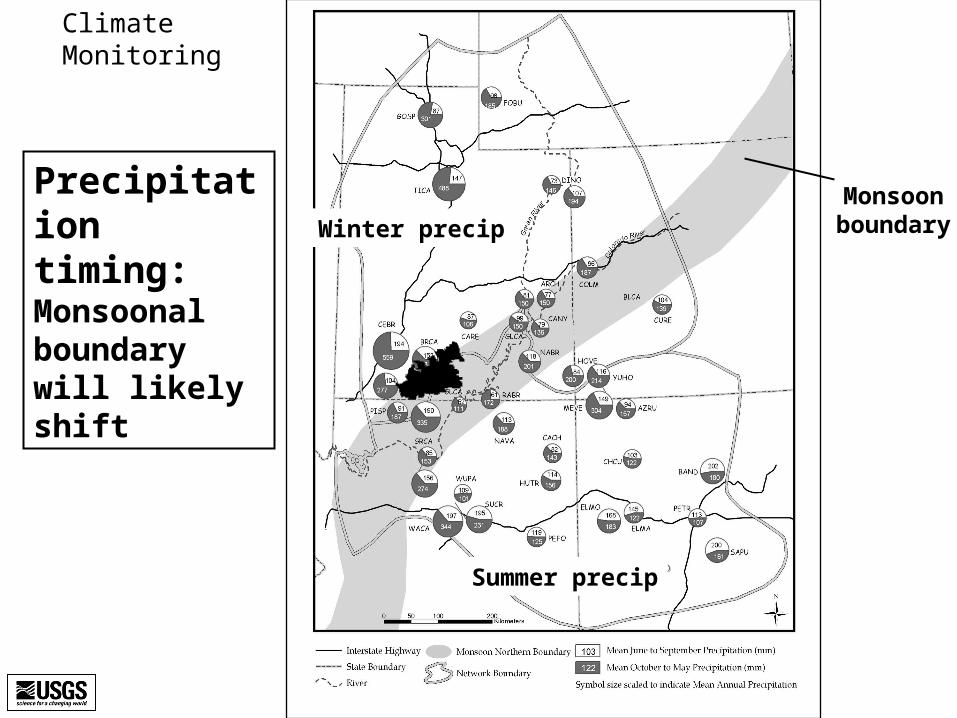
MonsoonboundaryWinter precip
Summer precip
Precipitation timing:Monsoonal boundary will likely shift
ClimateMonitoring

“Expected values” of warming effects on RAIN-vs-SNOW
Derived from monthly IPCC GCM-grid pdfs, and UW’s VIC model
daily inputs, 1950-1999
2025
2050
By 2025
By 2050
Climate Monitoring Needs
But what are the ecosystemImpacts???

Center of Mass as a proxy for spring onset is biased towards higher elevations and latitudesWhat are the ecological impacts?
Climate monitoring
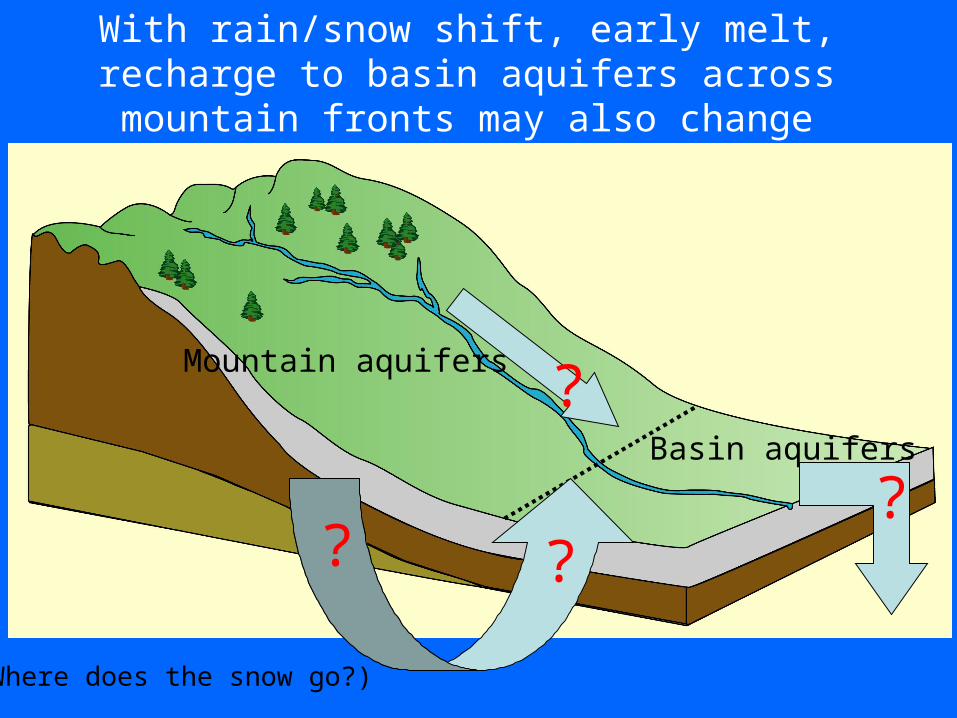
With rain/snow shift, early melt, recharge to basin aquifers across mountain fronts may also
change
Basin aquifers
Mountain aquifers
?
?
??
(Where does the snow go?)

A simulation experiment A simulation experiment
SIMULATED CHANGES IN SIMULATED CHANGES IN MOUNTAIN (in situ) MOUNTAIN (in situ) RECHARGE under a uniform RECHARGE under a uniform +3ºC warming+3ºC warming
Simulated with the U of WA VIC-hydrologic model: Hidalgo et al, in prep
Widespread 15 to Widespread 15 to 25% changes 25% changes projected, mostly as projected, mostly as declines in rechargedeclines in recharge
Notice that these fractions are MUCH larger than in the preceding “total outflow” map.
Expect large changes in plant communities

BoulderGlacierGlacier National Park, MT
1910
2007
Morton Elrod photoCourtesy of GNP Archives
Pederson/Fagre photoUSGS
Will impact lakes, streams Temperature Nutrients BiotaSurface albedoPlant/soil/animal comm before and after

Water Chemistry1991-1999 vs. 2000-
2006
Solute Sky Pond
Inlet% Change
The Loch Outlet
% Change
Calcium +33 +16
Nitrate +31 +50
Sulfate +45 +31
Silica +23 +2
DOC +4 -18
Drought has big effect on chem and thus biota!!
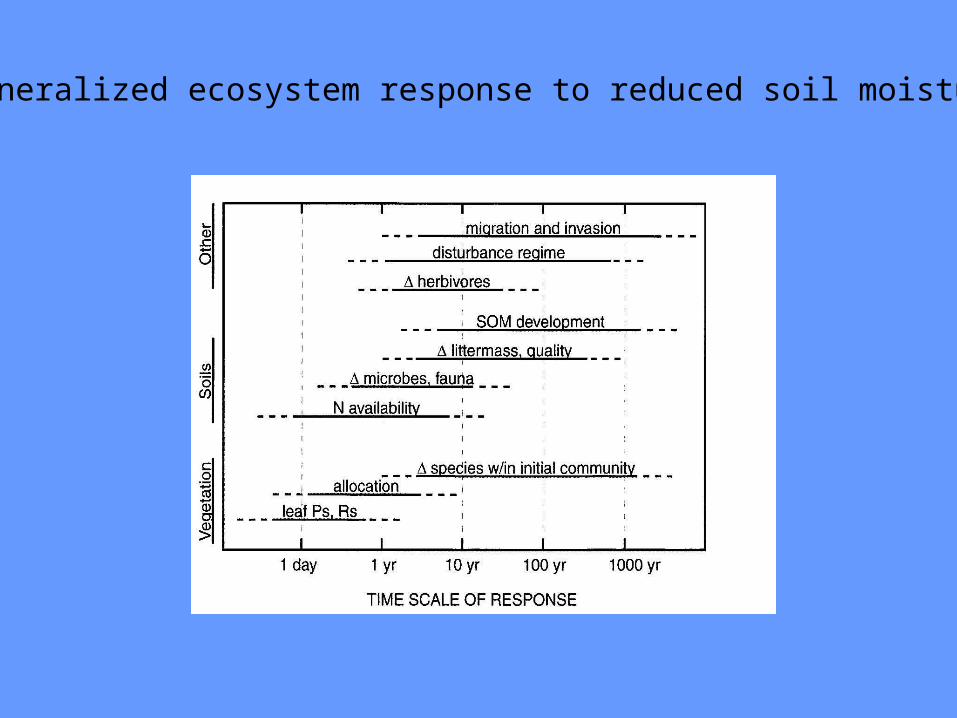
Generalized ecosystem response to reduced soil moisture

Year
1985 1990 1995 2000
Tre
e m
orta
lity
rate
(% y
r-1)
0.0
0.5
1.0
1.5
Long-term USGS research in the Sierra Nevada shows that in foreststhat otherwise appear to be healthy: • Tree mortality rates have doubled • This doubling parallels temperature-driven increases in drought
van Mantgem & Stephenson 2007

HigherTemperatures/Reduced
Soil Moisture
r2=0.97

Loss of mosses, lichens
• Less soil moisture• Less N fixation, greater N loss • Less C fixation, greater C loss• Less soil roughness• Less soil stability• Less soil biota activity• Less plant-available nutrients
Higher temperatures (+ surface disturbance)

Future warming willreduce soil moisture *Decreased plant cover (esp. shallow rooted plants)
*Slower recovery from disturbance
*Decreased soil stability,forage, habitat
Decreased, altered precipitation will also affect biocrusts, plants

*Treeline *Plant community composition (species, functional type) *Plant cover *Phenology at all life stages *Slower nutrient cycling, lower plant available nutrients
With lower soil moisture(drought), will get shiftsin:

Reduced vegetative cover (droughts, ORVs, grazing, blading, pumping) = fewer clouds, less precipitation
30% less than average rain for light area/ + 10% rain over dark
Early snow melt, urbanization, and irrigation will affect precipitation too
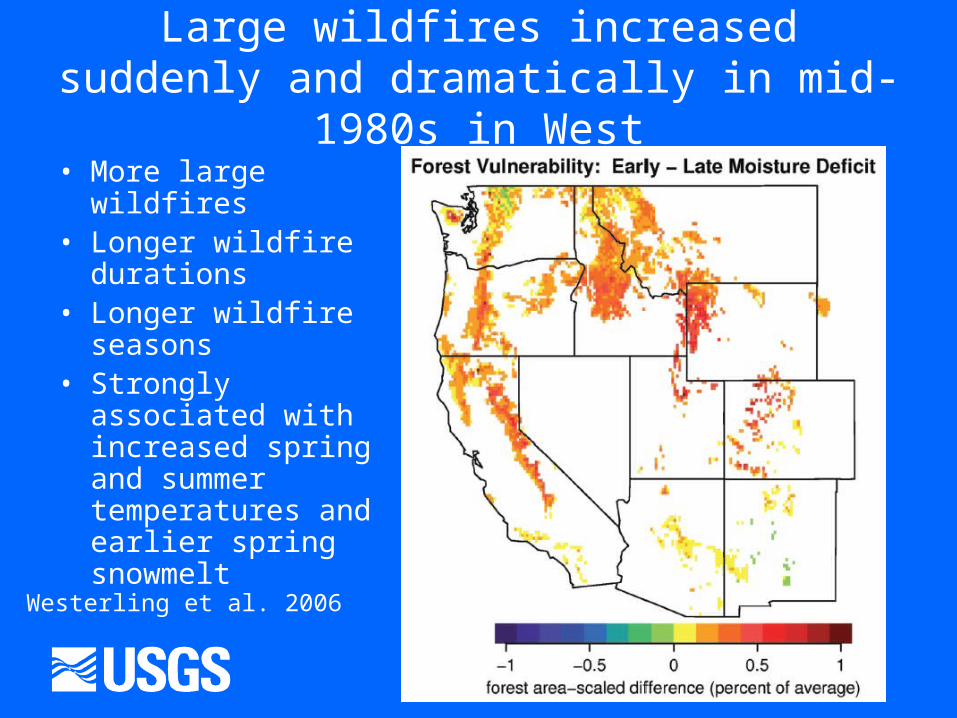
Large wildfires increased suddenly and dramatically in mid-1980s in West
• More large wildfires• Longer wildfire
durations• Longer wildfire
seasons• Strongly associated
with increased spring and summer temperatures and earlier spring snowmelt
Westerling et al. 2006

Drought increases fires; 1.4 – 5 times more area is expected to burn with increased temperature.
Fire reduces plant cover, increases water and wind erosion

Invasive annuals are spreading rapidly*Drought = no or little cover, more soil erosion
*Wet followed by drought = more dry fuels, more fire

Soil surface disturbance
Reduces plant/crust cover Increases albedo, soil erosion
*ORVs in so. CA alone produce 6 billion pounds dust/year*Need to separate from climate

Means less plant and crust cover, more roads = > albedo, more soil erosion, less wildlife habitatALL THESE USES TAKE WATER
UT/CO/WY: Oil, gas, oil shale, uranium, tar sands, wind/solar, potash, gold, silver, you name it
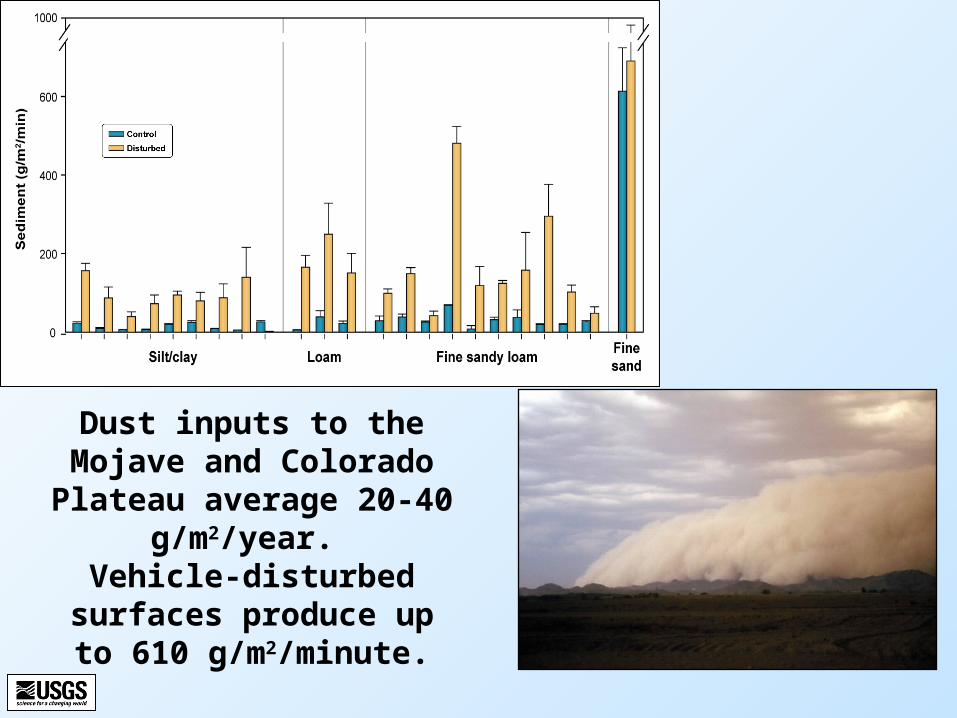
Dust inputs to the Mojave and Colorado Plateau
average 20-40 g/m2/year. Vehicle-disturbed surfaces
produce up to 610 g/m2/minute.

Pumping water from shallow aquifers can lowerwater tables. Drought will exacerbate. Leads to >plant death, albedo, dust

Drought, invasives and disturbance interact to create huge amounts
of dust
Invasives and disturbance interact to
create more dust

Dust production is a local, regional, and global issue
Coral reefs die!

Vehicle accidents, Valley Fever, asthma,
other respiratory diseases
Dust creates economic woes as well

Soil Variable % Loss
Silt 38-43
Organic Matter 60-70
Nitrogen 15-60
Phosphorus 66-79
Potassium 68-96
Magnesium 68-86
Manganese 43-57
Sodium 44-62
Impact of 100 years of grazing on CP soils
Thus, soil water-holding capacity and soil fertility is greatly reduced
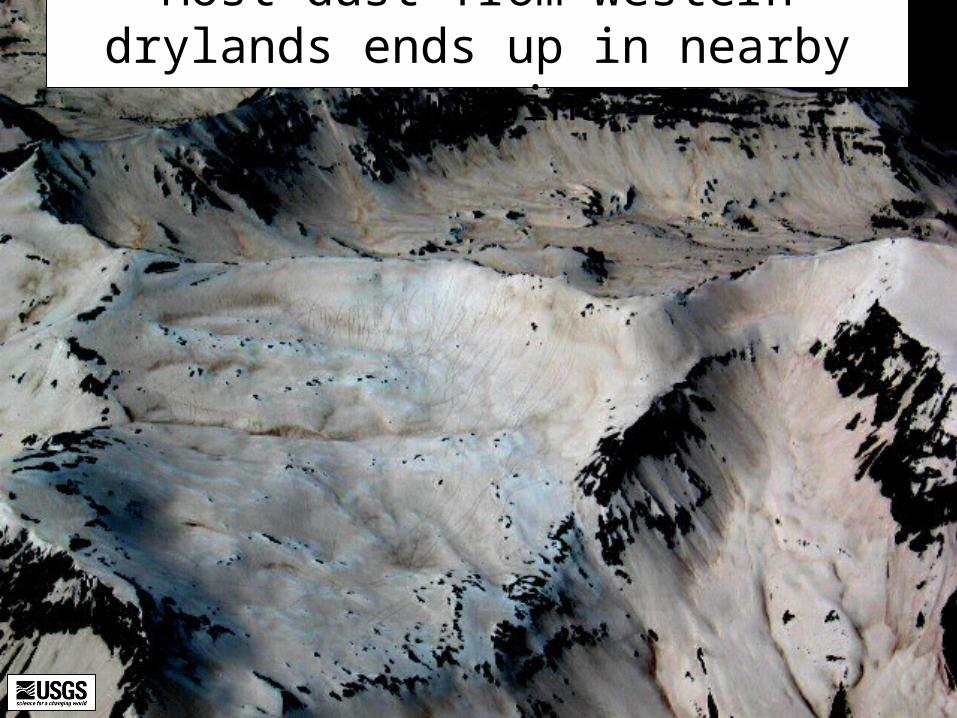
Most dust from western drylands ends up in nearby mountains

~1860
~1000 BC
~3000 BC
~1920
~1000 BC
~1850
~1920
Pacific Railway Act - 1862
Taylor Grazing Act - 1934
Dust from the Colorado Plateau (Mojave) in San Juan Mountain lakes
(Neff et al. 2008)
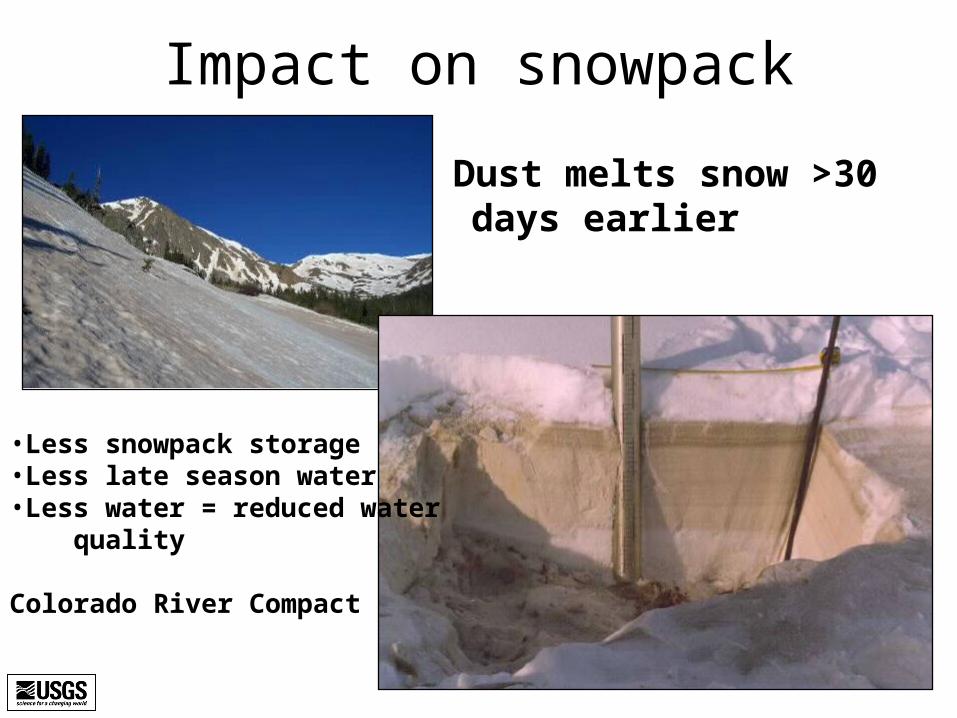
Dust melts snow >30 days earlier
Impact on snowpack
•Less snowpack storage•Less late season water •Less water = reduced water quality
Colorado River Compact
Averag
e ann
ual stream
N
O
3 m
g/l
and
flu
x kg
N/y
r
0
1
2
3
4
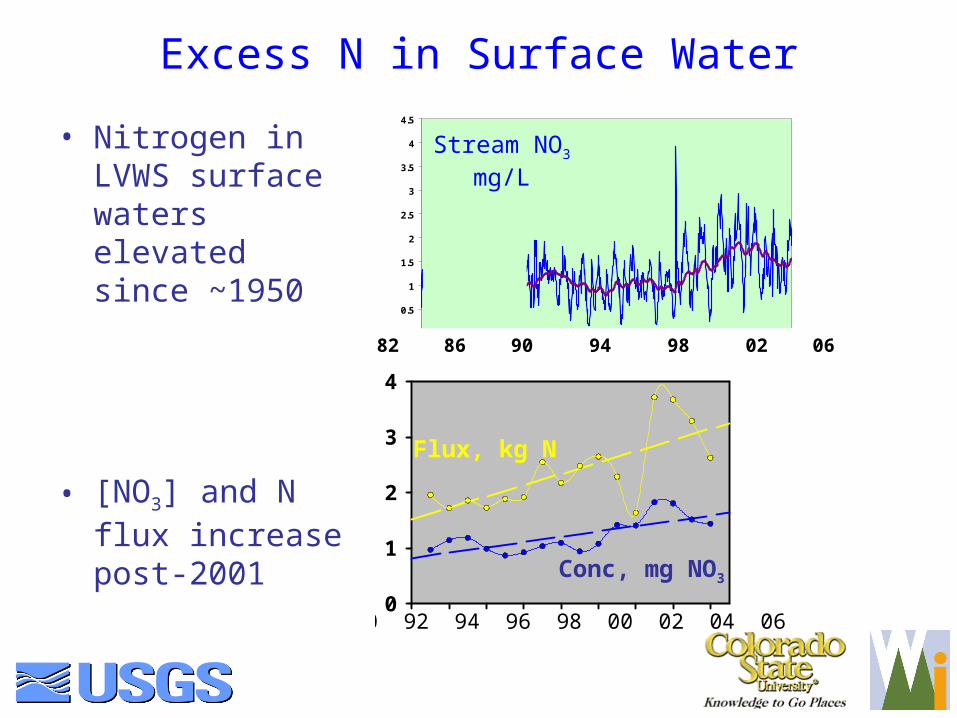
Excess N in Surface Water
Flux, kg N
Conc, mg NO3
90 92 94 96 98 00 02 04 06
• Nitrogen in LVWS surface waters elevated since ~1950
• [NO3] and N flux increase post-2001
LOCH OUTLET NO3
0
0.5
1
1.5
2
2.5
3
3.5
4
4.5
82 86 90 94 98 02 06
Stream NO3
mg/L
What info do we need to predict drought impacts and inform mgmt actions?
• WAY more climate stations (snow melt rates, dust inputs, precip type/timing/intensity)
• Redmond (“effective” rainfall) index• Distinguish land use/N dep from climate across
rainfall timing, elevational gradients– Veg/crust change (e.g., invasives, dominants, T/E)– Faunal response to veg changes (habitat, forage)
• Maps of current and future land uses (and thus bare ground (get at cumulative impacts)

• Soil moisture (surface 1 cm and subsurface)• Soil vulnerability maps (wind, water erosion)• Response of aquatic biota to glacier loss,
snow/rain, early melt, low water• Fate of water from snow/rain, early snow
melt (recharge? runoff?), infrastructure impact


