51
ANNUAL REPORT AND ACCOUNTS 2016
| Date post: | 11-Jul-2018 |
| Category: |
Documents |
| Upload: | truongtram |
| View: | 215 times |
| Download: | 0 times |
ANNUAL REPORT AND ACCOUNTS 2016

WE CREATE SOME OF THE WORLD’S MOST
DISTINCTIVE AND TECHNICALLY ADVANCED
PAPER PRODUCTS, USING MATERIALS FROM
COTTON AND WOOD TO CARBON FIBRE.
WE SUPPORT INDUSTRIES FROM PACKAGING
TO DIGITAL IMAGING AND AEROSPACE WITH
PRODUCTS THAT ARE AT THE CUTTING
EDGE OF PERFORMANCE.
ANNUAL REPORT AND ACCOUNTS 2016

MANUFACTURINGLOCATION R & D SALES OFFICE PARTNERS
GLOBAL LOCATIONS
12 11
13
1415
9
54
3
1
8
7
6
10
BURNESIDE, UK - HEAD OFFICEPARIS, FRANCEFRANKFURT, GERMANY DUBAI INDIA SHANGHAI, PRC GUANGZHOU, PRC HONG KONG, PRC MALAYSIA AUSTRALIA SOUTH AFRICA BRAZIL PHILADELPHIA, USA SCHENECTADY, USACREWE, UK
123456789101112131415
2
MUCH OF THE FUTURE GROWTH
OF JAMES CROPPER IS CLOSELY TIED TO
THE GREEN AGENDA, FROM DISPLACING
PLASTICS IN PACKAGING TO HELPING MAKE AIRCRAFT LIGHTER
“
”

GLOBAL PRESENCEREDEFINING PAPER FOR LAND ROVER
“ IN 2016 EXPORTS HIT A NEW HIGH FOR JAMES CROPPER, INCREASING BY 14% TO EXCEED OVER HALF OF TURNOVER”
In May 2015 we collaborated with British artist, Steve Messam, to create the spectacular Paper Bridge installation in the heart of the Lake District ‐ using durable, red colour‐fast paper that would withstand Cumbria’s notorious weather and ensure no running of colour into the natural surroundings.
In November 2015 Paper Bridge went global when Land Rover commissioned an even more ambitious structure. As part of their Range Rover 45th birthday celebrations at the China International Automobile Exhibition the luxury SUV brand staged the world’s first ever drive across a paper bridge.
The five‐metre bridge was designed to take the weight of the iconic Range Rover, constructed solely from our Natural Crystal 330gsm white paper and entirely free of glue or bolts. The hand-built bridge took three days to construct using 54,390 sheets of paper, in order to support the 2,374 kilogram vehicle.
WHY A PAPER BRIDGE?
This meaningful feat of engineering and artistry was erected in China, the birthplace of paper, in the ancient water city of Suzhou – famous for its bridges and nicknamed the ‘Venice of the East’.

FUTURE FOCUSEDSUSTAINABLE INNOVATION WITH SELFRIDGES AND THE WHITWORTH
Selfridges is championing sustainability as part of its nationwide Bright New Things campaign - focusing on northern companies that come with real manufacturing heritage, have sustainable credentials, and use time honoured skills and production methods.
As part of the campaign, this dramatic installation was created at Selfridges Exchange Square, a meaningful celebration of the reopening of Manchester’s Whitworth gallery - now one of the most sustainable cultural venues in the UK.
‘Hands of Industry’ was built with more than 25,000 handmade cubes, made entirely from James Cropper paper. The paper was chosen to celebrate our commitment to
sustainable innovation ‐ made using fibres from used coffee cups, recycled at our industry‐first Reclaimed Fibre Plant.
“It’s almost a year since the Whitworth reopened. This installation is an ideal way to mark our first momentous year, and to cement our relationship with two of the country’s most creative companies, Selfridges and James Cropper. First wedding anniversaries are traditionally marked by giving gifts of paper; this beautiful, paper-based commission on the eve of our first anniversary thus feels rather fitting.”
Dr. Maria Balshaw Director of the Whitworth
CONTENTS
STRATEGIC REPORT 09
FINANCIAL HIGHLIGHTS 10
FINANCIAL SUMMARY 11
CHAIRMAN’S LETTER 12
CHIEF EXECUTIVE’S REVIEW 14
FINANCIAL REVIEW 18
OUR PEOPLE SET US APART 31
INVESTED IN OUR COMMUNITY 36
ENVIRONMENTAL COMMITMENT & SUSTAINABLE INNOVATION 38
GOVERNANCE 41
BOARD OF DIRECTORS 42
REPORT OF THE DIRECTORS 44
DIRECTORS’ REMUNERATION REPORT 49
SPOTLIGHT ON TFP 53
FINANCIAL STATEMENTS 57
INDEPENDENT AUDITOR’S REPORT 59
STATEMENT OF COMPREHENSIVE INCOME 60
STATEMENT OF FINANCIAL POSITION 61
STATEMENT OF CASH FLOWS 62
STATEMENT OF CHANGES IN EQUITY 63
NOTES TO THE FINANCIAL STATEMENTS 65
SHAREHOLDER INFORMATION 89
NOTICE OF ANNUAL GENERAL MEETING 91
05
Introduction
“ OUR COLLABORATION
WITH SELFRIDGES AND THE
WHITWORTH ART GALLERY
SHOWCASES PAPERS
MADE WITH RECYCLED
COFFEE CUPS.”
SUSAN WILSON
LUXURY PACKAGING DIRECTOR
JAMES CROPPER PLC

OUR PEOPLE SET US APART. THE IMPORTANCE WE
ATTACH TO OUR PEOPLE IS ALSO WHY OUR VALUES
MATTER SO MUCH.
THESE HELP US ENSURE WE PROVIDE A SAFE,
REWARDING AND INTERESTING PLACE
TO WORK AS WELL AS AN ENVIRONMENT THAT
ATTRACTS THE NEXT GENERATION OF TALENT.
MARK CROPPER, CHAIRMAN
”
06
TRUST, DIGNITY AND RESPECT
SAFETY AT WORK
MOTIVATED WORKFORCE
SUSTAINABILITY
COMMUNITY FOCUSED
CONTINUOUS LEARNING
PROFITABILITY
SUCCESSFUL CUSTOMERS
OUR VALUES
“
MARK CROPPER (RIGHT) WITH DAVID GLYNN, DRYERMAN (LEFT) AND JOHN LANGHORNE, ASSISTANT DRYERMAN (MIDDLE)

THE NEXT GENERATION OF SUSTAINABLE PACKAGING - JAMES CROPPER 3D PRODUCTS
“ JAMES CROPPER 3D PRODUCTS IS A BUSINESS WHICH CAPITALISES ON OUR INDUSTRY-
LEADING FIBRE AND COLOUR CAPABILITIES AS WELL AS OUR STAND-OUT COMMITMENT
TO SUSTAINABLE INNOVATION. THE BUSINESS IS ANSWERING A GLOBAL DEMAND FOR
SUSTAINABLE PACKAGING THAT ADDS REAL VALUE FOR BRANDS - A TRUE ALTERNATIVE
TO PLASTIC.”
PHIL WILD, CEO
09
STRATEGIC REPORT
STRATEGIC REPORT 09
FINANCIAL HIGHLIGHTS 10
FINANCIAL SUMMARY 11
CHAIRMAN’S LETTER 12
CHIEF EXECUTIVE’S REVIEW 14
FINANCIAL REVIEW 18
Strategic Report

Strategic Report - Financial Highlights
FINANCIAL HIGHLIGHTS
£87.9m
TOTAL REVENUE
83.1
84.5
87.9
79.2
78.2
2016
2015
2014
2013
2012
6.1
10.3
9.3
6.5
2016
2015
2014
2013
2012
£7.3m
NET DEBT
31.8
20.1
15.0
10.0
9.5
31.8p
DILUTED EPS
(2016 includes exceptional adjustments re impact of flood)
5.2
3.5
2.1
2.1
0.8
2016
2015
2014
2013
2012
£5.2m
PROFIT BEFORE TAX(excluding IAS 19 Pension adjustments)
(2016 includes exceptional adjustments re impact of flood)
2.6
1.3
1.2
1.0
2016
2015
2014
2013
2012
PROFIT BEFORE TAX
£3.9m
2016
2015
2014
2013
2012
3.9
7.3
22%
GEARING
20
33
23
(excluding IAS 19 deficit)
35
222016
2015
2014
2013
2012
CAPITAL EXPENDITURE
£4.1m4.1
2.6
3.0
4.1
5.9
2016
2015
2014
2013
2012
REVENUE BY REGION
2016
2015
2014
50% 60%40%30%20%10%
2013
2012
UK
Europe
Americas
Asia
Other
1110
Strategic Report - Financial Summary
FINANCIAL SUMMARY
SUMMARY OF RESULTS
2016 2015 2014 2013 2012 £’000 £’000 £’000 £’000 £’000
Revenue 87,920 83,052 84,518 79,241 78,223
Operating profit before interest (excluding IAS 19 impact & exceptionals) 6,264 3,899 2,545 2,535 1,207
Profit before tax (excluding IAS 19 impact) 5,173 3,494 2,088 2,052 843
Impact of IAS 19 (1,305 ) (919 ) (775 ) (806 ) 128
Profit before tax
(after IAS 19 impact) 3,868 2,575 1,313 1,246 971
Earnings per share - diluted 31.8p 20.1p 15.0p 10.0p 9.5p
BALANCE SHEET SUMMARY
2016 2015 2014 2013 2012 £’000 £’000 £’000 £’000 £’000
Non-pension assets – excluding cash 57,470 50,810 51,093 48,426 46,278
Non-pension liabilities – excluding borrowings (17,019 ) (14,289 ) (11,230 ) (10,831 ) (11,956 )
40,451 36,521 39,863 37,595 34,322
Net IAS 19 pension deficit (after deferred tax) (6,453 ) (11,554 ) (9,312 ) (7,972 ) (5,850 )
33,998 24,967 30,551 29,623 28,472
Net borrowings (7,305 ) (6,105 ) (10,277 ) (9,286 ) (6,505 )
Equity shareholders’ funds 26,693 18,862 20,274 20,337 21,967
Gearing % - before IAS 19 deficit 22% 20% 35% 33% 23%Gearing % - after IAS 19 deficit 27% 32% 51% 46% 30%Capital expenditure £’000 4,086 2,619 2,958 4,072 5,934

CHAIRMAN’S LETTER
Strategic Report - Chairman’s Letter
2016
2015
2014
2013
2012
Interim Final Proposed
7.9p
7.9p
7.9p
8.5p
9.3p
DIVIDEND PER SHARE 2016Dear Shareholders
I am delighted to report another year of strong progress in 2015/16.
Technical Fibre Products continues to deliver on our long held aspirations for the subsidiary. This year was marked by the commissioning of a new production line at the Burneside facility in the UK with further investments in the USA in particle plating technology. The UK investment doubles our production capacity for non- woven materials providing much needed room for growth. This year’s double digit growth would not have been achieved, however, without a significant improvement to the operational efficiencies of existing plant. Both sales growth and operational developments are a credit to the teams involved. A spotlight on Technical Fibre Products is presented in this Annual Report by TFP’s Managing Director Martin Thompson.
In Paper, growth has been sustained in a number of targeted markets of which packaging is one with a number of large global contracts acquired with world leaders in consumer electronics and luxury goods. During the year we have invested in additional capacity in embossing and ream wrapping in response to customer demand.
Investment for growth is a marked feature of the 2015/16 financial year. New subsidiary James Cropper 3D Products (“3DP”), created to provide stand-out sustainable moulded fibre products, made good progress with more expected in the coming year. This initiative resulted directly from the Board’s decision to create a new Technology & Innovation Department in early 2014. While it is still early days, we are hopeful that 3DP will provide another growth platform for the Group.
3DP also aligns with a broader theme for the Group: the demand for a growing number of our products is tied to the green or sustainable agenda, from carbon fibre veils for composite aircraft to fully recyclable paper products, themselves with high levels of recycled content. We follow such trends keenly, albeit never losing sight of the importance of more traditional markets and the tailored service we continue to provide them.
Looking internally, the progress of the Group is also being heightened by a continual drive to transform the way we operate across all functions, from operations to finance and commercial. Developments include revised structures and processes as well as continued investment in training, coaching and development programmes. Such advances, as set out further in the CEO report, are often unsung and can take considerable time to yield benefits, but they are essential and will provide the Group with considerable resilience.
Ultimately, however, it is our people, at every level, who are making the difference. Nowhere was this more apparent than in our workforce’s response to Storm Desmond at the Burneside facility. Hardly a single employee did not contribute to the recovery in some way, and many gave up their Christmas break to get us back on our feet. The turnaround was impressive, although the event was not without consequences. Around £0.7m of site wide replacement and repair projects were postponed as maintenance teams focused on recovery; these will be completed in the 2016/17 financial year. Net exceptional costs of £0.77m were incurred in the year as a result of insurance excesses, uninsured losses and the award of a grant to alleviate the impact of the flood. To mitigate future flood risks, the Board has approved £1m of capital investments in 2016/17 to build flood resilience at the Burneside site.
The importance we attach to our people is also why our values matter so much. These help us ensure we provide a safe, rewarding and interesting place to work as well as an environment that attracts the next generation of talent. We continue to monitor and measure our performance against them.
Diluted Earnings per Share (after the adjustment for IAS 19) increased by 58% to 31.8 pence compared to 20.1 pence in the previous year.
The Board is recommending a final dividend of 7.1 pence per share making a total dividend for the financial year of 9.3 pence, an increase of 9.4% on the prior year.
The other aspects of this year’s financial performance are covered in the CEO Report and elsewhere.
A personal highlight for me this year was the celebration we held to mark the opening of our new TFP line and our 170th anniversary. This was held primarily to thank our employees and community at Burneside. We invited the whole village and over 770 people came for tea and a tour. The village bakery provided cakes and the Burneside Ukelele Band kept us entertained. All who came remarked upon the friendly engaging atmosphere they encountered and the evident pride taken in the ‘Mill’, as we call it in the family.
Today we are so much more than a mill, with over 540 people and operations across the globe, as evidenced on the global map at the front of this report. We also work hard to make a positive contribution to the world, near and far. We will never stand still, there is still so much more we aspire to do, as suggested in the coming pages.
OUTLOOK
The Group has performed strongly in 2015/16, a testament to the strategies introduced and deployed in the last few years. Although we will be catching up with a number of deferred repair projects in 2016/17, growth will continue to be delivered with further capital investments across all divisions in support of focused market developments and group wide efficiency improvements. This gives me confidence that the Group will continue to advance for some years to come.
M A J Cropper Chairman
1312

1514
Strategic Report - Chief Executive’s ReviewStrategic Report - Chief Executive’s Review
CHIEF EXECUTIVE’S REVIEW
REVENUE OPERATING PROFIT BEFORE INTEREST (2015: £83.1m) (excluding IAS 19 impact & exceptional items) (2015: £3.9m)
£87.9m +6% £6.3m +61%
PROFIT BEFORE TAX PROFIT BEFORE TAX(after exceptional items but before IAS19 impact) (2015: £3.5m) (2015: £2.6m)
£5.2m +48% £3.9m +50%
NET BORROWINGS GEARING(2015: £6.1m) After IAS19 deficit (2015: 32%)
£7.3m +20% 27% -16%
DILUTED EARNINGS PER SHARE FULL YEAR DIVIDEND PER SHARE(2015: 20.1p) (2015: 8.5p)
31.8p +58% 9.3p +9%
PROFIT
I am pleased to report a 61% growth in operating profit before interest to £6.3m in the year to 2 April 2016, compared to £3.9m in the prior year, prior to the impact of IAS 19 pension adjustments and exceptional costs.
Profit before tax, after exceptionals and prior to IAS 19, was £5.2m, up £1.7m on 2015, representing an increase of 48%. Exceptionals are described in the financial review section of this report, and are applicable in the year to 2 April 2016, there were no exceptionals in the prior year.
Profit before tax of £3.9m was up £1.3m on prior year.
REVENUE
Group revenue for the financial year was £87.9m, up 6% on the prior year.
Revenue for James Cropper Paper grew by 1% in the year to £69.2m and operating profit by 7% to £2.6m.
For Technical Fibre Products revenue grew by 29% in the year to £18.7m and operating profit more than doubled with an increase of 117% to £5.9m.
RESEARCH AND DEVELOPMENT
Research and development (R&D) is a fundamental part of our growth strategy, adding to our capability, maintaining our competitiveness and bringing new product lines into our target markets. The Group continues to invest in research and development with expenditure in R&D of £1.8m this year, up 38% on prior year.
CAPITAL EXPENDITURE
Capital expenditure during the year was £4.1m (2015: £2.6m). The largest investment was on a new production line in TFP, completed and commissioned in the first half and doubling capacity.
CASH AND DEBT
The Group had gross debt of £10.5m at the balance sheet date and cash of £3.2m, giving a net debt of £7.3m (2015: £6.1m). The Group had undrawn overdraft and revolving credit facilities of £5.0m, at the balance sheet date and borrowings of £3.9m to be repaid within 12 months. The undrawn facilities and the cash provide funds against which the short term borrowings can be paid, leaving £4.3m of cash available to the Group at the year end. Post year end the Group has secured a second revolving credit facility of £5.0m.
Gearing at the financial year end, after deduction of the IAS 19 pension deficit, was down from 32% on the previous year to 27% this year.
STRATEGY
In 2013 we laid out five strategic platforms for growth that continue to drive progress across all areas of the company.
HIGH PERFORMANCE CULTURE
The capabilities, knowledge and motivation of our people continue to set James Cropper apart - we see this High Performance Culture as the foundation of our continued growth.
Measured improvements Part of our strategy is to measure our High Performance Culture through an employee survey. This has showed significant improvements since the previous survey two years ago.
Our previous survey recorded above-average levels of employee engagement and provided valuable insight for development. Only two years later, our latest survey showed an 11% increase in engagement spanning all topic areas explored; this is 10% higher than the national average. Insights also demonstrated the positive impact, business-wide, of our senior management restructuring.
92% I HAVE THE NECESSARY SKILLS AND KNOWLEDGE TO DO MY JOB WELL
95% I’M PREPARED TO CHANGE HOW I WORK TO IMPROVE BUSINESS EFFECTIVENESS
93% I KNOW WHAT’S EXPECTED OF ME IN MY JOB
80% I BELIEVE THAT THE COMPANY IS WELL LED BY ITS SENIOR MANAGEMENT TEAM
85% I AM FAIRLY TREATED BY MY MANAGER
Continued investment in individuals Our High Performance Culture is driven by continued investment in individuals at all levels in the company. We are drawing on world-class external training, coaching and development programmes to maximise performance, knowledge and skills - ultimately ensuring that we maintain our competitive edge.
Sales Excellence a permanent focus James Cropper businesses excel in sales by adding value. Our project-oriented approach provides comprehensive support to clients, in line with the quality of our products. As our programme of training and mentoring continues, I am proud to report that our sales teams are better equipped than ever before to exceed the expectations of our clients around the globe.
PHIL WILD Chief Executive Officer, James Cropper PLC.
MARK STARRS

1716
Strategic Report - Chief Executive’s Review
SUPERIOR LEVELS OF OPERATIONAL EXCELLENCE
We have continued to advance manufacturing capacity and processes, invested in world-first technical capabilities, extended our commitment to sustainability and achieved accreditations that support a truly competitive position in all our markets.
New potential for TFP, driven by sales growth This year we have opened a third TFP production line at Burneside Mills. This investment has doubled manufacturing capacity across this business. TFP has had a record year and we anticipate even better results in the future.
On page 53, a special report by Managing Director of TFP, Martin Thompson, describes other significant operational developments. These include product development on our nano-coating line and the opening of our particle-coating production facilities, as well as our new AS9100 accreditation - an invaluable asset which secures our position as a credible, reliable supplier to the aerospace industries.
Expanding capabilities in Paper Developments in Paper are driven by our knowledge of the global market, and our technical know-how. We have continued to invest in new technologies, expanding the possibilities for our global paper clients. This year we have made the investment in additional paper embossing capacities enabling us to create entirely unique textures, appearances and finishes for our customers. Developments such as these continue to enhance our position as industry leaders in bespoke papermaking. New ream-wrapping equipment has enhanced the presentation of stock orders to merchants.
ISO50001 accreditation underpins our sustainable innovations Sustainability is at the core of our values. We are a business not only striving to reduce environmental impact through our own responsible manufacture, but also through the products we create, so I am delighted to report our ISO 50001 certification in 2015. This internationally recognised energy-management standard demonstrates our on-going commitment to reducing energy consumption and greenhouse gas emissions. As an operational system, it drives energy efficiency and protects our energy security - we see this as one of many important progressions for our future-focused Group.
EXISTING MARKET OPPORTUNITIES
Driving organic growth in our core markets is a continued strategic focus, and this year we have seen positive results across the Group.
TFP - Core markets In TFP we continue to drive expansion in a number of core, profitable markets. Aerospace and Defence represent 30% of TFP sales and, supported by our AS9100 accreditation growth is strong.
See Martin Thompson’s special review (page 53), of exciting new applications for our nonwovens, as well as developments in thermals that confirm our position as thought leaders in technical fibre innovation.
Paper - Global strategy brings positive results In Paper, we are driving growth in a number of targeted markets including packaging. This year we have won a number of large global contracts including world-leaders in consumer electronics, luxury gifts and jewellery.
Our global position has strengthened on the back of our WOFE (Wholly Owned Foreign Enterprise) in China, which enables use of local currency, local communication and transactions. Perhaps most importantly, it enables us to keep complete chain of custody of our materials - supporting the accreditation and credibility of our products throughout the supply chain.
Additionally, we are re-establishing the global presence of certain paper products to align with global trends. One example is our Wall-Ready pre-coated inkjet media range, a cost-effective solution with broad applications in the fast-growing Sign & Display ‘print-on-demand’ market, as well as Photo Retail.
GAINING ADDITIONAL PROFITABLE MARKET SHARE
Continued research and development has underpinned several new developments this year, where we enter new global markets.
James Cropper 3D Products - The next generation of moulded fibre In 2014 we created a Technology and Innovation Department, led by our Chief Technology Officer Patrick Willink. The objective was to create a third business within the James Cropper Group - an additional platform for growth.
We undertook a rigorous scope of research; analysing global trends and fields of innovation, while exploring the wider potential of our unique capabilities in fibre innovation, colour application, design and global service provision.
James Cropper 3D Products is the result - a business which capitalises on our industry-leading fibre and colour capabilities as well as our stand-out commitment to sustainable innovation. As we launch we are answering a global demand for sustainable packaging that adds real value for brands - a true alternative to plastic.
Paper - Food contact paper is among new developments James Cropper paper adds value. This year, our new brand of certified food contact paper has launched to add value to the packaging experience for the high-end food and drink sector. Customers will benefit from exceptional and bespoke possibilities in colour, texture, creative finishing and technical performance - all realised at our Burneside Mill.
Also in Paper, the new Porcelain paper range is our smoothest ever paper - the new benchmark for flawless paper manufacture and effortless printing.
TFP - Out of this world TFP is a business driven by future-focused research and innovation, meaning we are always well placed to explore new market opportunities. Our products support future technologies and renewable energy, reduce fuel consumption in aeroplanes and provide fire protection in buildings…to mention just a few examples. This year, we are proud to see our nonwovens launch into space in NASA’s Jason-3 satellite - please see page 53 for Martin Thompson’s special review.
GLOBAL PRESENCE, GLOBAL SERVICE
As a global organisation we work to enhance our position at every level in the business - from sales excellence and service through to brand awareness and establishing thought leadership in our industries. Customer intimacy is a big part of this strategy - through developments in global service, and internationally important trade shows such as Luxepack and JEC, we strive to be close to our customers wherever they are.
Aligned with the best in the world This year has seen a number of high profile collaborations, which demonstrate our global presence and prove the relevance of our values in important market sectors.
Highlighted in this report, you will see the continued exposure of our PaperBridge creative collaboration - which has gone global and was commissioned by Land Rover. You will also find our creative partnership with the UK’s high-end retailer, Selfridges, and Manchester’s Whitworth gallery - now reopened as one of the most sustainable cultural venues in the UK. Through partnerships such as these we continue to set an example in our industry, and those of our clients.
Recognised thought leaders in sustainable innovation Our commitment to sustainability speaks to a global audience. In 2016, we gained exposure in national media, and on BBC Radio, when our industry leading Reclaimed Fibre Plant was highlighted as a pioneering solution to the ‘coffee cup problem’. Through our manufacturing standards, our sustainable innovations and our proactive approach to real world concerns, we continue to build our global reputation as thought leaders in our industry.
Phil WildChief Executive Officer

18 19
FINANCIAL REVIEW
REVENUE
2016 2015 CHANGE CHANGE £’000 £’000 £’000 %
Paper Products 69,182 68,505 677 1%
Technical Fibre Products 18,738 14,547 4,191 29%
Revenue 87,920 83,052 4,868 6%
Group Revenue increased year on year to £87.9m from £83.1m, a 6% increase. Revenues include a £750,000 receipt of business income insurance, designed to put the business in the same financial position it would have been in if Storm Desmond had not impacted one of our production facilities. Trade revenues for the Group, excluding business income insurance, are £87.2m a 5% increase on prior year. Clear growth for the Group in Europe and America in the year with trade in these regions now at 20% and 21% of total trade respectively.
Paper increased sales by 1% despite challenging market conditions where the first half saw the demise of a major global paper merchant and another UK based Paper mill.
The UK market also faced strong challenges from Europe, for the large part of the year, when the Euro remained weak. Against this backdrop, UK sales were under pressure however strong opportunities in Europe and the US came through delivering growth in these markets. All regions provide good opportunity for profitable growth of our innovative products in line with our core strategic direction for Paper.
TFP sales show an increase of 29% on the prior year, an excellent year in terms of growing sales with strong margins in the key markets of aerospace, green technologies and defence. During the year the business installed and commissioned additional non-woven production capacity and a particle plating line, and sales started to initiate on these investments.
2016 2015 CHANGE CHANGE £’000 £’000 £’000 %
Paper Products 2,592 2,419 173 7%
Technical Fibre Products 5,904 2,719 3,185 117%
Other Group expenses (2,232 ) (1,239 ) (993 ) 80%
Operating profit before Interest prior to IAS 19 and exceptionals 6,264 3,899 2,365 61%
Net interest prior to IAS 19 finance costs (326 ) (405 ) 79 -20%
Profit before tax prior to IAS 19 and exceptionals 5,938 3,494 2,444 70%
Exceptional costs (765 ) - (765 ) -
Profit before tax prior to IAS 19 5,173 3,494 1,679 48%
Net IAS 19 pension adjustments
Net current service charge required (839 ) (418 ) (421 ) 101%
Net interest (466 ) (501 ) 35 -7%
Net IAS 19 pension adjustment before tax (1,305 ) (919 ) (386 ) 42%
Profit before tax 3,868 2,575 1,293 50%
PROFIT SUMMARY
OPERATING PROFIT
Group Operating Profit before interest, prior to the impact of IAS 19 and exceptional costs, has seen growth with a 61% increase on prior year, £6.3m (2015: £3.9m).
Paper attained a 7% increase on profitability, assisted by the sale of the Papermilldirect on-line retailing business which detracted from our core business-to-business strategic growth direction.
TFP experienced record profits delivering £5.9m compared to £2.7m in the prior year.
2016 2015 CHANGE CHANGE £’000 £’000 £’000 %
Raw materials and consumables used (35,795 ) (34,415 ) (1,380 ) 4%
Energy costs (4,519 ) (5,186 ) 667 -13%
Employee benefit costs (24,316 ) (22,189 ) (2,127 ) 10%
Depreciation and amortisation (2,306 ) (2,502 ) 196 -8%
Other expenses (16,996 ) (15,427 ) (1,569 ) 10%
Other income and changes in inventory 2,276 566 1,710 302%
Total Expenses (81,656 ) (79,153 ) (2,503 ) 3%
Energy costs were lower than the prior year with the overall cost of consumption being £4.5m compared to £5.2m in the comparable period. Raw materials and consumables used are in line with growth. The average full time equivalent employed increased to 518 from 507 in the comparative year. Included in employment costs are provisions for a profit related bonuses due to employees as a result of the successful growth in profitability. Employment costs were £24.3m compared to £22.2m in the previous year. IAS 19 dictates that a charge be made against operating profits of £839,000 over and above the cost of current service contributions, (2015: £418,000). As a result of this employment costs after the impact of IAS 19, and as presented in the Income Statement, are £25.1m (2015: £22.6m).
Within expenses we have increased freight and distribution charges, supporting costs for the development and training programmes for the Group, marketing activities, general repairs and maintenance and site running costs. One of the consequences of Storm Desmond was to defer £712,000 expenditure on a programme of replacement and repair activities at the Burneside site. This programme will be picked up in 2016/17. Also within expenses we have the start-up costs for James Cropper 3D Products (3DP), a diversification opportunity to bring growth, strength and greater presence to the Group. Start-up costs for this entity are in line with expectations and captured within other expenses.
EXCEPTIONAL COSTS
On the 5th December last year, large areas of northern England were affected by exceptionally high rainfall. This resulted in flooding across Cumbria impacting one of our sites based in Burneside. This site had some areas that were significantly affected, however the response from various teams across our workforce to secure the safety of employees and get production at the Burneside site back up as quickly as possible was exceptional and full production was reinstated more quickly than first expected.
The Group is working closely with our loss adjusters on making good damage to utilities, structures and facilities. Our insurance for this period covered losses to stocks, consequential losses and plant and equipment, with excesses of £15,000 for stocks, and £1 million for consequential losses and plant and equipment. The business is grateful to Cumbria Local Enterprise Partnership and to Cumbria County Council, which has already started to make payments against a total £1 million grant to contribute towards uninsured losses.
Uninsured losses within exceptional costs come to £1.77m in the year, covering £1.01m excess for stock, and for physical damage to property, and £750,000 of other uninsured damaged items, including an estimate from management for ongoing uncertainties at this stage as work with the loss adjusters continues. Also recognised separately within exceptionals is full recognition of the £1m grant as income. Net costs of £765,000 have been recognised separately within exceptionals in the year. It is expected that the claim will be finalised during the latter half of this calendar year.
Managing the potential impact from floods in the future is one aspect of risk management that will be accelerated. The Group’s main strategy going forward is to build flood resilience at the Burneside site. The Group Board has approved an additional £1m of capital investment to protect key structures or relocate them away from a flood risk zone. This is a key part of the Group’s strategic risk management programme, ensuring best practice for business continuity in protecting a key site, our reputation and our market share.
EXPENSES
This table captures key expenses down to operating profit before interest prior to IAS 19 and exceptionals.
Strategic Report - Financial Review Strategic Report - Financial Review

2120
Strategic Report - Financial Review Strategic Report - Financial Review
EBITDA
The Group monitors EBITDA prior to the impact of IAS 19 and exceptional costs. EBITDA is operating profit before interest, tax, depreciation and amortisation.
2016 2015 CHANGE CHANGE £’000 £’000 £’000 %
OPERATING PROFIT before Interest prior to IAS 19 impact and exceptionals 6,264 3,899 2,365 61%
Depreciation and amortisation 2,306 2,502 (196 ) -8%
EBITDA prior to IAS 19 and exceptionals 8,570 6,401 2,169 34%
The Group achieved a 34% increase in EBITDA, £8.6m compared to £6.4m in the prior year comparative, both Paper and TFP continue to be strongly cash generative.
EBITDA
2016 2015 CHANGE CHANGE £’000 £’000 £’000 %
Net IAS 19 pension adjustments
Net current service charge required (839 ) (418 ) (421 ) 101%
Net interest (466 ) (501 ) 35 -7%
Net IAS 19 pension adjustment before tax (1,305 ) (919 ) (386 ) 42%
Operating profit before interest prior to IAS19 & exceptionals 6,264 3,899 2,365 61%
Exceptional costs (765 ) - (765 ) -
Operating profit after exceptionals 5,499 3,899 1,600 41%
IAS 19 impact on operating profit (839 ) (418 ) (421 ) 101%
Operating profit after IAS 19 4,660 3,481 1,179 34%
Net interest prior to IAS 19 (326 ) (405 ) 79 -20%
IAS 19 impact on interest (466 ) (501 ) 35 -7%
Interest payable and similar charges (792 ) (906 ) 114 -13%
Profit before Tax 3,868 2,575 1,293 50%
IAS 19 IMPACT
THE IMPACT OF IAS 19 ON OPERATING PROFIT AND PROFIT BEFORE TAX
IAS 19 “Employee benefits” requires a set methodology to be applied to calculate the pension scheme deficits, finance and operating costs based on assumptions determined by the reporting date. This can result in a volatile view of pension management from one reporting period to the next. The Group manages pensions according to an on-going valuation and more details of this approach is provided under “Pensions”.
IAS 19 determines £1.3m of costs (2015: £0.9m) to be recognised within the income statement. After taking this into account profit before tax, in the year was £3.9m (2015: £2.6m).
CURRENCY US$ €
Opening rate April 2015 v. £ 1.4826 1.3677
Closing rate March 2016 v. £ 1.4132 1.2417
Exchange rate movement 4.7% 9.2%
Strengthen/(Weaken) v. £
A comparison of the opening and closing exchange rates for the financial year show both the euro and the dollar strengthening against sterling by the close of the year. Both the euro and the dollar weakened against sterling in the first half of the year and recently the dollar strengthened to close at 4.7% against sterling and the euro is 9.2% stronger against sterling by the close of the year. The majority of exports into continental Europe are invoiced in €s. €s are used to purchase € priced pulp and other € priced raw materials. Similarly, export sales outside Europe are invoiced in US$ and the receipts fund the purchase of US$ priced pulp. Potential foreign currency surpluses or deficits are dealt with by a combination of foreign currency forward selling and forward purchasing contracts. No forward contracts are in place at the balance sheet date. The Groups foreign exchange risk management approach to currency fluctuations is discussed under the Principal Risks section in this Financial Review.
TAX
The Group’s total tax charge for the year is £915,000 (2015: £694,000) a tax rate of 23% on profit before tax. The effective rate is higher than the standard rate of corporation tax in the UK mainly as a result of the costs of overseas operations not being recognised for corporation tax purposes in the UK. The deferred tax balances as at 2 April 2016 have been calculated based on the rate of 18% substantially enacted at the balance sheet date.
CASH, BORROWINGS AND BALANCE SHEET
During the year the Group secured a £5.5m revolving credit facility to provide financial flexibility. Over the year net debt increased by £1.2m, long term borrowings (falling due after more than a year) increased by £499,000 to £6.6m. The Group’s aim is to provide stability of financing via the generation of strong operating cash inflows and a range of financing facilities with varying maturities from a variety of sources. The Group has secured a second revolving credit facility of £5.0m post year end.
2016 2015 CHANGE £’000 £’000 £’000
Cash and cash equivalents 3,186 2,721 465
Borrowings: repayable within one year (3,886 ) (2,720 ) (1,166 )
Borrowings: non-current (6,605 ) (6,106 ) (499 )
Net debt (7,305 ) (6,105 ) (1,200 )
Borrowings: repayable within one year 3,886 2,720 1,166
Borrowings: non-current 6,605 6,106 499
Facilities drawn down 10,491 8,826 1,665
Undrawn facilities 5,013 4,658 355
Facilities 15,504 13,484 2,020
Cash and cash equivalents 3,186 2,721 465
Undrawn facilities 5,013 4,658 355
Funds available at year end 8,199 7,379 820
Borrowings: repayable within one year (3,886 ) (2,720 ) (1,166 )
Funds available in excess of one year 4,313 4,659 (346 )
Cash and cash equivalents moved from £2.7m to £3.2m in the year. Net cash inflow from operating activities in the year was £3.7m after deducting past service pension deficit payments of £1.3m, (2015: £7.8m after deducting past service deficit payments of £1.4m). The Group’s aim is to grow revenues whilst controlling working capital, during the year the working capital cash outflow was £2.1m (2015: inflow of £3.5m). Capital expenditure in the year was £4.1m (2015: £2.6m).
FUNDING
2322
Strategic Report - Financial Review Strategic Report - Financial Review
2016 2015 £’000 £’000
Non-pension assets - excluding cash 57,470 50,810
Non-pension liabilities - excluding borrowings (17,019 ) (14,289 )
40,451 36,521
Net IAS 19 pension deficit (after deferred tax) (6,453 ) (11,554 )
33,998 24,967
Net borrowings (7,305 ) (6,105 )
Equity shareholders’ funds 26,693 18,862
Gearing % - before IAS 19 deficit 22% 20%Gearing % - after IAS 19 deficit 27% 32%Capital Expenditure £’000 4,086 2,619
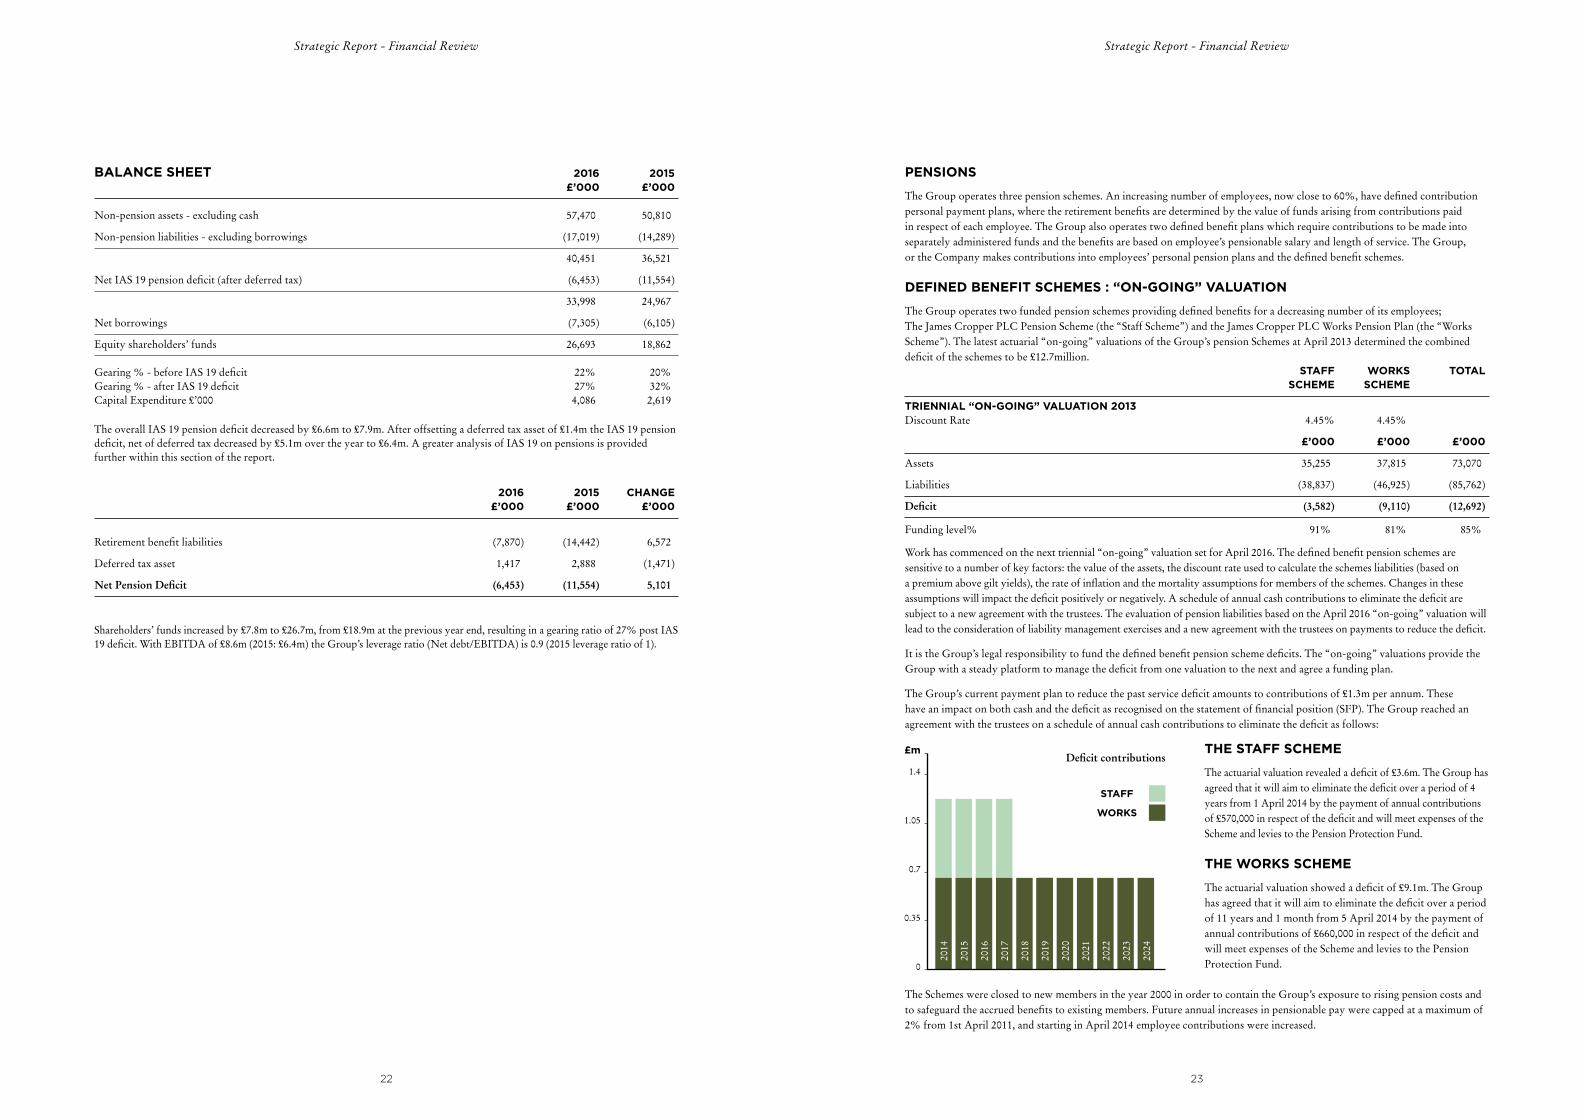
The overall IAS 19 pension deficit decreased by £6.6m to £7.9m. After offsetting a deferred tax asset of £1.4m the IAS 19 pension deficit, net of deferred tax decreased by £5.1m over the year to £6.4m. A greater analysis of IAS 19 on pensions is provided further within this section of the report.
2016 2015 CHANGE £’000 £’000 £’000
Retirement benefit liabilities (7,870 ) (14,442 ) 6,572
Deferred tax asset 1,417 2,888 (1,471 )
Net Pension Deficit (6,453 ) (11,554 ) 5,101
Shareholders’ funds increased by £7.8m to £26.7m, from £18.9m at the previous year end, resulting in a gearing ratio of 27% post IAS 19 deficit. With EBITDA of £8.6m (2015: £6.4m) the Group’s leverage ratio (Net debt/EBITDA) is 0.9 (2015 leverage ratio of 1).
BALANCE SHEET PENSIONS
The Group operates three pension schemes. An increasing number of employees, now close to 60%, have defined contribution personal payment plans, where the retirement benefits are determined by the value of funds arising from contributions paid in respect of each employee. The Group also operates two defined benefit plans which require contributions to be made into separately administered funds and the benefits are based on employee’s pensionable salary and length of service. The Group, or the Company makes contributions into employees’ personal pension plans and the defined benefit schemes.
DEFINED BENEFIT SCHEMES : “ON-GOING” VALUATION
The Group operates two funded pension schemes providing defined benefits for a decreasing number of its employees; The James Cropper PLC Pension Scheme (the “Staff Scheme”) and the James Cropper PLC Works Pension Plan (the “Works Scheme”). The latest actuarial “on-going” valuations of the Group’s pension Schemes at April 2013 determined the combined deficit of the schemes to be £12.7million. STAFF WORKS TOTAL SCHEME SCHEME
TRIENNIAL “ON-GOING” VALUATION 2013 Discount Rate 4.45% 4.45%
£’000 £’000 £’000
Assets 35,255 37,815 73,070
Liabilities (38,837 ) (46,925 ) (85,762 )
Deficit (3,582 ) (9,110 ) (12,692 )
Funding level% 91% 81% 85%
Work has commenced on the next triennial “on-going” valuation set for April 2016. The defined benefit pension schemes are sensitive to a number of key factors: the value of the assets, the discount rate used to calculate the schemes liabilities (based on a premium above gilt yields), the rate of inflation and the mortality assumptions for members of the schemes. Changes in these assumptions will impact the deficit positively or negatively. A schedule of annual cash contributions to eliminate the deficit are subject to a new agreement with the trustees. The evaluation of pension liabilities based on the April 2016 “on-going” valuation will lead to the consideration of liability management exercises and a new agreement with the trustees on payments to reduce the deficit.
It is the Group’s legal responsibility to fund the defined benefit pension scheme deficits. The “on-going” valuations provide the Group with a steady platform to manage the deficit from one valuation to the next and agree a funding plan.
The Group’s current payment plan to reduce the past service deficit amounts to contributions of £1.3m per annum. These have an impact on both cash and the deficit as recognised on the statement of financial position (SFP). The Group reached an agreement with the trustees on a schedule of annual cash contributions to eliminate the deficit as follows:
THE STAFF SCHEME
The actuarial valuation revealed a deficit of £3.6m. The Group has agreed that it will aim to eliminate the deficit over a period of 4 years from 1 April 2014 by the payment of annual contributions of £570,000 in respect of the deficit and will meet expenses of the Scheme and levies to the Pension Protection Fund.
THE WORKS SCHEME
The actuarial valuation showed a deficit of £9.1m. The Group has agreed that it will aim to eliminate the deficit over a period of 11 years and 1 month from 5 April 2014 by the payment of annual contributions of £660,000 in respect of the deficit and will meet expenses of the Scheme and levies to the Pension Protection Fund.
The Schemes were closed to new members in the year 2000 in order to contain the Group’s exposure to rising pension costs and to safeguard the accrued benefits to existing members. Future annual increases in pensionable pay were capped at a maximum of 2% from 1st April 2011, and starting in April 2014 employee contributions were increased.
0
0.35
0.7
1.05
1.4
£m
2014
2015
STAFF
2016
WORKS
2017
2018
2019
2020
2021
2022
2024
2023
Deficit contributions
2524
Strategic Report - Financial Review Strategic Report - Financial Review
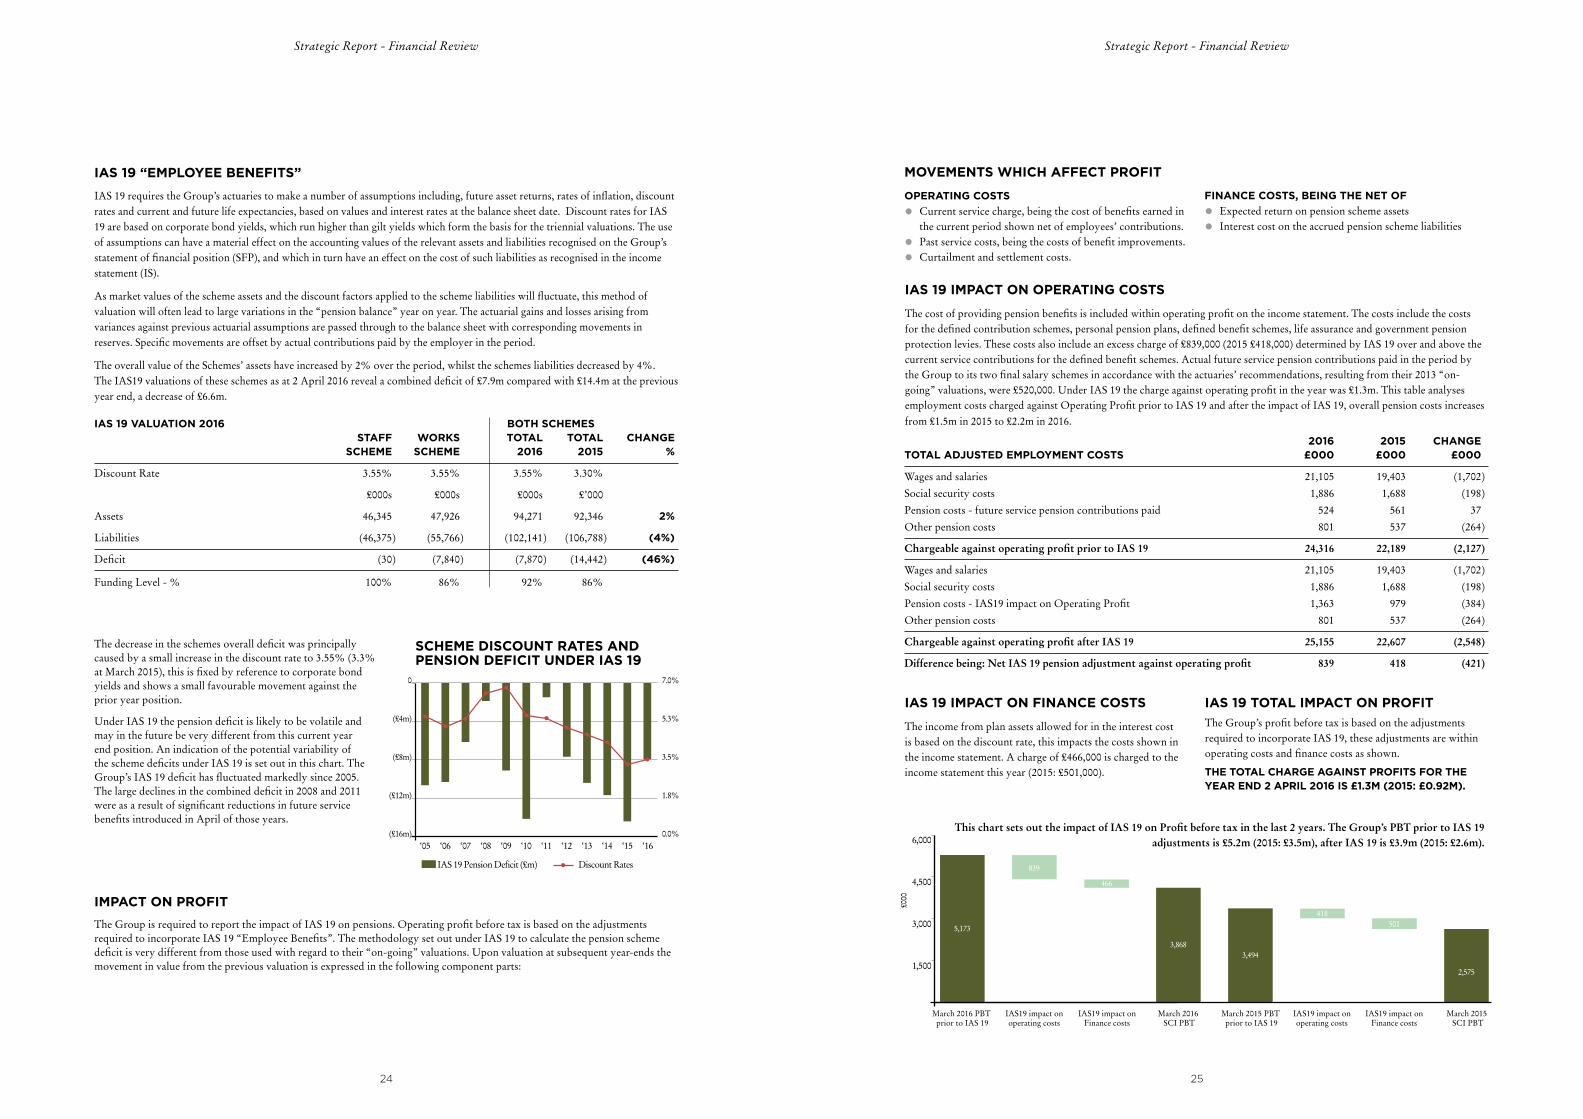
IAS 19 “EMPLOYEE BENEFITS”
IAS 19 requires the Group’s actuaries to make a number of assumptions including, future asset returns, rates of inflation, discount rates and current and future life expectancies, based on values and interest rates at the balance sheet date. Discount rates for IAS 19 are based on corporate bond yields, which run higher than gilt yields which form the basis for the triennial valuations. The use of assumptions can have a material effect on the accounting values of the relevant assets and liabilities recognised on the Group’s statement of financial position (SFP), and which in turn have an effect on the cost of such liabilities as recognised in the income statement (IS).
As market values of the scheme assets and the discount factors applied to the scheme liabilities will fluctuate, this method of valuation will often lead to large variations in the “pension balance” year on year. The actuarial gains and losses arising from variances against previous actuarial assumptions are passed through to the balance sheet with corresponding movements in reserves. Specific movements are offset by actual contributions paid by the employer in the period.
The overall value of the Schemes’ assets have increased by 2% over the period, whilst the schemes liabilities decreased by 4%. The IAS19 valuations of these schemes as at 2 April 2016 reveal a combined deficit of £7.9m compared with £14.4m at the previous year end, a decrease of £6.6m.
SCHEME DISCOUNT RATES AND PENSION DEFICIT UNDER IAS 19
IAS 19 VALUATION 2016 BOTH SCHEMES STAFF WORKS TOTAL TOTAL CHANGE SCHEME SCHEME 2016 2015 %
Discount Rate 3.55% 3.55% 3.55% 3.30%
£000s £000s £000s £’000
Assets 46,345 47,926 94,271 92,346 2%
Liabilities (46,375 ) (55,766 ) (102,141 ) (106,788 ) (4%)
Deficit (30 ) (7,840 ) (7,870 ) (14,442 ) (46%)
Funding Level - % 100% 86% 92% 86%
The decrease in the schemes overall deficit was principally caused by a small increase in the discount rate to 3.55% (3.3% at March 2015), this is fixed by reference to corporate bond yields and shows a small favourable movement against the prior year position.
Under IAS 19 the pension deficit is likely to be volatile and may in the future be very different from this current year end position. An indication of the potential variability of the scheme deficits under IAS 19 is set out in this chart. The Group’s IAS 19 deficit has fluctuated markedly since 2005. The large declines in the combined deficit in 2008 and 2011 were as a result of significant reductions in future service benefits introduced in April of those years.
IMPACT ON PROFIT
The Group is required to report the impact of IAS 19 on pensions. Operating profit before tax is based on the adjustments required to incorporate IAS 19 “Employee Benefits”. The methodology set out under IAS 19 to calculate the pension scheme deficit is very different from those used with regard to their “on-going” valuations. Upon valuation at subsequent year-ends the movement in value from the previous valuation is expressed in the following component parts:
‘05 ‘06 ‘07 ‘08
Discount Rates
‘09 ‘10 ‘11 ‘12 ‘13 ‘14 ‘15 ‘160.0%
1.8%
3.5%
5.3%
7.0%
(£16m)
(£12m)
(£8m)
(£4m)
0
IAS 19 Pension Deficit (£m)
IAS 19 IMPACT ON FINANCE COSTS
The income from plan assets allowed for in the interest cost is based on the discount rate, this impacts the costs shown in the income statement. A charge of £466,000 is charged to the income statement this year (2015: £501,000).
IAS 19 TOTAL IMPACT ON PROFIT
The Group’s profit before tax is based on the adjustments required to incorporate IAS 19, these adjustments are within operating costs and finance costs as shown.
THE TOTAL CHARGE AGAINST PROFITS FOR THE YEAR END 2 APRIL 2016 IS £1.3M (2015: £0.92M).
IAS 19 IMPACT ON OPERATING COSTS
The cost of providing pension benefits is included within operating profit on the income statement. The costs include the costs for the defined contribution schemes, personal pension plans, defined benefit schemes, life assurance and government pension protection levies. These costs also include an excess charge of £839,000 (2015 £418,000) determined by IAS 19 over and above the current service contributions for the defined benefit schemes. Actual future service pension contributions paid in the period by the Group to its two final salary schemes in accordance with the actuaries’ recommendations, resulting from their 2013 “on-going” valuations, were £520,000. Under IAS 19 the charge against operating profit in the year was £1.3m. This table analyses employment costs charged against Operating Profit prior to IAS 19 and after the impact of IAS 19, overall pension costs increases from £1.5m in 2015 to £2.2m in 2016.
MOVEMENTS WHICH AFFECT PROFIT
OPERATING COSTS
• Current service charge, being the cost of benefits earned in the current period shown net of employees’ contributions.
• Past service costs, being the costs of benefit improvements.
• Curtailment and settlement costs.
FINANCE COSTS, BEING THE NET OF
• Expected return on pension scheme assets
• Interest cost on the accrued pension scheme liabilities
2016 2015 CHANGE TOTAL ADJUSTED EMPLOYMENT COSTS £000 £000 £000
Wages and salaries 21,105 19,403 (1,702 )
Social security costs 1,886 1,688 (198 )
Pension costs - future service pension contributions paid 524 561 37
Other pension costs 801 537 (264 )
Chargeable against operating profit prior to IAS 19 24,316 22,189 (2,127 )
Wages and salaries 21,105 19,403 (1,702 )
Social security costs 1,886 1,688 (198 )
Pension costs - IAS19 impact on Operating Profit 1,363 979 (384 )
Other pension costs 801 537 (264 )
Chargeable against operating profit after IAS 19 25,155 22,607 (2,548 )
Difference being: Net IAS 19 pension adjustment against operating profit 839 418 (421 )
This chart sets out the impact of IAS 19 on Profit before tax in the last 2 years. The Group’s PBT prior to IAS 19 adjustments is £5.2m (2015: £3.5m), after IAS 19 is £3.9m (2015: £2.6m).
1,500
3,000
4,500
6,000
March 2016 PBT prior to IAS 19
March 2015 PBT prior to IAS 19
March 2016 SCI PBT
March 2015 SCI PBT
IAS19 impact onoperating costs
IAS19 impact onFinance costs
IAS19 impact onoperating costs
IAS19 impact onFinance costs
5,173
2,575
3,868
839
466
3,494
418501
£000

2726
Strategic Report - Financial Review Strategic Report - Financial Review
RISK MANAGEMENT
Effective management of risk is within the overall responsibility of the Board and is key to ensuring good governance and to achieving the Group’s strategy. The Board has ownership of the risk management strategy and coordinates activity across the Group. There is an ongoing process for identifying, evaluating and managing significant risks faced by the Group, which has been in place for the year under review and up to the date of approval of this Annual Report.
The Group manages risk by a combination of insurance and self-insurance. Self-insurance refers to actions taken internally or in conjunction with other third parties. High risks in financial and operational areas are normally more dependent on insurance, however our flood resilience programme for the Burneside site is testimony to a self-insurance approach which provides protection to a key site. Risks in commercial and
personnel areas, because of their nature, are more likely to be managed by self-insurance.
Each subsidiary company has a strategy and within that a process for highlighting the key risk areas of their business, and explaining the control measures and risk exposure. It then takes appropriate steps to manage the risk exposure taking into consideration the likelihood, impact and cost/benefit of each of the risks. The Group’s Audit Committee monitors and reviews the effectiveness of the Group’s financial accounting process and system of internal controls. In addition the Board has departmental teams with risk management briefs. These include:
• Health & Safety • Environment
• Insurance • Treasury
• Human Resources • Purchasing
• Pensions • Information Systems
PRINCIPAL RISKS
The principal risks and uncertainties that may adversely impact the performance of the Group are set out in the table on the following pages, along with the steps taken to address these. Each risk should be considered independently. Other factors could adversely affect Group performance and so the risks and uncertainties tabled should not be considered a complete set of potential risks.
EMPLOYEE SAFETY
RISK DESCRIPTION AND IMPACT MITIGATION
Employee safety is paramount and the Group embraces the ethos that nothing we do is worth getting hurt for.
It is essential that the Group operates a process of continuous improvement in maintaining high standards of safety. The risk of safe working practises being out of date or behavioural standards falling could result in a serious accident. If an incident were to arise where an unsafe practice was found to be taking place, this could potentially result in an employee getting seriously hurt, the interruption of operations, financial penalties and reputational damage.
The Group has an extensive Health & Safety programme built around the OHSAS 18001 framework which is proactively driven across every division. This is further supplemented with engagement from the executive team and senior management in our proactive workplace standards inspections initiative, where time is taken to review, grade and promote a safe working environment with employees at all levels across the organisation. Our dedication to continuously improving occupational health and safety has been recognised on 2 consecutive years as RoSPA (Royal Society For the Prevention of Accidents) has accredited the James Cropper Group with a Gold Award for 2015 and 2016.
The James Cropper Group remains fully committed to continuously improving its rigorous health and safety management system as it strives to deliver world class standards of safety. With this in mind, the James Cropper Group participates in external benchmarking and best practice set across the paper industry and is a proactive committee member of PABIAC (Paper And Board Industry Advisory Committee), a tripartite strategic health and safety delivery partnership for the paper, board and recovered paper industries.
EMPLOYEE SAFETY - FIRE
RISK DESCRIPTION AND IMPACT MITIGATION
The Group recognises the importance of protecting employees, contracted person(s), visitors and members of the public from any fire related risks whilst on site.
This includes the maintenance and protection of buildings, equipment, raw materials and associated services without which, manufacturing operations could be affected.
James Cropper adheres to their legal and moral responsibilities with regard to fire by carrying out the following:-
• Fire risk assessments to identify and prioritise hazards and necessary control measures;
• Developing and implementing appropriate arrangements and procedures based on the risk assessment findings
• Identifying and allocating necessary resources
• Providing and maintaining any identified and required fire prevention measures
• Providing appropriate information, instructions, supervision and training
• Ensuring fire safety responsibilities are designated and made known to all employees
ENVIRONMENTAL SUSTAINABILITY
RISK DESCRIPTION AND IMPACT MITIGATION
Environmental sustainability is at the heart of what we do at James Cropper and the way we operate safeguarding against environmental incidents is key. Should a material environmental incident occur at a James Cropper site this could result in material financial costs and reputational damage that undermines our commercial position as an environmentally responsible provider of sustainable products.
The Group has detailed processes in place to ensure as a minimum we comply with all environmental rules and regulations. In addition the Group engages proactively with the Environment Agency and seeks to enhance the way organisations can work together on environmental matters, controls and governance.
ENVIRONMENTAL FLOODING
RISK DESCRIPTION AND IMPACT MITIGATION
The risk that a flood on one of the Group’s operational sites causes significant business interruption, cost and disruption to business, with consequences on customer confidence, cash, insurance and business continuity.
Accounting for flood risk through transfer to insurance and ensuring effective crisis management practise in a flood response situation is one aspect of risk management that will continue.
The Group’s main strategy is to build flood resilience and to minimise the impact of a future flood, enabling prompt operational recovery in the event of a flood. The Group has approved an investment of £1m to protect key elements of plant and equipment and to remove material storage out of the flood risk zone.

Strategic Report - Financial Review Strategic Report - Financial Review
ENERGY MANAGEMENT AND ENERGY TAXATION RISKS
RISK DESCRIPTION AND IMPACT MITIGATION
Risk on Energy Intensive Industries (EIIs). The European Commission has recognised that EUETS could easily cause EIIs to move operations outside the European Economic Area or to close. The EC has created a special category, “Industries at risk of carbon leakage”, to afford some shelter from the tax for those companies most at risk. Industries in this category receive beneficial treatment through Phase 3 of EUETS in that they do not have their free allowances reduced on a sliding scale throughout the Phase, as will happen with non-EIIs. The Group benefits from this concession as the paper sector is a carbon leakage sector. The risk is that in 2019 shelter from EUETS is removed prior to phase 4 of EUETS. Should the EC remove the carbon leakage status given to the paper industry the Group will face ever increasing costs of emissions, making operations unaffordable and it would be uncompetitive to stay within the EU.
Risk that the Carbon Price Floor exemptions are withdrawn.The Carbon Price Floor is part of the government’s Electricity Market Reform package. It is a combination of the EUETS European Union Allowance (EUA) price and a top-up amount that, when added to the EUA price, forms the “Floor” price of carbon that HM Government has set. This levy is a UK “green” tax on the generation of electricity. From 1st April 2013 the Group has been subject to the Carbon Price Floor. HM Government announced changes to legislation that will largely exempt the Group from the Carbon Price Floor from 2015 onwards, due to it’s operation of an energy efficient CHP plant. The risk to the Group that government support could be withdrawn making the cost of manufacture rise and placing James Cropper at a distinct disadvantage to it’s EU competitors as well as those in the rest of the world.
The Group’s energy strategy considers investments into technologies which reduce emissions or technologies which do not emit CO2 whilst generating energy. Until a suitable investment opportunity is found, the Group will continue to operate within the existing framework and be subject to EC regulation in this area as it develops.
James Cropper PLC is a member of the Confederation of Paper Industries (CPI) an organisation which works on behalf of the UK’s Paper-based Industries. The CPI lobbies HM Government alongside other UK intensive energy users to protect UK industry and manufacturing from carbon leakage. The Company has qualified for compensation for the indirect cost of EUETS and CPS in 2015 and will continue to apply for compensation whilst this support is available from the Government. The CPI also addresses issues that impact UK manufacturers such as the Carbon Price Floor and is a leading trade association that monitors proposals to tax carbon and represents industries which are threatened by new taxes.
The Group evaluates operational energy efficient improvements on a continuous basis and is keen to recognise and adopt energy reduction measures. James Cropper is pleased to have obtained ISO 50001 accreditation in Nov 2015 an international standard recognising the best energy management practices. This is an alternative route to compliance with the Energy Savings Opportunities Scheme (ESOS) a mandatory initiative for large UK enterprises requiring regular 4–yearly audits of energy use. The Group opted to take the ISO 50001 route as it presents a better way than ESOS for making energy savings, using, as it does, a continual improvement process.
PENSION
RISK DESCRIPTION AND IMPACT MITIGATION
The Group operates 2 defined benefit pension schemes which are in deficit. Actuarial deficits are sensitive to a number of key factors: the value of the assets, the discount rate used to calculate the schemes liabilities (based on corporate bond yields), the rate of inflation and the mortality assumptions for members of the schemes. Changes in these assumptions could mean that the deficit increases further.
Full details of this risk are explained within the Pension section of the Financial Review.
The Group’s strategy is to ensure the profitable and sustainable growth of the Group whilst monitoring the longer term economic environment as conditions change.
Membership of the Schemes was closed to new members in 2000 in order to contain the Groups exposure to rising pension costs and to safeguard the accrued benefits to existing members. Future annual increases in pensionable pay were reduced to a cap of 2% as from 1st April 2011. Starting April 2014 increases in employee contributions are being phased in. Annual contributions to reduce the deficit have been agreed with the trustees.
The next tri-ennial valuation is in April 2016. The evaluation of pension liabilities based on the April 2016 “on-going” valuation will lead to the proactive consideration of liability management exercises and a new agreement with the trustees on payments to reduce the deficit.
The Group agrees an investment strategy with the trustees taking account of risk.
COMMODITY PRICE VOLATILITY
RISK DESCRIPTION AND IMPACT MITIGATION
One of the Group’s Divisions is subject to virgin pulp price risk. Virgin pulp prices are affected by global supply and demand and price can be subject to significant fluctuations.
Factors that influence these include natural disasters, climate, political instability, conflicts, economic conditions and actions by major pulp producers.
The Paper Division aims to recover costs via market price increased typically a few months following a pulp price increase. In the event that competitor behaviours and global economic factors mean that the Group is unable to recover further price increases the profitability of the Group would be reduced. Pulp substitution from recycled coffee cups from our Reclaimed Fibre plant mitigates some of the impact of virgin pulp costs. In additional the use of post-consumer waste for virgin pulp substitution is more common place, and is not subject to the same pricing influences.
The Paper Division’s ability to effectively grow profitable sales offering value-add products and services plus the introduction of new innovative products provides some additional buffer against price sensitivity. Diversification and success of the Divisions offers the Group greater long term stability.
ENERGY PRICE VOLATILITY
RISK DESCRIPTION AND IMPACT MITIGATION
Gas prices are affected by global supply and demand and price can be subject to significant fluctuations.
Factors that influence these include natural disasters, climate, political instability, conflicts, economic conditions and actions by major oil & gas exporting countries
Price fluctuations can affect our business assumptions, margins and investment decisions.
The Group aims to mitigate its exposure to energy costs by a combination of: strategically considering diversification away from gas to alternative fuels, investing in sustainable energy saving solutions and securing long term purchase forward prices.
At the time of this report forward purchase contracts are in place to secure prices for 12 months. This provides the Group with a degree of certainty over the next year.
28 29
ENVIRONMENTAL TAXATION
RISK DESCRIPTION AND IMPACT MITIGATION
EUETS is a mandatory scheme for greenhouse gas emission allowance trading introduced by the EU to tackle emissions of carbon dioxide and other greenhouse gases from a number of specific industrial activities. The Group’s combustion facilities became subject to this scheme as from 1st January 2008 under Phase 2. Phase 3 of the scheme is now underway and the Group’s annual allowances have been reduced to an average of 16,000 tonnes of CO2 per annum (phase 2: 41,000 tonnes) resulting in an average of 24,000 tonnes of CO2 to be purchased on the EU Emissions Trading Scheme.
Risk on price Prices are presently low due to over-supply in the market and this keeps the cost of carbon emissions low. The risk is that the over-supply will be addressed by the EU and the actions taken will have a significant effect on prices. The likely result is that the current single figure prices rise significantly and create an increasing financial burden on the Group.
As part of it’s energy strategy the Group considers diversification away from gas to alternative fuels and this also includes consideration of investments into sustainable energy saving solutions including technologies to reduce emissions or technologies which do not emit CO2 whilst generating energy.
In order to comply with EUETS phase 3 the Group will meet it’s mandatory requirement to purchase 24,000 tonnes of C02 a year. The Group actively considers forward contracts to manage it’s costs in this area. At the year end March 2016 forward carbon emission purchase commitments are in place to December 2018, these provide the Group with some certainty over the future cost of emissions.

Strategic Report - Financial Review
NEW DIVISION
RISK DESCRIPTION AND IMPACT MITIGATION
In April 2015 the Group established James Cropper 3DP, a diversification opportunity. The risk that the new division may cost more to set up and take longer to be cash generative.
The Group supports the utilisation of existing employee resource at the start of this diversification opportunity. Initial investment is minimised through the utilisation of existing factory resource and infrastructure.
There will be continual monitoring at monthly meetings of the Executive and at the Group Board on key strategic and operational matters effecting the development of the new operation.
FALL IN DEMAND
RISK DESCRIPTION AND IMPACT MITIGATION
The profitability of the Group is sensitive to economic slowdown in non UK markets, volume, the mix of sales and product and service pricing. A 5% reduction in sales in any one division could result in a fall in operating profits if not mitigated by a cost reduction programme or growth in other areas.
The global expansion of the Group helps to mitigate economic risks and plans are being deployed to grow our market presence and diversify product ranges and geographical markets. The Group will continue to build on existing skills, and the skills development of sales executives, recruitment of experienced sales and planning professionals also assist the effective deployment of these diversification plans.
The Group has launched a new division, James Cropper 3DP which over time will bring greater resilience.
Isabelle Maddock,Group Finance Director
On behalf of the Board.
EXCHANGE RATE VOLATILITY
RISK DESCRIPTION AND IMPACT MITIGATION
The Group operates on a global basis, and earns revenues, incurs costs and makes investments in a number of currencies; the 3 major operating currencies are Sterling, Euro and Dollar. The Group’s financial results are reported in Sterling. Volatile exchange rates could have a significant impact on the Group’s results.
The Group matches receipts and payments in the same foreign currency due in the same period. The Group’s treasury function seeks to hedge anticipated unmatched cash flows using financial instruments. No transactions for this purpose have been entered into at the year ending 2 April 2016.
The Group prepares consolidated financial statements for reporting purposes, the consolidation process entails translating the financial statements of foreign subsidiaries from foreign to domestic currency. A dollar hedge is in place to mitigate the impact of translation exposure with the subsidiaries based in the USA.
OUR PEOPLE SET US APART CELEBRATING THOUGHT LEADERSHIP
THOUGHT LEADERS. GLOBAL NETWORKERS. TECHNICAL EXPERTS. SKILLED CRAFTSMEN. CREATIVE THINKERS.
WITH SUSTAINABLE INNOVATION AT THEIR
CORE, OUR VALUES DRIVE A CULTURE WHERE GREAT PEOPLE ARE
SHAPING THE FUTURE.
“
”30 31
NIGEL WALKER, TFP’s DIRECTOR OF TECHNOLOGY AWARDED FELLOWSHIP BY THE ROYAL SOCIETY OF CHEMISTRY FOR ADVANCES IN CHEMICAL SCIENCES
It is a pleasure to congratulate Nigel Walker, TFP’s Director of Technology, who has been awarded a prestigious fellowship by the RSC for his outstanding contribution to chemical sciences and industry developments.
Since joining James Cropper PLC as a chemist in 1982, Nigel has been responsible for all technical aspects of TFP’s business since its inception as a laboratory bench project to its current position as the world’s leading producer of advanced technical nonwovens and metal-coated carbon fibres.
As Director of Technology Nigel is responsible for product developments, funded research and technical support across the business.
Nigel has authored and co-authored several papers relating to the use of advanced fibre nonwovens in composite applications and is a named inventor in a number of patents in the fields of fire protection, fuel cells and nonwovens.
Our people set us apart

3332
Our People Set us Apart Our People Set us Apart
4. ARRAN CHADWICK - CREATIVE ENGINEERING –
MAKING BETTER POSSIBLE Arran is a talented engineer who has been with James Cropper PLC for 15 years. He is passionate about his work, and takes a particularly creative and proactive approach to the design, implementation and continued improvement of the machinery and manufacturing processes that enable our commercial success. Last year, Arran joined the Technology & Innovation Department and played a crucial role in the development of our new business, James Cropper 3D Products. Working with in-house teams and global suppliers, his attention to detail has been critical - from project scoping through to the first production run.
5. LIAM (RIGHT) AND SAM MOFFATT –
AWARD-WINNING ENGINEERING APPRENTICES
Liam is just starting his third year, and Sam his second year, of our 4-year engineering apprenticeship. At the Training 2000 Engineering Awards the brothers took home 4 awards between them – celebrating their hard work and outstanding achievements in mechanical maintenance at James Cropper PLC.
CELEBRATING INDUSTRY-LEADING SKILLS
1. MARK STARRS – LEADING THE INDUSTRY
IN COLOUR
When it comes to colour, James Cropper PLC’s pedigree and depth of knowledge is second to none. That’s why, in 2016, we are able to launch new products to new markets with colour excellence as our USP. Mark Starrs is our highly skilled Colour Coordinator. He manages our colour experts, and complex processes, to deliver industry-leading colour matching and bespoke development of custom shades – keeping us at the cutting edge.
2. ALAN MCBIRNIE – AWARD-WINNING BUSINESS
ADVISOR AND BCE PROJECT MANAGER
2016 is a year of achievements for Alan. Firstly, he won Business Advisor of the Year for his work with Young Enterprise – his teams took first place at the South Cumbria finals in both 2014 and 2015. Secondly, Alan project-managed installation of our award-winning Solar PV Array – contributing to our 2016 Food Packaging Association (FPA) Corporate Social Responsibility Award.
3. ANNA GLEDHILL – FROM APPRENTICE TO BUSINESS MANAGEMENT EXPERT
Anna joined James Cropper PLC as a Business Apprentice in 2009. She showed great promise and was promoted to Inside Sales Executive in 2013. Today, Anna’s highly analytical role as Demand Manager helps to drive continued improvements and efficiencies in our business.
Earlier this year, Anna was awarded a First Class degree in Business Management (BA Hons) and has applied her knowledge within our business – playing a key role in the implementation of Integrated Business Planning.
SPOTLIGHT ON SKILLS 1.
4.
5.
2.
3.

3534
Our People Set us Apart Our People Set us Apart
SUPPORT FOR COLLEAGUES
WINNER:
2. MARK SORRENSON (Blenderman)
Mark is often referred to as a ‘very’ good blenderman by his colleagues and performs to a consistent high level. He is also the ‘go to’ person for his peers, as well as technical teams, over issues involving shade and dye recipes.
COMMENDATION:
3. DAVID JHAVERI (Regional Business Development Director - TFP Inc)
David is a very helpful member of the US team and is always willing to lend a hand with technical challenges, even when his time is in demand. He is an important part of the total sales revenue of the US group and definitely contributes more than his share.
COMMUNITY FOCUSSED
WINNER:
4. DAVID DENNISON (Salle Operative - Converting)
Dave was at the Station Inn pub with his family at Easter when someone collapsed and had a heart attack. As a trained first aider, Dave administered CPR until the Air Ambulance arrived. Because of Dave’s action the gentleman survived.
COMMENDATION:
IAN WAINE (Power Plant Operative)
Ian is dedicated to helping others in the community. When he is not at work he is volunteering for St John’s Hospice. This is a charity that provides support and services for patients suffering from life-limiting conditions.
SAFETY IMPROVEMENT
COMMENDATION:
1. SHANE COOPER (Dryerman - PM1)
Shane has spent much of his own time putting together various safety checklists for PM1 machine. Though these have not yet been fully implemented they have provided a great start for this important piece of safety improvement work.
CELEBRATING PRIDE IN OUR WORK
CUSTOMER SERVICE
WINNER:
7. MATT PARK (Trainee Purchasing Co-ordinator)
Matt is a shining example of someone who started as an apprentice and has worked his way up through hard work and determination. Matt is always willing to help both internal and external suppliers & customers. He is willing to take advice and always wants to try and improve procedures.
COMMENDATION:
STEVE ATKINSON (Production Planner)
Steve’s attention to detail is excellent. He goes out of his way to ensure that everything runs as smoothly as possible. He works across all areas and without his efforts the machine planning would not be as efficient. Steve ensures that he communicates with various departments to ensure they are aware of anything that could affect the running and planning of their areas.
INNOVATION AND CREATIVITY
WINNER:
5. JOHN GIBSON (U2A Slitterman) & 6. NEIL HARRISON (Maintenance Craftsman)
John identified that a number of inner wraps of reels being run on the U2A were being damaged causing up to 300m of broke. John worked with Neil to develop a solution that would save approximately 250m of broke on each reel run through the U2A. This proactive work could aggregate to an annual saving of around £32,000 as well as production time saved on the machine.
COMMENDATION:
CHRIS VANCE (Machineman - PM2)
We started a project to reduce water and effluent in early 2015. Chris worked across all four paper machines and into finishing, identifying opportunities to save water and moreover, driving to put improvements in place. As a direct result of Chris’s efforts we made significant savings through the early part of 2015, estimated to be around £100k over the year.
TAKING PRIDE
WINNER:
8. ROSIE FISHER (TFP Marketing Manager)
Rosie stands out as an enthusiastic, professional and technically-gifted marketing manager. Her fantastic efforts in support of the Celebration Day and great work to produce the Employee Survey video are just two examples of her excellent work.
COMMENDATION:
9. ANDY CHORLEY (Pallet Department Team Leader)
Andrew always goes above and beyond his duties to help others. He supports the Purchasing department with stock counts, ordering and ensures deliveries are not left out in the rain even when they are not his goods. Andrew helps everyday to track deliveries in the mill, the Purchasing team would struggle without his knowledge and attention to detail.
1. 5. 7. 8.
6. 9.3.
2. 4.

CELEBRATING A SUSTAINABLE FUTURE
3736
Invested in our Community Invested in our Community
OUR COMMUNITY JOINED US TO CELEBRATE 170 YEARS AND THE OPENING OF TFP’S THIRD PRODUCTION LINE
Community has always been hugely important to our Group, so it was only natural to involve local people in our greatest celebrations of 2015. Celebration Day marked both 170 years of local industry and the opening of TFP’s third production line, by Sir James Cropper.
All residents of our local parish were invited to attend the celebration, and enjoy a guided tour of Burneside Mills – the first tour of its scale in our history, with 771 attendees. Refreshments were provided with music from the Burneside Ukelele Band – The Bryce Street Strummers.
It was a special event to celebrate the continued growth of our company and we were proud to receive universally positive feedback from our community.
• 771 LOCALS GIVEN A TOUR OF BURNESIDE MILLS AS WE CELEBRATED 170 YEARS
• SIR JAMES CROPPER OPENS TFP’S THIRD PRODUCTION LINE
FPA CORPORATE SOCIAL RESPONSIBILITY AWARD RECOGNISES OUR COMMITMENT TO LOCAL, RENEWABLE ENERGY
The Food Packaging Association (FPA) Corporate Social Responsibility Award is an independently judged and highly respected accolade in the industry. We were delighted to receive the award this year, in recognition of significant investments in renewable energy that will both offset the consumption of manufacturing processes and support our local community.
In late 2015 we provided space on the Burneside Mills roof for the installation of a 250kW solar PV array. The project was brought forward with our support by Burneside Community Energy Ltd (BCE), a new social enterprise founded to fund and manage the project. The £250,000 required was raised in eight days with 90% of the backers living within three miles of Burneside. Investors receive a modest return allowing surplus profits to be provided to support local community projects. The scheme supplies electricity directly into our operation and is projected to generate around 200,000kWH per annum – offsetting the energy requirements of our specialist laminating and technical coating facility and reducing carbon dioxide emissions by 1.91 million kilogrammes over the next 20 years.
PHIL DAVIES, DIRECTOR, BCE.

ON-SITE SOLAR FARM
200,000 KWH
GENERATED ANNUALLY
HYDROELECTRICPOWER SCHEME
376,000 KWH
GENERATED ANNUALLY
ISO50001ENERGY MANAGEMENT
ACCREDITATION
COMBINED HEATAND POWER PLANT
REDUCEDOUR ENERGY
CONSUMPTION BY
24%
NATIVECRAYFISH THRIVE
IN THE RIVER KENT,A TESTAMENT TO
OUR MINIMAL ENVIRONMENTAL
IMPACT
WASTEMANAGEMENT
IS REPURPOSED WITHINTHE MANUFACTURING
PROCESSES
95% OF WASTEAND WATER
JC3DPREPLACING
PLASTIC WITH
RENEWABLE,RECYCLABLE
MOULDED FIBREPACKAGING
ALL PAPERPRODUCTION CAN BE
FSC® OR PEFC® CERTIFIED
TFP
DESIGNINGCOMPONENTS FOR
RENEWABLETECHNOLOGIES
10,000,000
WORLD’SFIRST COFFEE CUPRECYCLING PLANT
CUPS CAN BEPROCESSEDPER WEEK
TFP
REDUCINGFUEL CONSUMPTION
IN AEROPLANES
Environmental Commitment & Sustainable Innovation
3938
Environmental Commitment & Sustainable Innovation
GOING ABOVE AND BEYOND TO SHAPE A SUSTAINABLE FUTURE FOR OUR PLANET AND OUR PRODUCTS
The Values of our company are centred on a theme of sustainability - for our business, our customers, our community and our planet. We are also committed to addressing real world problems - not only by reducing our energy consumption, investing in renewable technologies, minimising waste and carefully controlling pollution, but by researching and developing innovative products that provide
new opportunities to reduce environmental impact in their end use.
In 2016, our environmental commitment is clearer than ever before. On the banks of the River Kent we have created a manufacturing facility that operates in tune with its special natural surroundings, and with minimal environmental impact. Our product innovations are answering global demand for sustainable solutions. Looking forwards, we are working through a programme of lifecycle analysis that will support our position as thought leaders in sustainable innovation.

ISO50001 EXPLAINEDOUR NEW FOCUS ON ENERGY MANAGEMENT
Environmental Commitment & Sustainable Innovation
41
GOVERNANCE
GOVERNANCE 41
BOARD OF DIRECTORS 42
REPORT OF THE DIRECTORS 44
DIRECTORS’ REMUNERATION REPORT 49
Governance
Energy Management is an important and continued area of development at James Cropper PLC. Not only do we have an environmental responsibility to reduce our carbon emissions; we have an eye on the future of our business. As energy prices continue to rise, we see our investments in renewable energy generation and expert energy management as critical to our secure future.
ISO50001 Energy Management is not just about reaching a standard once. The accreditation represents our commitment to continued research, measuring, monitoring and innovation to reduce our overall energy consumption.
ISO50001 - BENEFITS TO BUSINESS
• Identifying and managing risks around our future energy supply
• Continually monitoring energy use and identifying opportunities to improve efficiency
• Reducing energy consumption and energy costs
• Reducing carbon emissions
• Enhancing our reputation as industry leaders in sustainable innovation

BOARD OF DIRECTORS
PATRICK J WILLINKBSC, MBACHIEF TECHNOLOGY OFFICER
Educated at Newcastle University and Imperial College, Patrick joined the Group in 1990 and the Board in 1998. In 2014 he became Chief Technology Officer of the Group and was also appointed President of the Confederation of Paper Industries Ltd later that year.
KARL D WATSONB.Eng (Hons)CHIEF OPERATIONS OFFICER
Educated at Sunderland University and London Business School, Karl has over 30 years experience in industrial, automotive. Pharmaceutical and secure documents and systems markets. Karl joined the Group and Board in 2014.
MARTIN THOMPSON, MBAMANAGING DIRECTOR,TECHNICAL FIBRE PRODUCTS LIMITED
Prior to joining the Group, Martin held a variety of roles covering Business Systems, Technical and Operations Management. Martin joined the Group in 2003. He was appointed Managing Director of Technical Fibre Products Ltd in 2013 and appointed to the Board in 2013.
MARK A J CROPPER, MACHAIRMAN
Mark joined the Group and the Board in 2006, becoming Chairman in 2010, the sixth generation of the Cropper family to hold this position. He is a director of Ellergreen Hydro Ltd, a developer and operator of hydro-electric schemes, and is a partner in Turquoise Capital LLP.
ISABELLE M MADDOCKBSC, FCMAGROUP FINANCE DIRECTOR
Educated at the University of Central Lancashire, Isabelle is a Fellow of the Chartered Institute of Management Accountants. Isabelle joined the Company in 2006 and was appointed Head of Finance in 2013 and Group Finance Director in 2014.
PHILIP I WILD, BEngCHIEF EXECUTIVE OFFICER
Phil joined the group and the Board as Chief Executive in 2012. A graduate of Loughborough University and the London Business School, he previously worked for 3M where he held roles and directorships covering industrial, healthcare, automotive and security market sectors.
Governance - Director’s Details
42
Full disclosure on Directors credentials can be found at: www.cropper.com/corporate-governance/directors
DAVID R CAREY, FCCACOMPANY SECRETARY
David joined the Group in 1974 as Chief Accountant. He became Company Secretary in 1996 and resigned in November 2015.
JAMES F ALDRIDGE, ACA COMPANY SECRETARY
James joined the Group as Finance Manager for Technical Fibre Products Ltd in 2006. He was appointed Head of Corporate Finance in 2013 until November 2015, when he was appointed Company Secretary.
DOUGLAS MITCHELLBSC (HONS)NON-EXECUTIVE DIRECTOR
Prior to his retirement in 2010, Douglas was Managing Director of 3M UK and Ireland. Within 3M, he held a number of senior roles in Management, Sales and Marketing, Logistics and Manufacturing. Douglas joined the Board in 2012.
JAMES E SHARP, MANON-EXECUTIVE DIRECTOR
James is a partner of Sirius Equity LLP, an investment firm which specialises in the retail and luxury goods sectors. James joined the Board in 2009. He is also a Non-Executive Director of The Brunner Investment Trust plc.
DAVID R WILKS,LLB (HONS)NON-EXECUTIVE DIRECTOR
A Director of Wilks & Partners, a management consultancy company he founded, David joined the Board in April 2004. He has extensive manufacturing operations experience with H J Heinz and United Biscuits, and was a Director of ER Consultants.
Governance - Director’s Details
43

REPORT OF THE DIRECTORS
REVIEW OF THE BUSINESS
The Group’s principal activities comprise the manufacture of specialist paper and advanced materials.
Details of the Group’s activities are included in the Strategic Report. The Chairman’s letter and the CEO’s review address business activities during the year and comment on strategic direction and prospects.
RESULTS
The profit attributable to equity holders of the Company for the 53 weeks ended 2 April 2016 is set out in the Statement of Comprehensive Income. The dividends paid during the year, and the proposed final dividend, are set out in the Notes to the financial statements.
STATEMENT OF DIRECTORS’ RESPONSIBILITIES IN RESPECT OF THE ANNUAL REPORT AND THE FINANCIAL STATEMENTS
The Directors are responsible for preparing the Annual Report and the financial statements in accordance with applicable law and regulations.
Company law requires the Directors to prepare Group and Parent Company financial statements for each financial year. As required by the AIM Rules of the London Stock Exchange they are required to prepare the Group financial statements in accordance with IFRSs as adopted by the EU and applicable law and have elected to prepare the Parent Company financial statements on the same basis.
Under company law the Directors must not approve the financial statements unless they are satisfied that they give a true and fair view of the state of affairs of the Group and Parent Company and of their profit or loss for that period. In preparing each of the Group and Parent Company financial statements, the Directors are required to:
• select suitable accounting policies and then apply them consistently;
• make judgments and estimates that are reasonable and prudent;
• state whether they have been prepared in accordance with IFRSs as adopted by the EU; and
• prepare the financial statements on the going concern basis unless it is inappropriate to presume that the Group and the Parent Company will continue in business.
The Directors are responsible for keeping adequate accounting records that are sufficient to show and explain the Parent Company’s transactions and disclose with reasonable accuracy at any time the financial position of the Parent Company and enable them to ensure that its financial statements comply with the Companies Act 2006. They have general responsibility for taking such steps as are reasonably open to them to safeguard the assets of the Group and to prevent and detect fraud and other irregularities.
The Directors are responsible for the maintenance and integrity of the corporate and financial information included on the Company’s website. Legislation in the UK governing the preparation and dissemination of financial statements may differ from legislation in other jurisdictions.
STATEMENT OF DIRECTORS’ RESPONSIBILITIES IN RESPECT OF CORPORATE GOVERNANCE
The Board is accountable to the Group’s shareholders for corporate governance. Whilst there is no requirement to comply with the Combined Code, the Group is committed to a high standard of corporate governance and this section describes how the relevant principles of governance are applied to the Group.
THE BOARD
The Group Board considers that it is well balanced and operates in an effective manner and is collectively responsible for the success of the Group. It comprises the Chairman together with five Executive Directors and three Non-Executive Directors.
Sir James Cropper is the Company’s Honorary President, but is not a director of the Company.
Mark Cropper is the Chairman of the Group and is responsible for the running of the Board. Although he is deemed not to be independent under the Combined Code as he has close family ties, the Board considers him to be independent as he displays sound business judgment, and provides unequivocal counsel and advice to the Board.
Phil Wild is the Chief Executive and is responsible for the running of the Group’s business.
David Wilks is the senior independent Non-Executive Director.
The Group Board holds regular meetings, both on site and via telephone conference calls, with prepared agendas for discussion and formal schedules of items to be approved covering structure and strategy, management, financial reporting and controls, board membership and committees, and corporate governance. There is a schedule of matters reserved for the Board’s decision.
The Executive Committee, under the chairmanship of Phil Wild, met sixteen times during the year with prepared agendas for discussion.
All Directors have access to the advice and services of the Company Secretary. The Board has also established a formal procedure whereby Directors, wishing to do so in the furtherance of their duties, may take independent professional advice, if necessary, at the Group’s expense. All Directors are aware of their responsibility to regularly update their skills and knowledge.
Governance - Report of the Directors
4544
BOARD COMMITTEES
There are four sub-committees reporting to the Group Board:
• Executive Committee
• Remuneration & Management Development Committee
• Audit Committee
• Nomination Committee
The Executive Committee comprises the executive directors and two senior executives. The Committee’s terms of reference include the development and implementation of strategies, operational plans, and the assessment and control of risk. Phil Wild, the Group’s Chief Executive, is Chairman of the Committee.
The Audit Committee, the Remuneration & Management Development Committee, and the Nomination Committee comprise the Non-Executive Directors of the Group. Jim Sharp is Chairman of the Audit Committee, David Wilks is Chairman of the Remuneration & Management Development Committee, and Mark Cropper is Chairman of the Nomination Committee.
The Committees’ terms of reference are displayed on the Group’s website.
RE-ELECTION
The Directors are subject to retirement on a periodic basis and re-election by the shareholders in accordance with the Articles of Association whereby a director shall retire from office at the first AGM after their appointment and thereafter shall retire at every third AGM after the AGM at which last appointed.
Resolutions will be proposed at the Annual General Meeting for the re-election of M.A.J.Cropper, P.I.Wild, M.Thompson and J.E.Sharp as directors of the Company.
PERFORMANCE EVALUATION
The Chairman undertakes an annual Group Board appraisal with each Executive Director.
The performance evaluation process includes the Chairman reviewing and monitoring the Chief Executive’s performance on an annual basis and the Chief Executive reviewing and monitoring the Executive Directors. The high level individual objectives agreed at the reviews are communicated to the Remuneration & Management Development Committee.
The Chairman reviews the non-executive directors’ performance annually on an individual basis.
The Chairman’s performance is appraised by the senior independent director and the other non-executive directors without the Chairman being present, and the comments fed back to him for discussion.
FINANCIAL POLICIES AND INTERNAL CONTROLS
The Board is committed to presenting a full, balanced and understandable assessment of the Group’s position and prospects, both in the Annual Report and at other times as appropriate throughout the year.
The Directors confirm that they have complied with the requirements in preparing the financial statements, as detailed in the Statement of director’s responsibilities in respect of the annual report and the financial statements.
The Directors confirm that they have complied with the requirements to keep adequate accounting records, as detailed in the Statement of director’s responsibilities in respect of the annual report and the financial statements.
The Directors confirm that they have complied with the responsibility for the maintenance and integrity of the corporate and financial information included on the Company’s website, as detailed in the Statement of director’s responsibilities in respect of the annual report and the financial statements.
The Board is responsible for and sets appropriate policies on internal control and seeks regular assurance, at least annually, that enables it to satisfy itself that processes are functioning effectively. Such a system is designed to manage rather than eliminate the risk of failure to achieve business objectives and can provide reasonable, but not absolute, assurance against material misstatement or loss. If a failure is discovered the Board will take remedial action.
There is no internal audit function within the Group and the Board consider that this is appropriate given the nature of the Group’s activities. The letter from the external auditors’ confirming their independence and objectivity was reviewed by the Audit Committee. KPMG LLP have confirmed their independence and the Directors believe KPMG LLP to be independent and objective.
The Audit Committee monitors and reviews the effectiveness of the Group’s financial accounting process.
The Key Performance Indicators (KPIs) and principal risks and uncertainties affecting the Group are considered in the Strategic Report.
Governance - Report of the Directors

RELATIONS WITH SHAREHOLDERS
The Group Finance Director, the Chairman and the Chief Executive maintain contact with institutional investors as appropriate.
The Non-Executive Directors attend the Annual General Meeting and are available for discussions with shareholders.
Currently the Group makes available its financial results on the website www.cropper.com and issues printed copies of the Annual Report to shareholders.
GOING CONCERN
The Directors consider that the principal risks noted in the Strategic Report are the most significant to the Group but these do not necessarily comprise all risks to which the Group is exposed.
At 2 April 2016 the Group’s available cash and borrowing facilities were £8.2m of which £5.0m was undrawn. Having taken account of current borrowings to be repaid within 12 months of the balance sheet date, £4.3m was available to the Group beyond 12 months. The Group has negotiated a £5.0m revolving credit facility post year end.
The Directors having considered the current trading prospects, identifiable risks, working capital requirements and the availability of finance are of the opinion that the Group and Company are going concerns. The accounts have been prepared on this basis.
At the Annual General Meeting the Chairman will give an update on the current trading position and invites shareholders to table any questions and encourages their participation.
EMPLOYEE INVOLVEMENT
Regular Consultative Meetings are held with the employee trade union representatives to advise them on all aspects of Group developments. Monthly and bi-annual briefings on Group performance are carried out for all employees and they have access to a copy of the Annual Report. As a matter of policy, plans are formally discussed with those who will use new equipment, plant and computer systems before designs are finalised. Safety Improvement teams deal with day-to-day aspects of safety improvement.
The Group operates bonus schemes and a Save as You Earn (“SAYE”) Scheme to encourage employee involvement.
Independent to the assets on the Group Balance Sheet there is an Employee Share Trust which currently holds approximately 97,000 shares in James Cropper PLC for the benefit of all employees so that their interests are linked to the Group’s future growth. No director of the Group is a trustee of the Scheme, and the trustees confirm that they apply the assets for purely benevolent purposes.
EMPLOYMENT OF DISABLED PEOPLE
It is the Group’s policy to give equality of opportunity when considering applications from disabled people where the job requirements are considered to be within their ability. When existing employees become disabled they are retained wherever reasonable and practicable. The Group tries to provide equal promotion opportunities wherever possible.
DONATIONS FOR POLITICAL AND CHARITABLE PURPOSES
It is the Group’s policy not to make any donations to, or incur expenditure on behalf of political parties, other political organisations or independent election candidates and the Board does not intend to change this policy.
Donations totalling £9,000 (2015: £5,000) were made for various local charitable purposes.
AT THE FORTHCOMING ANNUAL GENERAL MEETING THE FOLLOWING RESOLUTIONS WILL BE PROPOSED:
DIVIDENDS
An interim dividend of 2.2p per ordinary share was paid on 8 January 2016. The directors are recommending a final dividend of 7.1p per ordinary share to be paid on 12 August 2016, subject to approval at the forthcoming Annual General Meeting of the Company, to shareholders on the register on 15 July 2016 making the total dividend for the year 9.3p (2015: 8.5p) per share. Full details of dividends in respect of the year ended 2 April 2016 are given in note 7 of the financial statements.
DIRECTORS’ AUTHORITY TO ALLOT SHARES
A resolution will be proposed to renew an existing authority which expires at the Annual General Meeting and gives the Directors authority to exercise the powers of the Company to allot un-issued shares.
DIRECTORS POWER TO DISAPPLY PRE-EMPTION RIGHTS
A resolution will be proposed which disapplies statutory pre-emption rights on the allotment of shares by empowering the Directors to allot shares for cash without offering them to existing shareholders first.
Governance - Report of the Directors
4746
SUBSTANTIAL INTERESTS
Shareholdings in excess of 3% of the issued capital at 6 June 2016 were as follows: -
NAME OF SHAREHOLDING NUMBER % NOTE NO.
OF SHARES HOLDING BELOW
Cropper Family - Beneficial and Non Beneficial Interests 3,021,183 32.7
Willink Family – Beneficial and Non Beneficial Interests 526,032 5.7
Acland Family – Beneficial Interests 52,386 0.6
Total 3,599,601 39.0 1
Miton Group Plc 931,613 10.1
DW Pension Fund Ltd 370,000 4.0
Notes on Shareholding Table: 1. The Cropper, Willink and Acland families are related and are deemed to be acting in concert with a total holding
of 39.0% holding in the Company.
AUDITOR AND DISCLOSURE OF INFORMATION TO AUDITOR
Each Director, as at the date of this report, has confirmed that insofar as they are aware there is no relevant audit information (that is, information needed by the Company’s auditor in connection with preparing their report) of which the Company’s auditor is unaware, and they have taken all the steps that they ought to have taken as a Director in order to make themselves aware of any relevant audit information and to establish that the Company’s auditor is aware of that information.
AGM resolutions will be proposed that KPMG LLP be and are hereby reappointed auditors of the Company and will hold office from the conclusion of this year’s Annual General Meeting until the conclusion of next year’s Annual General Meeting at which accounts are laid before the Company, and that their remuneration be fixed by the Directors.
Governance - Report of the Directors

DETAILS OF DIRECTORS’ INTERESTS
AT 2 APRIL 2016 AT 28 MARCH 2015
ORDINARY OPTIONS ON ORDINARY OPTIONS ON
SHARES ORDINARY SHARES ORDINARY
SHARES SHARES
DIRECTOR INTEREST
M A J Cropper Beneficial 1,229,593 15,339 1,205,593 10,695 Non-beneficial 559,571 - 660,826 -
P I Wild Beneficial 7,142 76,700 1,143 78,872
I M Maddock Beneficial 9,071 20,103 11,019 14,036
M Thompson Beneficial 39,932 26,117 37,630 32,469
K D Watson Beneficial 1,223 17,909 1,021 11,084
P J Willink Beneficial 50,210 25,815 44,210 35,748 Non-beneficial 1,132,408 - 1,132,408 -
D R Wilks Beneficial 9,465 - 9,112 - Non-beneficial 96,958 - 101,255 -
J E Sharp Beneficial 7,950 - 7,950 - Non-beneficial 96,958 - 101,255 -
D Mitchell Beneficial 1,000 - 1,000 - Non-beneficial 96,958 - 101,255 -
DETAILS OF DIRECTORS’ INTERESTS
The Directors who served throughout the period are detailed in the Directors’ Remuneration Report, and details of their interests in shares of the Company are listed above.
Any material related party transactions between the Directors and the Company are set out in the Notes to the Accounts.
Further information relating to the interests of the Directors regarding options on ordinary shares is given in the Directors’ Remuneration Report.
Non-beneficial interests include shares held jointly as trustee with other Directors.
There have been no other material changes between the year-end and 27 June 2016.
Approved by the Board of Directors on 27 June 2016 and were signed on its behalf by
M A J Cropper, Chairman. Burneside Mills. Kendal.
Governance - Report of the Directors
4948
DIRECTORS’ REMUNERATION REPORT
THIS REPORT DETAILS THE DIRECTORS’ REMUNERATION
SERVICE CONTRACTS
The Chief Executive, the Group Finance Director, and the Chief Operating Officer are employed on rolling six month contracts. The Chairman and other Executive Directors are employed on rolling one year contracts.
Non-Executive Directors are employed on contracts of one month’s notice by either side.
SALARIES AND FEES
The remuneration and emoluments of Executive Directors and the Chairman are determined by the Remuneration Committee. The remuneration of the other Non-Executive Directors is agreed by the Group Board and they are not entitled to participate in pension schemes, bonus arrangements or share schemes. The basic salaries of the Directors are reviewed annually and take into consideration cost of living and overall accountability. Also considered is remuneration paid to senior executives in comparable public companies. This information is checked by reference to published surveys, but no formula is in place to determine any specific relationship.
The remuneration of senior management is discussed by the Chairman of the Remuneration Committee and the Chief
Executive and their recommendations endorsed by the Remuneration Committee.
No Director can take part in the decision on his own salary or reward.
ANNUAL BONUS
The Group operates an Executive Bonus Scheme which is structured to reward the Executive Directors if targets are achieved on budgeted earnings, yearly earnings improvement, and year on year working capital control. The total bonus payable to a director is capped at 25% of their contractual salary and is not pensionable.
The Executive Directors are also eligible to participate in the Employee Group Bonus Scheme (‘the Scheme’) and any beneficial interest they hold in Company shares in the Scheme is included in their beneficial holding of shares in the Directors’ Report.
EMPLOYEE SHARE SCHEME
The Group operates a Long Term Incentive Plan (LTIP) Scheme for the Executive Directors, of which details of the options granted and awarded are shown later in this Report. Other senior management personnel are entitled to participate in the LTIP Scheme.
The Group also operates a Save as You Earn Scheme (SAYE) for employees, and details of the SAYE options currently open for Executive Directors are also shown later in this Report.
To enable shareholders to assess the Company’s performance against the London Stock Exchange, the cumulative TSR for the period ended 2 April 2016 is shown in the graph below.
The FTSE All Share is deemed to be the most appropriate comparison in terms of performance. TSR is the total return to shareholders in terms of capital growth and dividends reinvested.
COMPARISON OF FIVE YEAR CUMULATIVE TOTAL SHAREHOLDER RETURN (TSR)
Governance - Directors’ Remuneration Report
TOTAL SHAREHOLDER RETURN
RE
BA
SE
D
0
8.00
1.00
2.00
3.00
4.00
5.00
6.00
7.00
James Cropper FTSE AIM All Share FTSE All Share
04/06 04/07 04/08 04/09 04/10 04/11 04/12 04/13 04/14 04/15 04/16

DETAILS OF DIRECTORS’ REMUNERATION
2016 2015 2016 2015 2016 2015 2016 2015 2016 2015 2016 2015
£’000 £’000 £’000 £’000 £’000 £’000 £’000 £’000 £’000 £’000 £’000 £’000
EXECUTIVE
M A J Cropper 73 72 8 10 3 3 84 85
P I Wild 174 170 51 55 39 20 11 11 275 256
J M Denman (retired July 2014) 34 7 41
N A Read (retired May 2014) 9 59 1 7 76
I M Maddock (appointed July 2014) 103 67 20 12 23 8 7 4 153 91
M Thompson 113 105 25 23 28 25 7 7 173 160
K D Watson 115 113 21 23 26 13 7 7 169 156
P J Willink 103 101 22 20 23 12 17 16 165 149
NON-EXECUTIVE
D Mitchell 22 25 22 25
J E Sharp 27 25 27 25
D R Wilks 29 27 29 27
759 748 59 147 151 139 78 52 55 1,097 1,091
HIGHEST PAID DIRECTOR
2016 2015
£’000 £’000
Aggregate emoluments 264 245
Pension cost 11 11
DIRECTORS’ PENSIONS
The Chief Executive and the Chairman are members of the Company’s defined contribution scheme. Other Executive Directors are either members of the Company’s defined benefit scheme or the Company’s defined contribution scheme. Non-Executive Directors are not in any of the Company pension schemes.
The annual cost borne by the Company is shown above in the Directors’ Remuneration table.
SALARY
AND FEES
BENEFITS
ANNUALBONUS
PENSION
COST
TOTAL
COMPENSATION FOR LOSS OF OFFICE
Governance - Directors’ Remuneration Report
5150
LONG TERM INCENTIVE PLAN
Under the Plan, awards to acquire ordinary shares in the Company can be made to executive directors and employees of the Company and its subsidiaries selected by the Remuneration Committee.
Awards made during the financial year to 2 April 2016 under the Plan to executive directors were as follows:
NUMBER MID-MARKET NUMBER AT 28 NUMBER PRICE (£) OF NUMBER OPTIONS AT 2 MARCH GRANTED OPTIONS EXERCISED LAPSED APRIL 2015 IN PERIOD AWARDED IN PERIOD IN PERIOD 2016
P I Wild 74,362 17,152 £5.083 11,594 7,730 72,190
M A J Cropper 10,695 4,644 £5.083 - - 15,339
P J Willink 34,846 6,067 £5.083 16,000 - 24,913
I M Maddock 9,676 6,067 £5.083 - - 15,743
M Thompson 32,469 6,648 £5.083 13,000 - 26,117
K D Watson 11,084 6,825 £5.083 - - 17,909
The number of options that can be awarded to any participant in a financial year under the Plan, determined by reference to Company’s 20 day average mid-market share price at the time of the award, is limited to a maximum of 50% of the participant’s basic salary.
The LTIP awards are subject to the achievement of certain performance conditions, specific to each director, as set out below:
EARNINGS PER SHARE CONDITIONS EBITDA TARGETS CONDITIONS PERCENTAGE OF AWARD PERCENTAGE OF AWARD
P I Wild 60% 40%
M A J Cropper 60% 40%
P J Willink 100% -
I M Maddock 100% -
M Thompson 100% -
K D Watson 100% -
Governance - Directors’ Remuneration Report
‘AUDITED’

(i) Earnings per share conditions
Awards will vest in full on the third anniversary of the Award provided the growth in the Company’s earnings per share, adjusted for IFRS pension adjustments, between the preceding financial year end when the award was granted and the preceding financial year end when the grant is vested exceed the increase in retail price index plus 10% per annum;
Awards will vest at 10% on the third anniversary of the Award if the growth in the Company’s earnings per share, adjusted for IFRS pension adjustments, between the preceding financial year end when the award was granted and the preceding financial year end when the grant is vested exceed the increase in retail price index plus 2.5% per annum;
Awards will vest proportionally between 10% and 100% on the third anniversary of the Award if the growth in the Company’s earnings per share, adjusted for IFRS adjustments, between the preceding financial year end when the award was granted and the preceding financial year end when the grant is vested exceed the increase in retail price index by more than 2.5% but less than 10% per annum; and
Awards will lapse on the third anniversary of the Award if the growth in the Company’s earnings per share, adjusted for IFRS pension adjustments, between the preceding financial year end when the award was granted and the preceding financial year end when the grant is vested, does not exceed the increase in retail price plus 2.5% per annum..
(ii) EBITDA target conditions
Awards will vest in full on the third anniversary of the Award if the third year EBITDA target as set out in the Company’s 3 Year 2015 business plan has been met or exceeded;
Awards will vest at 30% on the third anniversary of the Award if at least 95% but less than 100% of the third year EBITDA target as set out in the Company’s 3 Year 2015 business plan has been met or exceeded;
Awards will vest at 20% on the third anniversary of the Award if a least 90% but less than 95% of the EBITDA target as set out in the Company’s 3 Year 2015 business plan has been met or exceeded; and
Awards will lapse on the third anniversary of the Award if less than 90% of the EBITDA target as set out in the Company’s 3 Year 2015 business plan has been achieved.
SAYE OPTIONS
The details of the SAYE options that are open to the Executive Directors at 2 April 2016 are as follows:
DATE OF SAYE GRANT 01 SEPTEMBER 2013 01 SEPTEMBER 2013
Term of Option 3.25 years 5.25 years
Exercise price £1.9952 per share £1.9952 per share
Total Share Options availableExecutive Director No. of shares No. of shares as at 2 April 2016
P I Wild 4,510 - 4,510
P J Willink 902 - 902
I M Maddock - 4,360 4,360
On behalf of the Board.
D R WILKSChairman of the Remuneration Committee 27 June 2016
Governance - Directors’ Remuneration Report
53
30 YEARS OF FUTURE TECHNOLOGIES A LANDMARK YEAR FOR TECHNICAL FIBRE PRODUCTS
Spotlight on Technical Fibre Products
SPECIAL REPORT BY MARTIN THOMPSON, MANAGING DIRECTOR OF TFP
2016 marks 30 years since Technical Fibre Products Ltd became a registered company, created with a view to diversifying James Cropper PLC’s product offering. In the years since, this objective has been achieved in more ways than one. Our technically advanced materials are used in applications far beyond those associated with Paper; ranging from aerospace to satellites, sporting goods, wind turbines and sports cars.
GROWTH STRATEGY
Today, we remain a company very much focused on the future. This is demonstrated by a growth strategy which targets markets such as carbon composites and aerospace, predicted to show strong growth annually, with a strong focus on expanding into emerging markets such as China.
The forward thinking nature of the business is also evidenced in the recent investments both in capacity expansion and in innovative complementary technologies, as well as in the continued development of new materials to fulfil market need.
The last financial year has seen many significant advancements for TFP in capacity, technology and quality; creating a solid base for future growth.
EACH YEAR BRINGS NEW AND DIVERSE APPLICATIONS FOR OUR PRODUCTS - THE LIGHTEST WEIGHT AND HIGHEST QUALITY NONWOVENS IN THE WORLD
The applications of our products are increasingly diverse and this year has been no exception, with TFP’s wet-laid nonwovens making it into space on NASA’s Jason-3 satellite, as well as being used in (literally) more down to earth applications such as fuel cells, bikes, bridge de-icing, premium cars and hockey sticks.
AS9100 AEROSPACE ACCREDITATION – RAISING OUR PROFILE IN STRATEGICALLY IMPORTANT MARKETS
Other key applications are in Aerospace and Defence; strategically important markets for TFP. At present over 30% of sales come from this sector and this share is projected to grow.
To support this, TFP achieved the prestigious AS9100 Aerospace accreditation in January 2016. This is a stringent quality standard which demonstrates to the industry that TFP has the knowledge and experience necessary to satisfy the demanding processes & regulatory controls required specifically by Aerospace manufacturers. Achieving this underpins TFP’s global reputation as the go to specialist in developing nonwovens for the highly technical and challenging applications synonymous with the Aerospace and Defence industries.
52
VICKI WRIGHT – MATERIALS SPECIALIST MARK JAMES – RESEARCH SPECIALIST

54
SPOTLIGHT ON TFP
Spotlight on Technical Fibre Products
INVESTING IN FUTURE TECHNOLOGIES
TFP’s manufacturing capability is not limited to nonwovens; the company has recently developed and implemented a number of innovative new complementary technologies.
These include a nanocoating line, which is the first commercial facility of it’s kind in the world. The line is designed to coat materials with nanoscale particles, such as carbon nanotubes, which can impart additional functionality to a nonwoven or improve performance. A further new technology, also based in Schenectady NY, is a particle plating line, developed to functionalise particles using advanced plating methods.
NEW DEVELOPMENTS IN NONWOVENS
TFP’s knowledge and expertise in developing new nonwovens is second to none. It is this capability to design materials to meet a specific processing, aesthetic or performance need that sets TFP apart from competitors.
New developments for 2015/16 included an extended range of lightweight thermoplastic veils, developed for composite toughening. Their effectiveness has been validated by a study at the University of Manchester and demand for these materials is driven by a variety of industries ranging from aerospace to sporting goods.
DOUBLING CAPACITY AND INCREASING CAPABILITY – DRIVEN BY SALES GROWTH
Last, and certainly not least, the year has also seen the installation and commissioning of a new state of the art manufacturing line.
The third line was formally opened at the 170th event by Sir James Cropper and effectively doubles TFP’s production capacity. This was a necessary step to meet rapidly increasing demand and facilitate further sales growth.
The new state of the art line is based on the current proprietary design, but has been engineered to extend not just capacity but capability as well. With improved control over drying, a high-tech automatic reel up to enable continuous running and an increase in production width to over 2 metres, the new line provides both enhanced process control and enables TFP to access new markets.
MARTIN THOMPSON AND SIR JAMES CROPPERSTEVE ROBINSON, NO 3 MACHINE ASSISTANT

Image courtesy of NASA/JPL-Caltech
“ THE APPLICATIONS OF
OUR PRODUCTS ARE
INCREASINGLY DIVERSE
AND THIS YEAR HAS BEEN
NO EXCEPTION, WITH TFP’S
WET-LAID NONWOVENS
MAKING IT INTO SPACE ON
NASA’S JASON-3 SATELLITE,
AS WELL AS BEING USED IN
(LITERALLY) MORE DOWN
TO EARTH APPLICATIONS
SUCH AS FUEL CELLS, BIKES,
BRIDGE DE-ICING, PREMIUM
CARS AND HOCKEY STICKS.”
MARTIN THOMPSON
MANAGING DIRECTOR
TECHNICAL FIBRE PRODUCTS
NEW HORIZONSTFP NONWOVENS IN SPACE
Spotlight on Technical Fibre Products Financial Statements
FINANCIAL STATEMENTS
FINANCIAL STATEMENTS 57
INDEPENDENT AUDITOR’S REPORT 59
STATEMENT OF COMPREHENSIVE INCOME 60
STATEMENT OF FINANCIAL POSITION 6 1
STATEMENT OF CASH FLOWS 62
STATEMENT OF CHANGES IN EQUITY 63
NOTES TO THE FINANCIAL STATEMENTS 65
SHAREHOLDER INFORMATION 89
57

We have audited the financial statements of James Cropper PLC for the 53 weeks ended 2 April 2016 set out on pages 60 to 88. The financial reporting framework that has been applied in their preparation is applicable law and International Financial Reporting Standards (IFRSs) as adopted by the EU and, as regards the parent company financial statements, as applied in accordance with the provisions of the Companies Act 2006.
This report is made solely to the company’s members, as a body, in accordance with Chapter 3 of Part 16 of the Companies Act 2006. Our audit work has been undertaken so that we might state to the company’s members those matters we are required to state to them in an auditor’s report and for no other purpose. To the fullest extent permitted by law, we do not accept or assume responsibility to anyone other than the company and the company’s members, as a body, for our audit work, for this report, or for the opinions we have formed.
Respective responsibilities of directors and auditor
As explained more fully in the Directors’ Responsibilities Statement set out on page 44, the directors are responsible for the preparation of the financial statements and for being satisfied that they give a true and fair view.
Our responsibility is to audit, and express an opinion on, the financial statements in accordance with applicable law and International Standards on Auditing (UK and Ireland). Those standards require us to comply with the Auditing Practices Board’s Ethical Standards for Auditors.
Scope of the audit of the financial statements
A description of the scope of an audit of financial statements is provided on the Financial Reporting Council’s website at www.frc.org.uk/auditscopeukprivate.
Opinion on financial statements In our opinion:
• the financial statements give a true and fair view of the state of the group’s and of the parent company’s affairs as at 2 April 2016 and of the group’s profit for the year then ended;
• the group financial statements have been properly prepared in accordance with IFRSs as adopted by the EU;
• the parent company financial statements have been properly prepared in accordance with IFRSs as adopted by the EU and as applied in accordance with the provisions of the Companies Act 2006; and
• the financial statements have been prepared in accordance with the requirements of the Companies Act 2006.
Opinion on other matter prescribed by the Companies Act 2006
In our opinion the information given in the Strategic Report and the Directors’ Report for the financial year for which the financial statements are prepared is consistent with the financial statements.
Matters on which we are required to report by exception
We have nothing to report in respect of the following matters where the Companies Act 2006 requires us to report to you if, in our opinion:
• adequate accounting records have not been kept by the parent company, or returns adequate for our audit have not been received from branches not visited by us; or
• the parent company financial statements are not in agreement with the accounting records and returns; or
• certain disclosures of directors’ remuneration specified by law are not made; or
• we have not received all the information and explanations we require for our audit.
Michael Frankish
for and on behalf of KPMG LLP, Statutory Auditor
Chartered Accountants Edward VII Quay Navigation Way Preston PR2 2YF
27 June 2016
INDEPENDENT AUDITOR’S REPORT TO THE MEMBERS OF JAMES CROPPER PLC
5958

JAMES CROPPER PLC
GROUP STATEMENT OF COMPREHENSIVE INCOME
53 week 53 week 53 week 52 week period to period to period to period to 2 April 2 April 2 April 28 March 2016 2016 2016 2015 Continuing Exceptional Operations Items Total Total Note £’000 £’000 £’000 £’000
Continuing Operations
Revenue 2 87,920 87,920 83,052
Other income 505 1,000 1,505 314
Changes in inventories of finished goods and work in progress 1,771 1,771 252
Raw materials and consumables used (35,795 ) (35,795 ) (34,415 )
Energy costs (4,519 ) (4,519 ) (5,186 )
Employee benefit costs 20 (25,155 ) (25,155 ) (22,607 )
Depreciation and amortisation 4 (2,306 ) (2,306 ) (2,502 )
Other expenses (16,996 ) (16,996 ) (15,427 )
Exceptional costs (1,765 ) (1,765 ) -
Operating Profit 2 5,425 (765 ) 4,660 3,481
Interest payable and similar charges 3 (793 ) (793 ) (906 )
Interest receivable and similar income 3 1 1 -
Profit before taxation 4 4,633 (765 ) 3,868 2,575
Tax expense 5 (724 ) (150 ) (874 ) (694 )
Profit for the period 3,909 (915 ) 2,994 1,881
Earnings per share - basic 6 32.6p 20.8p
Earnings per share - diluted 6 31.8p 20.1p
OTHER COMPREHENSIVE INCOME
Profit for the period 3,909 (915 ) 2,994 1,881
Items that are or may be reclassified to profit or loss
Foreign currency translation 114 114 (47 ) Items that will never be reclassified to profit or loss
Retirement benefit liabilities – actuarial gains/(losses) 17 6,554 6,554 (3,244 )
Deferred tax on actuarial gains/losses on retirement benefit liabilities 18 (1,488 ) (1,488 ) 560
Income tax on other comprehensive income 5 77 77 214
Other comprehensive expense for the year 5,257 5,257 (2,517 )
Total comprehensive income for the period attributable to equity holders of the Company 9,166 (915 ) 8,251 (636 )
Financial Statements
JAMES CROPPER PLC
STATEMENT OF FINANCIAL POSITION
Group Group Company Company As at As at As at As at 2 April 2016 28 March 2015 2 April 2016 28 March 2015 Note £’000 £’000 £’000 £’000
Assets
Intangible assets 8 123 297 54 184
Property, plant and equipment 9 23,650 21,707 1,752 1,703
Investments in subsidiary undertakings 10 - - 7,350 7,350
Deferred tax assets 18 78 1,174 1,609 2,878
Total non- current assets 23,851 23,178 10,765 12,115
Inventories 11 14,102 13,089 - -
Trade and other receivables 12 19,595 15,717 38,792 31,399
Cash and cash equivalents 3,186 2,721 642 1,903
Current tax assets - - 261 290
Total current assets 36,883 31,527 39,695 33,592
Total assets 60,734 54,705 50,460 45,707
Liabilities
Trade and other payables 13 15,067 12,445 18,075 13,910
Other financial liabilities 14 - - - -
Loans and borrowings 15 3,886 2,720 74 1,139
Current tax liabilities 613 130 - -
Total current liabilities 19,566 15,295 18,149 15,049
Long-term borrowings 15 6,605 6,106 4,094 1,104
Retirement benefit liabilities 17 7,870 14,442 7,870 14,442
Total non-current liabilities 14,475 20,548 11,964 15,546
Total liabilities 34,041 35,843 30,113 30,595
Equity
Share capital 19 2,306 2,292 2,306 2,292
Share premium 1,079 1,034 1,079 1,034
Translation reserve 378 264 - -
Reserve for own shares (343 ) (269 ) - -
Retained earnings 23,273 15,541 16,962 11,786
Total shareholders’ equity 26,693 18,862 20,347 15,112
Total equity and liabilities 60,734 54,705 50,460 45,707
Financial Statements
The accompanying notes forms part of the financial statements. The accompanying notes forms part of the financial statements.
The financial statements on pages 60 to 88 were approved by the Board of Directors on 27 June 2016 and were signed on its behalf by:
M A J Cropper Chairman Company Registration No: 30226
6160

STATEMENT OF CASH FLOWS For the period ended 2 April 2016 (2015: for the period ended 28 March 2015)
Group 2016 Group 2015 Company 2016 Company 2015 £’000 £’000 £’000 £’000
Cash flows from operating activities
Net profit 2,994 1,881 438 1,643
Adjustments for:
Tax 874 694 (7 ) 225
Depreciation and amortisation 2,306 2,502 196 237
Net IAS 19 pension adjustments within SCI 1,305 919 1,305 919
Past service pension deficit payments (1,323 ) (1,362 ) (1,323 ) (1,362 )
Foreign exchange differences (166 ) 41 (65 ) 71
(Profit)/loss on disposal of property, plant and equipment - (2 ) - 6
Net bank interest income & expense 326 405 (847 ) (1,171 )
Share based payments 274 155 274 155
Dividends received from Subsidiary Companies - - (3,500 ) (2,800 )
Changes in working capital:
(Increase) / decrease in inventories (1,021 ) 236 - -
(Increase) / decrease in trade and other receivables (3,861 ) 196 (2,819 ) (4,132 )
Increase in trade and other payables 2,770 3,043 4,723 3,726
Interest received 2 - 914 1,265
Interest paid (333 ) (414 ) (66 ) (103 )
Tax paid (429 ) (448 ) (429 ) (448 )
Net cash generated from / (used by) operating activities 3,718 7,846 (1,206 ) (1,769 )
Cash flows from investing activities
Purchase of intangible assets (133 ) (136 ) (125 ) (136 )
Purchases of property, plant and equipment (3,953 ) (2,483 ) (125 ) (81 )
Proceeds from sale of property, plant and equipment - 41 - 428
Dividends received - - 3,500 2,800
Net cash (used in) / generated from investing activities (4,086 ) (2,578 ) 3,250 3,011
Cash flows from financing activities
Proceeds from issue of ordinary shares 59 168 59 168
Proceeds from issue of new loans 4,790 - 4,000 -
Repayment of borrowings (3,284 ) (2,497 ) (2,075 ) (1,328 )
Issue of inter-company loans - - (4,574 ) 2,333
Purchase of LTIP investments (74 ) (167 ) - -
Dividends paid to shareholders (772 ) (708 ) (772 ) (708 )
Net cash (used in) / generated from financing activities 719 (3,204 ) (3,362 ) 465
Net increase / (decrease) in cash and cash equivalents 351 2,064 (1,318 ) 1,707
Effect of exchange rate fluctuations on cash held 114 (35 ) 57 (61 )
Net increase / (decrease) in cash and cash equivalents 465 2,029 (1,261 ) 1,646
Cash and cash equivalents at the start of the period 2,721 692 1,903 257
Cash and cash equivalents at the end of the period 3,186 2,721 642 1,903
Cash and cash equivalents consists of:
Cash at bank and in hand 3,186 2,721 642 1,903
Financial Statements
STATEMENT OF CHANGES IN EQUITY
GROUP
All figures in £’000
Share Share Translation Own Retained capital premium reserve Shares earnings Total
29 March 2014 2,243 915 311 (102 ) 16,907 20,274
Profit for the period - - - - 1,881 1,881
Exchange differences - - (47 ) - - (47)
Actuarial losses on retirement benefit liabilities (net of deferred tax) - - - - (2,684 ) (2,684 )
Other comprehensive income tax - - - - 214 214
Total other comprehensive income - - (47) - (2,470 ) (2,517 )
Dividends paid - - - - (708 ) (708 )
Share based payment charge - - - - 156 156
Tax on share options - - - (225 ) (225 )
Proceeds from issue of ordinary shares 49 119 - - - 168
Consideration paid for own shares - - - (167 ) - (167 )
Total contributions by and distributions to owners of the Group 49 119 - (167 ) (777 ) (776 )
At 28 March 2015 2,292 1,034 264 (269 ) 15,541 18,862
Profit for the period - - - - 2,994 2,994
Exchange differences - - 114 - - 114
Actuarial gains on retirement benefit liabilities (net of deferred tax) - - - - 5,066 5,066
Other comprehensive income tax - - - - 77 77
Total other comprehensive income - - 114 - 5,143 5,257
Dividends paid - - - - (772 ) (772 )
Share based payment charge - - - - 274 274
Tax on share options - - - - 135 135
Proceeds from issue of ordinary shares 14 45 - - - 59
Distribution of own shares - - - 42 (42 ) -
Consideration paid for own shares - - - (116 ) - (116 )
Total contributions by and distributions to owners of the Group 14 45 - (74 ) (405 ) (420 )
At 2 April 2016 2,306 1,079 378 (343 ) 23,273 26,693
Financial Statements
The accompanying notes forms part of the financial statements. The accompanying notes forms part of the financial statements.
6362

STATEMENT OF CHANGES IN EQUITY
COMPANY
All figures in £’000
Share Share Retained capital premium earnings Total
At 29 March 2014 2,243 915 13,391 16,549
Profit for the period - - 1,643 1,643
Actuarial losses on retirement benefit liabilities (net of deferred tax) - - (2,684 ) (2,684 )
Other comprehensive income tax - - 214 214
Total other comprehensive income - - (2,470 ) (2,470 )
Dividends paid - - (708 ) (708 )
Share based payment charge - - 155 155
Tax on share options - - (225 ) (225 )
Proceeds from issue of ordinary shares 49 119 - 168
Total contributions by and distributions to owners of the Group 49 119 (778) (610 )
At 28 March 2015 2,292 1,034 11,786 15,112
Profit for the period - - 438 438
Actuarial gains on retirement benefit liabilities (net of deferred tax) - - 5,066 5,066
Other comprehensive income tax - - 77 77
Total other comprehensive income - - 5,143 5,143
Dividends paid - - (772 ) (772 )
Share based payment charge - - 274 274
Tax on share options - - 135 135
Proceeds from issue of ordinary shares 14 45 - 59
Distribution of own shares - - (42 ) (42 )
Total contributions by and distributions to owners of the Group 14 45 (405 ) (346 )
At 2 April 2016 2,306 1,079 16,962 20,347
Financial Statements
1. ACCOUNTING POLICIES
The principal accounting policies adopted in the preparation of these financial statements are set out below. These policies have been consistently applied to all the years presented, unless otherwise stated.
Basis of preparation The accounting “year” for the Group is a 53 week accounting period ending 2 April 2016, (2015: 52 week accounting period ended 28 March 2015).
Throughout these notes, the following references apply:
The Statement of Comprehensive Income is referenced as “SCI”
The Statement of Financial Position is referenced as “SFP”
Both the parent company financial statements and the Group financial statements have been prepared and approved by the directors in accordance with International Financial Reporting Standards as adopted by the EU (“Adopted IFRSs”). On publishing the parent company financial statements here together with the Group financial statements, the Company is taking advantage of the exemption in s408 of the Companies Act 2006 not to present its individual Statement of Comprehensive Income and related notes that form a part of these approved financial statements.
Use of estimates and judgements The preparation of financial statements in conformity with generally accepted accounting principles requires the use of estimates and judgements that affect the reported amounts of assets and liabilities at the date of the financial statements and the reported amounts of revenues and expenses during the reporting period. Although these estimates are based on management’s best knowledge of the amount, event or actions, actual results ultimately may differ from those estimates.
The following policies and accompanying notes are where the assumptions and judgements made by management could have an impact on the Group’s consolidated financial statements.
Note 9 Property, plant and equipment It is the Group’s policy to depreciate categories within property, plant and equipment on a straight line basis over their estimated useful lives. A key element of this policy is the estimate of the useful life applied to each category of asset which in turn determines the annual depreciation charge. Variations in asset lives could affect Group profit through an increase or decrease in the depreciation charge.
Note 11 Inventories In the course of normal trading activities management uses it’s judgement to establish the net realisable value of it’s stocks. Provisions are established for obsolete or slow moving stocks, based on past practice, current conditions and aged inventory facts available to management.
Note 12 Trade receivables In estimating the collectability of trade receivables judgement is required and the policies in regard to credit risk are further described in note 16.2.
Note 17 Retirement benefits Assumptions used in the calculation of the Group’s retirement liability have the biggest impact on these financial statements and are detailed in note 17.
Impairment of assets At each reporting date, the Group assesses whether there is any indication that an asset may be impaired. Where an indicator of impairment exists, the Group makes an estimate of recoverable amount. Where the carrying value of an asset exceeds its recoverable amount the asset is written down to its recoverable amount. Recoverable amount is the higher of fair value less costs to sell and value in use and is deemed for an individual asset. If the asset does not generate cash flows that are largely independent of those from other assets or groups of assets, the recoverable amount of the cash generating unit to which the asset belongs is determined. Discount rates reflecting the asset specific risks and the time value of money are used for the value in use calculation.
Basis of consolidation The financial statements of the Group consolidate the accounts of the company and those of its subsidiary undertakings. No subsidiaries are excluded from consolidation. The results and cash flows of subsidiary undertakings acquired are included from the effective date of acquisition. Intragroup balances and any unrealised income and expenses arising from intra-group transactions are eliminated in preparing the consolidated financial statements.
Subsidiaries are entities controlled by the Group. The Group controls an entity when it is exposed to, or has rights to, variable returns from its involvement with the entity and has the ability to affect those returns through its power over the entity. In assessing control, the Group takes into consideration potential voting rights that are currently exercisable. The acquisition date is the date on which control is transferred to the acquirer. The financial statements of subsidiaries are included in the consolidated financial statements from the date that control commences until the date that control ceases.
Revenue recognition Revenue is recognised when the significant risks and rewards of ownership have been transferred to the customer. For the majority of customers this is when delivery has been made or specifically when title has passed, the point at which title passes varying in accordance with the terms and conditions of trade. Revenue is recognised when the amount of the revenue and related costs can be measured reliably and the collectability of the related receivables is reasonably assured.
Revenue is measured at the fair value of the amount received or receivable which is arrived at after deducting trade rebates, customer returns and value added tax. Shipping and handling costs, such as freight to our customers’ destination are included in cost of sales. These costs, when included in the sales price charged for our products are recognised in net sales.
Operating segments IFRS 8 Operating Segments has been adopted by the Group and requires that entities reflect the ‘management approach’ to reporting the financial performance of it’s operating segments. Management has determined the segments that are reported in a manner consistent with the internal reporting provided to the chief operating decision-maker, identified as the Executive Committee that makes strategic decisions. The committee considers the business principally via the four main operating segments. Operating segments are those components of the Group that are engaged in providing a group of related products that are subject to risks and returns that are different to other operating segments. Geographical areas
Notes to the Financial Statements
The accompanying notes forms part of the financial statements.6564

are components where the eventual product destination is in a particular geographic environment which is subject to risks and returns that are different from other such areas. Costs are allocated to segments based on the segment to which they relate. Central costs are recharged on an appropriate basis.
Management responsibility and reporting for the two paper subsidiaries has been merged into one operating segment referred to as Paper products in order to achieve greater customer and operational synergies.
Foreign currencies Transactions in foreign currencies are translated at the foreign exchange rate ruling at the date of the transaction. Monetary assets and liabilities denominated in foreign currencies at the Statement of Financial Position date are translated at the foreign exchange rate ruling at that date. Foreign exchange differences arising on translation are recognised in the Statement of Comprehensive Income. Non-monetary assets and liabilities that are measured in terms of historical cost in a foreign currency are translated using the exchange rate at the date of the transaction.
The assets and liabilities of foreign operations are translated at foreign exchange rates ruling at the Statement of Financial Position date. The revenues and expenses of foreign operations are translated at an average rate for the period where this rate approximates to the foreign exchange rates ruling at the dates of the transactions. Exchange differences arising from translation of foreign operations are taken directly to the translation reserve; they are released into the Statement of Comprehensive Income upon disposal.
The portion of gain or loss on foreign currency borrowings that are used to hedge a net investment in a foreign operation, that is determined to be an effective hedge, is included as a movement in the cumulative translation reserve. On subsequent disposal such gains or losses will form part of the profit/loss on disposal within the Statement of Comprehensive Income. Any ineffective portion is recognised immediately in the Statement of Comprehensive Income.
Research and development Research expenditure is recognised as an expense as incurred. Costs incurred on development projects (relating to the design and testing of new or improved products) are recognised as intangible assets when the IAS 38 conditions are met. Other development expenditures are recognised as an expense as incurred. Development costs with a finite useful life that have been capitalised are amortised from the commencement of the commercial production of the product on a straight-line basis over the period of its expected benefit, not exceeding 5 years.
Retirement benefits The Group operates various pension schemes. The schemes are generally funded through payments to trustee-administered funds, determined by periodic actuarial valuations. The Group has both defined benefit and defined contribution plans. A defined benefit plan is a pension plan that defines an amount of pension benefit that an employee will receive on retirement. A defined contribution plan is a pension plan under which the Group pays fixed contributions.
IAS19R has been adopted for periods beginning on or after 1 January 2013. Remeasurements arising from defined benefit plans comprise actuarial gains and losses, the return on plan assets (excluding interest) and the effect of the asset ceiling (if any, excluding interest). The Group recognises them
immediately in other comprehensive income and all other expenses related to defined benefits in employee benefit expenses in profit or loss.
When the benefits of a plan are changed, or when a plan is curtailed, the portion of the change benefit related to past service by employees, or the gain or loss on curtailment, is recognised immediately in profit or loss when the plan amendment or curtailment occurs.
For defined contribution plans, the Group pays agreed contributions to the schemes. The Group has no further payment obligations once the contributions have been paid. The contributions are recognised as an employee benefit expense when they are due.
Share based payments Options granted to employees are recognised as employee expenses based on fair value at grant date, with a corresponding increase in equity, over the period in which the employees become unconditionally entitled to the options. The fair value of the options granted is measured using an option valuation model, taking into account the terms and conditions upon which the options were granted. The amount recognised as an expense is adjusted to reflect the actual number of share options that vest except where forfeiture is due only to share prices not achieving the threshold for vesting.
The group has a wholly owned subsidiary EBT Limited, which is a trustee of an Employee Benefit Trust in favour of former, current and future employees of James Cropper PLC and its subsidiaries. Its purpose is to acquire market shares in James Cropper PLC, with the intention that these should be made available to such employees on such terms or basis as the trustee of the Employee Trust so decides, and includes the granting of awards under a long term incentive plan. Transactions of the Company-sponsored EBT trust are treated as being those of the Company and are therefore reflected in the parent company and financial statements. In particular, the trust’s purchases and sales of shares in their Company are debited and credited directly to equity.
Intangible fixed assets Intangible assets are stated at cost less accumulated amortisation and accumulated impairments losses, if any. The following useful lives have been determined for intangible assets.
Trade secrets such as processes or unique recipes 10 years
Computer software 3 - 10 years
Emission Allowances 0 – 1 year (refer to note below on Emissions trading scheme for policy)
Property plant and equipment Property, plant and equipment are stated at cost less accumulated depreciation. Depreciation is provided on all property, plant and equipment, other than freehold land, at rates calculated to write off the cost less residual value of each asset evenly over its expected useful life, as follows:
Freehold land and buildings 14 – 40 years
Plant and machinery 4 – 20 years
Residual values and useful lives are reviewed annually.
Notes to the Financial Statements
Inventories Inventories are stated at the lower of cost and net realisable value. The cost of finished goods and work in progress comprises design costs, raw materials, direct labour, other direct costs and related production overheads (based on normal operating capacity). It excludes borrowing costs. Net realisable value is the estimated selling price in the ordinary course of business, less applicable variable selling expenses. Engineering spares are included within inventories.
Emissions trading scheme The Group’s power generation facilities became subject to the European Union Emission Trading Scheme (“EUETS”) as from 1 January 2008. The Group is permitted to emit an average of 16,000 tonnes of carbon dioxide per calendar year up to the year ended 31 Dec 2020. Credits for this quantum are issued to the Group free of charge by HM Government. The Group has adopted an accounting policy which recognises the emission allowances as an intangible asset and an associated liability. The intangible asset is valued at the market price on the date of issue. The liability is valued at the market price on the date of issue up to the level of allocated allowances held. Should emissions exceed the annual allowance any excess of liability above the level of the allowances held is valued at the market price ruling at the Statement of Financial Position date and charged against operating profit. Un-utilised allowances are maintained against a potential future shortfall. When allowances are utilised both the intangible asset and liability are amortised to the Statement of Comprehensive Income. Up until the 31 December 2012 the Group’s emissions were in line with its permitted EUETS allowance and hence there was no impact on profit. After entering phase 3 of the EUETS annual emissions in a calendar year are now expected to exceed allowances received and the impact is taken to the SCI under “Other expenses”. At 2 April 2016 the intangible asset was valued at £20,000 (2015 £59,000) and the associated liability at £20,000 (2015 £59,000). The liability is categorised under current liabilities.
Grants Capital grants are credited to a deferral account and released to income over the expected useful lives of the relevant assets. Grants of a revenue nature are credited to the Statement of Comprehensive Income in the period to which they relate.
Leasing Leases are classified as finance leases at inception where substantially all of the risks and rewards of ownership are transferred to the Group. Assets classified as finance leases are capitalised on the Statement of Financial Position and are depreciated over the expected useful life of the asset. The interest element of the rental obligation is charged to the Statement of Comprehensive Income over the period of the lease and represents a constant proportion of the balance of capital repayments outstanding. Operating lease payments are charged to the Statement of Comprehensive Income in the appropriate period.
Taxation Tax on the Statement of Comprehensive Income for the year comprises current and deferred tax. Tax is recognised in the Statement of Comprehensive Income, according to the accounting treatment of the related transaction.
Deferred tax is provided on temporary differences between the carrying amounts of assets and liabilities for financial reporting purposes and the amounts used for taxation
purposes. The following temporary differences are not provided for: the initial recognition of goodwill; the initial recognition of assets or liabilities that affect neither accounting nor taxable profit other than in a business combination, and differences relating to investments in subsidiaries to the extent that they will probably not reverse in the foreseeable future. The amount of deferred tax provided is based on the expected manner of realisation or settlement of the carrying amount of assets and liabilities, using tax rates enacted or substantively enacted at the Statement of Financial Position date.
A deferred tax asset is recognised only to the extent that it is probable that future taxable profits will be available against which the asset can be utilised.
Research & development tax credit Research and development expenditure credit (RDEC) is recognised within other operating income.
Financial instruments Derivatives are initially recognised at fair value on the date a derivative contract is entered into and are subsequently re-measured at their fair value at each Statement of Financial Position date. The resulting gain or loss on re-measurement is recognised in the Statement of Comprehensive Income, unless hedge accounting is applicable. There were no material balances at the year end.
Loans and receivables are non-derivative financial assets with fixed or determinable payments that are not quoted in an active market. They arise when the Group provides money, goods or services directly to a debtor with no intention of trading the receivable. They are included in current assets, except those with maturities greater than twelve months after the Statement of Financial Position date, which are classified as non-current assets. Loans and receivables are included within trade and other receivables in the Statement of Financial Position.
The fair value of financial instruments traded in active markets is based on quoted market prices at the Statement of Financial Position date.
Investments Trade investments are stated at cost less any impairment in value.
The Group’s share of the profit is included in the Statement of Comprehensive Income on the equity accounting basis.
Cash and cash equivalents Cash and cash equivalents includes cash in hand, deposits held at call with banks, other short-term highly liquid investments with original maturities of three months or less, and bank overdrafts. Bank overdrafts are shown as borrowings within current liabilities on the Statement of Financial Position. Bank overdrafts that are repayable on demand and form an integral part of the Group’s cash management are included as a component of cash and cash equivalents for the purpose only of the Statement of Cash Flows.
Borrowing costs Borrowings are recognised initially at fair value, net of transaction costs incurred. Borrowings are subsequently stated at amortised cost; any difference between the proceeds (net of transaction costs) and the redemption value is recognised in the Statement of Comprehensive Income over the period of the borrowings using the effective interest method.
Notes to the Financial Statements
6766

Interest Interest is recognised in the Statement of Comprehensive Income on an accruals basis using the effective interest method.
Trade receivables Trade receivables are recorded at their initial fair value after appropriate revision of impairment.
Trade payables Trade payables are stated at their fair value.
Capital Management Group and Company’s capital includes share capital, reserves and retained earnings. The Group and Company’s policy is to maintain the ability to continue as a going concern, in order to provide returns to the shareholder and benefits to other stakeholders. The Group, and Company, invest in financial assets that will provide an adequate level of return to the shareholder commensurate with the level of risk.
The Group and Company manages the capital structure and adjusts this in light of the changes in the economic conditions and risk associated with the underlying assets. In order to maintain or adjust the capital structure, the Group and Company may adjust the amount of any dividend paid to the shareholder, return capital to the shareholder, issues new shares, or sell assets to reduce debt. Details of borrowings can be seen in note 15 and share holdings can be referred to in note 19. The Group, and Company, are not subject to any externally imposed capital requirements. There have been no material changes in the management of capital during the period.
Going Concern The directors have prepared the accounts for James Cropper PLC on a going concern basis. See the Report of the Directors section for the basis of the going concern assumption.
Exceptional items Provisions for insurance deductibles, uninsured costs and insurance risks have been recorded in a separate column on the face of the Statement of Comprehensive Income, along with the grant awarded by Cumbria Local Enterprise Partnership and Cumbria County Council, following the effects of Storm Desmond. The grant has been recorded in Other Income and the insurance deductibles and provisions recorded in Exceptional Costs.
New standards and interpretation not applied A number of new standards, amendments to standards and interpretations have been issued during the year ended 2 April 2016 but are not yet effective, and therefore have not yet been adopted by the Group.
IFRS 9 ‘Financial Instruments’ is applicable from 2018. If endorsed, this standard will simplify the classification of financial assets for measurement purposes, but is not anticipated to have a significant impact on the financial statements.
Amendments to IAS12 ‘Recognition of Deferred Tax Assets for Unrealised Losses’ have not yet been endorsed but the IASB effective date will be 1 January 2017.
Amendments to IAS1 ‘Presentation of Financial Statements’ was endorsed on 18 December 2015. It is not expected that there will be any significant change to current practice, but should facilitate improved financial statement disclosures.
The Group continues to monitor the potential impact of other new standards and interpretations which may be endorsed by the European Union and require adoption by the Group in future reporting periods.
The Group does not consider that any other standards, amendments or interpretations issued by the IASB, but not yet applicable, will have a significant impact on the financial statements.
2. SEGMENTAL REPORTING
IFRS 8 Operating Segments - requires that entities adopt the ‘management approach’ to reporting the financial performance of its operating segments. Management has determined the segments that are reported in a manner consistent with the internal reporting provided to the chief operating decision- maker, identified as the Executive Committee that makes strategic decisions. The committee considers the business principally via the four main operating segments, principally based in the UK:
• James Cropper Paper Products: comprising:
• JC Speciality Papers – relates to James Cropper Speciality Papers a manufacturer of specialist paper and boards.
• JC Converting – relates to James Cropper Converting - a converter of paper.
• James Cropper 3D Products – a manufacturer of moulded fibre products.
• Technical Fibre Products – a manufacturer of advanced materials.
• Group Services – comprises central functions providing services to the subsidiary companies.
“Eliminations” refers to the elimination of inter-segment revenues, profits and investments. “Trading Operating Profit before Interest” refers to profits prior to other income and expenditure and the IAS 19 pension adjustment. The “IAS 19 pension adjustment” refers to the impact on operating profits of the pension schemes’ operating costs, as described in the IAS 19 section of the Financial Review. “Interest Expense” incorporates the IAS 19 pension impact of the pension schemes’ finance costs, as described in the IAS 19 section of the Financial Review. The net IAS 19 pension adjustments to Operating profit and interest can be seen in the Summary of Results “Profit before tax” is consistent with that reported in the Statement of Comprehensive Income. Inter segment transactions are performed in the normal course of business and at arms length.
Notes to the Financial Statements Notes to the Financial Statements
2. SEGMENTAL REPORTING (CONTINUED)
Operating Segments Period Ended 2 April 2016
James James Technical Group Other Eliminations Continuing Cropper Cropper Fibre Services Operations Paper 3D Products Products Products £’000 £’000 £’000 £’000 £’000 £’000 £’000
Revenue
- External 69,182 - 17,988 - - - 87,170
- Business Income Insurance Note (1) - - 750 - - - 750
69,182 - 18,738 - - - 87,920
Segment Profit
Trading Operating Profit before Interest 2,592 (438 ) 5,904 (2,608 ) - 49 5,499
IAS 19 Pension adjustments to profit - - - (839 ) - - (839 )
Operating Profit 2,592 (438 ) 5,904 (3,447 ) - 49 4,660
Interest Expense - - - - - - (793 )
Interest Income - - - - - - 1
Profit before tax - - - - - - 3,868
Tax on profit for year - - - - - - (874 )
Profit for the year - - - - - - 2,994
Total Assets 52,295 2,739 37,745 50,460 1,990 (84,495 ) 60,734
Total Liabilities (41,390 ) (3,099 ) (34,037 ) (30,113 ) (343 ) 74,941 (34,041 )
Period ended 28 March 2015 James James Technical Group Other Eliminations Continuing Cropper Cropper Fibre Services Operations Paper 3D Products Products Products £’000 £’000 £’000 £’000 £’000 £’000 £’000
Revenue
- External 68,505 - 14,547 - - - 83,052
Segment Profit
Trading Operating Profit before Interest 2,419 - 2,719 (1,184 ) - (55 ) 3,899
IAS 19 Pension adjustments to profit - - (418 ) - - (418 )
Operating Profit 2,419 - 2,719 (1,602 ) - (55 ) 3,481
Interest Expense (906 )
Interest Income -
Profit before tax 2,575
Tax on profit for year (694 )
Profit for the year 1,881
Total Assets 50,299 27,928 45,707 1,916 (71,145 ) 54,705
Total Liabilities (40,533 ) (26,076 ) (30,595 ) (269 ) 61,630 (35,843 )
6968

Notes to the Financial Statements
2. SEGMENTAL REPORTING (CONTINUED)
The group’s country of domicile is the UK. Revenue from external customers is based on the customer’s location. Non – current assets are based on the location of the assets and exclude financial assets and post – employment benefit net assets.
Revenues from external customers Non – current assets 2016 2015 2016 2015 £’000 £’000 £’000 £’000
UK 42,852 44,083 21,224 20,863
Europe 17,781 15,016 - -
Asia 6,510 7,193 - 1
The Americas 18,244 14,631 2,627 2,314
Australasia 1,220 1,595 - -
Africa 563 534 - -
Total 87,170 83,052 23,851 23,178
(1) Business Income Insurance covers the loss of income that the business suffered after Storm Desmond. It is designed to put
the business in the same financial position it would have been in if no loss had occurred.
3. FINANCE COSTS 2016 2015 £’000 £’000
Interest expense
Interest payable on bank borrowings 188 229
Interest payable on finance leases 139 176
Expected return on pension scheme assets (3,042 ) (3,309 )
Interest on pension scheme liabilities 3,508 3,810
Total interest expense 793 906
Interest incomeOther Interest received 1 -
Total interest income 1 -
Finance costs – net 792 906
4. PROFIT BEFORE TAX 2016 2015 £’000 £’000
The following items have been charged / (credited) in arriving at profit before tax:Staff costs 25,155 22,607
Depreciation of property, plant and equipment - owned assets 1,753 1,926
- leased assets 381 395
- amortisation of intangibles 172 182
Profit on disposal of fixed assets - (2 )
Other operating lease rentals payable - plant & machinery 163 138
Repairs and maintenance expenditure on property, plant and equipment 4,540 3,757
Research & development tax credits (130 ) (128 )
Government grants received (73 ) (136 )
Research and development expenditure 1,765 1,281
Exceptional income - grant received to alleviate impact of flood (1,000 ) -
Exceptional costs - provisions for uninsured losses and risks 1,765 -
Sale of PMD online business (250 ) -
Foreign exchange differences (247 ) 17
Trade receivables impairment 150 11
Government grants relate to assistance received for research projects and the development of new technology.
The exceptional items relate to additional income / costs arising as a consequence of the flood the impacted the Group following the aftermath of Storm Desmond in December 2015.
Services Provided by the Group’s Auditor and network firms During the year the group obtained the following services from the group’s auditor at costs as detailed below:
2016 2015 £’000 £’000
Audit Services
- Fees payable to the company’s auditor for the audit of parent company and consolidated accounts 18 18
Other services
- Remuneration payable to the company’s auditor for the auditing of subsidiary accounts and associates of the company pursuant to legislation (including that of countries and territories outside Great Britain) 53 44
- Fees in respect of debt strategy assessment - 25
- Fees in respect of pension matters 25 -
- Fees in respect of other assurance services 18 11
114 98
Notes to the Financial Statements
7170

5. TAXATION
Analysis of charge in the period 2016 2015Continuing operations Note £’000 £’000
Current tax 1,098 714Adjustments in respect of prior period current tax 33 (1 )
Total current tax 1,131 713
Deferred tax (60 ) (47 )Adjustments in respect of prior period deferred tax (3 ) 27Effects of changes in tax rate (194 ) 1
Total deferred tax 18 (257 ) (19 )
Taxation 874 694
Tax on items charged to equityDeferred tax on actuarial gains on retirement benefit liabilities (1,488 ) 560Deferred tax on share options 135 (225 )Income tax charged to OCI 77 214 The tax for the period is higher (2015: lower) than the standard rate of corporation tax in the UK of 20% (2015: 21%). The differences are explained below: 2016 2015 £’000 £’000
Profit before tax 3,868 2,575
Profit on ordinary activities multiplied by rate of corporation tax in the UK of 20% (2015: 21%) 773 540Effects of:Adjustments to tax in respect of prior period 25 26Effects of other tax rates (194 ) - Overseas tax 107 158Expenses not deductible for tax purposes 214 15Income not taxable (52 ) (46 )Other 1 1
Total tax charge for the period 874 694
Notes to the Financial Statements Notes to the Financial Statements
6. EARNINGS PER SHARE
Basic earnings per share is calculated by dividing the earnings attributable to ordinary shareholders by the weighted average number of shares outstanding during the year.
For diluted earnings per share, the weighted average number of ordinary shares in issue is adjusted to assume conversion of all dilutive potential ordinary shares. The Group has one class of dilutive potential ordinary shares - those share options granted to employees where the exercise price is less than the average market price of the company’s ordinary shares during the year. Reconciliations of the earnings and weighted average number of shares used in the calculations are set out below.
2016 2015 Earnings Weighted Per Share Earnings Weighted Per Share average amount average amount number number of shares of shares £’000 ‘000 pence £’000 ‘000 pence
Basic EPS
Earnings attributable to ordinary shareholders 2,994 9,191 32.6 1,881 9,046 20.8Effect of dilutive securities- Options - 222 - - 303 -
Diluted EPS 2,994 9,413 31.8 1,881 9,349 20.1
7. DIVIDENDS 2016 2015 £‘000 £’000
Final paid for the period ended 28 March 2015 / period ended 29 March 2014 571 508
Interim paid for the period ended 2 April 2016/period ended 28 March 2015 201 199
Final dividend payment paid pence per share for the period ended 28 March 2015 / period ended 29 March 2014 6.3p 5.7p
Interim dividend payment paid pence per share for the period ended 2 April 2016 / period ended 28 March 2015 2.2p 2.2p
In addition, the directors are proposing a final dividend in respect of the financial period ended 2 April 2016 of 7.1p per share (2015: 6.3p per share) which will absorb an estimated £648,000 (2015: £571,000) of shareholders’ funds. If approved by members at the Annual General Meeting, it will be paid on 12 August 2016 to shareholders who are on the register of members at 15 July 2016. There are no tax implications in respect of this proposed dividend.
The proposed dividend is not accounted for until it is formally approved at the Annual General Meeting.
7372

8. INTANGIBLE ASSETS
Group Company Computer Trade Emission Computer Emission Software Secrets Allowances Total Software Allowances Total £’000 £’000 £’000 £’000 £’000 £’000 £’000
Cost At 29 March 2015 3,872 307 2,882 7,061 3,764 2,882 6,646Additions - externally generated 37 - 96 133 30 96 126At 2 April 2016 3,909 307 2,978 7,194 3,794 2,978 6,772
Aggregate amortisationAt 28 March 2015 3,685 256 2,823 6,764 3,639 2,823 6,462Charge for Period 138 34 135 307 121 135 256
At 2 April 2016 3,823 290 2,958 7,071 3,760 2,958 6,718
Net book value at 2 April 2016 86 17 20 123 34 20 54
Net book value at 28 March 2015 187 51 59 297 125 59 184
Group Company Computer Trade Emission Computer Emission Software Secrets Allowances Total Software Allowances Total £’000 £’000 £’000 £’000 £’000 £’000 £’000
Cost At 29 March 2014 3,852 300 2,715 6,867 3,744 2,715 6,459Additions - externally generated 20 - 206 226 20 206 226Disposals - - (39 ) (39 ) - (39 ) (39 )Effects of movements in foreign exchange - 7 - 7 - - -
At 28 March 2015 3,872 307 2,882 7,061 3,764 2,882 6,646
Aggregate amortisationAt 29 March 2014 3,534 225 2,628 6,387 3,506 2,628 6,134Charge for Period 151 31 195 377 133 195 328
At 28 March 2015 3,685 256 2,823 6,764 3,639 2,823 6,462
Net book value at 28 March 2015 187 51 59 297 125 59 184
Net book value at 29 March 2014 318 75 87 480 238 87 325
The computer software capitalised principally relates to the ongoing development of the Group’s Enterprise Resource Planning and Financial systems. There is a separate Enterprise Resource Planning system for the Technical Fibre Products Business segment and the remaining amortisation period of this asset at the period end is 5 years.
The trade secrets relate to certain recipes and know how acquired within the TFP division. The remaining amortisation period of the assets at the period end is 1 year.
The Emission Allowances relate to the allowances received through the European Emissions Trading Scheme (EUETS) and are valued at market value at the date of initial recognition. The allocated allowances are held throughout each compliance period and are used to meet the Group’s emissions obligations.
Notes to the Financial Statements
9. PROPERTY, PLANT AND EQUIPMENT
Group Freehold land & buildings Plant & machinery Total £’000 £’000 £’000
Cost Brought forward at 28 March 2015 11,138 77,857 88,995Additions at cost - 3,954 3,954Disposals (9 ) (1,712 ) (1,721 )Effects of movements in foreign exchange - 123 123
At 2 April 2016 11,129 80,222 91,351
Accumulated DepreciationBrought forward at 28 March 2015 6,285 61,003 67,288Charge for Period 256 1,878 2,134Disposals (9 ) (1,712 ) (1,721 )
At 2 April 2016 6,532 61,169 67,701
Net book value at 2 April 2016 4,597 19,053 23,650
Net book value at 28 March 2015 4,853 16,854 21,707
Freehold land & buildings Plant & machinery Total £’000 £’000 £’000
Cost Brought forward at 29 March 2014 11,085 75,892 86,977Additions at cost 53 2,430 2,483Disposals - (716 ) (716 )Effects of movements in foreign exchange - 251 251
At 28 March 2015 11,138 77,857 88,995
Accumulated DepreciationBrought forward at 29 March 2014 6,018 59,665 65,683Charge for Period 267 2,054 2,321Disposals - (716 ) (716 )
At 28 March 2015 6,285 61,003 67,288
Net book value at 28 March 2015 4,853 16,854 21,707
Net book value at 29 March 2014 5,067 16,227 21,294
Assets held under finance leases, capitalised and included in tangible fixed assets:
Group Company 2016 2015 2016 2015 £’000 £’000 £’000 £’000
B/f NBV 5,031 5,828 373 811
Additions in period 30 - - -
Reclassification to assets owned (62 ) (402 ) - (402 )
Depreciation in period (381 ) (395 ) (23 ) (36 )
Net book value 4,618 5,031 350 373
Notes to the Financial Statements
7574

Notes to the Financial Statements
9. PROPERTY, PLANT AND EQUIPMENT (CONTINUED)
Company Freehold land & buildings Plant & machinery Total £’000 £’000 £’000
Cost Brought forward at 28 March 2015 1,663 1,985 3,648Additions at cost - 125 125 Disposals - (7 ) (7 )
At 2 April 2016 1,663 2,103 3,766
Accumulated Depreciation
Brought forward at 28 March 2015 393 1,552 1,945Charge for Period 30 46 76Disposals - (7 ) (7 )
At 2 April 2016 423 1,591 2,014
Net book value at 2 April 2016 1,240 512 1,752
Net book value at 28 March 2015 1,270 433 1,703
Freehold land & buildings Plant & machinery Total £’000 £’000 £’000
Cost Brought forward at 29 March 2014 1,610 2,675 4,285Transfers - (473 ) (473 )Additions at cost 53 28 81 Disposals - (245 ) (245 )
At 28 March 2015 1,663 1,985 3,648
Accumulated Depreciation
Brought forward at 29 March 2014 360 1,804 2,164Charge for Period 33 71 104Transfers - (77 ) (77 )Disposals - (246 ) (246 )
At 28 March 2015 393 1,552 1,945
Net book value at 28 March 2015 1,270 433 1,703
Net book value at 29 March 2014 1,250 871 2,121
10. INVESTMENTS
Investments in subsidiary undertakings: Group Company 2016 2015 2016 2015 £’000 £’000 £’000 £’000
At 2 April 2016 and 28 March 2015 - - 7,350 7,350
Investments in subsidiary undertakings are stated at cost. A list of principal subsidiary undertakings is given below:
Country of % holding incorporation (of ordinary shares) Nature of business
James Cropper Speciality Papers Limited England 100 Manufacture of specialist paper and boardsJames Cropper (Guanghzou) Trading Co Limited China 100 Sales and marketing organisationJames Cropper Converting Limited England 100 Paper converterJames Cropper 3D Products Limited England 100 Manufacturer of moulded fibre productsTechnical Fibre Products Limited England 100 Manufacture of advanced materialsTech Fibers Inc USA 100 Holding CompanyTechnical Fibre Products Inc USA 100 Sales and marketing organisationMetal Coated Fibers Inc USA 100 Manufacturer of metal coated carbon fibresElectro Fiber Technologies LLC USA 100 Manufacturer of metal coated fibresJames Cropper EBT Limited England 100 Trustee of an employee benefit trustMelmore Limited England 100 Dormant companyPapermilldirect.com Limited England 100 Dormant companyThe Paper Mill Shop Company Limited England 100 Dormant company
11. INVENTORIES Group 2016 2015 £’000 £’000
Materials 7,479 7,592
Work in progress 2,004 1,382
Finished goods 4,619 4,115
14,102 13,089
Inventories are stated after a provision for impairment of £232,000 (2015: £46,000). The cost of inventories recognised as expenses and included in cost of sales for the year ended 2 April 2016 was £63,446,000 (2015: £67,292,000). The Company does not have inventories.
12. TRADE AND OTHER RECEIVABLES Group Company 2016 2015 2016 2015 £’000 £’000 £’000 £’000
Trade receivables 14,956 14,610 - -
Less: Provision for impairment of receivables (80 ) (68 ) - -
Trade receivables - net 14,876 14,542 - -
Amounts owed by group undertakings - - 36,005 30,704
Other receivables 3,024 262 2,270 262
Prepayments 1,695 913 517 433
19,595 15,717 38,792 31,399
Management believe there is no further credit risk provision required in excess of normal provision for doubtful receivables.
Notes to the Financial Statements
7776

13. TRADE AND OTHER PAYABLES Group Company 2016 2015 2016 2015 £’000 £’000 £’000 £’000
Trade payables 3,807 5,795 1,126 2,079 Amounts owed to group undertakings - - 11,739 10,355 Other tax and social security payable 525 458 133 116 Other payables 3,501 287 3,495 268 Accruals 7,234 5,905 1,582 1,092
15,067 12,445 18,075 13,910
14. OTHER FINANCIAL LIABILITIES Group 2016 2015 £’000 £’000
Interest rate swap - -
There were no interest rate swaps during the year.
The gain arising in the Income Statement on fair value hedging instruments was £nil (2015: £11,000).
15. BORROWINGS Group Company 2016 2015 2016 2015 Note £’000 £’000 £’000 £’000
Current
Bank loans and overdrafts due within one year or on demand:Unsecured bank loans 3,042 1,825 - 1,070Secured finance lease 844 895 74 69
16.3 3,886 2,720 74 1,139
Non-current loans:Unsecured bank loans 4,708 3,375 4,000 930Secured finance lease 1,897 2,731 94 174
16.3 6,605 6,106 4,094 1,104
Bank loans bear interest at rates between 1% and 4.5% above UK bank base rates.
The future minimum lease payments under finance leases held, together with the value of principal are as follows:
Minimum Interest Principal Minimum Interest Principal lease payments lease payments 2016 2016 2016 2015 2015 2015 £’000 £’000 £’000 £’000 £’000 £’000
Group Within one year 939 95 844 1,027 132 895
Greater than one year and less than five years 1,995 98 1,897 2,919 188 2,731
CompanyWithin one year 84 10 74 84 15 69
Greater than one year and less than five years 98 4 94 189 15 174
Notes to the Financial Statements Notes to the Financial Statements
16. FINANCIAL INSTRUMENTS AND RISK
The Group has exposure to the following risks from its use of financial instruments:
• Credit risk • Liquidity risk • Currency risk • Interest rate risk
This note presents information about the fair value of the Group’s financial instruments, the Group’s exposure to each of the risks noted and the Group’s objectives, policies and processes for measuring and managing risk. The Board has overall responsibility of the risk management strategy and coordinates activity across the Group. This responsibility is discussed further in the Director’s report.Exposure to the financial risks noted, arise in the normal course of the Group’s business.
16.1 CATEGORIES OF NON-DERIVATIVE FINANCIAL ASSETS AND LIABILITIES AND FAIR VALUES
The fair values of the financial assets and liabilities of the Group together with their book values are as follows:
Group Book Value Fair Value Book Value Fair Value 2016 2016 2015 2015 Note £’000 £’000 £’000 £’000
Financial assetsBank loans and overdrafts due within one year or on demand:CurrentTrade receivables 12 14,956 14,876 14,610 14,542Cash and cash equivalents 3,186 3,186 2,721 2,721
18,142 18,062 17,331 17,263
Financial liabilitiesCurrentTrade payables 13 3,807 3,807 5,795 5,795Short term borrowings 15 3,886 3,886 2,720 2,720
7,693 7,693 8,515 8,515
Non-currentLong term borrowings 15 6,605 6,605 6,106 6,106
Company Book Value Fair Value Book Value Fair Value 2016 2016 2015 2015 Note £’000 £’000 £’000 £’000
Financial assetsCurrentCash and cash equivalents 642 642 1,903 1,903
642 642 1,903 1,903
Non-currentInvestments in subsidiary undertakings 10 7,350 7,350 7,350 7,350 Financial liabilities Current Trade payables 13 1,126 1,126 2,079 2,079Short term borrowings 15 74 74 1,139 1,139
1,200 1,200 3,218 3,218
Non-currentLong term borrowings 15 4,094 4,094 1,104 1,104
The fair values are stated at the reporting date and may be different from the amounts which will be actually paid or received on settlement of the instruments. The fair values are based on book values as the directors do not consider that there is a material difference between the book values and the fair values.
7978

16.2 CREDIT RISK
Credit risk is the risk of financial loss to the Group if a customer or counterparty fails to meet its contractual obligations. Credit risk arising from the Group’s normal commercial activities are controlled by individual business units operating in accordance with Group policies and procedures. Exposure to credit risk arises from the potential of a customer defaulting on their invoiced sales. Some of the Group’s businesses have credit insurance in place. For un-insured customers, the financial strength and credit worthiness of the customer is assessed from a variety of internal and external information, and specific credit risk controls that match the risk profile of those customers are applied.
Trade receivables recorded by business held at the 2 April 2016 were: 2016 2015 £’000 £’000
JC Speciality Papers 9,946 9,452
JC Converting 1,739 2,117
Technical Fibre Products 3,191 2,973
14,876 14,542
The Company does not have trade receivables.
The ageing of trade receivables at the reporting date was: 2016 2015 £’000 £’000
Not past due 12,761 12,473
Past due 0-30 days 1,786 2,104
Past due 31 -60 days 409 33
14,956 14,610
Less impairment (80 ) (68 )
14,876 14,542
At the end of each reporting period a review of the provision for bad and doubtful debts is performed. It is an assessment of the potential amount of trade debtors which will not be paid by customers after the balance sheet date. This amount is calculated by reference to the age, status and risk of each receivable.
Provision for doubtful debts.
Group 2016 2015 £’000 £’000
Balance at start of period 68 79
Created / (released) during the period 162 (11 )
Utilised during the period (150 ) -
Balance at end of period 80 68
Included in the outstanding trade receivables balance are debtors with an overdue amount of £2,115,000 (2015: £2,069,000) that the Group has not provided for. The directors believe that these amounts are still considered recoverable from customers for whom there is no recent history of default.
Notes to the Financial Statements Notes to the Financial Statements
16.3 LIQUIDITY RISK
Liquidity risk is the risk that the Group will not have sufficient funds to meet liabilities. The Group’s policy is to maintain a mix of short, medium and long term borrowings with a number of banks. Short term flexibility is achieved through overdraft facilities. In addition, it is the Group’s policy to maintain undrawn committed borrowing facilities in order to provide flexibility in the management of liquidity.
Current and non- current financial liabilitiesThe maturity profile of the carrying amount of the current and non-current financial liabilities, at 2 April 2016, was as follows:
Finance Finance lease lease Debt obligations Total Debt obligations Total 2016 2016 2016 2015 2015 2015 Group £’000 £’000 £’000 £’000 £’000 £’000
In less than one year 3,042 844 3,886 1,825 895 2,720In more than one year but not more than two years 690 756 1,446 755 843 1,598In more than two years but not more than five years 4,018 1,141 5,159 2,618 1,888 4,506In more than five years - - - 2 - 2
7,750 2,741 10,491 5,200 3,626 8,826
Finance Finance lease lease
Debt obligations Total Debt obligations Total 2016 2016 2016 2015 2015 2015 Company £’000 £’000 £’000 £’000 £’000 £’000
In less than one year - 74 74 1,070 69 1,139In more than one year but not more than two years - 80 80 620 74 694In more than two years but not more than five years 4,000 14 4,014 310 100 410In more than five years - - - - - -
4,000 168 4,168 2,000 243 2,243
Trade payablesTrade payables at the reporting date was: Group Company 2016 2015 2016 2015 £’000 £’000 £’000 £’000
Trade payables at the reporting date was 3,807 5,795 1,126 2,079
Total contractual cash flows 3,807 5,795 1,126 2,079
Borrowing facilitiesThe Group has the following undrawn committed borrowing facilities available at 2 April 2016: Group at 2 April 2016 Group at 28 March 2015 Floating rate £’000 Floating rate £’000
Expiring within one year (renewable annually) 3,513 4,658
The Group’s expiry profile of the drawn down facilities is as follows: Group Group Company Company at 2 April 2016 at 28 March 2015 at 2 April 2016 at 28 March 2015 £’000 £’000 £’000 £’000
September 2015 - 450 - 450December 2015 - 621 - - June 2016 2,123 2,023 - -August 2016 - 512 - -April 2017 - 800 - 800December 2017 1,592 - - - March 2018 - 300 - 300 January 2019 - 450 - 450 August 2019 22 28 - - November 2019 13 16 - - May 2020 4,000 - 4,000 -
7,750 5,200 4,000 2,000
8180

Notes to the Financial Statements
16.4 CURRENCY RISK
The Group publishes its consolidated financial statements in sterling but also conducts business in foreign currencies. As a result it is subject to foreign currency exchange risk arising from exchange rate movements which will be reflected in the Group’s transaction costs or in the underlying foreign currency assets of its foreign operations. The Group has operations in the US. The Group is exposed to foreign exchange risks primarily with respect to US Dollars and the Euro. Where possible, the Group maintains a policy of balancing sales and purchases denominated in foreign currencies. Where an imbalance remains, the group has also entered into certain forward exchange contracts. No material contracts were outstanding at the year end. The management of foreign currency is described in further detail in the Financial Review.
Represented below is the net exposure to foreign currencies, reported in pounds sterling, and arising from all Group activities, as at 2 April 2016. USD Euro RMB GBP Total £’000 £’000 £’000 £’000 £’000
Trade Receivables 4,745 2,444 - 7,687 14,876Cash and cash equivalents 1,220 35 173 1,758 3,186Trade Payables (336 ) (809 ) (3 ) (2,659 ) (3,807 )Unsecured current loans (3,033 ) - - (8 ) (3,041 )Finance lease current - - - (845 ) (845 )Unsecured non-current loans (682 ) - - (4,026 ) (4,708 )Finance lease non-current - - - (1,897 ) (1,897 )
Net exposure 1,914 1,670 170 10 3,764
At the 28 March 2015 the Group’s exposure to foreign currency risk was as follows: USD Euro RMB GBP Total £’000 £’000 £’000 £’000 £’000
Trade Receivables 3,727 2,257 - 8,558 14,542Cash and cash equivalents 465 15 72 2,169 2,721Trade Payables (1,209 ) (494 ) - (4,092 ) (5,795 )Unsecured current loans (747 ) - - (1,078 ) (1,825 )Finance lease current - - - (895 ) (895 )Unsecured non-current loans (2,409 ) - - (965 ) (3,374 )Finance lease non-current - - - (2,731 ) (2,731 )
Net exposure (173 ) 1,778 72 966 2,643
This represents the net exposure to foreign currencies, reported in pounds Sterling, and arising from all Group activities.
At the 2 April 2016 the Company’s exposure to foreign currency risk was as follows: USD Euro GBP Total £’000 £’000 £’000 £’000
Cash and cash equivalents 40 21 581 642Trade Payables (2 ) (2 ) (1,122 ) (1,126 )Unsecured current loans - - - -Finance lease current - - (74 ) (74 )Unsecured non-current loans - - (4,000 ) (4,000 )Finance lease non-current - - (94 ) (94 )
Net exposure 38 19 (4,709 ) (4,652 )
At the 28 March 2015 the Company’s exposure to foreign currency risk was as follows: USD Euro GBP Total £’000 £’000 £’000 £’000
Cash and cash equivalents 2 5 1,896 1,903Trade Payables - (3 ) (2,076 ) (2,079 )Unsecured current loans - - (1,070 ) (1,070 )Finance lease current - - (69 ) (69 )Unsecured non-current loans - - (930 ) (930 )Finance lease non-current - - (174 ) (174 )
Net exposure 2 2 (2,423 ) (2,419 )
Notes to the Financial Statements
A one percent strengthening of the pound against the Euro and the US Dollar at 2 April 2016 would have had the following impact on equity and profit by the amounts shown below.
Equity SCI Equity SCIGroup £’000 £’000 Company £’000 £’000
2 April 2016 USD (19 ) (44 ) 2 April 2016 USD - -2 April 2016 Euro (17 ) (16 ) 2 April 2016 Euro - -28 March 2015 USD Nil (25 ) 28 March 2015 USD Nil Nil28 March 2015 Euro (18 ) (17 ) 28 March 2015 Euro Nil Nil
This sensitivity analysis is indicative only and it should be noted that the Group’s exposure to such market rate changes is continually changing. The calculations assume all other variables, in particular interest rates, remain constant.
16.5 INTEREST RATE RISK
Interest rate risk derives from the Group’s exposure to changes in value of an asset or liability or future cash flow through changes in interest rates. The group finances its operations through a mixture of retained profits and bank borrowings. The group borrows in the desired currencies at fixed or floating rates of interest. As part of the Group’s interest rate management strategy the Company entered into an interest rate swap which matured in January 2015. No interest rate swaps were outstanding at the year end. The net exposure to interest rates at the Statement of Financial Position date can be summarised as follows:
The net exposure to interest rates at the balance sheet date can be summarised as follows:
Group Group Company Company 2016 2015 2016 2015 £’000 £’000 £’000 £’000
Interest bearing liabilities - floatingBorrowings 7,714 5,157 4,000 2,000 Finance lease 1,846 2,327 - -
9,560 7,484 4,000 2,000Interest bearing liabilities - fixedBorrowings 35 42 - -Finance lease 896 1,299 168 243
931 1,342 168 243
Interest bearing liabilities 10,491 18,826 4,168 2,243
The effective interest rates at the balance sheet date were as follows: 2016 2015 % %
Bank overdraft 1.5 1.5Borrowings 3.7 3.9
The sensitivity analysis below assumes a 100 basis point change in interest rates from their levels at the reporting date, with all other variables held constant. A 1% rise in interest rates would result in an additional £75,000 for the Group and £20,000 for the Company in interest expense being incurred per year. The impact of a decrease in rates would be an identical reduction in the annual charge. Group Company SCI SCI £’000 £’000
2 April 2016 96 4028 March 2015 75 20
8382

Notes to the Financial Statements
17. RETIREMENT BENEFITS
The Group operates a number of pension schemes. Two of these schemes, the James Cropper PLC Works Pension Plan (“Works Scheme”) and the James Cropper PLC Pension Scheme (“Staff Scheme”) are funded schemes of the defined benefit type. The Group also operates a defined contribution scheme and makes contributions to personal pension plans for its employees in the USA.
Pension costs for the defined contribution scheme and personal pension contributions are as follows:
2016 2015 Group £’000 £’000
Defined contribution schemes 508 286
Personal Pension contributions 29 25
Other pension costs totalled £265,000 (2015: £226,000) and represent life assurance charges and government pension protection fund levies.
Defined benefit plansAs from 1 April 2011 active members’ benefits have been reduced such that future increases in pensionable salaries are restricted to RPI up to a maximum of 2% per annum. Thus the Staff and Works Schemes will remain defined benefit schemes but they will no longer be “final salary” schemes. The most recent actuarial valuations of the Staff Scheme and the Works Scheme have been updated to 2 April 2016 by qualified independent actuaries. The major assumptions used by the actuary for each scheme were as noted below. The expected return on plan assets is calculated by using a weighted average across each category of asset: Staff Scheme Works Scheme 2016 2015 2016 2015 % % % %
Inflation assumption 2.90 3.0 2.90 3.0
Rate of increase in pensionable salaries 1.90 2.0 1.90 2.0
Discount rate 3.55 3.3 3.55 3.3
Allowance for pension in payment increases of RPI or 5% p.a. if less (subject to minimum of 3% p.a) 3.30 3.4 3.30 3.4
Allowance for revaluation of deferred pensions of CPI or 5% p.a if less on the Staff scheme or RPI or 2.5% p.a. if less on the Works scheme 1.90 2.0 1.90 2.0
In respect of mortality for the Works members the assumptions adopted at 2 April 2016 are 145% of the SAPS “S1” series table, with future improvements in line with the CMI core 2015 projection model with long-term trend improvements of 1.25% pa. For the Staff members the SAPs “S1” series table with a 95% rating has been used, with future improvements in line with the CMI core 2015 projection model with long term trend improvements of 1.25% pa. The different tables and methods applied to each Scheme reflect the different characteristics of the members within these Schemes. The long-term expected rate of return on cash is determined by reference to bank base rates at the SFP dates. The long-term expected return on bonds is determined by reference to UK long dated government and corporate bond yields at the SFP date. The long-term expected rate of return on equities is based on the rate of return on bonds with an allowance for out-performance.
The amounts recognised in the Statement of Financial Position are determined as follows:
2016 2015 2014 2013 2012 £’000 £’000 £’000 £’000 £’000
Present value of scheme liabilities (102,141 ) (106,788 ) (85,482 ) (85,112 ) (78,005 )
Fair value of plan assets 94,271 92,346 73,842 74,759 70,307
Net liability recognised in the SFP (7,870 ) (14,442 ) (11,640 ) (10,353 ) (7,698 )
Notes to the Financial Statements
The fair value of the plan assets comprises the following categoriesof asset in the stated proportions: Staff Scheme Works Scheme 2016 2015 2016 2015 % % % %
Equities 62 64 73 74Bonds - - - -Annuities 4 4 - -Cash 1 1 1 1Corporate Bonds - - - -Real Liability Strategy 9 9 4 4Nominal Liability Strategy 25 22 23 23
The pension plan assets do not include any investments in the shares of the Company (2015: nil).
The amounts recognised in the Statement of Comprehensive Income are as follows: 2016 2015 £’000 £’000
Total included within employee benefit costs - current service cost 1,363 979
Expected return on plan assets (3,042 ) (3,309 )Interest on pension scheme liabilities 3,508 3,810
Total included within interest 466 501
Total 1,829 1,480
Analysis of the movement in the Statement of Financial Position liability: 2016 2015 £’000 £’000
At 28 March 2015 / 29 March 2014 (14,442 ) (11,640 )Total expense as above (1,829 ) (1,480 )Contributions paid 1,847 1,922 Actuarial losses recognised in SCI 6,554 (3,244 )
At 2 April 2016 / 28 March 2015 (7,870 ) (14,442 )
The actual return on plan assets was £2,418,000 (2015: £18,900,000). The Company expects to pay £835,000 (2015: £928,000) in contributions to the Staff Scheme and £1,055,000 (2015: £1,137,000) in contributions to the Works Scheme in the next financial period.The cumulative amount of losses recognised in the Statement of Comprehensive Income, since the adoption of IAS 19, are £8,689,000 (2015: £15,243,000).
Works Scheme Staff Scheme Works Scheme Staff Scheme 2016 2016 2016 2016 2015 2015 2015 2015 Assets DBO Assets DBO Assets DBO Assets DBO
At 28 March 2015 / 29 March 2014 47,075 (58,443 ) 45,271 (48,345 ) 37,604 (46,018 ) 36,238 (39,464 )
Expected return on assets 1,552 - 1,490 - 1,686 - 1,623 -
Current service costs (104 ) (754 ) (33 ) (472 ) - (568 ) - (411 )
Benefits paid (1,466 ) 1,466 (1,228 ) 1,228 (1,407 ) 1,407 (1,397 ) 1,397
Contributions by plan participants 329 (329 ) 162 (162 ) 317 (317 ) 168 (168 )
Employer contributions 1,025 - 822 - 1,044 - 879 -
Interest cost - (1,922 ) - (1,586 ) - (2,053 ) - (1,757 )
Actuarial (losses)/gains (485 ) 4,216 (139 ) 2,962 7,831 (10,894 ) 7,760 (7,942 )
At 2 April 2016 / 28 March 2015 47,926 (55,766 ) 46,345 (46,375 ) 47,075 (58,443 ) 45,271 (48,345 )
Experience adjustments 2016 2015 2014 2013 2012 £’000 £’000 £’000 £’000 £’000
Arising on plan assets (624 ) 15,591 (3,830 ) 1,855 (1,759 )Percentage of scheme assets (0.66% ) 16.88% (5.19% ) 2.48% (2.50% )
Arising on plan liabilities 7,178 (18,836 ) 2,621 (143 ) - Percentage of scheme liabilities 7.03% (17.64% ) 3.07% (0.17% ) -
8584

Notes to the Financial Statements
18. DEFERRED TAXATION
The movement on the deferred tax account is shown below: Group Company 2016 2015 2016 2015 £’000 £’000 £’000 £’000
At 28 March 2015 / 29 March 2014 1,174 820 2,878 2,552Deferred tax on actuarial gains on retirement liabilities (1,488 ) 560 (1,488 ) 560Deferred tax on share options 135 (225 ) 135 (60 )SCI credit / (charge) 257 19 84 (174 )
At 2 April 2016/28 March 2015 78 1,174 1,609 2,878
Deferred tax assets have been recognised in respect of all temporary differences giving rise to deferred tax assets because it is probable that these assets will be recovered. No deferred tax is recognised on the un-remitted earnings of overseas subsidiaries. Based on the combined distributable reserves in the US Companies of £2,888,000 (2015: £2,268,000), tax at 20% of £578,000 could be receivable, before any application for double tax relief, which could be expected to reduce the UK liability to nil.
Deferred tax liabilities Accelerated capital allowances Other Total £’000 £’000 £’000
At 28 March 2015 (1,933 ) 219 (1,714 )SCI credit 147 93 240Deferred tax on share options - 135 135
At 2 April 2016 (1,786 ) 447 (1,339 )
Deferred tax assets Pension Total £’000 £’000
At 28 March 2015 2,888 2,888 SCI Credit 17 17Deferred tax on actuarial gains on retirement liabilities (1,488 ) (1,488 )
At 2 April 2016 1,417 1,417
Total £’000
Net deferred tax asset 78
19. CALLED UP EQUITY SHARE CAPITAL
Group and Company 2016 2015Authorised £’000 £’000
10,000,000 (2015:10,000,000) ordinary shares of 25p each 2,500 2,500
Issued and fully paid Number of ordinary shares £’000
At 28 March 2015 9,166,766 2,292Issued during the period 59,076 14
At 2 April 2016 9,225,842 2,306
Potential issue of ordinary shares
Under the Group’s long-term incentive plan for executive directors and senior executives, such individuals hold rights over ordinary shares that may result in the issue of up to 172,211 ordinary shares of 25p by 2018 (2015: 173,999 ordinary shares of 25p by 2017). There were 40,594 share options exercised in the period (2015: nil). Further information on directors share options can be seen in the Directors Remuneration Report.
Notes to the Financial Statements
The Save As You Earn (SAYE) schemes were introduced in September 2013 and run for either a three or five year period. Options were valued using a Black-Scholes option pricing model. The fair value per option and assumptions used in the calculation are as follows: -
Sept ‘13 Sept ‘13 3 year scheme 5 year scheme
Fair value per option 57p 71p
Date of grant 1 September 1 September 2013 2013
Exercise Price 199.52p 199.52p
Market Price at date of grant 313.5p 313.5p
Volatility 26% 26%
Net dividend yield 2% 2%
Term of option 3.25 years 5.25 years
Risk free rate of interest 0.8% 1.5%
During the period 43,076 options were exercised (2015: 195,616 options were exercised).
20. EMPLOYEES AND DIRECTORS
Staff costs during the period Group Company 2016 2015 2016 2015 Note £’000 £’000 £’000 £’000
Wages and salaries 21,105 19,403 3,550 3,322
Social Security costs 1,886 1,688 317 271
Pension costs 17 2,164 1,516 1,033 451
25,155 22,607 4,900 4,044
The average monthly number of people (including executive directors) employed in the Group during the year, analysed by division was as follows: Full Time Equivalent Headcount 2016 2015 2016 2015 Number Number Number Number
James Cropper Paper Products 362 358 372 359 Technical Fibre Products 99 92 101 92 James Cropper plc 57 57 73 75
518 507 546 526
21. COMMITMENTS UNDER OPERATING LEASES
Group 2016 2016 2015 2015 Plant & Plant & Property Machinery Property Machinery £’000 £’000 £’000 £’000
Commitments under non-cancellable operating leases expiring:Within one year 10 - 26 -Later than one year and less than five years 313 524 391 501After five years 1,724 - 1,185 -
2,047 524 1,602 501
8786

21. COMMITMENTS UNDER OPERATING LEASES (CONTINUED)
Company 2016 2016 2015 2015 Plant & Plant & Property Machinery Property Machinery £’000 £’000 £’000 £’000
Commitments under non-cancellable operating leases expiring:Within one year - - - -Later than one year and less than five years 291 524 391 501 After five years 665 - - -
956 524 391 501
22. CAPITAL COMMITMENTS Group Company 2016 2015 2016 2015 £’000 £’000 £’000 £’000
Contracts placed for future capital expenditure not provided in the financial statements. 1,270 1,791 12 33
23. CONTINGENT LIABILITIES
There were no contingent liabilities at the period end for the group. The Company is included in a cross guarantee between itself and its subsidiaries.
24. RELATED PARTY TRANSACTIONS
Group
The Group has taken advantage of the exemption not to disclose intra-group transactions that are eliminated on consolidation.
Company
The Company pays £40,000 (2015: £40,000) annually to Sir James Cropper for the use of reservoirs to supply water to the factory premises. The contract is based on a twenty year repairing lease with rent reviews every five years. The rent is negotiated through independent advisers representing each party. The Company paid £918 (2015: £45,550) to Ellergreen Hydro, a company in which M A J Cropper is Managing Director, in the period for a maintenance project. The Company paid £16,407 (2015: £23,909) to Ellergreen Estate (trading name of the J A Cropper (1989) Settlement), a trust of which M A J Cropper is a beneficiary, for imports of electricity from the hydro-electric plant owned and operated by the Trust. The company has rented the roof space of one of the buildings to Burneside Community Energy Ltd, who have installed solar panels. The company is importing the electricity generated by the solar panels and paying Burneside Community Energy Ltd. No financial transactions have arisen in the year. M A J Cropper is a director of Burneside Community Energy Ltd.
The Company also has the following transactions with related entities:
2016 Loans and net Management intercompany charges Receivable funding £’000 £’000 £’000
James Cropper Speciality Papers Limited 4,143 1,333 5,143 James Cropper Converting Limited 656 71 9,184 Technical Fibre Products Limited 942 1,377 5,641 James Cropper 3D Products Limited - 151 1,022 James Cropper EBT Limited - - 343
5,741 2,932 21,333
2015 Loans and net Management intercompany charges Receivable funding £’000 £’000 £’000
James Cropper Speciality Papers Limited 4,309 1,746 8,071James Cropper Converting Limited 763 467 8,997Technical Fibre Products Limited 896 325 474James Cropper EBT Limited - - 269
5,968 2,538 17,811
Notes to the Financial Statements
2015 - 2016 SHAREHOLDER INFORMATION
Reporting
Interim Results announced and sent to
Ordinary Shareholders 10 November 2015
Final results announced 28 June 2016
Annual Report issued by 5 July 2016
Annual General Meeting - at Bryce Institute, Burneside, Kendal, Wednesday 27 July 2016 at 11.00am.
Dividends on Ordinary Shares
Interim dividend paid on 8 January 2016 to Ordinary Shareholders registered on 10 December 2015.
Final dividend to be paid on 12 August 2016 to Ordinary Shareholders registered on 15 July 2016.
Shareholder Information
Bankers and Advisers
Bankers Svenska Handelsbanken AB (publ) Barclays Bank plc HSBC Bank plc
Independent Auditor KPMG LLP, Preston
Tax Advisers PriceWaterhouseCoopers LLP, Newcastle upon Tyne
NOMAD & Stockbrokers Stockdale Securities Limited, London
Corporate Lawyers Bond Dickinson, Newcastle upon Tyne DWF LLP, Manchester
Registrars Capita Asset Services, Beckenham
Pension Adviser Willis Towers Watson, Manchester
James Cropper plc
+44 (0)1539 722002 (Tel)
Burneside Mills Kendal, Cumbria LA9 6PZ Great Britain
www.cropper.com Company Registration No: 30226
8988

Notice of Annual General Meeting
127TH ANNUAL GENERAL MEETING
JAMES CROPPER PLC
WEDNESDAY 27 JULY 2016 AT 11.00AM
THE BRYCE INSTITUTE. BURNESIDE, KENDAL CUMBRIA LA9 6PZ
NOTICE OF ANNUAL GENERAL MEETING
9190
Notice of Annual General Meeting
NOTICE IS HEREBY GIVEN that the 127th Annual General Meeting of the Company will be held at The Bryce Institute, Burneside, Kendal, Cumbria LA9 6PZ on Wednesday 27 July 2016 at 11 am to consider and, if thought fit, pass Resolutions 1 to 10 inclusive as ordinary resolutions and Resolution 11 as a special resolution. The Chairman of the Company will act as Chairman of the Meeting other than Resolution 3 which will be chaired by another director of the Company.
Resolution 1 To receive and consider the statement of accounts and reports of the Directors and the auditors for the 53 weeks ended 2 April 2016.
Resolution 2 To declare a final dividend for the year ended 2 April 2016 of 7.1 pence for each Ordinary Share payable on 12 August 2016 to all Ordinary Shareholders on the register of the Company at close of business on 15 July 2016.
Resolution 3 To re-elect Mark A J Cropper as a director of the Company.
Resolution 4 To re-elect Philip I Wild as a director of the Company.
Resolution 5 To re-elect Martin Thompson as a director of the Company.
Resolution 6 To re-elect James E Sharp as a director of the Company.
Resolution 7 To reappoint KPMG as auditors of the Company to hold office until the conclusion of the next Annual General Meeting of the Company.
Resolution 8 To authorise the Directors to determine the remuneration of the auditors of the Company.
Resolution 9 To consider and approve the Directors’ Remuneration Report for the 53 weeks ended 2 April 2016.
Resolution 10 That the directors be and they are hereby generally and unconditionally authorised in accordance with section 551 of the Companies Act 2006 to exercise all the powers of the Company to allot shares in the Company and to grant rights to subscribe for, or to convert any security into, shares in the Company up to an aggregate nominal amount of £193,139 provided that this authority shall expire at the end of the next Annual General Meeting of the Company or, if earlier, 15 months from the date of this Resolution, save that the Company shall be entitled to make offers or agreements before the expiry of such authority which would or might require shares to be allotted or such rights to be granted after such expiry and the directors shall be entitled to allot shares and grant rights pursuant to any such offer or agreement as if this authority had not expired; and all unexercised authorities previously granted to the directors to allot shares and grant rights be and are hereby revoked.
Resolution 11 That the directors be and they are hereby empowered pursuant to section 570 and section 573 of the Companies Act 2006 to allot equity securities (within the meaning of section 560 of that Act) for cash pursuant to the authority conferred by Resolution 10 above or by way of a sale of treasury shares as if section 561(1) of that Act did not apply to any such allotment provided that this power shall be limited to:
(a) the allotment of equity securities in connection with an offer of securities in favour of the holders of Ordinary Shares on the register of members at such record dates as the directors may determine where the equity securities respectively attributable to the interests of the Ordinary Shareholders are proportionate (as nearly as may be practicable) to the respective numbers of Ordinary Shares held by them on any such record dates, subject to such exclusions or other arrangements as the directors may deem necessary or expedient to deal with treasury shares, fractional entitlements or legal or practical problems arising under the laws of any overseas territory or the requirements of any regulatory body or stock exchange or by virtue of Ordinary Shares being represented by depositary receipts or any other matter; and
(b) the allotment (otherwise than pursuant to sub-paragraph (a) of this Resolution 11) to any person or persons of equity securities up to an aggregate nominal amount of £193,139, and shall expire upon the expiry of the general authority conferred by Resolution 8 above, save that the Company shall be entitled to make offers or agreements before the expiry of such power which would or might require equity securities to be allotted after such expiry and the directors shall be entitled to allot equity securities pursuant to any such offer or agreement as if the power conferred hereby had not expired.
BY ORDER OF THE BOARD
Jim Aldridge Company Secretary 5 July 2016 Registered Office: Burneside Mills Kendal Cumbria LA9 6PZ
NOTICE OF ANNUAL GENERAL MEETING
Notice of Annual General Meeting
Notes:
Proxies
1. To be entitled to attend and vote, whether in person or by proxy, at the AGM, members must be registered in the Register of Members of the Company at 6.00 pm on 25 July 2016 (or, if the meeting is adjourned, at 6.00 pm on the date which is two days prior to the adjourned meeting). Changes to entries on the Register of Members after this time shall be disregarded in determining the rights of persons to attend or vote (and the number of votes they may cast) at the AGM or adjourned meeting.
2. A member entitled to attend and vote at the meeting convened by the above notice is entitled to appoint another person as his proxy to exercise all or any of his rights to attend and to speak and vote at a meeting of the Company. Any such member may appoint more than one proxy provided that each proxy is appointed to exercise the rights attached to a different share or shares held by such member. You may not appoint more than one proxy to exercise rights attached to any one share. To appoint more than one proxy, please photocopy the form of proxy and indicate in the box next to the proxy’s name the number of shares in relation to which he or she is authorised to act as your proxy. Please also indicate by ticking the box provided if the proxy instruction is one of multiple instructions being given. All forms must be signed and should be returned together in the same envelope.
3. A proxy need not be a member of the Company. Your proxy could be the Chairman, another director of the Company or another person who has agreed to attend to represent you. Your proxy must vote as you instruct and must attend the meeting for your vote to be counted. Appointing a proxy will not prevent a shareholder from attending in person and voting at the meeting. If you wish your proxy to speak on your behalf at the meeting you will need to appoint your own choice of proxy (not the Chairman of the meeting) and give your instructions directly to that person.
4. A form of appointment of proxy is enclosed. Details of how to appoint a proxy are set out in the notes to the proxy form. If you return more than one valid proxy appointment in respect of the same share for use at the same meeting and in respect of the same matter, that received last by the registrar before the latest time for the receipt of proxies shall be treated as replacing or revoking the other or others as regards to that share.
5. The form of proxy includes a vote withheld option. Please note that a vote withheld is not a vote in law and will not be counted in the calculation of the proportion of votes for and against any particular Resolution.
6. The appointment of a proxy and the original or duly certified copy of the power of attorney or other authority (if any) under which it is signed or authenticated should
be deposited with the Company’s registrar at the address shown on the proxy form not later than 11.00 am on 25 July 2016 or 48 hours before the time for holding any adjourned meeting. The deadline for receipt of proxy appointments (see above) also applies in relation to amended instructions.
7. CREST members who wish to appoint a proxy or proxies by utilising the CREST electronic proxy appointment service may do so by utilising the procedures described in the CREST Manual on the Euroclear website (www.euroclear.com/CREST). CREST Personal Members or other CREST sponsored members, and those CREST members who have appointed a voting service provider(s), should refer to their CREST sponsor or voting service provider(s), who will be able to take the appropriate action on their behalf. In order for a proxy appointment made by means of CREST to be valid, the appropriate CREST message (a “CREST Proxy Instruction”) must be properly authenticated in accordance with Euroclear UK & Ireland Limited’s (EUI) specifications and must contain the information required for such instructions, as described in the CREST Manual. The message regardless of whether it constitutes the appointment of a proxy or an amendment to the instruction given to a previously appointed proxy must, in order to be valid, be transmitted so as to be received by the issuer’s agent (ID RA10) by the latest time(s) for receipt of proxy appointments specified in the notice of meeting. For this purpose, the time of receipt will be taken to be the time (as determined by the timestamp applied to the message by the CREST Applications Host) from which the issuer’s agent is able to retrieve the message by enquiry to CREST in the manner prescribed by CREST. The Company may treat as invalid a CREST Proxy Instruction in the circumstances set out in regulation 35(5)(a) of the Uncertificated Securities Regulations 2001.
8. CREST members and, where applicable, their CREST sponsors or voting service providers should note that EUI does not make available special procedures in CREST for any particular messages. Normal system timings and limitations will therefore apply in relation to the input of CREST Proxy Instructions. It is the responsibility of the CREST member concerned to take (or, if the CREST member is a CREST personal member or sponsored member or has appointed a voting service provider(s), to procure that his CREST sponsor or voting service provider(s) take(s)) such action as shall be necessary to ensure that a message is transmitted by means of the CREST system by any particular time. In this connection, CREST members and, where applicable, their CREST sponsors or voting service providers are referred, in particular, to those sections of the CREST Manual concerning practical limitations of the CREST system and timings.
9392

Notice of Annual General Meeting
Corporate representatives
9. A member of the Company which is a corporation may authorise a person or persons to act as its representative(s) at the AGM. In accordance with the provisions of the Companies Act 2006, each such representative may exercise (on behalf of the corporation) the same powers as the corporation could exercise if it were an individual member of the Company, provided that they do not do so in relation to the same shares.
Total Voting Rights
10. As at 9.00 am on the Latest Practicable Date, being the last practicable day prior to the publication of this notice, the Company’s issued share capital comprised 9,227,445 Ordinary Shares of 25 pence each. Each ordinary share carries the right to one vote at a general meeting of the Company and, therefore, the total number of voting rights in the Company as at 9.00 am on the Latest Practicable Date, being the last practicable date prior to the publication of this notice is 9,227,445.
Directors’ contracts
11. Copies of the contracts of service for directors and a statement of directors’ interests are available for inspection during normal business hours at the registered office of the Company and they may be inspected at the place of the Annual General Meeting for at least 15 minutes prior to the meeting and at the meeting.
94

ANNUAL REPORT PRODUCTION
All the paper used in this report has been made in England by James Cropper PLC.
Cover Colorplan Factory Yellow, 350gsm
Endpapers Colorplan Tabriz Blue, 135gsm
Inner pages Colorplan:
Cool Grey, 135gsm Pristine White, 135gsm
Natural, 135gsm Cool Blue, 135gsm
Financial Statements Colorplan Park Green, 135gsm
Design Plain Creative
Photography
Pantling Studio James Cropper Archives
Steven Barber Photography
Dixons Printing Company Ltd
96
W W W . C R O P P E R . C O M
JAMES CROPPER PLC
Registered Office: Burneside Mil ls , Kendal , Cumbria LA9 6PZRegistered in England and Wales No. 30226


