16
We generate value for you Mid-Year Report 2014
We generate value for youMid-Year Report 2014
00_gf_hjb-2014_Cover_en.indd 2 14.07.2014 10:24:11
5% Restofworld
25% Asia
9% Americas
24% Germany
19% Switzerland
12% Austria
6% RestofEurope
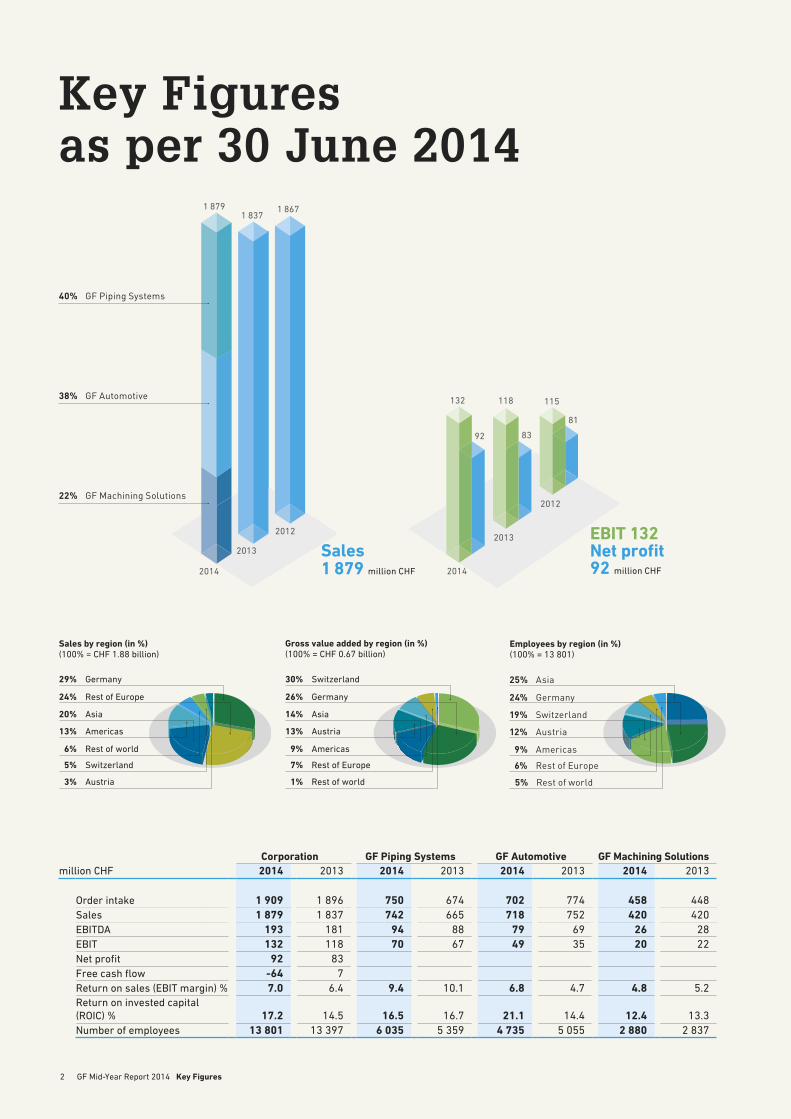
Sales by region (in %)(100% = CHF 1.88 billion)
13% Austria13% Americas
1% Rest of world 3% Austria
9% Americas 6% Rest of world
7% Rest of Europe 5% Switzerland
Gross value added by region (in %)(100% = CHF 0.67 billion)
30% Switzerland29% Germany
26% Germany24% Rest of Europe
14% Asia20% Asia
Employees by region (in %)(100% = 13 801)
2
Key Figuresas per 30 June 2014
Corporation GF Piping Systems GF Automotive GF Machining Solutionsmillion CHF 2014 2013 2014 2013 2014 2013 2014 2013
Order intake 1 909 1 896 750 674 702 774 458 448Sales 1 879 1 837 742 665 718 752 420 420EBITDA 193 181 94 88 79 69 26 28EBIT 132 118 70 67 49 35 20 22Net profit 92 83Free cash flow -64 7Return on sales (EBIT margin) % 7.0 6.4 9.4 10.1 6.8 4.7 4.8 5.2Return on invested capital (ROIC) % 17.2 14.5 16.5 16.7 21.1 14.4 12.4 13.3Number of employees 13 801 13 397 6 035 5 359 4 735 5 055 2 880 2 837
1000 /100 /10
2012
2013
2014
1 8791 837
1 867
Sales 1 879 million CHF
GF Mid-Year Report 2014 Key Figures
1000 /100 /10
132 118 115
92 83
81
2013
2012
2014
EBIT 132 Net profit 92 million CHF
40% GFPipingSystems
38% GFAutomotive
22% GFMachiningSolutions
02_gf_hjb-2014_Key_Figures_en.indd 2 14.07.2014 10:23:40
3
Content
Consolidated financial statements
6 Balance sheet
7 Income statement
8 Statement of changes in equity
9 Statement of cash flows
11 Corporate accounting principles
12 Notes to the consolidated interim financial statements
15 Save the date
4 Letter to the Shareholders
GF Mid-Year Report 2014 Content
02_gf_hjb-2014_Key_Figures_en.indd 3 14.07.2014 10:23:41
4
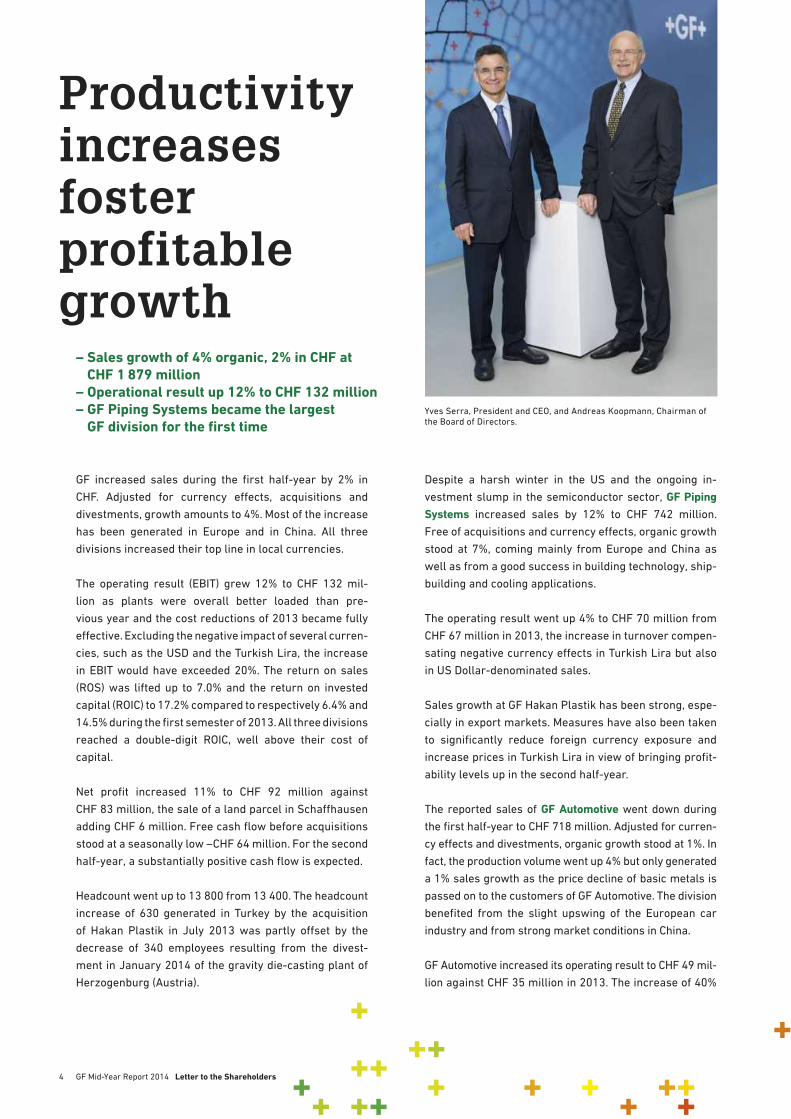
Yves Serra, President and CEO, and Andreas Koopmann, Chairman of the Board of Directors.
Productivity increases foster profitable growth
– Sales growth of 4% organic, 2% in CHF at CHF 1 879 million
– Operational result up 12% to CHF 132 million– GF Piping Systems became the largest
GF division for the first time
Despite a harsh winter in the US and the ongoing in-
vestment slump in the semiconductor sector, GF Piping Systems increased sales by 12% to CHF 742 million.
Free of acquisitions and currency effects, organic growth
stood at 7%, coming mainly from Europe and China as
well as from a good success in building technology, ship-
building and cooling applications.
The operating result went up 4% to CHF 70 million from
CHF 67 million in 2013, the increase in turnover compen-
sating negative currency effects in Turkish Lira but also
in US Dollar-denominated sales.
Sales growth at GF Hakan Plastik has been strong, espe-
cially in export markets. Measures have also been taken
to significantly reduce foreign currency exposure and
increase prices in Turkish Lira in view of bringing profit-
ability levels up in the second half-year.
The reported sales of GF Automotive went down during
the first half-year to CHF 718 million. Adjusted for curren-
cy effects and divestments, organic growth stood at 1%. In
fact, the production volume went up 4% but only generated
a 1% sales growth as the price decline of basic metals is
passed on to the customers of GF Automotive. The division
benefited from the slight upswing of the European car
industry and from strong market conditions in China.
GF Automotive increased its operating result to CHF 49 mil-
lion against CHF 35 million in 2013. The increase of 40%
GF increased sales during the first half-year by 2% in
CHF. Adjusted for currency effects, acquisitions and
divestments, growth amounts to 4%. Most of the increase
has been generated in Europe and in China. All three
divisions increased their top line in local currencies.
The operating result (EBIT) grew 12% to CHF 132 mil-
lion as plants were overall better loaded than pre-
vious year and the cost reductions of 2013 became fully
effective. Excluding the negative impact of several curren-
cies, such as the USD and the Turkish Lira, the increase
in EBIT would have exceeded 20%. The return on sales
(ROS) was lifted up to 7.0% and the return on invested
capital (ROIC) to 17.2% compared to respectively 6.4% and
14.5% during the first semester of 2013. All three divisions
reached a double-digit ROIC, well above their cost of
capital.
Net profit increased 11% to CHF 92 million against
CHF 83 million, the sale of a land parcel in Schaffhausen
adding CHF 6 million. Free cash flow before acquisitions
stood at a seasonally low –CHF 64 million. For the second
half-year, a substantially positive cash flow is expected.
Headcount went up to 13 800 from 13 400. The headcount
increase of 630 generated in Turkey by the acquisition
of Hakan Plastik in July 2013 was partly offset by the
decrease of 340 employees resulting from the divest-
ment in January 2014 of the gravity die-casting plant of
Herzogenburg (Austria).
GF Mid-Year Report 2014 Letter to the Shareholders
03_gf_hjb-2014_Letter-to-shareholder_en.indd 4 14.07.2014 10:23:31
5
resulted from a better plant load in Europe as well as
from the portfolio streamlining and the cost reductions
implemented in 2013.
GF Machining Solutions increased its bookings by 2%,
5% in local currencies, mainly on account of a rebound
in Europe and a steady order intake in China. First half-
year sales lagged somewhat behind orders as large con-
tracts will be delivered in the second semester. In CHF
they amount to CHF 420 million, at previous year’s level.
In local currencies, they were up 3%.
The operational profit was somewhat lower than previ-
ous year at CHF 20 million against CHF 22 million mainly
on account of currency effects.
Strategic moves to enhance value generation and reduce cyclicity
GF Piping Systems became for the first time the largest
division of GF. This represents an important change in
portfolio in view of reducing the overall cyclicity of the
corporation and increase its profitability.
GF Automotive signed early July a strategic and financial
partnership with Meco Eckel, the leading German manu-
facturer of pressure die-casting molds. This partnership
brings a unique combination of mold and component
production know-how at the service of our customers.
Closing is expected in the next few weeks.
In addition, GF Machining Solutions acquired early July
Liechti Engineering AG, the leading specialist of 5-axis
milling machines used to produce key components
of aircraft engines and power generating turbines.
GF Machining Solutions will thus significantly strengthen
its presence and product portfolio in the promising and
less cyclical aerospace sector.
OutlookWe expect market demand to remain uneven with a slight
recovery in Europe and rather low growth levels in
several Asian and South American countries. Never-
theless, despite a traditionally weaker second half-year,
we expect to generate during that period figures similar
to the first semester.
The US market for GF Piping Systems is recovering after
the dismal weather conditions of the first quarter, the
backlog of GF Machining Solutions is high and the car
markets, including trucks, should be supportive of further
growth at GF Automotive. In addition, the two acquisitions
of GF Automotive and GF Machining Solutions strengthen
their competitiveness and will add both volume and profit
during the second half-year.
GF will keep course regarding the implementation of its
strategy, steadily increasing its productivity in Europe
and expanding in growth markets. The 2015 objectives
remain unchanged with a ROIC between 16% to 20% and
a ROS in the 8% range.
Andreas KoopmannChairman of the Board of
Directors
Yves SerraPresident and CEO
GF Mid-Year Report 2014 Letter to the Shareholders
03_gf_hjb-2014_Letter-to-shareholder_en.indd 5 14.07.2014 10:23:32
6
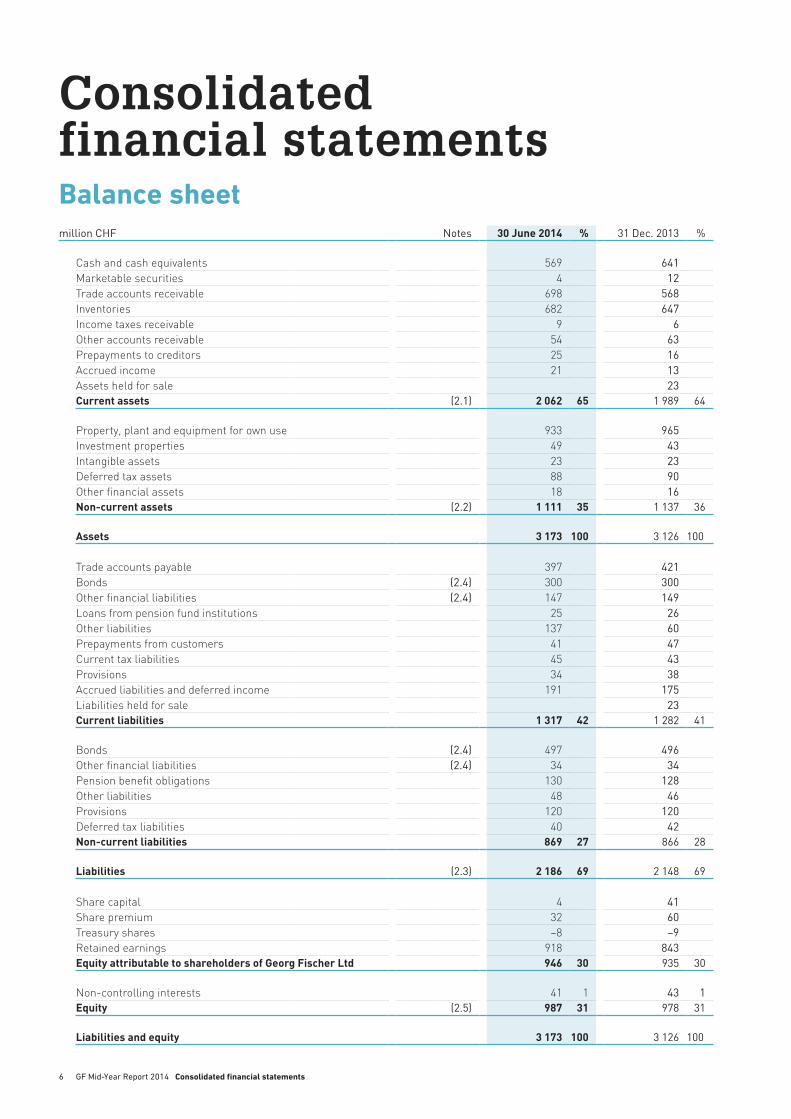
Consolidated financial statementsBalance sheetmillion CHF Notes 30 June 2014 % 31 Dec. 2013 %
Cash and cash equivalents 569 641Marketable securities 4 12Trade accounts receivable 698 568Inventories 682 647Income taxes receivable 9 6Other accounts receivable 54 63Prepayments to creditors 25 16Accrued income 21 13Assets held for sale 23Current assets (2.1) 2 062 65 1 989 64
Property, plant and equipment for own use 933 965Investment properties 49 43Intangible assets 23 23Deferred tax assets 88 90Other financial assets 18 16Non-current assets (2.2) 1 111 35 1 137 36
Assets 3 173 100 3 126 100
Trade accounts payable 397 421Bonds (2.4) 300 300Other financial liabilities (2.4) 147 149Loans from pension fund institutions 25 26Other liabilities 137 60Prepayments from customers 41 47Current tax liabilities 45 43Provisions 34 38Accrued liabilities and deferred income 191 175Liabilities held for sale 23Current liabilities 1 317 42 1 282 41
Bonds (2.4) 497 496Other financial liabilities (2.4) 34 34Pension benefit obligations 130 128Other liabilities 48 46Provisions 120 120Deferred tax liabilities 40 42Non-current liabilities 869 27 866 28
Liabilities (2.3) 2 186 69 2 148 69
Share capital 4 41Share premium 32 60Treasury shares –8 –9Retained earnings 918 843Equity attributable to shareholders of Georg Fischer Ltd 946 30 935 30
Non-controlling interests 41 1 43 1Equity (2.5) 987 31 978 31
Liabilities and equity 3 173 100 3 126 100
GF Mid-Year Report 2014 Consolidated financial statements
04_gf_hjb-2014_Inhalt_en.indd 6 14.07.2014 10:23:15
7
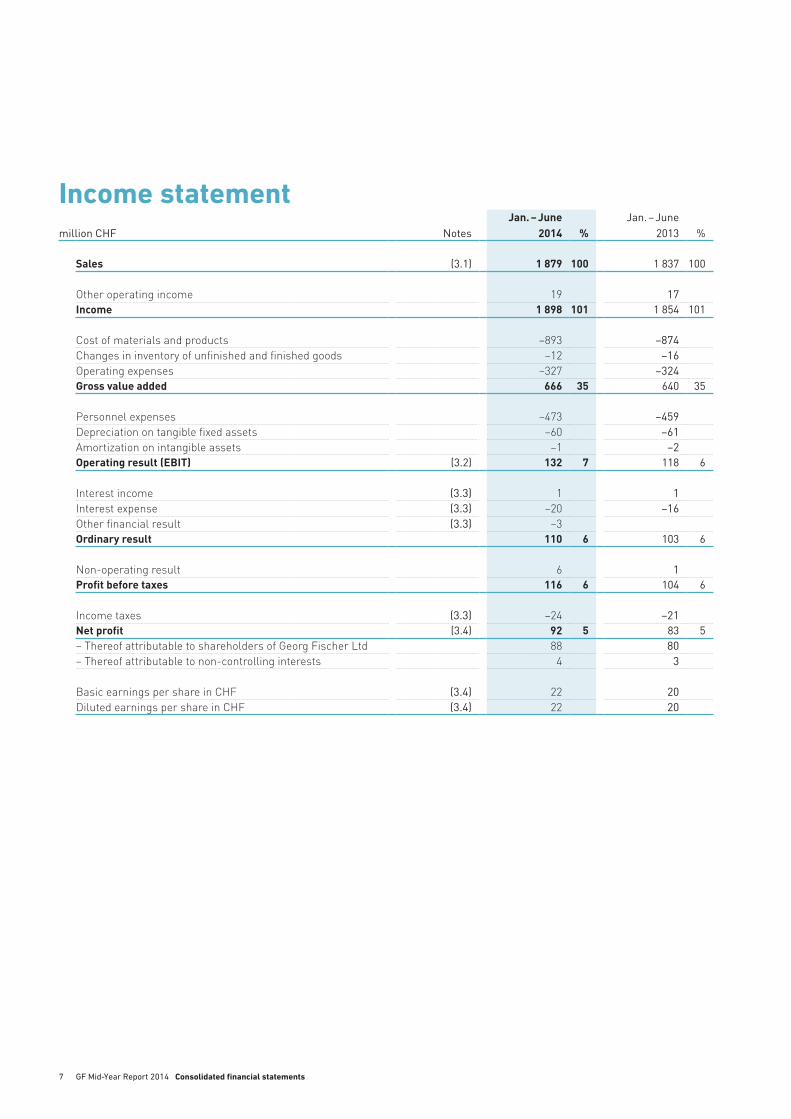
Income statement million CHF Notes
Jan. – June 2014 %
Jan. – June 2013 %
Sales (3.1) 1 879 100 1 837 100
Other operating income 19 17Income 1 898 101 1 854 101
Cost of materials and products –893 –874Changes in inventory of unfinished and finished goods –12 –16Operating expenses –327 –324Gross value added 666 35 640 35
Personnel expenses –473 –459Depreciation on tangible fixed assets –60 –61Amortization on intangible assets –1 –2Operating result (EBIT) (3.2) 132 7 118 6
Interest income (3.3) 1 1Interest expense (3.3) –20 –16Other financial result (3.3) –3 Ordinary result 110 6 103 6
Non-operating result 6 1Profit before taxes 116 6 104 6
Income taxes (3.3) –24 –21Net profit (3.4) 92 5 83 5– Thereof attributable to shareholders of Georg Fischer Ltd 88 80– Thereof attributable to non-controlling interests 4 3
Basic earnings per share in CHF (3.4) 22 20Diluted earnings per share in CHF (3.4) 22 20
GF Mid-Year Report 2014 Consolidated financial statements
04_gf_hjb-2014_Inhalt_en.indd 7 14.07.2014 10:23:15
8
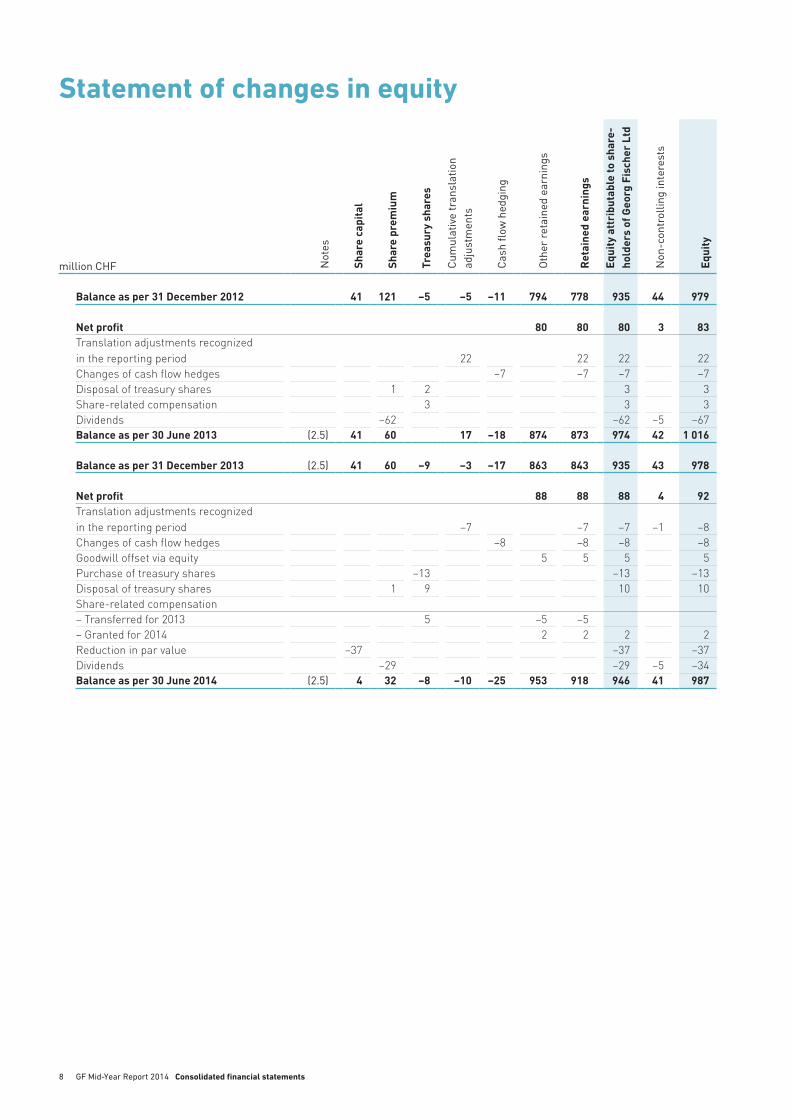
Statement of changes in equity
million CHF Not
es
Shar
e ca
pita
l
Shar
e pr
emiu
m
Trea
sury
sha
res
Cum
ulat
ive
tran
slat
ion
ad
just
men
ts
Cas
h flo
w h
edgi
ng
Oth
er r
etai
ned
earn
ings
Ret
aine
d ea
rnin
gs
Equi
ty a
ttri
buta
ble
to s
hare
- ho
lder
s of
Geo
rg F
isch
er L
td
Non
-con
trol
ling
inte
rest
s
Equi
ty
Balance as per 31 December 2012 41 121 –5 –5 –11 794 778 935 44 979
Net profit 80 80 80 3 83Translation adjustments recognized in the reporting period 22 22 22 22Changes of cash flow hedges –7 –7 –7 –7Disposal of treasury shares 1 2 3 3Share-related compensation 3 3 3Dividends –62 –62 –5 –67Balance as per 30 June 2013 (2.5) 41 60 17 –18 874 873 974 42 1 016
Balance as per 31 December 2013 (2.5) 41 60 –9 –3 –17 863 843 935 43 978
Net profit 88 88 88 4 92Translation adjustments recognized in the reporting period –7 –7 –7 –1 –8Changes of cash flow hedges –8 –8 –8 –8Goodwill offset via equity 5 5 5 5Purchase of treasury shares –13 –13 –13Disposal of treasury shares 1 9 10 10Share-related compensation– Transferred for 2013 5 –5 –5– Granted for 2014 2 2 2 2Reduction in par value –37 –37 –37Dividends –29 –29 –5 –34Balance as per 30 June 2014 (2.5) 4 32 –8 –10 –25 953 918 946 41 987
GF Mid-Year Report 2014 Consolidated financial statements
04_gf_hjb-2014_Inhalt_en.indd 8 14.07.2014 10:23:15
9
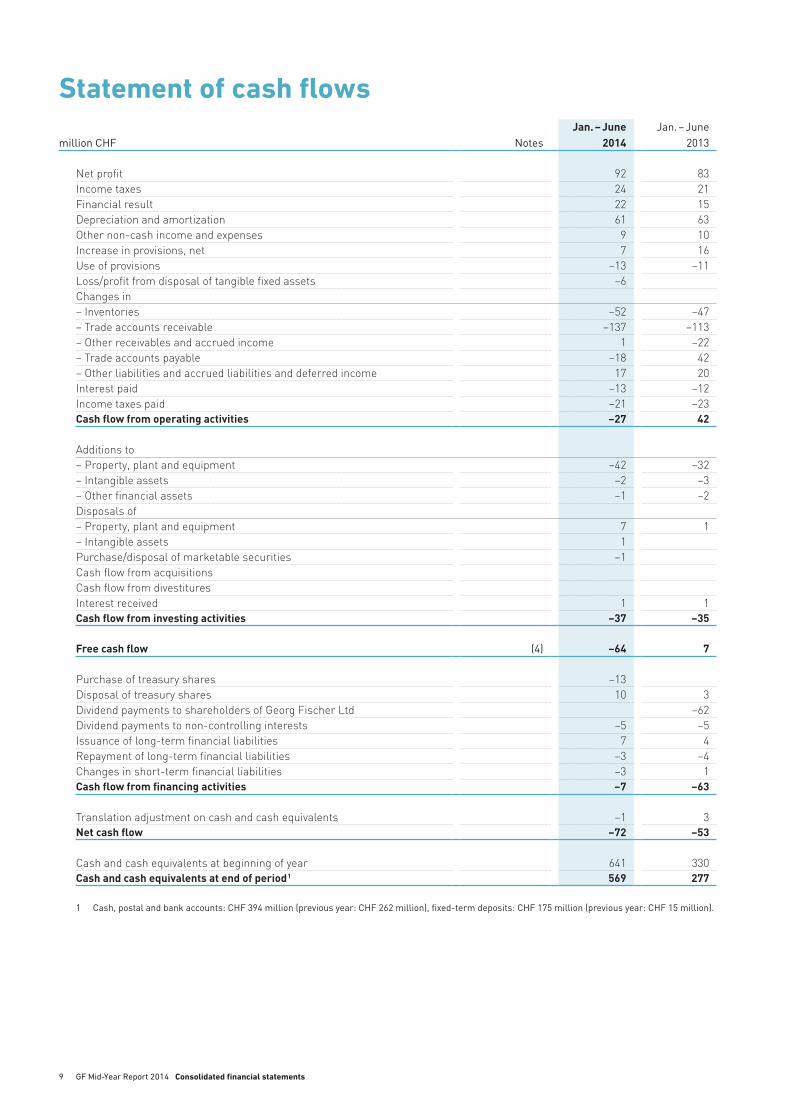
Statement of cash flows
million CHF NotesJan. – June
2014Jan. – June
2013
Net profit 92 83Income taxes 24 21Financial result 22 15Depreciation and amortization 61 63Other non-cash income and expenses 9 10Increase in provisions, net 7 16Use of provisions –13 –11Loss/profit from disposal of tangible fixed assets –6 Changes in– Inventories –52 –47– Trade accounts receivable –137 –113– Other receivables and accrued income 1 –22– Trade accounts payable –18 42– Other liabilities and accrued liabilities and deferred income 17 20Interest paid –13 –12Income taxes paid –21 –23Cash flow from operating activities –27 42
Additions to– Property, plant and equipment –42 –32– Intangible assets –2 –3– Other financial assets –1 –2Disposals of– Property, plant and equipment 7 1– Intangible assets 1 Purchase/disposal of marketable securities –1 Cash flow from acquisitions Cash flow from divestitures Interest received 1 1Cash flow from investing activities –37 –35
Free cash flow (4) –64 7
Purchase of treasury shares –13 Disposal of treasury shares 10 3Dividend payments to shareholders of Georg Fischer Ltd –62Dividend payments to non-controlling interests –5 –5Issuance of long-term financial liabilities 7 4Repayment of long-term financial liabilities –3 –4Changes in short-term financial liabilities –3 1Cash flow from financing activities –7 –63
Translation adjustment on cash and cash equivalents –1 3Net cash flow –72 –53
Cash and cash equivalents at beginning of year 641 330Cash and cash equivalents at end of period1 569 277
1 Cash, postal and bank accounts: CHF 394 million (previous year: CHF 262 million), fixed-term deposits: CHF 175 million (previous year: CHF 15 million).
GF Mid-Year Report 2014 Consolidated financial statements
04_gf_hjb-2014_Inhalt_en.indd 9 14.07.2014 10:23:16
10
You can counton us
GF Mid-Year Report 2014 Consolidated financial statements
04_gf_hjb-2014_Inhalt_en.indd 10 14.07.2014 10:23:19
11
Corporate accounting principles Basis of preparation of the consolidated interim financial statementsAccounting principles // The consolidated interim and annual financial statements are prepared in accordance with the entire
existing guidelines of Swiss GAAP FER (Generally Accepted Accounting Principles/FER = Fachempfehlung zur Rechnungs-
legung). The regulations of Swiss GAAP FER 31 “Complementary Recommendation for Listed Public Companies” have been early
adopted. Furthermore, the accounting complies with the provisions of the listing rules of the SIX Swiss Exchange and with
Swiss company law.
The consolidated financial statements are based on the financial statements of the Corporate Companies prepared in accord-
ance with the uniform corporate accounting principles. Since the consolidated interim financial statements do not include all the
information contained in the consolidated annual financial statements, they should be read in conjunction with the consolidated fi-
nancial statements for the year ended 31 December 2013.
The consolidated interim financial statements cover the period from 1 January 2014 to 30 June 2014 (hereinafter “period
under review”) and were approved for issue by the Board of Directors on 11 July 2014.
Consolidation // The consolidated interim financial statements are those of Georg Fischer Ltd and all Swiss and foreign Corpo-
rate Companies in which it holds – either directly or indirectly – more than 50% of the voting rights or for which it has opera-
tional and financial management power. Those entities are fully consolidated. Joint ventures in which the GF Corporation has
a direct or indirect interest of 50%, or where the GF Corporation exercises joint control, are included in the consolidated finan-
cial statements using the proportionate consolidation method. Investments in associates in which the GF Corporation has
a non-controlling interest of at least 20% but less than 50% or over which it otherwise has significant influence, are included
in the consolidated financial statements using the equity method of accounting. Investments with a voting power of less than
20% are stated at fair value and presented under other financial assets.
The preparation of the consolidated interim financial statements requires management to make estimates and assumptions
that affect the reported amounts of revenues, expenses, assets, liabilities, and disclosure of contingent liabilities at the closing
date of the consolidated interim financial statements. If in future such estimates and assumptions, which are based on man-
agement’s best judgment at the date of the consolidated interim financial statements, deviate from the actual circumstances,
the original estimates and assumptions will be modified as appropriate in the reporting period in which the circumstances
change. In the consolidated interim financial statements, management made no new assumptions or estimates compared
with the consolidated financial statements as at 31 December 2013.
Income tax expense is recognized based upon the best estimate of the weighted average annual income tax rate expected for
the full financial year.
GF Mid-Year Report 2014 Consolidated financial statements
04_gf_hjb-2014_Inhalt_en.indd 11 14.07.2014 10:23:20
12
Notes to the consolidated interim financial statements
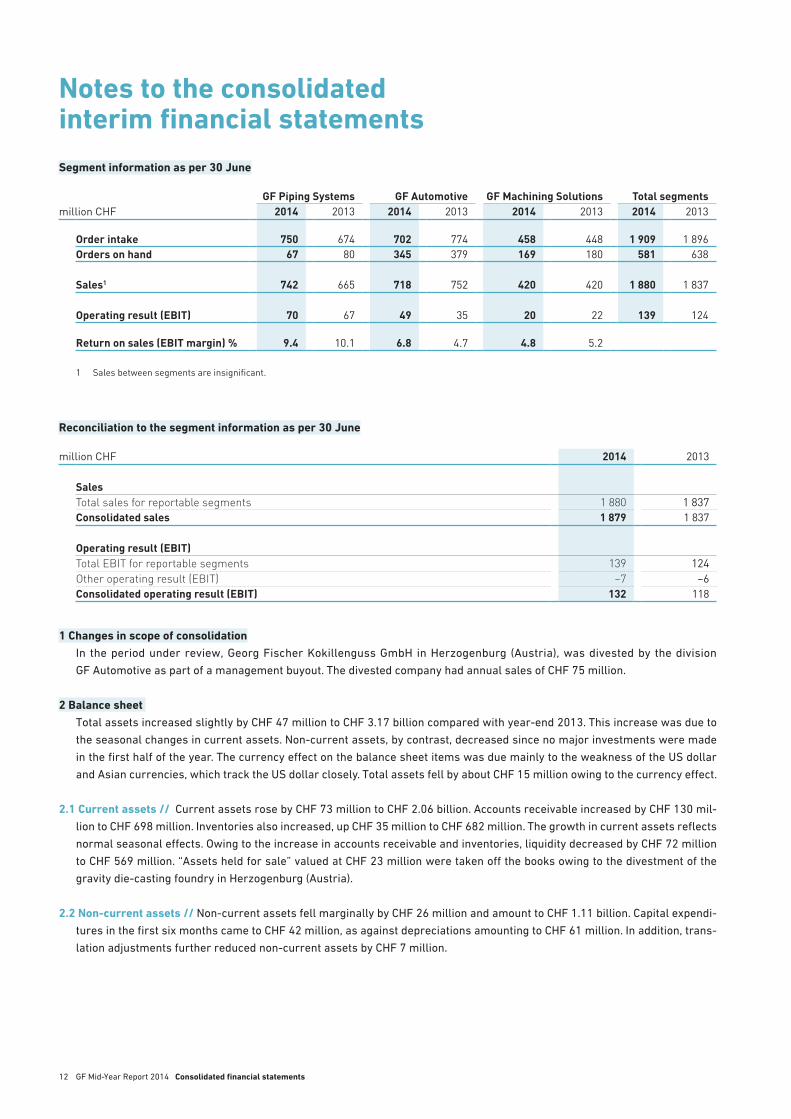
Segment information as per 30 June
GF Piping Systems GF Automotive GF Machining Solutions Total segmentsmillion CHF 2014 2013 2014 2013 2014 2013 2014 2013
Order intake 750 674 702 774 458 448 1 909 1 896Orders on hand 67 80 345 379 169 180 581 638
Sales1 742 665 718 752 420 420 1 880 1 837
Operating result (EBIT) 70 67 49 35 20 22 139 124 Return on sales (EBIT margin) % 9.4 10.1 6.8 4.7 4.8 5.2
1 Sales between segments are insignificant.
Reconciliation to the segment information as per 30 June
million CHF 2014 2013
SalesTotal sales for reportable segments 1 880 1 837Consolidated sales 1 879 1 837
Operating result (EBIT)Total EBIT for reportable segments 139 124Other operating result (EBIT) –7 –6Consolidated operating result (EBIT) 132 118
1 Changes in scope of consolidationIn the period under review, Georg Fischer Kokillenguss GmbH in Herzogenburg (Austria), was divested by the division
GF Automotive as part of a management buyout. The divested company had annual sales of CHF 75 million.
2 Balance sheet Total assets increased slightly by CHF 47 million to CHF 3.17 billion compared with year-end 2013. This increase was due to
the seasonal changes in current assets. Non-current assets, by contrast, decreased since no major investments were made
in the first half of the year. The currency effect on the balance sheet items was due mainly to the weakness of the US dollar
and Asian currencies, which track the US dollar closely. Total assets fell by about CHF 15 million owing to the currency effect.
2.1 Current assets // Current assets rose by CHF 73 million to CHF 2.06 billion. Accounts receivable increased by CHF 130 mil-
lion to CHF 698 million. Inventories also increased, up CHF 35 million to CHF 682 million. The growth in current assets reflects
normal seasonal effects. Owing to the increase in accounts receivable and inventories, liquidity decreased by CHF 72 million
to CHF 569 million. “Assets held for sale” valued at CHF 23 million were taken off the books owing to the divestment of the
gravity die-casting foundry in Herzogenburg (Austria).
2.2 Non-current assets // Non-current assets fell marginally by CHF 26 million and amount to CHF 1.11 billion. Capital expendi-
tures in the first six months came to CHF 42 million, as against depreciations amounting to CHF 61 million. In addition, trans-
lation adjustments further reduced non-current assets by CHF 7 million.
GF Mid-Year Report 2014 Consolidated financial statements
04_gf_hjb-2014_Inhalt_en.indd 12 14.07.2014 10:23:20
13
2.3 Liabilities // Liabilities rose by CHF 38 million to CHF 2.19 billion. The increase was due entirely to the change in current li-
abilities. Accounts payable decreased by CHF 24 million for seasonal reasons. By contrast, other current liabilities increased
by CHF 77 million. The increase is due to the transfer of the dividend and the par value reduction from equity in the amount of
CHF 66 million. Non-current liabilities remained virtually on previous years’ level with CHF 869 million.
2.4 Financing // No significant financing transactions were conducted in the period under review. The syndicated loan for
CHF 250 million is still unused but guarantees the necessary flexibility in the event of any future acquisitions. The next major
maturity is the repayment of the 4.5% bond 2009–2014 for CHF 300 million, which falls due in September 2014. This bond was
already refinanced in September 2013 by two bonds, each for CHF 150 million and with maturities of five and nine years
respectively.
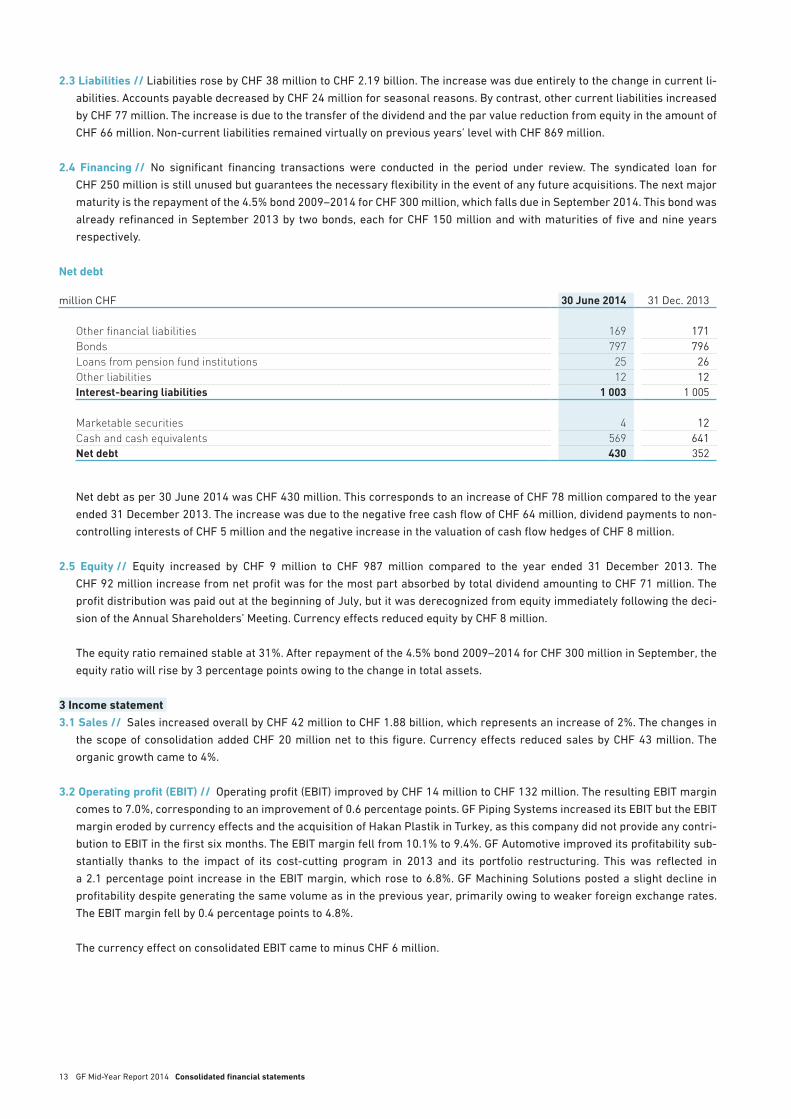
Net debt
million CHF 30 June 2014 31 Dec. 2013
Other financial liabilities 169 171Bonds 797 796Loans from pension fund institutions 25 26Other liabilities 12 12Interest-bearing liabilities 1 003 1 005
Marketable securities 4 12Cash and cash equivalents 569 641Net debt 430 352
Net debt as per 30 June 2014 was CHF 430 million. This corresponds to an increase of CHF 78 million compared to the year
ended 31 December 2013. The increase was due to the negative free cash flow of CHF 64 million, dividend payments to non-
controlling interests of CHF 5 million and the negative increase in the valuation of cash flow hedges of CHF 8 million.
2.5 Equity // Equity increased by CHF 9 million to CHF 987 million compared to the year ended 31 December 2013. The
CHF 92 million increase from net profit was for the most part absorbed by total dividend amounting to CHF 71 million. The
profit distribution was paid out at the beginning of July, but it was derecognized from equity immediately following the deci-
sion of the Annual Shareholders’ Meeting. Currency effects reduced equity by CHF 8 million.
The equity ratio remained stable at 31%. After repayment of the 4.5% bond 2009–2014 for CHF 300 million in September, the
equity ratio will rise by 3 percentage points owing to the change in total assets.
3 Income statement 3.1 Sales // Sales increased overall by CHF 42 million to CHF 1.88 billion, which represents an increase of 2%. The changes in
the scope of consolidation added CHF 20 million net to this figure. Currency effects reduced sales by CHF 43 million. The
organic growth came to 4%.
3.2 Operating profit (EBIT) // Operating profit (EBIT) improved by CHF 14 million to CHF 132 million. The resulting EBIT margin
comes to 7.0%, corresponding to an improvement of 0.6 percentage points. GF Piping Systems increased its EBIT but the EBIT
margin eroded by currency effects and the acquisition of Hakan Plastik in Turkey, as this company did not provide any contri-
bution to EBIT in the first six months. The EBIT margin fell from 10.1% to 9.4%. GF Automotive improved its profitability sub-
stantially thanks to the impact of its cost-cutting program in 2013 and its portfolio restructuring. This was reflected in
a 2.1 percentage point increase in the EBIT margin, which rose to 6.8%. GF Machining Solutions posted a slight decline in
profitability despite generating the same volume as in the previous year, primarily owing to weaker foreign exchange rates.
The EBIT margin fell by 0.4 percentage points to 4.8%.
The currency effect on consolidated EBIT came to minus CHF 6 million.
GF Mid-Year Report 2014 Consolidated financial statements
04_gf_hjb-2014_Inhalt_en.indd 13 14.07.2014 10:23:20
14
3.3 Financial result and taxes // Interest expense came to CHF 20 million, exceeding previous years’ figure by CHF 4 million.
This was attributable almost exclusively to the early refinancing of the 4.5% bond of CHF 300 million.
The “non-operating result” contains profit of about CHF 6 million from the sale of an investment property.
As expected, the tax rate rose again slightly to 21%. Taxes came to CHF 24 million.
3.4 Net profit and earnings per share // The Corporation increased net profit by CHF 9 million to CHF 92 million. Earnings per
share improved by CHF 2 to CHF 22.
4 Free cash flow Free cash flow came to minus CHF 64 million. A significant negative free cash flow at the end of the first half is not unusual
due to the high seasonal demand of funds.
Investments in property, plant and equipment were a relatively low CHF 42 million in the first six-month period. Anticipated
investments for the full year will come to CHF 150 to 160 million.
5 Events after the balance sheet dateThere were no events between 30 June 2014 and 11 July 2014 that would require an adjustment to the carrying amounts of
assets and liabilities or need to be disclosed under this heading.
Two acquisitions were made and disclosed after the balance sheet date. On 4 July, GF announced the takeover of Liechti Engi-
neering AG, in Langnau (Switzerland). This company produces milling machines for machining turbine blades that are used in
the aerospace and energy industries. It posted sales of about CHF 50 million in 2013. Liechti Engineering AG will be integrated
into the division GF Machining Solutions.
On 9 July, GF disclosed the acquisition of a 51% stake in Meco Eckel GmbH & Co. KG, in Biedenkopf-Wallau (Germany). Meco
Eckel makes molds for aluminum pressure die-casting. Mold-making is a crucial component of the know-how needed for
manufacturing pressure die-casting parts. Meco Eckel reported sales of about CHF 40 million in 2013. The company will be
integrated into the division GF Automotive. The transaction requires the approval of Germany’s antitrust authorities before it
can be closed.
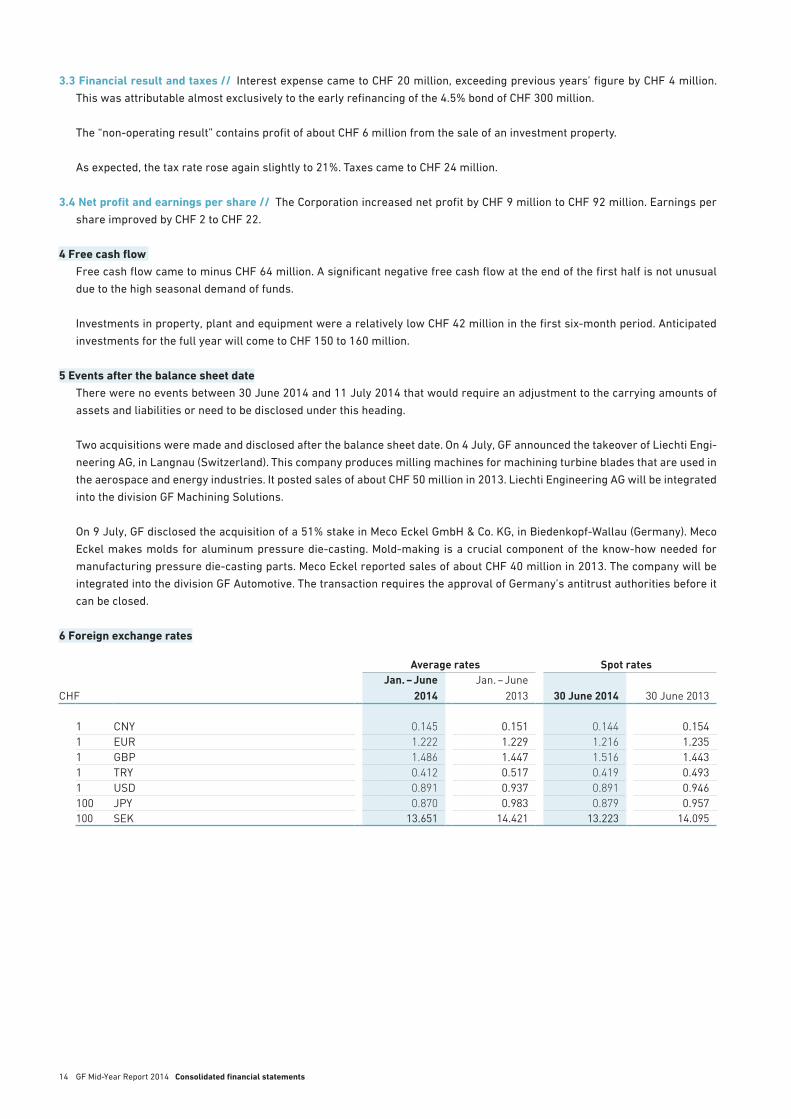
6 Foreign exchange rates
Average rates Spot rates
CHFJan. – June
2014Jan. – June
2013 30 June 2014 30 June 2013
1 CNY 0.145 0.151 0.144 0.1541 EUR 1.222 1.229 1.216 1.2351 GBP 1.486 1.447 1.516 1.4431 TRY 0.412 0.517 0.419 0.4931 USD 0.891 0.937 0.891 0.946100 JPY 0.870 0.983 0.879 0.957100 SEK 13.651 14.421 13.223 14.095
GF Mid-Year Report 2014 Consolidated financial statements
04_gf_hjb-2014_Inhalt_en.indd 14 14.07.2014 10:23:21
15
24 February // Publication of Annual Report 2014, Media and Financial Analysts’ Conference
18 March // Shareholders’ Meeting for fiscal year 2014
17 July // Publication of Mid-Year Report 2015
2015
Save the date
Investor RelationsDaniel BösigerPhone: +41 (0) 52 631 21 12
Fax: +41 (0) 52 631 28 16
Corporate CommunicationsBeat RömerPhone: +41 (0) 52 631 26 77
Fax: +41 (0) 52 631 28 63
DisclaimerThe statements in this publication relating to matters that are not historical facts are forward-looking statements that are not guarantees of future performance and involve risks, uncertainties and other factors beyond the control of the company.
The Mid-Year Report 2014 of Georg Fischer Ltd is also available in German. In the event of any discrepancy, the German version shall prevail.
Cover and page 10: employees of Georg Fischer Ltd
Publisher’s informationPublished by: Georg Fischer Ltd Edited by: Georg Fischer Ltd, Corporate Development Publishing System: ns.publish by Multimedia Solutions AGDesigned by: Markenfels AG Photos by: Nik Hunger, Marinus Van Breugel Translation: BMP Translations AG Printed by: Neidhart + Schön AG
GF Mid-Year Report 2014 Save the date
01_gf_hjr_2014_Disclaimer_en.indd 15 14.07.2014 10:23:55
7006
7158
8
Georg Fischer Ltd
Amsler-Laffon-Strasse 9
8201 Schaffhausen
Switzerland
Phone: +41 (0) 52 631 11 11
www.georgfischer.com
00_gf_hjb-2014_Cover_en.indd 1 14.07.2014 10:24:10


